john c. stennis space center - nasa · john c. stennis space center diversity and ... being among...
TRANSCRIPT
National Aeronautics and Space Administration
John C. Stennis Space Center
Diversity and Inclusion Focus Group Process Report
Prepared for the Office of Diversity and Equal
Opportunity by Curtis Lewis & Associates October 2012
1
TABLE OF CONTENTS
EXECUTIVE SUMMARY 3
I. INTRODUCTION & OVERVIEW OF FOCUS GROUP THEMES 4 Theme One – The Difficulty of Addressing the Resistance to Changing Operations 5 Theme Two – The Lack of Human Resource Management Skill of Some Leaders/Managers/Supervisors 6 Theme Three – The Role and Impact of Training Generally and the Lack of Distinction between “Training” and “Education for Professional Development” 6 Interpretation/Implication 7
II. RECOMMENDATIONS FOR NEXT STEPS 9 Combat the Tendency to Maintain the Status Quo in Light of Being among the Best in D&I 9 Develop Effective Human Resources Management Skills across the Leadership Spectrum 10 Strengthen D&I Professional Development Education and Distinguish It from Technical Training 10 Summary 13
III. DIAS AND FOCUS GROUP RECOMMENDATIONS THAT ADVANCE DEVELOPING A D&I IMPLEMENTATION PLAN 14 Table 1 – Summary of Westat Recommendations for Developing Action a Stennis Space Center (SSC) Plan by Research Question 14 Table 2 – SSC Bottom 10% Positive Survey Items 15 Table 3 – Number of Items with Notable Demographic Differences 16 Research Question One: Do employees at NASA understand Diversity & Inclusion and their benefits? 18 Research Question Two: What are employees’ perceptions regarding the culture of diversity and inclusion at NASA? 20 Research Question Three: How do employees perceive their own experience at NASA? 25 Research Question Four: How aware are employees of NASA policies and initiatives to promote diversity and inclusion? 26
2
Research Question Five: How effective do employees think NASA has been overall in creating a diverse and inclusive work environment? 27 Table 4 – Map of DIAS Research Questions, Focus Group Themes, Recommendations and Alignment with ODEO D&I Strategic Implementation Principles 28
IV. CONCLUSION 30 Appendix A – Focus Group Strategy and Protocol 31
The Focus Group Strategy 31
The Protocol 33
Appendix B – The Focus Group Schedule 35

EXECUTIVE SUMMARY
This report summarizes the findings from the focus groups that were conducted in August 2012 and draws recommendations from those observations for leaders at the John C. Stennis Space Center (SSC) to use in developing the Center’s Diversity and Inclusion Implementation Plan. The report also identifies the areas of the quantitative analysis that were singled out in the Agency’s Diversity & Inclusion Assessment Survey (DIAS) as areas for future focus. Observations from the focus group were then connected with the areas identified in the DIAS for future focus.
The quantitative data from the DIAS report was used to design the focus group protocol and explore as many of the areas for future focus as possible in the time allotted for the focus groups. Employees agree that they take pride in working for NASA and being a part of the SSC community. In addition, external measures indicate that the Center is ahead of the curve with regard to diversity and inclusion understanding and among the best places in government to work.
This report describes three themes that came from the focus groups. These themes relate to:
1. the difficulty of addressing resistance to change for improvement when positive perceptions of the Center’s D&I efforts are ahead of the overall NASA curve
2. the lack of some leaders/managers/supervisors skill in human resource management; and 3. the role and impact of training generally and the lack of distinction between “training” and
“education for professional development.”
These three themes illuminate the dimensions of the environment that can contribute to or create barriers to developing an SSC Diversity and Inclusion (D&I) Implementation Plan that is effective in establishing a culture where diversity and inclusion become critical assets to SSC mission excellence.
The Recommendations provided in this report tie to the three themes revealed from the focus groups and address combating the force to sustain the status quo; enhancing the skills of leaders to manage the Center’s human resources effectively; and enhancing training and education for professional development and making clear distinctions between these types of employee knowledge development. The report also provides a link between these thematic recommendations; the SSC DIAS research questions and resulting areas of recommended action; and the Principles from the NASA Strategic Implementation Plan and the NASA Plan of Action. The Recommendations section offers the SSC community a coherent description of the areas for enhancement and specific recommendations for consideration as it develops its D&I Implementation Plan.
4
I. INTRODUCTION AND OVERVIEW OF FOCUS GROUP THEMES
INTRODUCTION
This Report is divided into three sections: the Introduction and Overview of Focus Group Observations; a set of Recommendations for Next Steps; and Guidance to assist in Developing a Diversity and Inclusion (D&I) Implementation Plan based on the Diversity and Inclusion Assessment Survey (DIAS) and Focus Group data.
This Introduction describes certain cultural realities that are part of the SSC work environment and the challenges that were first identified in the DIAS data and further explored as part of the focus group process.
The Overview of Focus Group Observations highlights three themes that emerged from the interviews:
1. the difficulty of addressing the resistance to changing operations i.e., maintaining “the way we do things here” when positive perceptions of the Center’s D&I efforts are ahead of the overall NASA curve ;
2. the lack of skill in human resource management of some leaders/managers/supervisors ; and
3. the role and impact of training generally and the lack of distinction between “training” and “education for professional development.”
These themes highlight the dimensions of the environment that can contribute to or create barriers to an efficient process of developing an SSC Diversity and Inclusion (D&I) Implementation Plan that successfully establishes a culture in which diversity and inclusion are critical assets to SSC achieving mission success, and a plan that aligns with the Agency‐wide Diversity and Inclusion Strategic Implementation Plan.
The Next Steps Recommendations are organized into three categories that parallel the three themes identified in the Overview of Focus Group Observations.
The final section presents an analysis of survey items that will guide leaders in developing the D&I Implementation Plan for the Center. This narrative also links the DIAS results to focus group observations and provides the rationale for the recommendations made. The entire set of charts presented draw on areas that the SSC DIAS Report identified as areas of opportunity or consideration for improvement. They also highlight any Notable Demographic Differences (NDDs) uncovered in the results. These are highlighted so that senior leaders and employees can attend to these differences as they develop the Center’s plan.
In addition, this report has two appendices. The Focus Group Strategy and Protocol (Appendix A) guided the work of the three‐day visit to SSC. Appendix B also includes a table that outlines the schedule and groups interviewed. Appendix B provides a demographic breakdown of the Focus Group participants.
OVERVIEW OF THE FOCUS GROUP THEMES
Cultural Realities: The Challenges of Going from Great to Excellent
SSC senior leadership is justifiably proud of having the highest rate of response among all of the NASA Centers to the Diversity and Inclusion Assessment Survey (DIAS)—one indicator of employee engagement. In addition, SSC employees responded more positively to the DIAS items than the overall NASA population. Moreover, SSC had the highest ranking among ten NASA Centers in Partnership for Public Service’s Best
5
Places to Work Survey in which the Agency ranked number five overall. This is great news for SSC. But these accolades may create difficulty for advocates to make the case that changes are needed to establish effective diversity and inclusion practices as essential elements to achieving mission success at the Center and throughout NASA.
In other words, the status of being among the best can be a double‐edged sword. On one side it can provide a morale boost and incentive to perform at a high level and create euphoria—“we’re great.” On the other side, it can signal to some that the mission has been accomplished, which can lead to complacency. Data from the DIAS and the focus groups indicate that there is still much work to be done. The status of being held in such high regard may ultimately hinder SSC’s efforts to establish an appropriate and effective D&I Implementation Plan. Additionally, these accolades may work against efforts to improve innovation, creativity and productivity because some leadership and team members may believe erroneously that the diversity and inclusion journey is complete and fail to recognize the need to utilize the unique talents that each member of the Center’s workforce can contribute to achieve mission excellence.
The challenge is to reconcile these seemingly inconsistent messages the workforce receives—on the one hand the Center is among the best at D&I, on the other the Center’s D&I efforts need to be strengthened. Employees at all levels will need help in understanding that the Center is at its best when everyone is engaged and working toward being excellent in all they do to achieve NASA mission success.
Employees noted former Center Director Patrick Scheuermann’s very strong emphasis on maintaining an open door policy and creating opportunities for employees at various levels to present their good ideas to senior leadership to motivate high engagement and performance. Employees commented positively on the Director’s policy of openness. Several employee groups also reported that they were given opportunities within their various workgroups to offer feedback about day‐to‐day processes and provide input about critical new projects. Several employee groups reported that they made formal or informal presentations to Center leadership and to their work groups. Employees in some areas felt that their perspectives were seriously considered and often used to improve operations. Yet, we also heard that thoughtfully presented analyses, new ideas, and feedback about projected plans from employees were dismissed in favor of familiar voices and/or familiar action. Many employees’ perceived that their ideas were rejected because they were not presented by a favored person or because it went against the “way we do things here.” Some leaders proposed that some ideas were rejected because the ideas simply were not good.
These perceptions are reflected in the consistent pattern of notable demographic differences (NDDs) between supervisory (leadership) and non‐supervisory employees in the Center’s DIAS data as well as in overall NASA data. The supervisory employees are generally more positive about diversity and inclusion issues than those in non‐supervisory roles. This is not to suggest that all supervisory employees long for “the good old days.” Rather, the point is that the status of being highly regarded positively influences perceptions about the true state of affairs depending on one’s status in the organization.
Theme One. The narrative above describes the underlying elements of the first theme—to move from already being highly regarded to being excellent is difficult because it requires that the forces to maintain the status quo be critically and productively examined and that these forces be efficiently and genuinely combated when necessary. That is not to suggest change for change’s sake, but rather that it is crucial that a clear understanding be established that increased creativity, innovation and productivity rely on meaningfully engaging all of the talent in the organization.
Employees expressed a very positive view of the workplace. Many interviewees attributed their positive attitude to the pride they have in being employed by NASA, in the work they do, and in the generally good
6
working conditions. Given the nature of the work at SSC it is clear why high operational standards are necessary to enforce. However some employees indicated that some standards are overly cumbersome, create barriers to productivity, and take time away from their specific work requirements. Most employees agreed that rigid standards are needed in areas such as testing, security and safety. Yet they generally viewed this training as repetitive and limited in offering additional knowledge.
Some employees also felt that their ideas were solicited, but nothing really happened with them or they were overridden by more senior/familiar personnel. The challenge is to maintain a balance of high standards in every aspect of Center operation without succumbing to groupthink, and simultaneously fostering employee input about process standards that could improve productivity, creativity and innovation.
Theme Two. Focusing purely on the technical aspects of mission success can be a powerful force on an organization to maintain the status quo. Yet such a focus ignores that getting an excellent product always has a human element that has some level of intrinsic motivation to perform at their best. However, when they perceive that their contributions to an effort do not matter to the outcome, their level of motivation and effort may likely reduce. This requires that supervisory employees be especially skilled in cultivating employees’ natural tendencies to perform and take appropriate and effective corrective action when employees do not respond. Thus theme two is characterized as some supervisory employees’ perceived inability to manage this human resource element of the Center’s work.
Most focus group participants felt that they and their supervisor/manager work well together as a team to get the job done. Yet several spoke of long‐term managers/supervisors who lack the necessary interpersonal and management skills to motivate and lead change that they perceive could result in a more inclusive and productive workplace. Yet, other employees commented that some supervisory employees are allowed to deal with their employees unproductively , and do so without repercussions. In some cases these leaders were reportedly rewarded in spite of their lack of interpersonal and workforce management skills. Comments by employees indicated a range of supervisory employee ability in interpersonal and management skill level ranging from excellent to “bullies” in managing the Center’s human resources. However, such variability can work to undermine efforts to achieve excellence in all areas of operations, especially as leaders help employees better understand the NASA “big picture” and the role of D&I in that picture, as well as the individual and Center’s role in NASA mission success.
Theme Three. Although many of the focus group participants could articulate a broad definition of diversity and inclusion, many could not articulate the value and benefits to NASA of inclusive practices that engage the diverse workforce to achieve greater productivity outcomes. These responses are consistent with the Center and overall NASA DIAS data. When asked about the effectiveness of diversity and inclusion training, many employees had to think for a while before responding. So we asked about their training in general. Many focus group participants then talked about safety and security training and being beleaguered by the number of those and other surveys required to be completed on SATERN. For example, those trainings are designed to ensure that employees understand security and safety procedures. The equal employment opportunity (EEO) training that they receive in the System for Administration, Training, and Educational Resources (SATERN) is focused on non‐discrimination, no‐fear, and anti‐harassment policies. Employees perceive this training as diversity and inclusion “training.” Understanding the elements of EEO policies is not the same as facilitating the kind of education and professional development that Center employees need about how to harness the diverse skills and talents of their colleagues for creative, innovative and productive ends. However, we believe participants initially equated these because they experience more of the EEO training than real engagement with diversity and inclusion practice. For this theme, the challenge

7
will be in making clear distinctions between EEO—and other policy/technical—skill development training and education for intercultural, interpersonal and professional skill development.
Training for policy and operational skill development is focused on having everyone respond similarly to the same or similar situations, such as knowing where the exits are when an accident occurs or how to ensure that test facilities are secure. Education for professional development requires more nuanced and varied approaches—particularly around intercultural, interpersonal and team management skills; and especially around developing a deep understanding of how to harness diversity and developing inclusive practices for mission success.
To begin work toward distinguishing EEO training with professional development education, we asked employees to describe what ongoing efforts and initiatives are underway at the Center in the area of diversity and inclusion (D&I). Some employees identified D&I events (e.g., cultural heritage celebrations), and articulated some learning from them. However, most interviewees had not attended any of the events. Employees as a whole reported little or no real impact from these events. These events serve the useful function of introducing the workforce to the rich cultures represented within the Center and the nation. However, to harness the value of a diverse workforce requires moving beyond cultural food tours and racial /ethnic/gender/gay pride celebrations to more enriching professional development for all employees and especially for supervisory employees.
To summarize the themes: (1) SSC’s perceived status in the area of diversity and inclusion, and as a good employer generally, will reinforce the tendency of good and great organizations to maintain the status quo, making it more difficult to convince employees, especially leaders, that improvement is needed; (2) some among the leadership lack critical team management, as well as human resources and interpersonal skills to lead change efforts; and (3) there is a generally unfavorable view of non‐job specific (including EEO) training and these types of trainings are confused with professional development education designed to harness the value of a diverse workforce. These themes indicate underlying challenges that will hinder efforts to move SSC from being among the best in their D&I journey to being excellent in harnessing the promise of greater creativity, innovation and productively that can be derived from a diverse workforce and a workplace where all employees feel valued and included.
INTERPRETATION/IMPLICATIONS
The focus group sessions revealed that employees enjoy working at NASA and other data strongly support this. Employees also understand the meaning of diversity and inclusion and demonstrated this by articulating definitions that are consistent with that of the Agency. However, examples of how diversity and inclusive practices are used to engage employees to achieve productivity gains were much less prevalent.
During the team’s initial call with the Director, he expressed a deep understanding of the psychological cost to employees of turnover at the Director level. It was apparent that he worked diligently to engage employees deeply in the mission of the Center. He did this by making it clear that high quality work must be sustained by every employee regardless of who is at the helm. In spite of the Director’s strong efforts to engage employees, to some degree those efforts are undermined by the lack of interpersonal skill on the part of some supervisory employees. For employees to own the work fully they need to perceive (not just be told) that their contributions make a difference to the bottom line of the Center’s work. When thoughtful ideas and constructive feedback about processes are met with strong resistance, the Director’s message of openness is lost because employees’ day‐to‐day experience demonstrates that their contributions are not valued or taken seriously. This is not to suggest that this behavior is pervasive. Instead we hope to communicate that even limited degrees of groupthink and personal disincentives in any
8
area can create a discouraging or even hostile environment, provoke minimal employee work output, and/or trigger costly turnover.
The Center’s Diversity and Inclusion Assessment Survey (DIAS) results, discussed later in this report, demonstrate that there are many notable demographic differences regarding employee perceptions of being able to engage in the workplace and being respected for the value they bring to the enterprise. The DIAS data and the focus group observations underscore the importance of taking a critical look at the technical training offered to ensure that it has added value to employees’ knowledge of the issues covered. Additionally, technical training should distinguish clearly from the deeper level professional development education required to establish a diverse and inclusive workplace. This education is particularly important for those who supervise and lead teams and functional areas. For employees to perform at the very highest levels, their leaders must be technically skilled but also skilled at managing human resources—including managing conflict; understanding how to promote critical, creative and innovative thinking and action; and motivating employees to strive for excellence in all they do.
Addressing these challenges enables leaders to seize the opportunities presented by a diverse and inclusive workplace; it helps leaders be able to manage its human resources more productively; and it provides appropriate education and training to achieve excellent performance consistently.
Attention to these themes and the data that support them are especially important in light of the recent SSC leadership turnover at the Director level. We are confident that the new Center Director, Richard J. Gilbrech, will continue the journey of establishing diversity and inclusion as key elements of achieving mission success because he, like his predecessor, recognizes their value to the work of the Center, the Agency and the nation. The following section provides guiding recommendations for next steps to address the challenges we have outlined.

9
II. RECOMMENDATIONS FOR NEXT STEPS
As noted in the previous section, three themes were observed in the focus groups that were also indicated in the DIAS data that offer a focus for the Center’s Diversity and Inclusion Implementation Plan (DIIP). This section offers guiding recommendations to address each of these themes by offering ways to: 1) combat the tendency of organizations viewed as among the best to maintain the status quo; 2) develop effective human resource management skills across the leadership spectrum of supervisory employees; and 3) distinguish and offer appropriate professional development education that helps all employees realize the promise of a diverse and inclusive workforce.
COMBAT THE TENDENCY TO MAINTAIN THE STATUS QUO IN LIGHT OF BEING AMONG THE BEST IN D&I
As mentioned previously, the former Director provided opportunities for employees to present good ideas to him directly and to the senior leadership. Many senior leaders followed suit and provided venues within their directorates to examine critical processes for the purpose of improvement. It seems clear that such actions helped establish a stable environment at the Center and employees took advantage of these opportunities. As such, if such safe spaces for critical feedback, input and review were established and made standard practice regardless of employees’ home directorate, each employee would have an opportunity to engage deeply in the work of the Center.
One difficulty with this recommendation is making such time available in the frenetic pace of work that employees already experience. If enacted this must be seen as an essential part of work, not as an addition to work. This requires that facilitators/leaders be thoughtful in structuring the agenda and the questions that are posed to ensure that they are related to critical work issues that the area faces. In this way employees understand that one must step back and reflect on both the challenges and successes of the work in order to be able to work toward excellence. Leaders must also be attentive to bringing a diverse group of people to the table and managing the discussion in ways that enable everyone there to have input. The discussion of theme three below provides more detail about how the Center leadership might go about developing leaders’ skills and implementing such a structure and process effectively.
In addition to the work group sessions indicated above, leaders should also consider other methods of giving constructive critical review of employee input and feedback such that these processes are used to advance employees’ technical and interpersonal capabilities. For example, creating a feedback loop to communicate to employees what happened to their feedback and ideas is as critical as establishing the process. Simply bringing people together to hear their ideas as a group may or may not advance a project’s success. But when employees are given feedback regarding if and how their input is used or not used, it advances employees’ learning and better ensures their engagement in the future. In other words, the engagement process should be a two‐way street— employees provide their creative, innovative ideas and leaders provide constructively critical feedback whether or not the idea is implemented. Such a feedback loop begins to create a sense of mutual respect and provides motivation for employees to continue to think innovatively about ways to improve processes and creatively about the shape of future projects.
This means that leaders must become more adept at appropriately assessing and rewarding both individual and team performance, while using these opportunities to challenge employee performance improvement by consistently asking the question—Can the work be done more efficiently and effectively and how? Then facilitate open discussion about their answers to this question, offering constructive and productive feedback about the usefulness of those answers, and rewarding those that lead to innovation or better processes.
10
Employees, and especially leadership, need to realize that perceptions of “things are just fine the way they are” run counter to the reality of increasing demographic shifts in the American workforce; of the increasing tendencies toward collaboration across Centers and among nations; and of the growing complexities in NASA’s overall mission and the specific mission of the Center. For example, an employee should no longer be able to boast that s/he is the only one able to do a certain job. Such a lack of cross functionality leaves the Center and NASA in a position of vulnerability should something happen to such a highly skilled employee (e.g., severe illness or an accident that incapacitates the employee). Instead Center leadership should consider ways in which knowledge is shared and skills are developed broadly such that no one employee is indispensable to a particular technical or administrative operation.
DEVELOP EFFECTIVE HUMAN RESOURCES MANAGEMENT SKILLS ACROSS THE LEADERSHIP SPECTRUM
Although this report focuses on diversity and inclusion (D&I) at SSC, we heard reports of behavior among the leadership that is counterproductive to all aspects of the Center’s functioning, not exclusively in D&I areas. This prompts us to lift up as a theme attention to the effective development of human resource management skills among the leadership. In addition to inadequate skill development we heard that the lack of these skills seem to be rewarded rather than holding people accountable for making changes. This was perceived as technical acumen trumping the management of the Center’s human capital successfully, which prompts us to discuss accountability as a lever to address the challenges that underlie this theme.
The Agency’s Office of Diversity and Equal Opportunity offers workshops that help build among the Center’s leadership skills around issues of diversity and inclusion, and more generically around conflict management and prevention. Additionally, the Office of Human Capital Management (OHCM) offers a variety of leadership development workshops. What was unclear is the extent to which these offerings are utilized by SSC leadership and whether the lessons learned in the sessions are actually put into practice in the workplace.
We recommend that senior leadership examine leadership practices to ensure that leadership across the Center not only possess the technical skills required to lead complex operations, but also possess the human management skills to help employees strive for excellence in everything they do. Inattentiveness to this challenge may have the consequence of employees feeling devalued at the very least or mistreated at worse. Even in the small case, such feelings have a negative effect on productivity and the Center’s bottom line. It may also have the effect of employees associating their treatment to social identity dimensions such as race, gender, sexual orientation, age, national origin or other salient characteristics that may or may not have anything to do with the leader’s behavior. That is, this lack of skill may be perceived as personal to the employee affected when in fact it is an appropriate behavior on the part of the leader. Such skills are absolutely necessary to productively manage a broadly diverse workforce. At a minimum, leaders at all levels should be accountable for attending conflict management and prevention sessions and be assessed as to whether they are implementing the aspects of such training effectively.
The director of the Center’s diversity and equal opportunity office, Joanne Larson, shared a set of sample events and actions for which a supervisor may be held accountable as part of his/her performance requirement. It is recommended that this be reviewed seriously and appropriate elements adapted and adopted so as to hold leaders accountable for establishing a diverse and inclusive environment at SSC.
STRENGTHEN D&I PROFESSIONAL DEVELOPMENT EDUCATION AND DISTINGUISH IT FROM TECHNICAL TRAINING
As mentioned, employees consistently reported being beleaguered by the number of surveys (frequently referred to as trainings) that they must complete on SATERN. More often than not they perceived online

11
EEO training as part of diversity and inclusion education efforts; although they are complementary in that they both have goals of raising human resource management awareness they are not the same. However, employees could not recall diversity and inclusion education beyond the various racial/ethnic, gender and gay pride celebrations that occur regularly. This strongly suggests that employees need more meaningful and more direct engagement with the broad diversity of the workforce in order to realize its benefits.
We offer three recommendations to address the challenges in this theme area –1) vary surveys that are repeated regularly with a new question or technical application; 2) engage workplace and D&I issues simultaneously; and 3) leadership modeling the behavior expected of all employees.
1) Vary frequent surveys with something specific to SSC. This first recommendation is to help employees better understand the purpose of technical surveys that are repeated frequently. Many employees remarked that most of the surveys required route responses because they were testing the same things every time and with the same questions in every administration; they complained that they did not take much thought to complete. If employees consider these surveys a check off, how might the Agency know if these enable employees can perform the actions covered in the survey when the time comes to use the knowledge the surveys test? Leaders might consider engaging small diverse groups of employees to explore how learning value might be added to the employees experience in completing these surveys. Leaders might work with those responsible for survey development in the Agency to be able to place at least one additional question to each survey that is specific to SSC and with each subsequent survey the question might differ from the previous survey. This would require employees to consider an aspect of the technical learning differently with each administration. The Center might also go beyond developing a series of questions to add to important surveys to offering a scenario that requires respondents to apply what they know to resolve successfully the technical/operational knowledge that the survey seeks to assess.
We assume that surveys intend to evaluate whether employees possess important knowledge. Consider means of adding importance to the learning by offering other types of professional development so that employees begin to view the knowledge in a larger context of the Center’s work and not merely something to “get out of the way.”
Making these surveys relevant to employees work should be applied to the EEO surveys as well. Consider developing and implementing a workshop that does a good job of laying side‐by‐side the goals for EEO training and that of D&I professional development education. Follow‐up with participants to foster broadening the reach of professional development such that both EEO and D&I practices are strengthened. These offerings could be done virtually as well as in person but should be facilitated by skilled and knowledgeable individuals. Without these professional development offerings, employees are unlikely to move beyond surface‐level understanding of EEO policies nor will they be likely to grasp the value of D&I to workplace productivity. If there is no movement toward a deeper understanding of D&I’s value, it is unlikely that the Center will derive the full creative and innovative potential of its talented workforce.
Lastly, these surveys should be made distinguishable from other, more intensive types of professional development education by consistently using the language that appropriately describes each. That is, technical training seeks to teach everyone to respond the same to a given situation or technical aspect of the work such as the procedure in case of an unsecured guest on the Center grounds. Professional development education seeks to develop critical thinking and understanding around a particular topic or develop a set of skills that help employees interact more effectively with others. However, both must be done well so they do not become so routinized that neither offers employees the stimulus to think about their actions critically.

12
The second and third recommendations relate to what senior leaders can do to establish a diverse and inclusive environment. Leaders need to support meaningful professional development education that simultaneously engages diversity and workplace issues and that require personal interaction with differences and similarities. Employee resource groups (ERGs) are one method of doing this. Lastly, employees need to observe good models of the kind of engagement with diversity and inclusion that demonstrates its value and benefit to the individuals engaged, to the Center, and to NASA. These are both professional development education activities as distinguished from technical training. 2) Engaging diversity and workplace issues simultaneously—the case for ERGs. ERGs can be a catalyst for ensuring an inclusive, open and productive workplace. ERGs can be established as places where employees’ good ideas are seriously heard, earnestly tweaked and developed. When employees understand these groups can be venues where their leadership and professional skills are developed and where they have access to successful leaders who effectively mentor them to thrive in the workplace, then the Center, the Agency and the ERG members reap the benefits.
In order to be truly effective for both the individuals involved and the Center, ERGs need to have committed employees who can work together with others to create a meaningful impact on the tasks of the workgroup, the workplace environment, and even the broader community in which the Center is located. Although ERGs are typically established at the grassroots level to serve the interests of those involved, such as SSC’s Young Professionals Group, encouragement and support by the Center leaders helps provide focus on the needs of the Center and the members/employees’ professional development needs. Working together to address the interests and objectives of the Center does not mean employees have to forgo their self‐interest; the aims of the ERG and those of the Center can and should always be mutually reinforcing.
Well‐structured ERGs that have senior leaders who are meaningfully involved can provide a pathway to leadership development for all engaged employees as well as a vehicle for employee personal professional growth and development. The Agency is interested in increasing the number and broadening the focus of ERGs because of their potential to assist the Agency in many ways.
3) Modeling expected behavior. Senior leaders might consider having one among them who has very good facilitation skills to engage a diverse team of supervisors, managers and leads in working together to examine an operational process that needs to be addressed and that also matters to the selected team members. This might appropriately be the person designated to lead the effort to develop the Diversity and Inclusion Implementation Plan for the Center (James Bevis) on behalf of Center Director, Richard J. Gilbrech. Or, it could be someone who is more technically focused, well respected and eager to cultivate SSC’s workforce to become the Agency leader in harnessing its diversity and inclusive practices as an advantage to mission success.
It is important that this team be developed intentionally for its diversity. The intentionality in creating this team should focus on the Agency’s broad definition of diversity (e.g., a reasoned mix of functional areas; members’ diverse points of view, unique skills and talents; as well as their cultural background and influences). It is also important to communicate explicitly to the team the rationale for its makeup and how these individual characteristics influence the nature of the creative, innovative and productive work they can do together.
It is critical for employees to observe models of leaders exhibiting the behavior expected of them. If leadership wants to demonstrate that diversity and inclusion has advantages to the individuals engaged, (and benefits for the Center and NASA) employees need to observe how this occurs. As the adage goes,
13
“seeing is believing.” Modeling the expected behavior also helps employees better understand the processes by which diversity and inclusion are used as tools to achieve mission success and overall excellence at NASA. Rewarding team success publicly while also intentionally linking their success to the team’s diversity is a practice that can highlight the positive aspects of what employees see, and encourage them to engage in similar behavior.
Having this team achieve the desired outcome (i.e., modeling the effectiveness of diverse teams) requires that the leaders who make up the team have or develop good interpersonal interaction skills and a deep understanding about how to manage and prevent conflict, since disagreements inevitably will occur. How these disagreements are managed will affect members’ perceptions of diversity and inclusion positively or negatively. It is important that the challenge be successfully addressed for this type of leadership modeling to be an effective teaching and learning tool. Success or failure will determine if employees perceive diversity and inclusion as an asset to achieving excellence or view it simply as talk without the walk.
The challenge that this team addresses should not be diversity and inclusion (D&I) per se, although issues related to D&I could be a part of it. Rather it should be an issue that many employees know about and would be pleased with a successful resolution to the challenge. This requires that the initial steps of the leader of the team (and the team members soon after they are identified), be the engagement of employees in determining the specific challenge(s) the team should address. Imagine undertaking the recommendation to add a Center‐specific question to surveys that are repeated frequently and consider how such a team could make such a change. Consider also encouraging employees to establish an ERG to work on the same challenge from the grassroots level and having members of the leadership team meaningfully involved in helping to develop the ERG members’ leadership acumen through the process. We are not recommending this as the challenge but offer it as an example so as to stimulate leaders thinking about how they might approach the implementation of this recommendation, or to develop a variation of it.
SUMMARY
Combating the status quo, improving supervisors’ effective human resource management skills and strengthening professional development are not easy in an environment where things are going quite well. Our recommendations are somewhat provocative because they may seem to disregard that things are going well. We hope they provide ways to help the SSC workforce to think about and approach its mission, its challenges and its values in integrative ways. Our goal is to help the Center create mechanisms that enable its diverse workforce to become more creative, innovative and productive by making inclusive practices universal. Once positive change results from D&I efforts, momentum will build, employees will recognize that the status quo is not good enough for SSC and that mission excellence through D&I is the goal.

14
III. DIAS AND FOCUS GROUP RECOMMENDATIONS THAT ADVANCE DEVELOPING A D&I IMPLEMENTATION PLAN
The Office of Diversity and Equal Opportunity DIAS Survey (Westat, 2011) consists of 91 items that address five research questions. The item responses were divided by the five research questions and separated into three categories: strengths, considerations and opportunities. These categories were defined as follows:
1) Strengths [areas of success; items with 70% or more of the responses were positive]
2) Considerations [areas of enhancement potential; items with between 50% and 69% positive responses], and
3) Opportunities [areas for improvement; items with less than 50% positive responses].
Table 1 provides a breakdown of these categories by each research question for SSC. We focus on two areas in this Report—opportunities and considerations.
TABLE 1. SUMMARY OF WESTAT RECOMMENDATIONS FOR DEVELOPING ACTION A SSC PLAN BY RESEARCH QUESTION
RESEARCH QUESTION (RQ) OPPORTUNITIES CONSIDERATIONS STRENGTHS TOTAL SURVEY ITEMS
1) Do employees at NASA understand diversity and inclusion and their benefits?
0 1 2 3
2) What are employees’ perceptions regarding the culture of diversity and inclusion at NASA?
1 13 17 31
3) How do employees perceive their own experiences at NASA?
0 5 41 46
4) How aware are employees of NASA policies and initiatives to promote diversity and inclusion?
2 0 2 4
5) How effective do employees think NASA has been, overall, in creating a diverse and inclusive work environment?
0 1 6 7
Total items 3 20 68 91
2010 Diversity and Inclusion Assessment Survey, Stennis Center Final Report Westat, 2011, pgs. 13, 21, 37, 47 & 51
The Opportunities offered across all items were limited to three; we believe this was due mainly to the overall high positive response rates across all 91 survey items for SSC. However, all except research question four offered at least one item for enhancement potential (Consideration); items related to research questions two and three offered the most opportunities and considerations (91%). In addition to the guidance these items offer to the development of a D&I Implementation Plan, the SSC DIAS Report offers an additional area of focus—the Bottom 10% positive responses. These Bottom 10% are the bottom 10 survey items with the lowest percent of positive responses, which varied at SSC from 37% ‐ 62%.
Table 2 below shows the bottom 10 survey items with the lowest percent positive responses for the Stennis Center and the research question to which they are associated. SSC’s percentages are compared to the overall Agency‐wide percent positive responses for these same items with the difference between the two shown in the right column. Positive differences mean SSC received a higher proportion of positive responses than the overall Agency‐wide average—all of SSC’s differences had more positive responses on these items than the overall Agency‐wide average.

15
Table 2. SSC Bottom 10% Positive Survey Items
Rank Order
Survey Number Research Question
Item SSC NASA Overall
Difference
1 A‐8 RQ2
NASA's efforts to achieve workforce diversity and inclusion sometimes lead to workplace problems.
36.8%
31.9% +4.9
2 A‐2 RQ1
At NASA, diversity seems to be mostly about physical characteristics of people.
51.1%
40.5% +10.6
3 C‐7 RQ3
In the past 12 months I received mentoring to help me grow in my job.
56.2%
43.8% +12.4
4 A‐5. RQ2
NASA uses diversity and inclusion effectively to increase workforce productivity.
57.3%
45.5% +11.8
5 B1‐3 RQ2
Generally, supervisors and managers in my current branch, division, or directorate help employees to recognize biases that foster workplace discrimination or exclusion.
58.9%
48.9% +10.0
6 B1‐4 RQ2
Generally, supervisors and managers in my current branch, division, or directorate assign employees with different diversity characteristics to work together.
60.2%
55.7% +4.5
7 B1‐6 RQ2
Generally, supervisors and managers in my current branch, division, or directorate help employees of different cultures to interact effectively in the workplace.
60.3%
55.8% +4.5
8 B2‐4 RQ2
Generally, the senior leaders and center leadership at my center assign employees with different diversity characteristics to work together.
60.5%
58.4% +2.1
9 A‐10 RQ2
The diversity and inclusion training employees receive at NASA is useful.
60.6%
50.1% +10.5
10 C‐3 RQ3
In the past 12 months I felt pressured to change things about myself in order to fit in at NASA.
61.8% 60.5% +1.3
Stennis Space Center Results (2010 NASA Diversity and Inclusion Assessment Survey, pg. 9)
This section of the Report also focuses on areas of Notable Demographic Differences (NDDs). NDDs are differences in the percent positive responses that differ 10 percentage points or more between various the demographic groups—gender; race; supervisory status; years of service; and those at or above age 40 and those below age 40.
Responses to all survey items were compared for different demographic groups within gender, race, supervisory status, tenure at NASA, and age. Out of 91 items, positive perceptions were different by ten percentage points or more for the following number of items and demographic groups in rank order:
59 items were different between supervisors and Non‐supervisors,
49 items were different between White and Non‐white respondents,
35 items were different between respondents who are younger than 40 years old and those who are 40 years old or older
23 items were different between males and females, and
16 items were different between respondents who worked at NASA for 10 years or less and those who worked at NASA for more than 10 years.

16
The table 3 summarizes the number of SSC notable differences between the five demographic groups across all survey items. Notable differences are defined as differences in the percent positive responses that are ten percentage points or more between demographic groups.
Table 3. Number of Items with Notable Demographic Differences
Research Question Gender Race Supervisory Status
Age Tenure Total
Research Question 1 0 2 3 2 0 7
Research Question 2 12 27 27 21 7 94
Research Question 3 6 18 19 11 8 62
Research Question 4 0 1 3 1 1 6
Research Question 5 5 1 7 0 0 13
Total 23 49 59 35 16 182
Stennis Space Center Final Report (2010 NASA Diversity and Inclusion Assessment Survey, 2011, pg. 10)
As noted, nearly 86% of all 182 notable demographic differences are indicated in research questions two and three, which are given in table 1 above.
We focus on the items chosen because those who will lead the development of the DIIP will need to know where NDDs are so they can consider these differences as the action steps and measures of progress are incorporated into the Center’s plan. These NDDs are addressed in the discussion of the SSC DIAS findings given below and illustrated in the charts provided in this section and in Appendix A, as mentioned above.
In this section relevant information is highlighted that overlaps between a) Opportunities and Considerations recommendations offered by the DIAS; b) the Bottom 10% positive survey items, and c) the areas where Notable Demographic Differences (Westat, 2011). Together these items offer focus for enhancing the environment for diversity and inclusion. We chose the particular set of DIAS recommended items to highlight because they offer SSC good guidance in developing the Center’s D&I Implementation Plan and the best outlook for demonstrating progress once a plan is in place. We do so also because attending to these highlighted areas offer targeted direction and means to make measurable progress in establishing an environment where diversity and inclusion can become hallmarks of SSC’s movement toward mission excellence.
In addition to focusing on these specific categorical survey items, within the items, attention is given to and discussion provided on areas where there is a high level of neutral responses. These are focal areas because they represent the greater promise for advancing positive perceptions and changing the SSC D&I culture, than focusing solely on changing the negative responses. Moreover, in many areas where there were notable demographic differences (NDDs), there were few that had large proportions of negative responses. Offering quality professional development activities and education related to diversity and inclusion as organizational assets, as recommended, captures those in the middle on these issues (neutral responses) and will likely yield movement in a positive direction. We take this approach not because it is an easy route—getting people to change their perspectives on any issue is difficult. When the number of individuals who hold positive rather than neutral perception is increased, it makes it more likely that an overall positive atmosphere can be created. Also, it is very difficult to change perceptions that are deeply held (represented by the negative responses). SSC leaders could focus a lot of energy on changing these negative perceptions and have only a very limited impact on the environment.
17
Achieving success in moving people from neutral to positive perceptions also creates models for those with negative perceptions to observe and possibly change their perceptions. That is, if there is an increase the size of the positive responses to embrace D&I as an organizational asset, it will likely create opportunities for those with negative perceptions to begin to see the positive dimensions of diversity and inclusion.
Additionally, we do not completely ignore negative responses in the NDDs; rather we attend to double‐digit negative responses and those that are pervasive across survey items. Even though negative responses are not the initial target of actions, the concerns they express will require attention. This is especially true with the number of differences between the supervisory and non‐supervisory employees showing the most consistent pattern of NDD across the items highlighted.
In other words, a focus on neutral responses allows SSC to capitalize on the low hanging fruit to achieve early success while still attending to the difficult structural and perceptual changes that must occur to create an environment that fully realizes the benefits of a diverse workforce; and allowing success to seed further success.

Research Question One: Do employees at NASA understand diversity and inclusion and their benefits?
Survey Item A‐2: At NASA, diversity seems to be mostly about physical characteristics of people.
This item was ranked #2 in the Bottom 10% positive responses although more than half (51%) responded positively (i.e., diversity is more than just physical characteristics). These data likely reflects employees comments that led us to believe that they correlated the EEO training they receive on SATERN with the diversity and inclusion education offered, mainly because engagement in the D&I education offered was limited. Employees also reported hearing leaders comment, “we need to hire a … to fill that position” Such comments contribute to the notion that diversity is about physical characteristics. However, these data also indicate that supervisory employees are far less likely to perceive diversity and inclusion solely as physical characteristics. People of color are more negative (33%) than any other demographic group but they are followed closely by females (30%) and non‐supervisors (30%). Yet all respondents gave fairly high levels of neutral responses (20 – 25 %) which offers opportunities for positive movement on the part of all groups.
Although they are indicated as areas of strengths because the overall positive response rate was greater than 70%, items A‐7 and A‐9 in this research area have numerous NDDs. They are discussed here because the items are at the heart of the work ahead—to make the case that D&I provide a source for innovative ideas and a business advantage. They also illustrate the consistent pattern of NDDs between supervisors and non‐supervisors.
Survey Item A7: Having employees with diverse backgrounds is a source of business advantage at NASA.
Items A‐7 and A‐9 are being discussed in tandem because they support our recommendation regarding the need for professional development education that deepens employees’ knowledge and understanding of the value of diversity and inclusion. Of supervisor responses to item A‐7, 88% compared with 70% of non‐supervisors were positive and those younger than 40 were more positive (82%) and those 40 or
0 20 40 60 80
W
POC
Sup
Nonsup
Percentage
Demograp
hic Categories
% Neutral
% Negative
% Positive
0 50 100
W
POC
Sup
Nonsup
< 40
> 40
Percentages
Demograp
hic Categories
% Negative
% Neutral
% Positive

19
older (71%). White respondents were more positive (77%) than people of color (64%). The high number of neutral responses, indicating room for growth, makes it especially important to attend to these differences in perceptions.
Survey Item A‐9: diversity and inclusion lead to innovative ideas at NASA.
As shown in item A‐7 above, item A‐9 indicates a similar pattern of very different perspectives between supervisors (96%) and non‐supervisors (64%), and those younger than 40 (83%) compared to those 40 and older (67%) is associated with employees expressing less positive views about the role of diversity and inclusion in innovation. Employees may require much more concrete evidence of how
diversity and inclusion promotes innovative ideas and provides business advantage to understand its relationship to mission excellence. If employees could see tangible examples first‐hand, it is possible that these neutral responses (20% ‐ 22%) could turn into positive responses.
Research Question One Summary. These data highlight the need for the Center leaders to demonstrate the value and benefit of Diversity and inclusion to raise awareness of their role in mission excellence. I t also underscores the need and increase employees’ understanding of existing EEO policy as one means of creating such a broadly diverse workforce.
0 50 100
M
F
W
POC
Sup
Nonsup
S < 10
S > 11
< 40
> 40
Percentage
Demograp
hic Categories
% Negative
% Neutral
% Positive
20
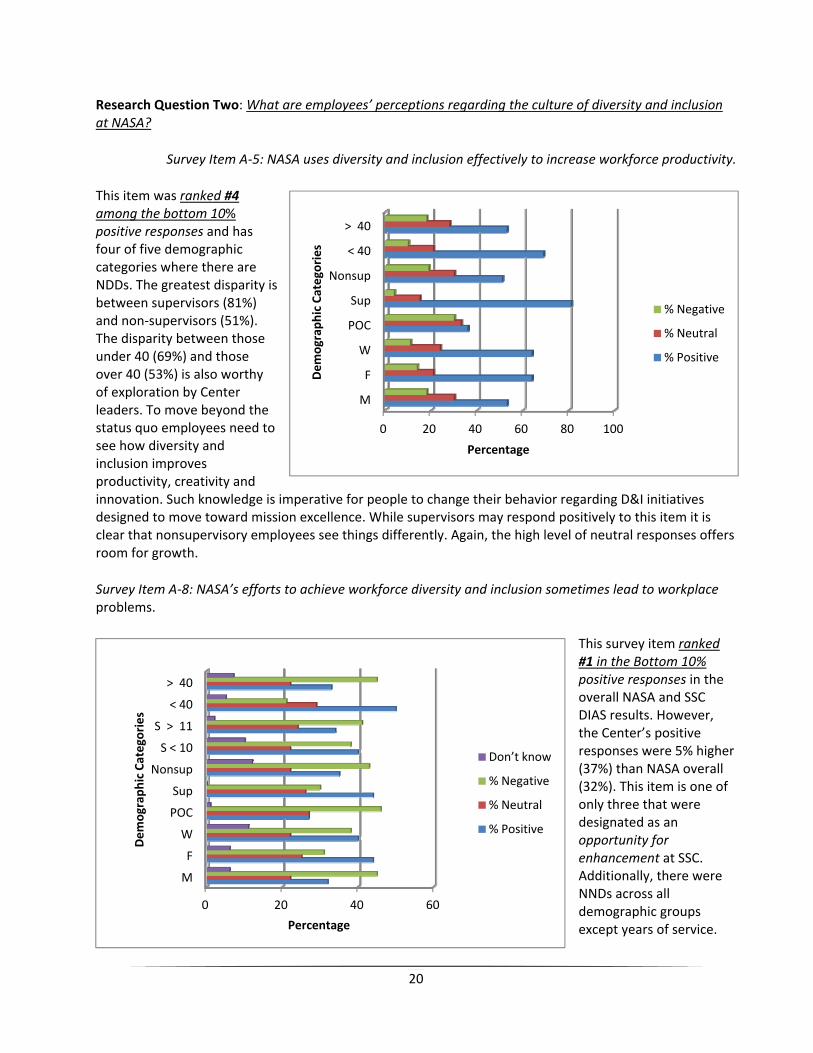
Research Question Two: What are employees’ perceptions regarding the culture of diversity and inclusion at NASA?
Survey Item A‐5: NASA uses diversity and inclusion effectively to increase workforce productivity.
This item was ranked #4 among the bottom 10% positive responses and has four of five demographic categories where there are NDDs. The greatest disparity is between supervisors (81%) and non‐supervisors (51%). The disparity between those under 40 (69%) and those over 40 (53%) is also worthy of exploration by Center leaders. To move beyond the status quo employees need to see how diversity and inclusion improves productivity, creativity and innovation. Such knowledge is imperative for people to change their behavior regarding D&I initiatives designed to move toward mission excellence. While supervisors may respond positively to this item it is clear that nonsupervisory employees see things differently. Again, the high level of neutral responses offers room for growth.
Survey Item A‐8: NASA’s efforts to achieve workforce diversity and inclusion sometimes lead to workplace problems.
This survey item ranked #1 in the Bottom 10% positive responses in the overall NASA and SSC DIAS results. However, the Center’s positive responses were 5% higher (37%) than NASA overall (32%). This item is one of only three that were designated as an opportunity for enhancement at SSC. Additionally, there were NNDs across all demographic groups except years of service.
0 20 40 60 80 100
M
F
W
POC
Sup
Nonsup
< 40
> 40
Percentage
Demograp
hic Categories
% Negative
% Neutral
% Positive
0 20 40 60
M
F
W
POC
Sup
Nonsup
S < 10
S > 11
< 40
> 40
Percentage
Demograp
hic Categories
Don’t know
% Negative
% Neutral
% Positive
21
However, all groups indicate a high level of neutral responses (22% and 29%). These data provide opportunities to explore exactly what would be needed to identify and address the problems employees perceive.
For example,, at least three perceptions may potential influence these results when one encounters a new hire who helps to broaden the Center’s diversity. One perception may be that of a new hire lacks the necessary qualifications to do the job—reflecting comments such as “we need to hire a …”—but in fact the hire is well qualified. A second reason may be a perceiver’s belief that s/he or someone s/he knows is more qualified for the job and was passed over. A third reason may be that the new hire is less qualified but has the potential to excel in the position, however a perceiver may only observe the new hire during the initial stages of work. If played out, all of these scenarios will likely lead to resentment on the part of the new hire and the existing employee. This may be reflected in the high negative response rates (21% ‐ 46%) relative to the neutral responses. These scenarios underscore the importance of supervisory education and skill development on how to communicate decisions clearly, provide transparency regarding actions, and highlight positive outcomes. Such education would underscore that D&I is more than physical characteristics and offer leaders ways to address existing and potential problems. Leaders are encouraged to explore this item in conjunction with Item A‐2 in the previous section.
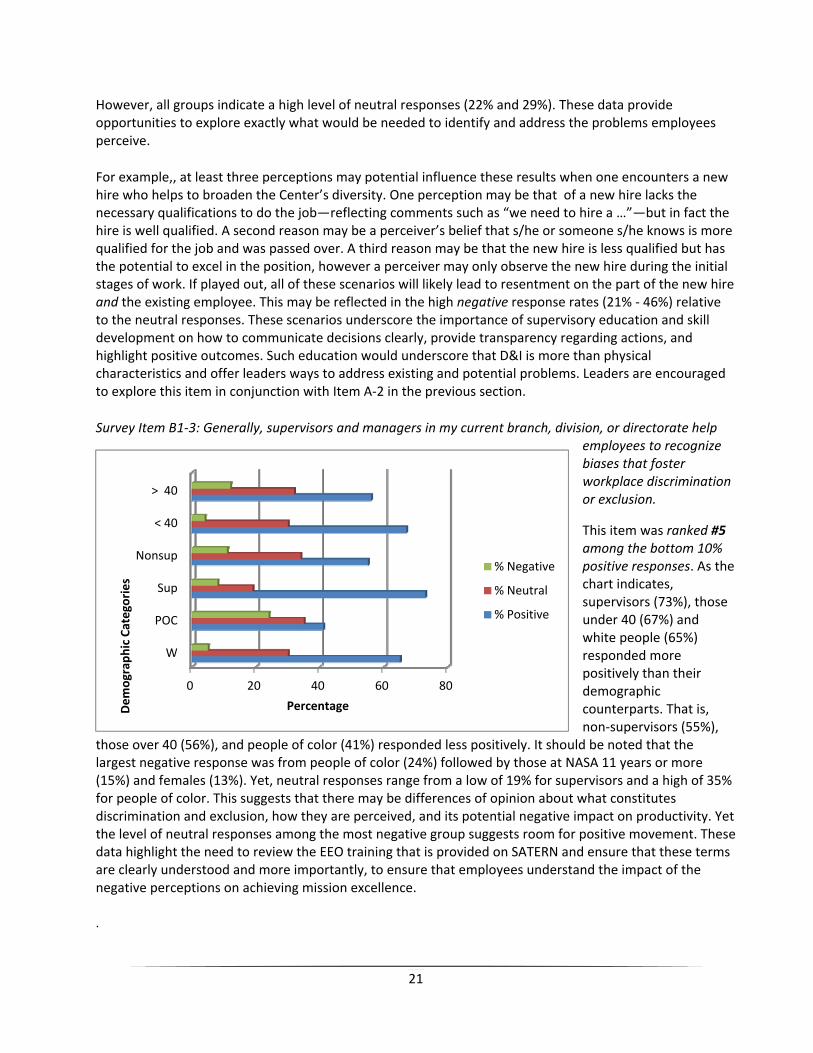
Survey Item B1‐3: Generally, supervisors and managers in my current branch, division, or directorate help employees to recognize biases that foster workplace discrimination or exclusion.
This item was ranked #5 among the bottom 10% positive responses. As the chart indicates, supervisors (73%), those under 40 (67%) and white people (65%) responded more positively than their demographic counterparts. That is, non‐supervisors (55%),
those over 40 (56%), and people of color (41%) responded less positively. It should be noted that the largest negative response was from people of color (24%) followed by those at NASA 11 years or more (15%) and females (13%). Yet, neutral responses range from a low of 19% for supervisors and a high of 35% for people of color. This suggests that there may be differences of opinion about what constitutes discrimination and exclusion, how they are perceived, and its potential negative impact on productivity. Yet the level of neutral responses among the most negative group suggests room for positive movement. These data highlight the need to review the EEO training that is provided on SATERN and ensure that these terms are clearly understood and more importantly, to ensure that employees understand the impact of the negative perceptions on achieving mission excellence.
.
0 20 40 60 80
W
POC
Sup
Nonsup
< 40
> 40
PercentageDemograp
hic Categories
% Negative
% Neutral
% Positive

22
Survey Item B1‐4: Generally, supervisors and managers in my current branch, division, or directorate assign employees with different diversity characteristics to work together.
A wide variety of positive responses were indicated for this item; it ranked #6 on the bottom 10% positive responses. The pattern of NDD relative to supervisors and non‐supervisors was repeated (82% and 54% respectively). Also noteworthy are the differences between those under 40 (70%) and
over 40 (57%), as well as white respondents (67%) and people of color (POC) respondents (41%). Although POC respondents were the most negative (28%), their neutral responses (31%) were higher and fairly consistent with those over 40 (34%) and non‐supervisors (33%). Employees may need to see more incidents of supervisor and managers intentionally putting employees with diverse characteristics together to work on projects in order to make perceptions more positive about the value of diversity and inclusion to mission excellence.
0 20 40 60 80 100
W
POC
Sup
Nonsup
< 40
> 40
Percentage
Demograp
hic Categories
% Negative
% Neutral
% Positive
23
0 20 40 60 80
M
F
W
POC
Sup
Nonsup
S < 10
S > 11
< 40
> 40
Percentage
Demograp
hic Categories
Don’t know
% Negative
% Neutral
% Positive
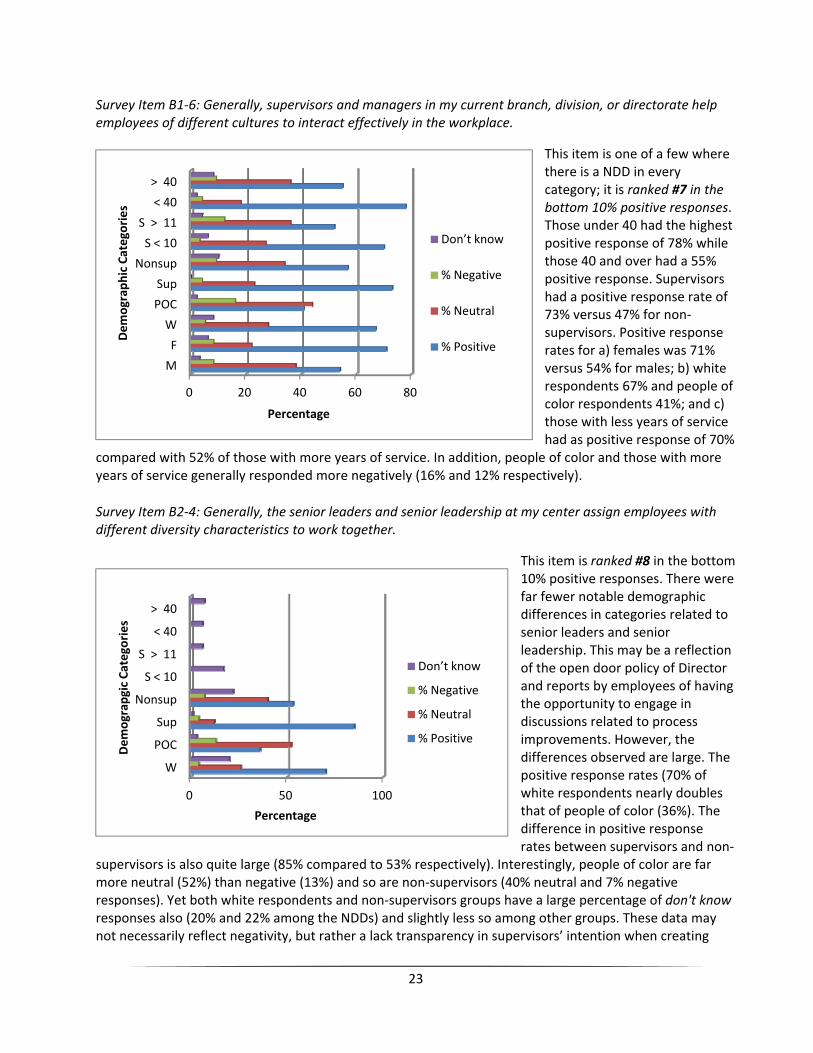
Survey Item B1‐6: Generally, supervisors and managers in my current branch, division, or directorate help employees of different cultures to interact effectively in the workplace.
This item is one of a few where there is a NDD in every category; it is ranked #7 in the bottom 10% positive responses. Those under 40 had the highest positive response of 78% while those 40 and over had a 55% positive response. Supervisors had a positive response rate of 73% versus 47% for non‐supervisors. Positive response rates for a) females was 71% versus 54% for males; b) white respondents 67% and people of color respondents 41%; and c) those with less years of service had as positive response of 70%
compared with 52% of those with more years of service. In addition, people of color and those with more years of service generally responded more negatively (16% and 12% respectively).
Survey Item B2‐4: Generally, the senior leaders and senior leadership at my center assign employees with different diversity characteristics to work together.
This item is ranked #8 in the bottom 10% positive responses. There were far fewer notable demographic differences in categories related to senior leaders and senior leadership. This may be a reflection of the open door policy of Director and reports by employees of having the opportunity to engage in discussions related to process improvements. However, the differences observed are large. The positive response rates (70% of white respondents nearly doubles that of people of color (36%). The difference in positive response rates between supervisors and non‐
supervisors is also quite large (85% compared to 53% respectively). Interestingly, people of color are far more neutral (52%) than negative (13%) and so are non‐supervisors (40% neutral and 7% negative responses). Yet both white respondents and non‐supervisors groups have a large percentage of don't know responses also (20% and 22% among the NDDs) and slightly less so among other groups. These data may not necessarily reflect negativity, but rather a lack transparency in supervisors’ intention when creating
0 50 100
W
POC
Sup
Nonsup
S < 10
S > 11
< 40
> 40
Percentage
Demograp
gic Categories
Don’t know
% Negative
% Neutral
% Positive
24
work groups; or employees simply don’t know about how assignments are made. Raising awareness may be done best by first being clear about why the members of a team is selected to participate in a work group. These actions will likely help these employees perceive the environment to be more inclusive and observe first‐hand the benefits of diverse teams.
25
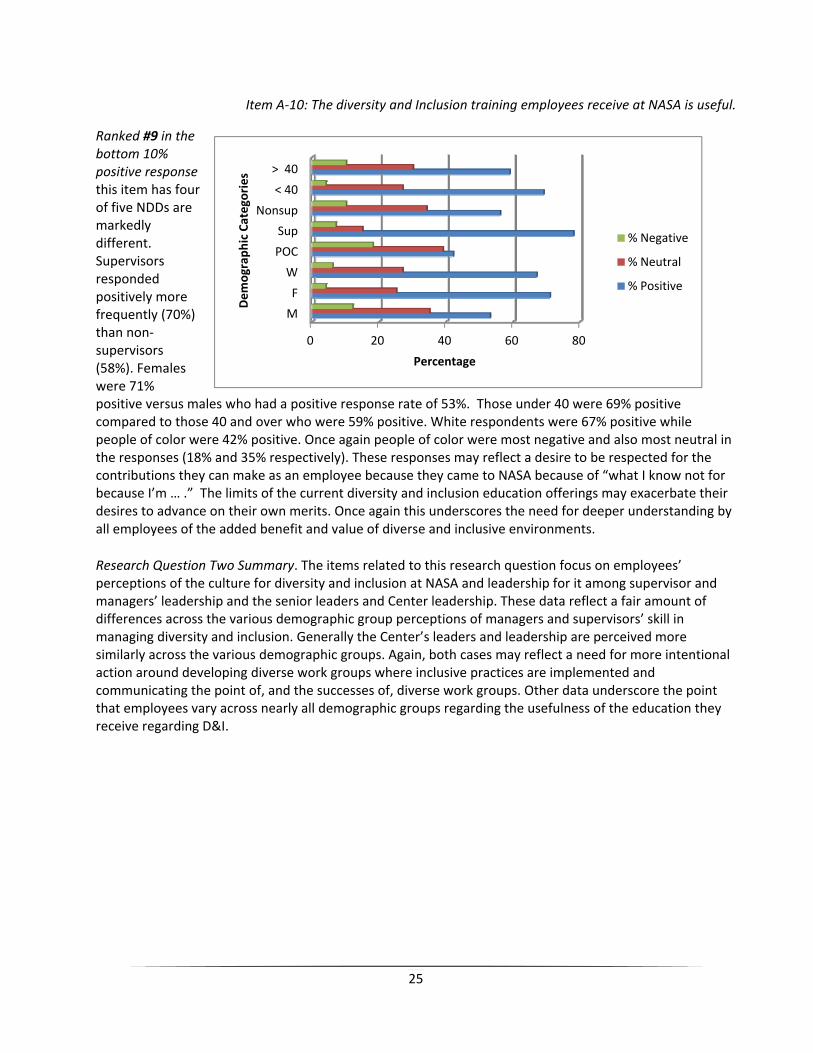
Item A‐10: The diversity and Inclusion training employees receive at NASA is useful.
Ranked #9 in the bottom 10% positive response this item has four of five NDDs are markedly different. Supervisors responded positively more frequently (70%) than non‐supervisors (58%). Females were 71% positive versus males who had a positive response rate of 53%. Those under 40 were 69% positive compared to those 40 and over who were 59% positive. White respondents were 67% positive while people of color were 42% positive. Once again people of color were most negative and also most neutral in the responses (18% and 35% respectively). These responses may reflect a desire to be respected for the contributions they can make as an employee because they came to NASA because of “what I know not for because I’m … .” The limits of the current diversity and inclusion education offerings may exacerbate their desires to advance on their own merits. Once again this underscores the need for deeper understanding by all employees of the added benefit and value of diverse and inclusive environments.
Research Question Two Summary. The items related to this research question focus on employees’ perceptions of the culture for diversity and inclusion at NASA and leadership for it among supervisor and managers’ leadership and the senior leaders and Center leadership. These data reflect a fair amount of differences across the various demographic group perceptions of managers and supervisors’ skill in managing diversity and inclusion. Generally the Center’s leaders and leadership are perceived more similarly across the various demographic groups. Again, both cases may reflect a need for more intentional action around developing diverse work groups where inclusive practices are implemented and communicating the point of, and the successes of, diverse work groups. Other data underscore the point that employees vary across nearly all demographic groups regarding the usefulness of the education they receive regarding D&I.
0 20 40 60 80
M
F
W
POC
Sup
Nonsup
< 40
> 40
Percentage
Demograp
hic Categories
% Negative
% Neutral
% Positive
26
0 20 40 60 80
M
F
W
POC
Sup
Nonsup
Percentage
Demograp
hic Categories % Negative
% Neutral
% Positive
Research Question Three: How do employees perceive their own experience at NASA?
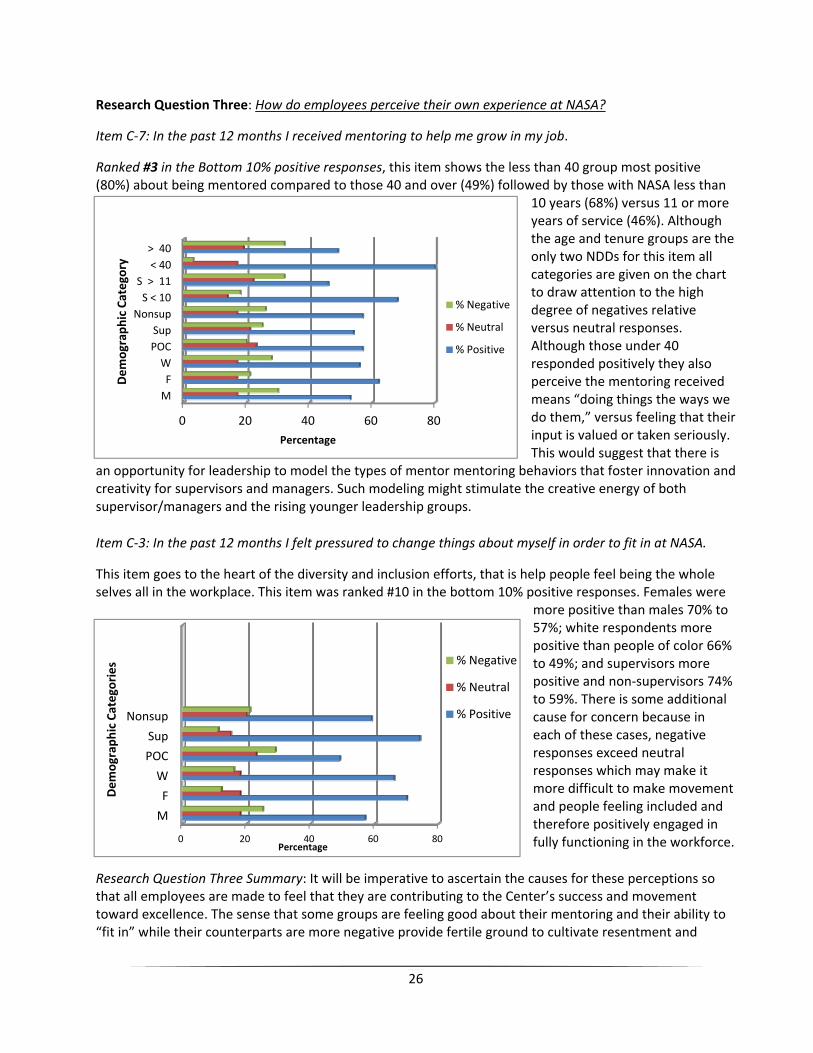
Item C‐7: In the past 12 months I received mentoring to help me grow in my job.
Ranked #3 in the Bottom 10% positive responses, this item shows the less than 40 group most positive (80%) about being mentored compared to those 40 and over (49%) followed by those with NASA less than
10 years (68%) versus 11 or more years of service (46%). Although the age and tenure groups are the only two NDDs for this item all categories are given on the chart to draw attention to the high degree of negatives relative versus neutral responses. Although those under 40 responded positively they also perceive the mentoring received means “doing things the ways we do them,” versus feeling that their input is valued or taken seriously. This would suggest that there is
an opportunity for leadership to model the types of mentor mentoring behaviors that foster innovation and creativity for supervisors and managers. Such modeling might stimulate the creative energy of both supervisor/managers and the rising younger leadership groups.
Item C‐3: In the past 12 months I felt pressured to change things about myself in order to fit in at NASA.
This item goes to the heart of the diversity and inclusion efforts, that is help people feel being the whole selves all in the workplace. This item was ranked #10 in the bottom 10% positive responses. Females were
more positive than males 70% to 57%; white respondents more positive than people of color 66% to 49%; and supervisors more positive and non‐supervisors 74% to 59%. There is some additional cause for concern because in each of these cases, negative responses exceed neutral responses which may make it more difficult to make movement and people feeling included and therefore positively engaged in fully functioning in the workforce.
Research Question Three Summary: It will be imperative to ascertain the causes for these perceptions so that all employees are made to feel that they are contributing to the Center’s success and movement toward excellence. The sense that some groups are feeling good about their mentoring and their ability to “fit in” while their counterparts are more negative provide fertile ground to cultivate resentment and
0 20 40 60 80
M
F
W
POC
Sup
Nonsup
S < 10
S > 11
< 40
> 40
Percentage
Demograp
hic Category
% Negative
% Neutral
% Positive
27
conflict. Addressing these disparities in perceptions with open dialogue about the exact nature of the perceptions will be paramount.
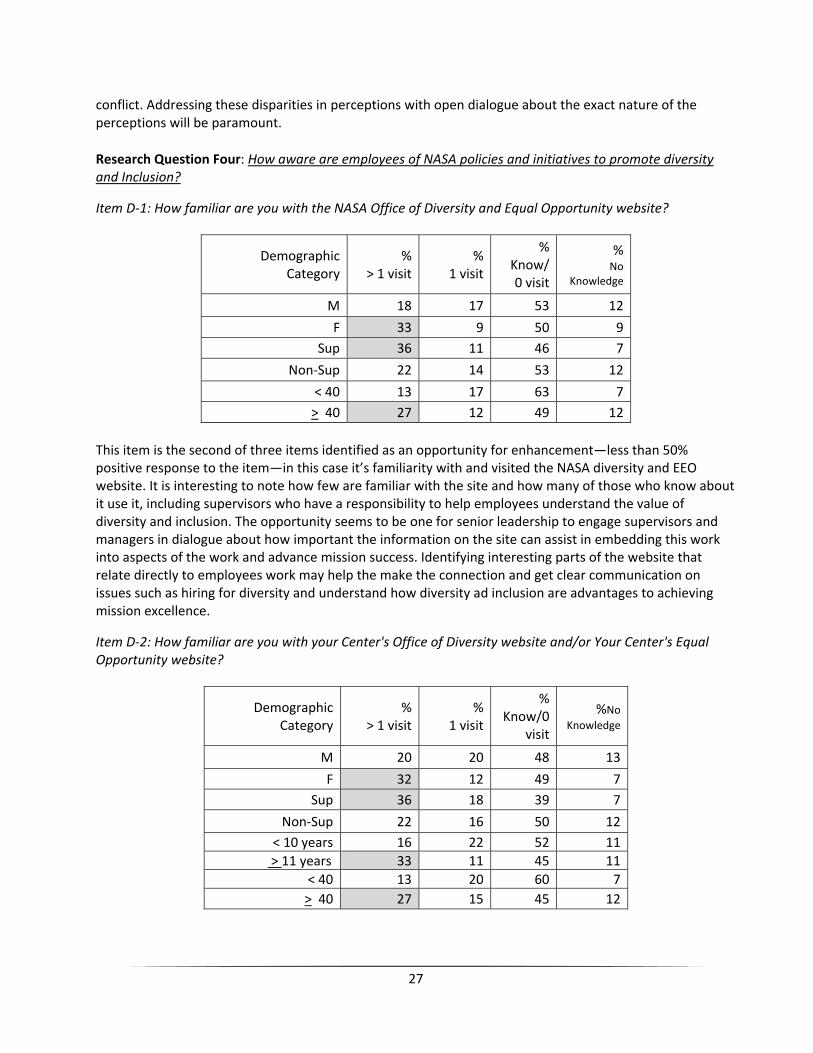
Research Question Four: How aware are employees of NASA policies and initiatives to promote diversity and Inclusion?
Item D‐1: How familiar are you with the NASA Office of Diversity and Equal Opportunity website?
Demographic Category
%> 1 visit
%1 visit
% Know/0 visit
% No
Knowledge
M 18 17 53 12
F 33 9 50 9
Sup 36 11 46 7
Non‐Sup 22 14 53 12
< 40 13 17 63 7
> 40 27 12 49 12
This item is the second of three items identified as an opportunity for enhancement—less than 50% positive response to the item—in this case it’s familiarity with and visited the NASA diversity and EEO website. It is interesting to note how few are familiar with the site and how many of those who know about it use it, including supervisors who have a responsibility to help employees understand the value of diversity and inclusion. The opportunity seems to be one for senior leadership to engage supervisors and managers in dialogue about how important the information on the site can assist in embedding this work into aspects of the work and advance mission success. Identifying interesting parts of the website that relate directly to employees work may help the make the connection and get clear communication on issues such as hiring for diversity and understand how diversity ad inclusion are advantages to achieving mission excellence.
Item D‐2: How familiar are you with your Center's Office of Diversity website and/or Your Center's Equal Opportunity website?
Demographic Category
%> 1 visit
%1 visit
% Know/0
visit
%No
Knowledge
M 20 20 48 13
F 32 12 49 7
Sup 36 18 39 7
Non‐Sup 22 16 50 12
< 10 years 16 22 52 11
> 11 years 33 11 45 11
< 40 13 20 60 7
> 40 27 15 45 12

28
This is the third and final item shown as an opportunity for enhancement as the Center zeros in on its D&I Implementation Plan. This seems like a golden opportunity to ask the existing Young Professionals ERG to delve into the Center’s site and make recommendations about what would drive employees can establish it as an educational and knowledge source about D&I; or as a knowledge network about diversity and inclusion. Senior leader sponsorship can help members understand that work on such a project helps the Center, NASA and the ERG members. If the existing group does not see this as part of their work, consider asking an advisory committee to take on the task with the same notion of senior level sponsorship to make the process one of learning as well as accomplishing an important task for NASA.
Research Question Four Summary. These items represent employees’ awareness and use of web‐based resources to increase their knowledge of diversity and inclusion. It is clear that most employees do not access these resources. The task of making D&I a critical lever for NASA mission success requires that leaders attend to utilizing all means possible to help employees understand how to draw on each other’s uniqueness to drive mission excellence. The many ways the internet can be used suggests that it may be well worth an investment in employee time to explore to gain an understanding what might drive them to access and learn through web=based learning
Research Question Five: How effective do employees think NASA has been overall in creating a diverse and inclusive work environment?
Item E‐7: How would you rate the overall effectiveness of NASA in educating employees on how diversity and inclusion fosters innovation?
This item was the only one it this research area that was categorized among those recommended as an area for consideration. Females (80%) and supervisors (86%) are much more positive about NASA’s D&I
efforts than other groups who fall mostly in the 60‐ 69% range. Employees who have worked at NASA less than 10 years, males (13% vs. 5%)and non‐supervisors (11% vs. 4%) responded negatively twice as often as their counterparts, but they also have a significant percentage who responded neutrally (26% and 27% respectively). However, those under 40 was the only group that responded more negatively (17%) than neutrally (14%) to this item. Since this group will likely be the future of NASA leadership, it is important that they be a part of the planning to ensure that efforts have the greatest possibility of meeting their expectations.
Research Question Five Summary. Although the overall ratings of effectiveness are positive, there appears to be room for enhancement among all groups—even the most positive. The Center has a chance to make significant progress. Leaders should consider looking at the DIAS responses by directorate and focusing on those who responded most positively to this item and engage these employees in framing the work ahead.
0 50 100
M
F
W
POC
Sup
Nonsup
S < 10
S > 11
< 40
> 40
Percentage
Demograp
hic Categories % Negative
% Neutral
% Positive

TABLE 4. MAP OF FOCUS GROUP THEMES, DIAS RESEARCH QUESTIONS, RECOMMENDATIONS AND ALIGNMENT WITH ODEO D&I STRATEGIC IMPLEMENTATION PRINCIPLES
FOCUS GROUP THEME AND
DIAS RESEARCH QUESTION(S)
RECOMMENDATIONS RECOMMENDED ACTIONS RELATED TO DEVELOPMENT THE NSSC DIVERSITY & INCLUSION IMPLEMENTATION PLAN ALIGNED WITH ODEO
PRINCIPLES FOCUS GROUP THEME ONE RESEARCH QUESTION TWO: What are employees’ perceptions regarding the culture of diversity and inclusion at NASA? (Survey Items—A‐8; B1‐3; B1‐4; B1‐6; B2‐4; A‐10)
COMBAT THE STATUS QUO IN LIGHT OF BEING AMONG
THE BEST
Link the work of consideration of D&I the value of into to job tasks
Create mechanisms to listen to employee input and feedback, and respond constructively to what is heard
Establish a culture of sharing both task and D&I knowledge
Develop/enhance leaders human resource management skills
Examine human resource management skill levels to ensure they are practiced effectively
PRINCIPLE TWO: Employee Engagement and Effective Communication PRINCIPLE THREE: Continuous D&I Education, Awareness, and Skills Development PRINCIPLE FIVE: Shared Accountability and Responsibility for Diversity and Inclusion
Senior leadership ensures that employee engagement is valued and effective mechanisms are established such that everyone understands their responsibilities to the work and to realizing D&I’s role in achieving mission success.
Leaders offer ways for supervisors and employees to deepen their knowledge of human resource management to be able to realize full the potential of D&I.
Center leaders hold supervisors and managers accountable for applying their learning and take corrective action or reward behavior that is consistent with NASA values around D&I
30
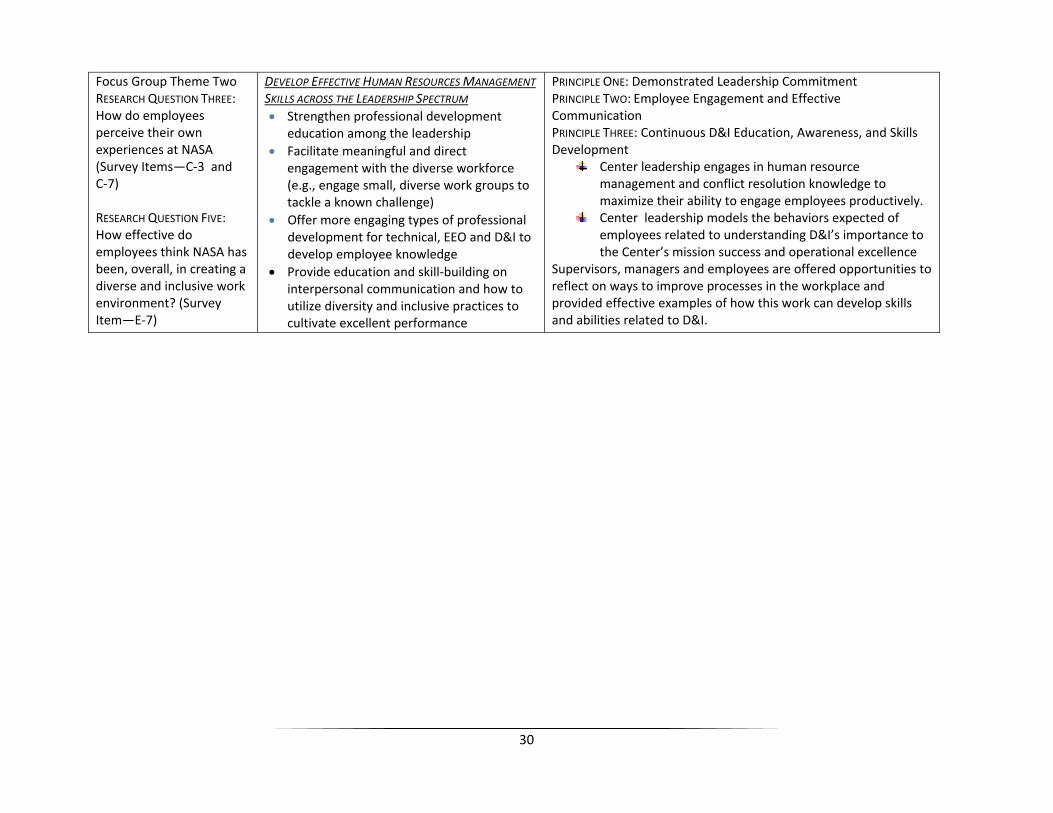
Focus Group Theme Two RESEARCH QUESTION THREE: How do employees perceive their own experiences at NASA (Survey Items—C‐3 and C‐7) RESEARCH QUESTION FIVE: How effective do employees think NASA has been, overall, in creating a diverse and inclusive work environment? (Survey Item—E‐7)
DEVELOP EFFECTIVE HUMAN RESOURCES MANAGEMENT
SKILLS ACROSS THE LEADERSHIP SPECTRUM Strengthen professional development
education among the leadership Facilitate meaningful and direct
engagement with the diverse workforce (e.g., engage small, diverse work groups to tackle a known challenge)
Offer more engaging types of professional development for technical, EEO and D&I to develop employee knowledge
Provide education and skill‐building on interpersonal communication and how to utilize diversity and inclusive practices to cultivate excellent performance
PRINCIPLE ONE: Demonstrated Leadership Commitment PRINCIPLE TWO: Employee Engagement and Effective Communication PRINCIPLE THREE: Continuous D&I Education, Awareness, and Skills Development
Center leadership engages in human resource management and conflict resolution knowledge to maximize their ability to engage employees productively.
Center leadership models the behaviors expected of employees related to understanding D&I’s importance to the Center’s mission success and operational excellence
Supervisors, managers and employees are offered opportunities to reflect on ways to improve processes in the workplace and provided effective examples of how this work can develop skills and abilities related to D&I.

TABLE 4. (CONTINUED) MAP OF FOCUS GROUP THEMES, DIAS RESEARCH QUESTIONS, RECOMMENDATIONS AND ALIGNMENT WITH ODEO D&I STRATEGIC IMPLEMENTATION PRINCIPLES
FOCUS GROUP THEME AND DIAS RESEARCH QUESTION(S)
RECOMMENDATIONS RECOMMENDED ACTIONS RELATED TO DEVELOPMENT THE NSSC DIVERSITY &
INCLUSION IMPLEMENTATION PLAN ALIGNED WITH ODEO PRINCIPLES
FOCUS GROUP THEME THREE
RESEARCH QUESTION ONE: Do employees at NASA understand diversity and inclusion and their benefits?
( Survey Items— A‐2; A‐7; A‐9)
RESEARCH QUESTION Four: How aware are employees of NASA policies and initiatives to promote diversity and inclusion?
(Survey Items—D‐1 and D‐2)
STRENGTHEN D&I PROFESSIONAL DEVELOPMENT AND
DISTINGUISH IT FROM TECHNICAL TRAINING
Vary frequent surveys by adding applied and/or Center‐specific questions
Develop venues for leadership to link D&I work to important Center challenges
Offer education that develops employees’ capability to see the NASA “big picture” related to D&I which draws on each employee’s skill and unique background to enhance productivity (e.g., support and encourage ERGs)
Make consistent distinctions between technical/policy training and more intensive professional development for effective human capital management
Support existing and establish new ERGs where appropriate that may work in tandem with leadership exploration of important Center challenges
Use creative ways to reward employees who advance diversity and inclusion practices effectively
PRINCIPLE TWO: Employee Engagement and Effective Communication
PRINCIPLE THREE: Continuous D&I Education, Awareness, and Skills Development
PRINCIPLE FOUR: Demonstrated Commitment to Community Partnerships
Engage the diversity of the Center employees to develop task‐oriented feedback and reflection on the Center’s challenges
Senior leadership inspires and incentivizes all levels of leadership and employees through D&I recognition.
Engage ERGs in work with the local community is linked to NASA mission success.
Help supervisors and managers understand and communicate to employees that EEO objectives are to hire the best qualified and enhance diversity to achieve a business advantage from the unique skills each employee bring to the workplace.
Make public the intention of developing diverse teams, explore how it works or doesn’t and help the Center community understand why the outcomes are what they are because of the team members’ ability (or lack thereof) to manage D&I effectively

IV. CONCLUSION
Just how diversity and inclusion helps organizations do their work better can often be difficult to understand. Fortunately, employees at the Stennis Space Center already understand that diversity is defined broadly and encompasses every employee’s uniqueness to the work and workplace. They also know and are proud of the fact that they are ahead of the curve with regard to their D&I perceptions and efforts—they see that they each contribute differently to the work of their unit/directorate. This is evidenced by the DIAS data. However, the focus groups also showed that some employees lack concrete examples how of non‐job related diversity (one’s cultural background characteristics) play a positive role in increasing productivity, creativity and innovation and how to manage effectively the Center’s diverse human capital.
The good news is that the Diversity and Inclusion Assessment Survey data indicate a large degree of neutrality on items where employees were less positive about items related to mandatory training, including EEO training. Yet, the focus groups revealed that employees have a strong desire to contribute to the Center and NASA’s mission success and want to understand the connections and use them to enhance the Center.
This report seeks to highlight areas that the Center’s leadership and employees can focus on to develop a sound and measureable Diversity and Inclusion Implementation Plan. The consistency and commitment in D&I leadership apparent in the new Center Director, Richard J. Gilbrech, makes it likely that a vision to remain ahead of the D&I curve within NASA can be realized fully.
33
Appendix A
FOCUS GROUP STRATEGY AND PROTOCOL
THE FOCUS GROUP STRATEGY
STRATEGY OVERVIEW
We will be approaching the conduct of the focus groups scheduled with the civil service and senior contractor employee groups with the recognition that each has a different dynamic relationship with the NASA John C. Stennis Center (SSC). We will also approach this work with the mindset that civil service and contractor employees are both vitally important to the success of SSC and its effort to establish a culture that recognizes and values diversity and inclusion. SSC is ranked number one in employee satisfaction across all government agencies according to the Employee Viewpoint Survey. SSC is also ranked and number one in positive perception of diversity and inclusion efforts according to the NASA’s 2010 Diversity and Inclusion Assessment Survey (DIAS). However, the centers leadership believes that examining areas where there is room for improvement will lead to enhanced creativity, innovation and productivity and enable the center to consistently sustain its number one ranking.
We have examined the data gathered from civil service employees in the 2010 NASA DIAS analyzed specifically for SSC. We have used the five research questions employed by the DIAS and its analysis dimensions to develop the prompts we will use for the focus group interviews. Our goal is to validate and make meaning of the DIAS analysis, and to ensure that it reflects the sentiments of all civil service employees, including those who did not complete the survey, as well as and the contractor leaders, who did not participate in the survey.
While we are committed to using the DIAS research questions as a framework to analyze the focus group data, we found them to be an ill‐suited framework for conducting the focus group interviews. We have designed a more straightforward strategy for the focus group sessions. We have done so by collapsing our inquiry into three categories— knowledge, experience and capacity—and we have outlined them below. We believe these categories of questions will be an effective means of comparing information across all of the available data to provide SSC with a set of recommendations to develop a manageable, Center‐specific Diversity & Inclusion Implementation Plan (DIIP) that can be tied to a set of measurable outcomes. The approach also ensures that SSC’s Implementation Plan will be in alignment with the Office of Diversity and Equal Opportunity’s (ODEO) Diversity and Inclusion Implementation Plan.
TOPICS OF INQUIRY FOR THE FOCUS GROUPS
1) Employees’ knowledge—including their: understanding and familiarity with diversity and inclusion (D&I) concepts; familiarity with D&I policies and available education; familiarity with information about engaging D&I to enhance productivity. (These topics address DIAS research questions one and four, and ODEO Principle Three)
2) Employees’ experience—including their perceptions of the: D&I culture at NASA/SSC; degree of value afforded their skills and abilities; freedom to be oneself in the workplace; freedom to express ones opinions regarding work. (These topics address DIAS research questions two and three, and ODEO Principles Two and Five)
3) Employees’ perception of SSC’s capacity for effective diversity and inclusion—including NASA’s overall effectiveness to: establish a diverse and inclusive work environment; share information
34
to improve productivity; foster mutual respect and trust; value individual contributions; educate about the value of D&I to the work. (These topics address DIAS Research question five, and ODEO Principles One, Four and Five)
These three areas of inquiry are the general topics to be covered in all focus groups regardless of employment status. In addition, we also will probe the groups on these topics based on their various demographic characteristics. These demographic‐based inquiries will focus on the Notable Demographic Differences (NDD) uncovered in the DIAS. We describe how the DIAS derived the NDD and provide an example of at least one NDD for each research question in attachment A.
In addition, we have used the ODEO operating principles below as we developed our Focus group Strategy and Protocol to enable us to look across all available data efficiently and with an eye towards alignment.
Principle 1 ‐ Demonstrated Leadership Commitment
Principle 2 ‐ Employee Engagement and Effective Communication
Principle 3 ‐ Continuous D&I Education, Awareness, and Skills Development
Principle 4 ‐ Demonstrated Commitment to Community Partnerships
Principle 5 ‐ Shared Accountability and Responsibility for Diversity and Inclusion
We believe that this framework provides an efficient and effective means of linking the focus group qualitative data to the quantitative data analysis of the Center’s 2010 DIAS results, to the ODEO Implementation Plan (as indicated in the above enumeration) and the themes that Director Scheuermann has laid out as foundational to sustaining and evolving an environment SSC’s. The connection with Director Scheuermann’s themes below, which were shared with us during a phone conversation with Director Scheuermann and his leadership team:
Knowledge—Understand where improvements are needed; get everyone is on the same page in addressing these areas build on the work already being done by the Center’s ODEO team to excel even further.
Experience—use this time of leadership stability and employee trust to improve the innovation, creativity and productivity of its central role as a jet propulsion test facility Capacity—Continue to strengthen align the leadership with Center goals and purposes; develop leadership at various levels of employees through full implementation of diversity and inclusion practices
INTERVIEW PREPARATION
Our interview slots are only 75 minutes and it will be difficult to obtain all the information we will need from the groups if they come unprepared for the discussion. As such, we encourage SSC leaders/site visit organizers to share the three general topics with those scheduled to be interviewed and ask them to reflect on them prior to their interview time.

35
THE PROTOCOL
FOCUS GROUP PARTICIPANT SELECTION
SSC’s Diversity and EEO Manager, JoAnn Larson, forwarded to us a set of Excel spreadsheets assigning each civil service employee a discreet number. We were able to sort the lists into the five demographic characteristics employed for the 2010 DIAS (see Appendix B for details) which enabled us to select all focus group participants through a stratified random selection process. That is, we stratified the list of participants by the five DIAS demographic characteristics and then randomly selected from within each category.
With the consent of Ms. Larson, we added a separate interview group for civil service employees categorized as Leads. These employees are not Supervisors, but often function as such by leading projects. Our experience suggested that this group has a distinct relationship within the workforce to warrant a separate session. There is another distinct set of non‐supervisory employees within the contractor population—clerical and professional. Otherwise, the interview groups are based on the five demographic categories used for the DIAS
The current interview schedule allows for a group of Leaders among the Contractors will be interviewed. This set of interviewees will be identified separately and invited to participate in a focus group by Ms. Larson. The selection of these contractors for interviews will be based on the decision‐maker’s knowledge of their relationship within the SSC workforce.
The initial random selections were generated using an Excel formula. We then manually cross checked the list to eliminate duplications across demographic categories (e.g., ensure that a person was selected to be in only one focus group). When duplicates were found we made decisions on where to place the selected individual based on a balance within the demographic category.
We also manually cross checked the randomly generated list to eliminate supervisors and Leads who were selected into any of the other four demographic categories. This was done to ensure an open and honest conversation among nonsupervisory employees in each category. All categories were oversampled from the start so that eliminations within each category still yielded a sufficient number to allow for attrition among those invited; groups were made up of between 14 and 20 employees. Although we did have each employee's name all data has been converted to numbers and we will not query participants regarding their full names during the interviews and we will retain their demographic categorization only as it is relevant to our efforts to provide recommendations about the DIIP recommendations.
SCHEDULE
We will conduct all but two focus groups together with one person taking the lead in conducting the interviews and the other taking notes. We will support each other in all jointly held sessions. We will each lead one interview session separately. During these separate interviews we each will meet with civil service demographic groups of Whites or People of Color.
The contractor Senior Leadership Team is the first group to be interviewed on Tuesday, August 14th, and all other groups will be interviewed subsequently over the period of Tuesday, August 14th through Thursday, August 16th.
36
Individuals who were not selected to participate (or who were selected) and wish to speak with us outside of the group setting (or in small groups depending on the topic and/or demand) have been given the opportunity to be interviewed as well. They are being asked to contact Maria at the Curtis Lewis and Associates office to request a meeting. These individuals and/or groups will be directed to meet with us on Friday, December 9th from 8:30 a.m. until noon.
ANALYSIS OF NOTES AND OBSERVATIONS
As mentioned, we will alternate taking notes during the focus groups sessions. A half‐hour of debriefing time has been scheduled between interview sessions during which we plan to discuss our observations and the notes. Each evening we will also review the notes and develop a preliminary summary of findings for the day.
We will spend Thursday afternoon, August 16th together refining the summaries, begin making linkages with the other information we have and begin an initial draft of our recommendations. We expect to deliver our recommendations to ODEO and SSC within 30 business days of the conclusion of our site visit, which is September 28, 2012.
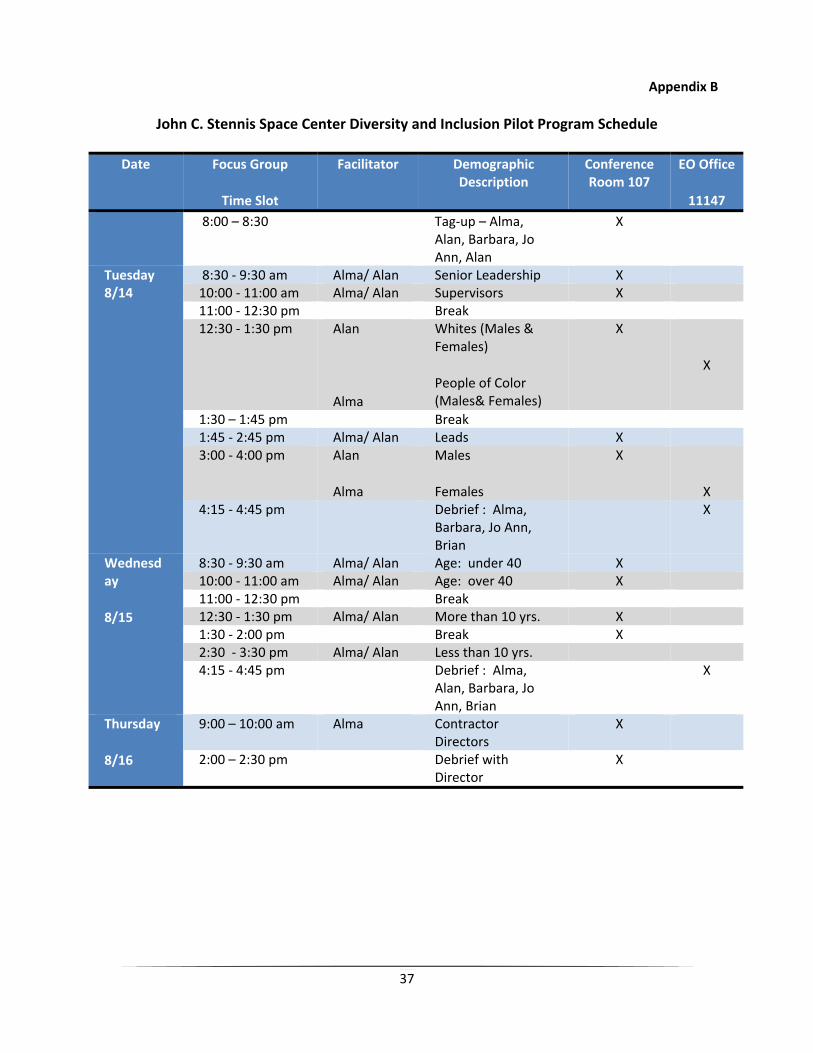
37
Appendix B
John C. Stennis Space Center Diversity and Inclusion Pilot Program Schedule
Date Focus Group
Time Slot
Facilitator Demographic Description
Conference Room 107
EO Office
11147
8:00 – 8:30 Tag‐up – Alma, Alan, Barbara, Jo Ann, Alan
X
Tuesday 8/14
8:30 ‐ 9:30 am Alma/ Alan Senior Leadership X 10:00 ‐ 11:00 am Alma/ Alan Supervisors X 11:00 ‐ 12:30 pm Break 12:30 ‐ 1:30 pm Alan
Alma
Whites (Males & Females)
People of Color (Males& Females)
X
X
1:30 – 1:45 pm Break 1:45 ‐ 2:45 pm Alma/ Alan Leads X 3:00 ‐ 4:00 pm Alan
Alma
Males
Females
X
X 4:15 ‐ 4:45 pm Debrief : Alma,
Barbara, Jo Ann, Brian
X
Wednesday
8/15
8:30 ‐ 9:30 am Alma/ Alan Age: under 40 X 10:00 ‐ 11:00 am Alma/ Alan Age: over 40 X 11:00 ‐ 12:30 pm Break 12:30 ‐ 1:30 pm Alma/ Alan More than 10 yrs. X 1:30 ‐ 2:00 pm Break X 2:30 ‐ 3:30 pm Alma/ Alan Less than 10 yrs. 4:15 ‐ 4:45 pm Debrief : Alma,
Alan, Barbara, Jo Ann, Brian
X
Thursday
8/16
9:00 – 10:00 am Alma Contractor Directors
X
2:00 – 2:30 pm Debrief with Director
X