job satisfaction and promotions satisfaction.pdfliterature review and background understanding job...
TRANSCRIPT
Job Satisfaction and Promotions
Vasilios D. Kosteas
Abstract This paper estimates the impact of promotions and promotion expectations on job satisfaction using the 1996-2006 waves of the NLSY79 dataset. Having received a promotion in the past two years increases the probability a worker will be very satisfied with her work by ten percentage points. This result holds while controlling for the worker’s current wage, wage relative to her peer group and her lagged wage. Thus, the effect of promotion receipt on job satisfaction is independent from any accompanying wage increase. This finding indicates that employers may be able to use promotions as another mechanism to raise worker satisfaction. Workers who believe a promotion is possible in the next two years also report higher job satisfaction. Furthermore, the effect of promotion receipt and promotion expectations does not depend on whether the respondent believed a promotion was possible over the past two years. These results suggest that the effect of promotions on job satisfaction does not depend on fulfilling the worker’s expectations. Employers may be able to raise job satisfaction by maintaining the belief that a promotion is possible, even if that promotion does not materialize, suggesting that perceived fairness in promotion processes may play a large role. These results are robust to dynamic panel estimation techniques accounting for potential endogeneity of the promotion variables. JEL: J28 Keywords: promotions, job satisfaction, expectations
1
Job satisfaction has received significant attention from economists in recent years. Part
of the interest in job satisfaction is due to the correlation between satisfaction and employee
behavior. More satisfied workers are less likely to leave their employer (Clark 2001, Shields and
Ward 2001, Pergamit and Veum 1989, Akerloff et al 1988, McEvoy and Cascio 1985, Freeman
1978), have lower rates of absenteeism (Clegg 1983) and have higher productivity (Mangione
and Quinn 1975). In this context, reported job satisfaction can be seen as a revelation of
workers’ preferences over jobs. Workers reporting a high degree of satisfaction with the job are
signaling their preference for the current job, which is also exhibited in the lower quit rates of
highly satisfied workers. In the absence of more direct measures, job satisfaction provides the
closest proxy for the utility individuals derive from their employment. Understanding the
determinants of economic wellbeing is a key concern of economic science, and job satisfaction is
a key facet of overall wellbeing.
Promotions are also an important aspect of a worker’s career and life, affecting other
facets of the work experience. They constitute an important aspect of workers’ labor mobility,
most often carrying substantial wage increases (Kosteas 2009, Blau and DeVaro 2007, Cobb-
Clark 2001, Francesconi 2001, Pergamit and Veum 1999, Hersch and Viscusi, 1996, McCue
1996, Olson and Becker 1983 and others) and can have a significant impact on other job
characteristics such as responsibilities and subsequent job attachment (Pergamit and Veum
1999). Firms can use promotions as a reward for highly productive workers, creating an
incentive for workers to exert greater effort. Promotions will only be an effective mechanism for
eliciting greater effort if workers place significant value on the promotion itself. Otherwise,
2
firms would simply use pay increases to reward effort and productivity.1 Given all of the
dimensions in which promotions can affect workers’ careers and compensation, relatively little
attention has been paid to the importance of promotions as a determinant of job satisfaction.
While several studies have investigated the determinants of job satisfaction, relatively
little attention has been paid to the role of promotions and promotion expectations. Tournament
theory postulates that firms use the prospect of a promotion as an incentive for workers to exert
greater effort. This paper estimates the effect of a promotion and promotion expectations on job
satisfaction using the 1996-2006 waves of the National Longitudinal Surveys of Youth 1979
cohort (NLSY79).
Estimating the effect of both promotions and promotion expectations on job satisfaction
helps us to understand the importance of promotions as a mechanism for eliciting greater effort
from workers. Specifically, finding that promotions lead to greater job satisfaction, even after
controlling for wages and wage increases, supports the notion that workers value the promotion
in and of itself. This gives firms a non-pecuniary tool for extracting effort and other positive
behavior from their workers. Accurate estimates of these effects provide an indication of how
effective promotions might be in eliciting effort. Furthermore, promotion expectations can also
play a powerful role. Workers who realize they are not going to win a promotion this time
around may decrease work effort, unless they believe they are still in the hunt for a future
promotion.
Controlling for wages and other firm and individual characteristics, we find that a
promotion increases the probability a worker will be highly satisfied with her job by a full ten
percentage points; approximately equal to the effect of a fifty percent wage increase. This
1 Of course, promotions also serve to place individuals into different jobs, where their skills can be used to greater effect. However, not all promotions carry an increase in supervisory responsibilities or significant changes in tasks, indicating that promotions may also serve other functions.
3
finding indicates that workers value the promotion itself, above and beyond the wage increase
that normally accompanies a promotion. Thus, promotions may be more cost effective than
wage increases in keeping workers happy. Promotion expectations also affect job satisfaction;
workers who believe a promotion is possible in the next two years are more likely to be highly
satisfied. Furthermore, we find that past promotions continue to have an impact on job
satisfaction; however, the effect fades over time. Finally, it does not appear that expectations can
explain the gender premium in job satisfaction (women report higher job satisfaction, ceteris
paribus). Promotion receipt had the same effect on job satisfaction for workers who believed a
promotion was possible in the next two years as for those who did not believe a promotion was
possible. These results are robust under various cuts of the data and when dynamic panel
estimation is used to control for the potential endogeneity of the promotion and promotion
expectations variables.
The rest of the paper is organized as follows. Section two provides the theoretical
background, discusses the literature and develops the empirical model. Section three describes
the dataset and provides summary statistics while section four presents and discusses the results
of the estimation. Finally, section five draws conclusions from the paper’s findings and
discusses avenues for future research.
Literature review and background
Understanding job satisfaction is important because of the correlation between job
satisfaction and employee behaviors (such as absenteeism, quit intentions and productivity) cited
in the introduction. Self-reported job satisfaction is also one of the few measures of worker well-
being available to researchers, and may be the best proxy for the utility from working available
4
to social scientists. Our conceptual model accounts for this relationship. Following Clark and
Oswald (1996), job satisfaction is represented through a sub-utility function (u), where overall
utility (v) is a function of job satisfaction and non-work related variables (µ). This gives us v =
v(u,µ), where the non-work related variables may reflect health and family characteristics. The
utility from working takes the form
u = u(y,h,i,j), (1)
where y is income from work, h are the hours worked, i is a vector of individual characteristics
and j is a vector of job/workplace characteristics. The individual characteristics include factors
such as education, age, ability, marital status, gender and race. The firm/employment
characteristics include tenure, union membership and firm size measures. Using the 1977 and
1973 Quality of Employment Surveys, respectively, Idson (1990) and Scherer (1976) both find a
negative correlation between establishment size and job satisfaction. This correlation can be (at
least partly) attributed to differences in the structure of work across plants of varying size. Since
promotion rates are positively correlated with plant size, it is important to include controls for the
latter.
Viewing the literature on job satisfaction in the broader context of life satisfaction or
happiness suggests other variables are crucial for a well-specified empirical model. The
literature on happiness has shown that well-being depends on relative, rather than absolute
income, and that the effects of income growth are fleeting. These findings have also come
through in the job satisfaction literature, showing that relative wages can be equally or more
important to worker satisfaction than absolute income (Brown et al 2008, Cappelli and Sherer
1988, Clark and Oswald 1996, and others). Hammermesh (2001) finds that earnings shocks have
a significant impact on satisfaction, however the effect is temporary. The first observation is
5
important since any empirical model investigating the effects of promotions on job satisfaction
must accurately account for earnings. It also suggests a mechanism through which promotions
might affect employee satisfaction: promotions raise the worker to a higher position relative to
those who do not receive one. We may expect that people derive satisfaction not only from
having a higher income relative to their peers, but also higher rank, among other things. The
latter finding is also informative; we ask whether the effects of a promotion on job satisfaction
are transitory. Therefore, the basic specification also includes the individual’s relative wage.
Another specification includes a lagged promotion variable to capture whether the effects of a
promotion are transitory, permanent or fading over time. The augmented model also controls for
the lagged promotion beliefs.
Clark (1997), Sousa-Poza and Sousa-Poza (2003) and Long (2005) emphasize the
importance of expectations in job satisfaction. All three papers find evidence supporting the
hypothesis that part of the difference in job satisfaction between men and women (the latter
report higher job satisfaction) is due to the fact that women have lower expectations. Long’s
study finds the gender difference only holds for less-educated workers in Australia. None of
these studies, however, directly controls for expectations. Stutzer (2004) finds that individuals
with higher income aspirations have lower life satisfaction. We can extend this logic to
promotion expectations as well. Our sample shows that men have greater promotion
expectations. The rate at which men report a promotion is possible is 62.6 percent, as opposed to
53.7 percent for women. However, men and women are equally likely to report having received
a promotion. Thus, men are more likely to have unfulfilled expectations regarding promotions.
We test for the importance of unfulfilled expectations by estimating the augmented model
6
separately for individuals who believed a promotion was possible and those who did not believe
it was possible.
As an indirect measure of the link between job satisfaction and future quits, a couple of
papers have also investigated the importance of satisfaction with advancement opportunities on
future job attachment, with mixed results. Clark (2001) finds that both satisfaction with pay and
job security are the most important job satisfaction categories for determining future quits, while
satisfaction with promotion opportunities is not a significant factor. Using cross-sectional data
on British nurses, Shields and Ward (2001) find that dissatisfaction with promotion and training
opportunities have a stronger effect on intentions to quit than dissatisfaction with workload or
pay. Shields and Ward also find that nurses who report promotion prospects as the most
important work characteristic do not have significantly different job satisfaction than those who
report other employment characteristics as most important.
There are only a couple of papers estimating the impact of promotions on overall job
satisfaction. Using data from the 1989 and 1990 waves of the NLSY, Pergamit and Veum
(1989) find a positive correlation between promotions and job satisfaction. However, their
empirical model only controls for promotions and the type of job change. Francesconi (2001)
analyzes the effects of promotions on changes in job satisfaction using British household data.
To my knowledge, the current paper is the only one to conduct a comprehensive study on the
relationship between job satisfaction and promotions using US data. It is also the first paper to
consider the importance of promotion expectations and how these expectations may affect the
relationship between promotion receipt, or lack thereof, and job satisfaction. De Souza (2002)
estimates the effect of promotions on worker satisfaction, focusing on promotion satisfaction in a
small sample of managers. De Souza finds that managers who received a promotion are more
7
satisfied with promotion opportunities and have greater promotion expectations for the future.
De Souza also considers other aspects of employee satisfaction, but does not analyze overall job
satisfaction.
Data and variable construction
We use the 1996-2006 waves of the National Longitudinal Surveys of Youth 1979
(NLSY79). The individuals in the survey were 14 to 22 years of age in 1979, so that the full
sample consists of individuals in their thirties and forties. Inclusion of the lagged promotion,
promotion belief and wage variables leads to a loss of one additional observation per respondent
and as a result, the estimation uses information on job satisfaction from 1998-2006. Information
on job satisfaction and promotions is available for 30,379 individual-year observations over that
time frame. However, observations are excluded if any of the dependent variables are missing,
the respondent worked fewer than 1,500 hours in the past calendar year, or the reported real
hourly wage was less than five or greater than two-hundred and fifty dollars per hour. The hours
and wage restrictions leads to an additional loss of 3,318 observations.2 The final sample
contains 18,364 observations on 5,388 individuals.
There is a single job satisfaction variable, which records the respondent’s overall job
satisfaction and takes four possible values: 0 (very unsatisfied), 1 (somewhat unsatisfied), 2
(somewhat satisfied) and 3 (very satisfied). Approximately ninety-three percent of the
observations in the final sample record workers being satisfied with their job (see table 1). There
is a fairly even split between those who are somewhat and those who are very satisfied. Thus, an
alternative approach is to construct an indicator variable for whether the respondent is very
2 Estimates including individuals who do not meet the annual hours worked and wage range criteria yield similar results. Indeed, results using various subsets of regressors, with larger sample sizes, all yield similar results for the promotion variables.
8

satisfied with her job. We use this indicator variable as the dependent variable when fitting the
model using the probit estimator.
The promotion variable comes from a series of questions which ask the respondents
about job changes. First, each respondent is asked whether she has experienced a position
change with her current/most recent employer in the past two years. If she replies in the
affirmative, she is also asked whether this position change was a promotion, demotion, or at the
same level. The promotion variable takes a value of one if the respondent reports a position
change that is a promotion and zero otherwise (including if she reports no position change). We
could also construct a demotion variable, however, demotions are rare, occurring only once per
thousand observations.
The dataset also contains information on promotion expectations. Respondents are asked
whether they believe a promotion is possible in the next two years. Using this information, we
create a promotion belief variable that takes a value of one if the respondent believes a
promotion is possible, and zero if she does not. We also create a lagged promotion expectations
variable, by taking the promotion expectation variable from the previous observation for that
individual. If the sample contains consecutive observations for an individual, so that there are
two years between the observations, then the promotion receipt variable and the lagged
promotion expectations variable will cover the same period of time.
The dataset also contains information on the highest grade completed by the individual at
the time of the interview. Past research on job satisfaction has shown that more highly educated
workers have lower job satisfaction; with the proposed explanation that more highly educated
workers have greater expectations and are therefore more likely to be disappointed. Given these
findings, it is important to control for educational attainment. However, we should consider the
9
possibility that the relationship is nonlinear. Therefore, instead of simply including a single
schooling variable, we create three dummy variables for educational attainment. The first
variable takes a value of one if the respondent completed 13-15 years of school and zero
otherwise, representing individuals with more than a high school education but who have not
completed college. The second variable represents college graduates, taking a value of one if the
individual completed sixteen years of school and zero otherwise. Finally, the third variable takes
a value of 1 if the respondent reports having completed more than sixteen years of school and
zero otherwise. Those with a high school education or less make up the excluded group in the
empirical model.
The literature suggests the empirical model should control for three income variables:
own income, relative income and past income. The data contain information on the hourly wage,
which is converted into 2006 dollars by using the CPI deflator. The lagged wage is created by
taking the respondent’s hourly wage from the previous observation that is available for that
individual. Both of these wage variables are included in logarithmic form. Rather than the
comparison group wage, the estimation uses the difference between the individuals log hourly
wage and the log of the average wage for that individual’s comparison group. The comparison
groups are created by grouping workers according to eleven broad occupation categories, four
age groups (less than 37, 37-39, 40-42 and greater than 42 years of age), and four education
groups (high school or less, some college, college and college plus- more than four years of
college). The mean hourly wage is constructed for each of these groups for each year of the
sample, generating 545 out of 880 possible comparison groups.3 The relative wage is then
constructed as the difference between the log hourly wage and the log of the comparison group
3 There are 880 possible comparison groups (11x4x4x5). However, some groups will not contain any observations. For instance, we are unlikely to find many workers with more than a college degree who are manual laborers.
10
mean hourly wage. Alternatively, we could have constructed the relative wage by estimating a
Mincerian wage equation and estimating wage residual using the parameter estimates. Both
approaches have been used in the literature, to similar effect.
The job satisfaction literature has established that women generally report greater job
satisfaction than men with equivalent characteristics. One potential explanation for this
observation is that dissatisfied women are more likely to quit than men, since the latter are still
more likely to be the primary income earner in the household. Clark (1997) tests this assertion
by estimating a Heckman selection model, and fails to find sample selection to be a significant
factor. An alternative explanation is that men have greater expectations over various aspects of
their work and careers, including promotion potential, therefore they run a greater risk of being
disappointed when their expectations are not met. We can test this assertion by either including
an interaction term between the promotion expectations variable and the female indicator
variable, or by estimating the model separately for men and women.
Other key variables include the Armed Forces Qualifying Test (AQT) percentile score,
which was administered to all individuals participating in the NLSY79. The variable is reported
as the percentile, taking values between zero and one-hundred. Job tenure on the current or most
recent job (the one for which all data is collected) is reported in years. There is an indicator
variable which takes a value of one if the individual was a member of a union or employee
association and zero otherwise. There are also two firm size variables. The first is a dummy
variable which takes a value of one if the firm has multiple locations and zero otherwise. The
second records the number of employees at the respondent’s location (as opposed to the total
number of employees at the firm across all locations). There are also indicator variables for
gender and race (black and Hispanic).
11
Table 1 provides the response frequencies for the job satisfaction variable for the full
sample as well as by gender and separately for blacks and non-blacks. In every case, in over
ninety percent of the observations, respondents report being either somewhat or very satisfied
with their job. They report being very unsatisfied less than two percent of the time. Contrary to
other studies, the breakdown by gender shows highly similar levels of job satisfaction for men
and women (columns 2 and 3 respectively). In contrast, the results by race show a difference in
job satisfaction between blacks and non-blacks, with the latter reporting higher levels of job
satisfaction. A t-test rejects the equality of means between the two samples separated by race.
Table 2 presents the summary statistics for the full sample and by whether the individual
is highly satisfied with her job. The mean job satisfaction value is roughly 2.4, reflecting the
frequencies reported in table 1. Individuals report receiving a promotion in the past two years in
seventeen percent of the observations, and believe a promotion is possible in the next two years
nearly fifty-nine percent of the time. The average hourly wage (in 1996 dollars) is 20.63 while
the average hours worked in the calendar year prior to the interview were 2,329. Roughly
twenty-five percent of the observations are on individuals who attended some college, while 13.2
percent were for those who completed four years of college. Ten percent of the observations are
on people with more than four years of college. The respondents in the sample range in age from
31 to 49 years, with an average age slightly under forty years, while the average tenure on the
current/most recent job is 7.3 years. Unionization is potentially important, as 18.2 percent of the
observations involve union members. In terms of firm characteristics, the average number of
employees at the respondent’s location is 1,189, while individuals report their firm has multiple
locations in 71.2 percent of the sample.
12
Table 2 also provides summary statistics for the sub-samples based on whether the
individual reports being very satisfied with work. A few key differences between the two groups
stand out. First, very satisfied workers are promoted with higher frequency, but do not hold
higher expectations over future promotion possibilities. They earn a higher hourly wage, but
have similar annual hours of work, on average. Finally, a larger fraction of the sample of very
satisfied workers have completed more than sixteen years of school, relative to those who are not
highly satisfied. Surprisingly, we do not see a substantial difference in the average job tenure
between the two groups, with the not-very-satisfied workers having somewhat higher average
job tenure (8.5 versus 7.07 years).
Results and discussion
Table three presents the results of the basic specification. The model is estimated using
OLS, fixed effects (FE) and ordered probit estimators with job satisfaction as the dependent
variable. A fourth set of results is obtained using the probit estimator with an indicator variable
for whether the respondent was very satisfied with her job as the dependent variable.
Coefficients and standard errors are reported for the OLS and FE estimates, while the marginal
effect on being highly satisfied and corresponding standard errors are reported for the ordered
probit and probit models. As a robustness check, the model was estimated only using
observations where the individual did not change employers since the last interview, yielding
highly similar results.
Each of the four estimators yields similar results for the promotion variable. The OLS
and FE estimators both show that receiving a promotion raises job satisfaction by 0.12 units, on
average. According to the FE estimates, receiving a promotion has nearly the same impact on
13
job satisfaction as a fifty percent increase in the hourly wage. Promotion belief has a similar
effect on job satisfaction; workers who believe a promotion is possible in the next two years have
a 0.124 point higher job satisfaction score. Contrary to expectations and previous research, the
estimates indicate that having a higher wage relative to the comparison group results in lower job
satisfaction. Similar results are obtained when the comparison group average wage is included
in place of the difference from the comparison wage. The negative sign persists even after
including occupation indicators (results not presented here), however in that case the coefficient
on the wage difference is not statistically significant. This suggests the comparison wage is
capturing some aspects of worker’s occupation that also affects job satisfaction.
Other variables, for the most part, have the predicted signs. In the OLS estimates, more
educated workers are less satisfied with their jobs. However, this effect does not persist in the
FE estimates. Part of the difference is due to the lack of precision for these coefficient estimates,
which is likely due to the fact that there is relatively little change in educational attainment for
workers in their thirties and forties (recall that the mean age in the sample is just below forty
years). However, there is also a marked difference in the coefficient estimates themselves,
supporting the hypothesis that educational attainment may be correlated with unobservable, time-
invariant characteristics which also affect job satisfaction. Thus, it appears that more educated
workers are less satisfied with their jobs, but it does not appear that becoming more educated
leads to lower job satisfaction. Workers with higher ability are less satisfied with their jobs;
again this may be due to unfulfilled expectations. Older workers are more satisfied with their
jobs, while satisfaction appears to initially decline with job tenure and then rise. According to
the OLS estimates, union members have lower job satisfaction. However, the FE results show
that people who become union members also have a corresponding increase in satisfaction,
14
although the coefficient is only significant at the ten percent level. The OLS results show that
workers in larger firms are less satisfied with their jobs, corroborating findings from previous
research. However, the coefficients on the firm size variables are no longer significant in the FE
model. Finally, women and Hispanics are more satisfied with their work, ceteris paribus, while
blacks are less satisfied.
The marginal effects from the probit models have a slightly different interpretation; they
represent the effect of the independent variable on the probability a person will be highly
satisfied with he job. In the probit and ordered probit models, receiving a promotion is
associated with a 9.2 and 10.1 percentage point increase in the probability a worker will be
highly satisfied with her job. Promotion belief continues to affect job satisfaction; however the
effect is smaller than the estimates using the OLS and FE models. Again, it appears that a
promotion has the same effect on job satisfaction as a roughly fifty percent increase in the hourly
wage. The estimates for the remaining variables are similar to those using the least squares
models.
Next, we ask whether the effect of a promotion on job satisfaction is fleeting, and
whether promotion expectations affect this relationship. Table four presents the results of the
augmented model fitted using ordered probit estimation. Again, the marginal effect is reported
with the standard errors in parentheses. The results show that lagged promotions (those reported
in the previous interview, in most cases conducted two years earlier, so that the lagged
promotions were received three to four years ago) continue to have a positive correlation with
job satisfaction. However, the effect is much smaller; a promotion received three to four years
ago (column 2) only leads to a 2.5 percentage point increase in the probability of having very
high job satisfaction. Thus, it appears that the effect of promotions is fading. This finding
15
reinforces previous research which has found that increases in income have only a temporary
effect on life and job satisfaction. Finally, we estimate the augmented model separately for
workers who in the previous interview reported that they believed a promotion would be possible
in the next two years (column 4) from those who did not (column 3). In both cases, receiving a
promotion is associated with a higher probability of being very satisfied with work. The effect is
slightly larger for those who did not believe a promotion was possible; however, the difference is
not substantial. Interestingly, lagged promotions only continue to have a positive impact on job
satisfaction on workers who believed another promotion would be possible in the next two
years.4 Overall, these findings suggest that expectations do not have a significant impact on the
relationship between promotion receipt and job satisfaction.
Arellano-Bond dynamic panel estimates
The estimation used up to this point has assumed the promotion variables are exogenous.
However, it is possible that the promotion variable is correlated with unobserved factors which
can also affect job satisfaction, or that a higher degree of job satisfaction raises the probability of
a promotion. For example, a worker who is more satisfied with his work may be more likely to
put in greater time and effort at work. While we can control for hours worked, we do not have
any measures for work effort. Alternatively, job satisfaction may increase as an individual
becomes more adept at his job; people tend to enjoy doing things at which they excel. This
increase in ability is also likely to raise the chances of receiving a promotion. The Arellano-
Bond (AB) estimator controls for this potential endogeneity by taking advantage of the data’s
panel structure.
4 Estimating the model by pooling the observations for these two groups and including an interaction term between promotion receipt and lagged promotion expectations does not yield a statistically significant coefficient on the interaction term.
16
I will briefly describe the AB estimator; readers interested in a more detailed description
should see Arellano and Bond (1991). The AB estimator takes into account the potential serial
correlation of the error terms when the lagged value of the dependent variable is included as a
regressor: itititit xycy εγβ +++= −1 , where xit is a vector of explanatory variables. The AB
estimator first differences the equation and then uses lagged values of each regressor as an
instrument for that variable. Arellano and Bond also provide a test for the validity of the model
by testing for second order serial correlation in the error terms, which I also use to select the
number of lags for the productivity variable which should be included as regressors.5 The
estimator only makes use of consecutive observations when first differencing the variables. This
feature of the estimator, along with the use of lagged values as instruments leads to a significant
reduction in sample size.
The AB model assumes that the dependent variable depends on its previous values. In
this case current job satisfaction is affected by past job satisfaction, even if working conditions
change. This assumption means that workers’ job satisfaction does not fully adjust to the new
circumstances. This idea is consistent with the findings from the life and job satisfaction
literature (including this paper) that individuals take time to adjust to new circumstances. For
example, a worker may not like his job because he does not like his supervisor. If the supervisor
is fired, the worker may eventually find that he likes the new boss, but still harbors some of the
old dissatisfaction with the job.
The results from the AB estimation are presented in table 5. Columns 1-2 make use of all
available observations, with the latter including the lagged promotion variable as a regressor.
Columns 3 and 4 split the sample according promotion belief. The results in both columns 1 and
5 In each set of estimates, the tests show that only a one-period lag of the job satisfaction variable is needed to make the model valid.
17
2 continue to show a positive correlation between recent promotions (in the past two years) and
job satisfaction. The results in column 1 (which exclude lagged promotion receipt as an
explanatory variable) are highly similar to those obtained when using the FE estimator. They
show that receipt of a promotion in the past two years leads to a nearly 0.095 point increase in
reported job satisfaction, while believing that a promotion is possible raises reported job
satisfaction by 0.124 points. Thus, promotion receipt has the same impact on job satisfaction as
a nearly sixty percent increase in the hourly wage, while belief that a promotion is possible is
equivalent to a roughly seventy-seven percent wage increase. While the relative wage and the
lag wage continue to show a negative correlation with job satisfaction, the coefficients are not
statistically significant. Older workers are more satisfied with their jobs, while job satisfaction
initially declines then rises with job tenure.
The results in column 2 show an even stronger impact of promotion receipt and
promotion expectations on job satisfaction; promotion receipt has the same impact on job
satisfaction as a seventy-five percent wage increase. The estimates continue to show a lingering,
but declining impact of promotion receipt on job satisfaction. Promotions reported during the
previous interview raise current job satisfaction by 0.046 points. In both cases, lagged job
satisfaction has a positive and statistically significant correlation with current job satisfaction,
supporting the hypothesis that job satisfaction does not fully adjust to new circumstances, but is
mean reverting. In both models, tests fail to reject the null hypothesis that the errors exhibit
second degree serial correlation, supporting the empirical models’ validity.
Columns 3 and 4 split the sample into individuals who in the previous interview reported
that they did not believe a promotion was possible and those who did, respectively. In both
cases, promotion receipt and expectations have a positive effect on job satisfaction. The effects
18
are greater for those who did not believe a promotion was possible, suggesting that expectations
play a significant role. Additionally, past promotion receipt only has a positive impact on job
satisfaction for individuals who believed a promotion was possible during that same time period.
Furthermore, the results indicate that job satisfaction only depends on past job satisfaction for
those individuals who did not believe a promotion was possible during their previous interview.
Other variables show both qualitatively and quantitatively similar coefficient estimates for the
two groups.
Given these results, we estimate a model pooling both groups and including interaction
terms between each of the promotion and promotion belief variables and lagged promotion
belief.6 These results generally support the comparisons drawn from the estimates in columns 3
and 4. Lagged job satisfaction has an impact on current job satisfaction only for workers who
reported in the previous interview that a promotion would not be possible over the next two
years. The coefficient on the interaction term between promotion receipt and lagged promotion
belief is positive, but not statistically significant; therefore we can not conclude that promotion
receipt has a stronger effect on job satisfaction if it is unanticipated. The estimates also show
that past promotions have a negative impact on current job satisfaction if the individual did not
believe another promotion would be possible, but a positive one if he did believe another
promotion would be possible. These results lend further support to the theory, supported
elsewhere in the empirical literature, that expectations play a significant role in determining a
workers job satisfaction.
6 We do not include interaction terms with the other variables since the results in columns 3 and 4 do not show significant differences in the coefficient estimates.
19

Job satisfaction and reason for promotion
The NLSY also provides information on the (self-reported) reason for the promotion. Of
particular interest is whether individuals who believe their promotion was performance based or
received because they requested it will see a greater increase in job satisfaction after having
received a promotion. To test for these effects, we include dummy variables indicating whether
the person believed the promotion was performance based or received because the individual
asked for it in addition to the reported promotion receipt variable. Thus, all other reasons for
receiving a promotion serve as the comparison category. These categories are the most
frequently cited reason for receiving a promotion, with nearly sixty-eight percent of people
receiving a promotion reporting that it is due to performance, and roughly sixteen percent saying
it was given because the respondent requested it.
All estimates include the same full set of explanatory variables used in the basic model;
however, for the sake of brevity, only the results for the promotion receipt and belief variables
and the hourly wage are reported. The results, presented in table 6, are mixed. The OLS, probit
and ordered probit models indicate that receiving a promotion has a greater impact on job
satisfaction if the respondent believes she received that promotion based on her performance.
The coefficient continues to be positive in both the fixed effects and AB estimates, but is no
longer statistically significant. Thus it appears that individuals who believe their promotion was
received due to performance also show greater job satisfaction, but the correlation is due to some
other, unobservable individual characteristics.
20
Quits and job satisfaction
The empirical literature cites a strong link between job satisfaction and both quits and
quit intentions. We show that the link between job satisfaction and quits also holds in this
dataset. An indicator variable for quitting the most recent job is created from two other variables.
The respondent is asked whether he/she is currently with the most recent employer listed (which
corresponds to the job information reported in the survey). If the respondent indicates that she is
no longer with the employer, she is asked to state the reason, given the option of selecting
several reasons for quitting. The quit variable takes a value of one if the individual reports that
she is no longer with the most recent employer and indicates that she quit (for any reason) and
zero otherwise. Given the short time frame, we should not expect see a high rate of quits, or of
job separations more generally. In the primary sample, we observe quits in only two percent of
the observations. Removing the hours worked and wage restrictions (which leads to a larger
sample size of 20,967 observations) results in a sample where quits are reported in slightly over
four percent of the observations. Since the hours worked and wage restrictions eliminate a large
fraction of the quits, we estimate the quits equation using both samples. The job satisfaction
variable taking values between one and four is used as a regressor instead of the very satisfied
indicator variable.
The model is estimated using both the probit and logit models, for both samples.
Marginal effects are reported with standard errors in parentheses. The results, presented in table
7, show a strong correlation between quits and both job satisfaction and promotion expectations.
All four models show a negative, highly statistically significant correlation between job
satisfaction and quitting, with the marginal effect ranging between -0.0056 and -0.01; a one point
increase in job satisfaction is associated with upwards of a one percentage point decrease in the
21
probability a worker will quit. This is an economically significant result given the four percent
quit rate observed in the expanded sample. Workers who believe a promotion is possible in the
future are also less likely quit, even after controlling for job satisfaction. Again, worker
expectations are an important determinant of worker behavior. The results also show that job
satisfaction may in fact be the most important determinant of voluntary job separations of all the
explanatory variables included in the model.
The correlation between job satisfaction and quitting may reflect unobservable individual
characteristics; however the fixed effects logit is not a viable alternative in this case since the
vast majority of the individuals in this sample never report having quit their jobs (the total
sample size falls to roughly seven hundred observations). The model was estimated using both
OLS and FE estimation and in both cases, the negative correlation between job satisfaction and
quits persists. In fact, the correlation becomes stronger when moving from the OLS to the FE
estimator, indicating that failure to account for unobserved individual fixed effects biases the
estimates towards zero. Thus, the estimates provided above may actually understate the
importance of job satisfaction in predicting whether workers will quit in the near future.
Conclusions
This paper estimates the effect of promotions and promotion expectations on job
satisfaction. Both receipt of a promotion in the last two years and the expectation that a
promotion is possible in the next two years result in higher job satisfaction, even while
controlling for current and lagged wages. The effect of a promotion is roughly equal to a fifty
percent increase in the hourly wage. Combined with the correlations between job satisfaction
and positive employee behaviors, these results suggest that promotions can be a very effective
22
way for firms to elicit effort from its employees. Additionally, it appears that firms can maintain
a high level of job satisfaction even for workers not receiving a promotion if they can maintain
the worker’s belief that a promotion is possible. These results persist even after applying
Arellano-Bond estimation to account for the potential endogeneity of the promotion receipt and
promotion expectations variable.
The results in this paper are consistent with the empirical literature’s finding that
expectations play an important role in determining a worker’s job satisfaction. The finding that
promotions have a lasting, but diminishing impact on job satisfaction fits with the previous
papers which found that income changes have a temporary effect on job and life satisfaction.
Together, these observations provide strong evidence that people grow accustomed to their
circumstances and require frequent improvements in their economic situation in order to
maintain a high level of satisfaction.
Finally, consistent with previous research, we also found a strong, negative correlation
between quits and both job satisfaction and promotion expectations. In fact, these were the most
important factors in the model in determining whether a worker quit her most recent job by the
time of the survey interview. Taken together, the job satisfaction and quits estimates indicate
that promotions can serve as an important mechanism for employers to keep their workers happy
and to reduce turnover. More research is needed to provide a more thorough and detailed
analysis of the links between worker turnover, promotions and job satisfaction as they relate to
other aspects of the employment relationship, such as benefits and training. Such analyses will
help to shed light on the relative importance workers’ attach to promotions and other job
characteristics.
23

References
Arellano, M. and Bond, S. (1991). Some tests of specification for panel data: Monte Carlo evidence and an application to employment data. Review of Economic Studies 58(2), 277-297. Blau, F. D. and DeVaro, J. (2007), “New Evidence on Gender Differences in Promotion Rates: An Empirical Analysis of a Sample of New Hires”, Industrial Relations, Vol. 46 No. 3, pp. 511-550. Brown, G. D. A., Gardner, J., Oswald, A. J., and Qian, J. (2008). “Does wage rank affect employees’ well-being?” Industrial Relations, Vol. 47, No. 3, 355-389. Cappelli, P. and Sherer, P. D. (1988). “Satisfaction, market eages, & labor relations: an airline study.” Industrial Relations, Vol. 27 No. 1, 56-73. Clark, A. E., Frijters, P., and Shields, M. A. (2008). “Relative income, happiness, and utility: an explanation for the Easterlin paradox and other puzzles.” Journal of Economic Literature, Vol. 46 No. 1, 95-144. Clark, A. E. (2001). “What really matters in a job? Hedonic measurement using quit data.” Labour Economics, Vol. 8, 223-242. Clark, A. E. (1997). “Job satisfaction and gender: Why are women so happy at work?” Labour Economics, Vol. 4, 341-372. Clark, A. E., and Oswald, A. J. (1996). “Satisfaction and comparison income.” Journal of Public Economics, Vol. 61, 359-381. Clegg, C. W. (1983). “Psychology of employee lateness, absence, and turnover: a methodological critique and an empirical study.” Journal of Applied Psychology, Vol. 68 (1), 88-101. Cobb-Clark, D. A. (2001), “Getting ahead: the determinants of and payoffs to internal promotion for young U.S. men and women”, in Polachek, S. W. (Ed), Worker Wellbeing in a Changing Labor Market, Vol. 20, pp. 339-372, JAI Press, New York. Francesconi, M. (2001), “Determinants and consequences of promotions in Britain”, Oxford Bulletin of Economics and Statistics, Vol. 63 No. 3, pp. 279-310. Freeman, R. B. (1978), “Job satisfaction as an economic variable.” American Economic Review, Vol. 68, 135-141. Hammermesh, D. S. (1996). “The changing distribution of job satisfaction.” The Journal of Human Resources, Vol. 36 No. 1, 1-30.
24
Hersch, J. and Viscusi, W.K. (1996), “Gender differences in promotions and wages”, Industrial Relations, Vol. 35 No. 4, pp. 461-472. Idson, T.L. (1990), “Establishment size, job satisfaction and structure of work.” Applied Economics, Vol. 22, 1007-1018. Kosteas, V.D. (2009), “Job level changes and wage growth.” International Journal of Manpower, forthcoming. Long, A. (2005), “Happily ever after? A study of job satisfaction in Australia.” The Economic Record, Vol. 81 No. 255, 303-321. Mangione, T.W. and Quinn, R.W. (1975), “Job satisfaction, counterproductive behavior and drug use at work.” Journal of Applied Psychology, Vol. 60, 114-116. McCue, K. (1996), “Promotions and Wage Growth”, Journal of Labor Economics, Vol. 14 No. 2, pp. 175-209. McEvoy, G. M. and Cascio, W. F. (1985). “Strategies for reducing employer turnover: a meta-analysis.” Journal of Applied Psychology, Vol. 70 (2), 342-353. Olson, C.A. and Becker, B. E. (1983), “Sex discrimination in the promotion process”, Industrial and Labor Relations Review, Vol. 36 No. 4, pp. 624-641. Pergamit, M. R. and Veum, J. R. (1999), “What is a promotion?” Industrial and Labor Relations Review, Vol. 52 No. 4, pp. 581-601. Scherer, F.M. (1976), “Industrial structure, scale economies and worker alienation.” Essays in Honor of Joe S. Bain, (Eds.) R. T. Masson and P. D. Qualls, Ballinger Press. Shields, M. and Ward, M. (2001), “Improving nurse retention in the National Health Service in Enland: the impact of job satisfaction on intentions to quit.” Journal of Health Economics, Vol. 20, 677-701. Souza-Poza, A., and Souza-Poza, A. A. (2003). “Gender differences in job satisfaction in Great Britain, 1991–2000: permanent or transitory?” Applied Economics Letters, Vol. 10, 691–694 Stutzer, A. (2004), “The role of income aspirations in individual happiness.” Journal of Economic Behavior and Organization, Vol. 54, 89-109.
25
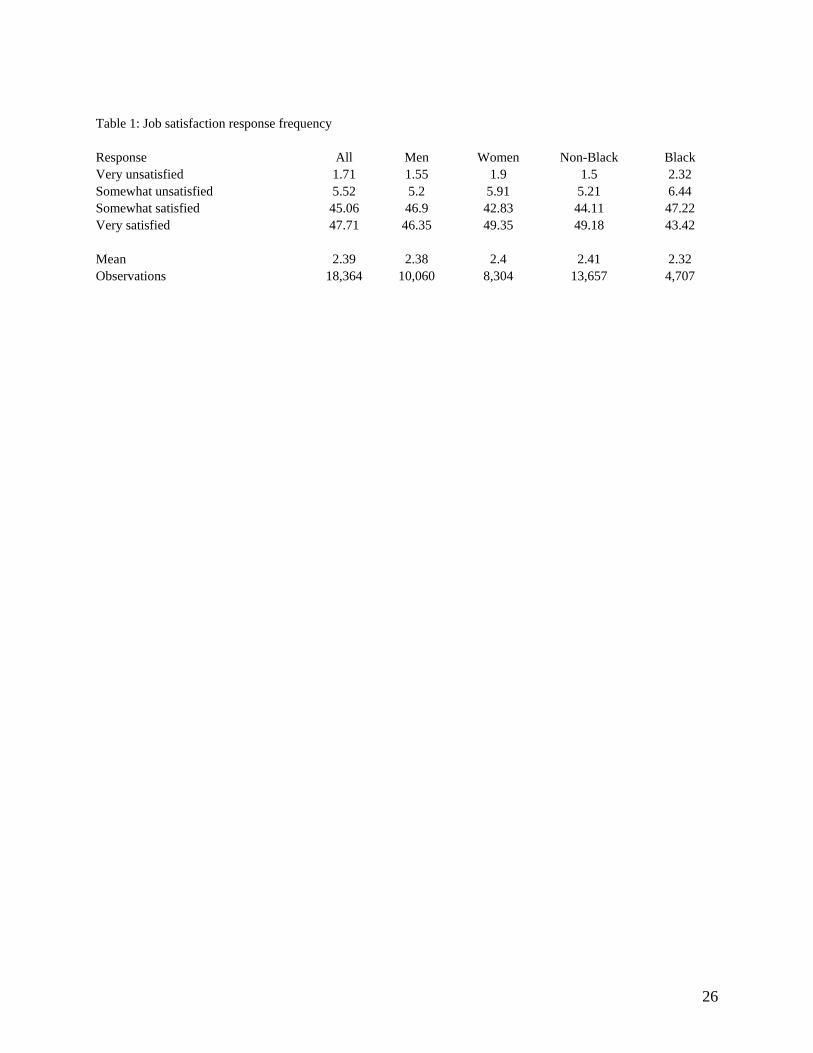
Table 1: Job satisfaction response frequency Response All Men Women Non-Black Black Very unsatisfied 1.71 1.55 1.9 1.5 2.32 Somewhat unsatisfied 5.52 5.2 5.91 5.21 6.44 Somewhat satisfied 45.06 46.9 42.83 44.11 47.22 Very satisfied 47.71 46.35 49.35 49.18 43.42 Mean 2.39 2.38 2.4 2.41 2.32 Observations 18,364 10,060 8,304 13,657 4,707
26
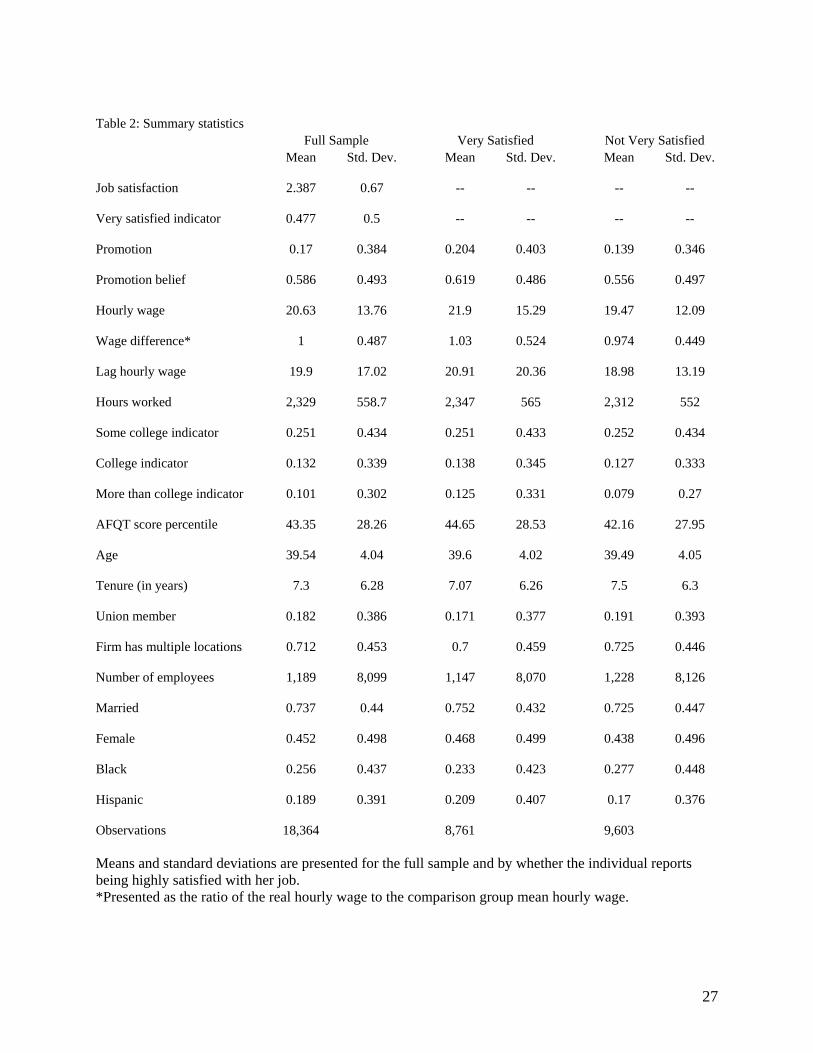
Table 2: Summary statistics Full Sample Very Satisfied Not Very Satisfied Mean Std. Dev. Mean Std. Dev. Mean Std. Dev. Job satisfaction 2.387 0.67 -- -- -- -- Very satisfied indicator 0.477 0.5 -- -- -- -- Promotion 0.17 0.384 0.204 0.403 0.139 0.346 Promotion belief 0.586 0.493 0.619 0.486 0.556 0.497 Hourly wage 20.63 13.76 21.9 15.29 19.47 12.09 Wage difference* 1 0.487 1.03 0.524 0.974 0.449 Lag hourly wage 19.9 17.02 20.91 20.36 18.98 13.19 Hours worked 2,329 558.7 2,347 565 2,312 552 Some college indicator 0.251 0.434 0.251 0.433 0.252 0.434 College indicator 0.132 0.339 0.138 0.345 0.127 0.333 More than college indicator 0.101 0.302 0.125 0.331 0.079 0.27 AFQT score percentile 43.35 28.26 44.65 28.53 42.16 27.95 Age 39.54 4.04 39.6 4.02 39.49 4.05 Tenure (in years) 7.3 6.28 7.07 6.26 7.5 6.3 Union member 0.182 0.386 0.171 0.377 0.191 0.393 Firm has multiple locations 0.712 0.453 0.7 0.459 0.725 0.446 Number of employees 1,189 8,099 1,147 8,070 1,228 8,126 Married 0.737 0.44 0.752 0.432 0.725 0.447 Female 0.452 0.498 0.468 0.499 0.438 0.496 Black 0.256 0.437 0.233 0.423 0.277 0.448 Hispanic 0.189 0.391 0.209 0.407 0.17 0.376 Observations 18,364 8,761 9,603 Means and standard deviations are presented for the full sample and by whether the individual reports being highly satisfied with her job. *Presented as the ratio of the real hourly wage to the comparison group mean hourly wage.
27
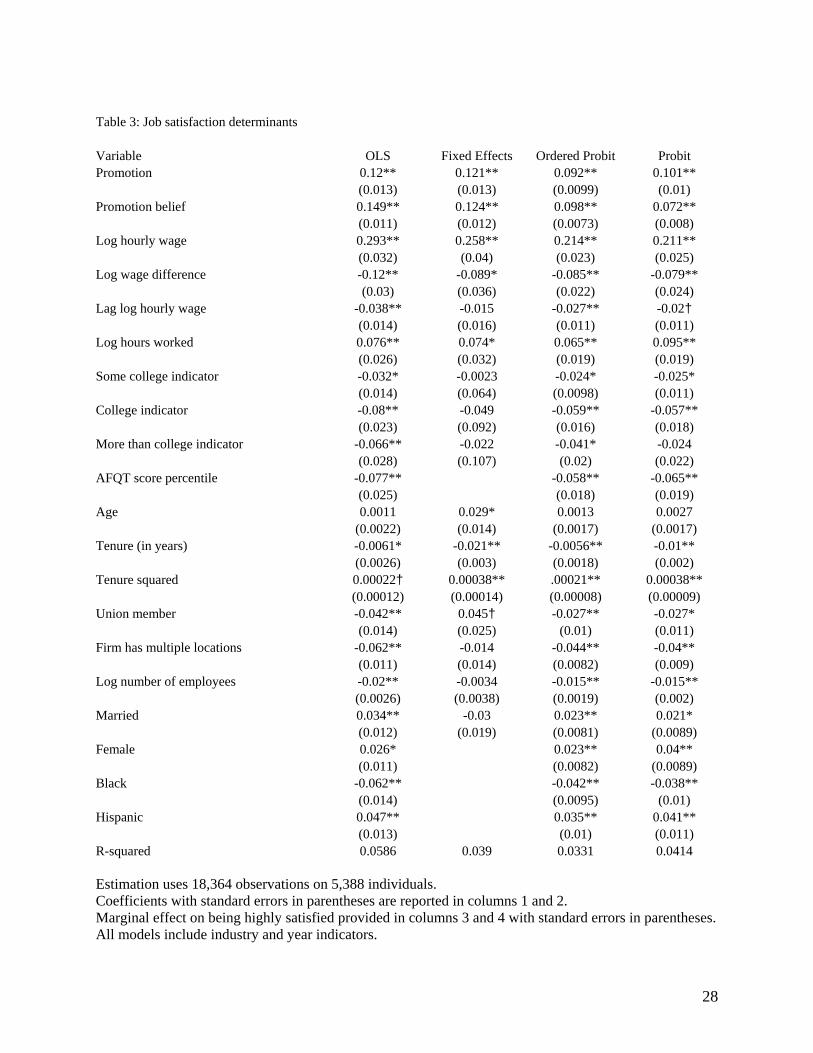
Table 3: Job satisfaction determinants Variable OLS Fixed Effects Ordered Probit Probit Promotion 0.12** 0.121** 0.092** 0.101** (0.013) (0.013) (0.0099) (0.01) Promotion belief 0.149** 0.124** 0.098** 0.072** (0.011) (0.012) (0.0073) (0.008) Log hourly wage 0.293** 0.258** 0.214** 0.211** (0.032) (0.04) (0.023) (0.025) Log wage difference -0.12** -0.089* -0.085** -0.079** (0.03) (0.036) (0.022) (0.024) Lag log hourly wage -0.038** -0.015 -0.027** -0.02† (0.014) (0.016) (0.011) (0.011) Log hours worked 0.076** 0.074* 0.065** 0.095** (0.026) (0.032) (0.019) (0.019) Some college indicator -0.032* -0.0023 -0.024* -0.025* (0.014) (0.064) (0.0098) (0.011) College indicator -0.08** -0.049 -0.059** -0.057** (0.023) (0.092) (0.016) (0.018) More than college indicator -0.066** -0.022 -0.041* -0.024 (0.028) (0.107) (0.02) (0.022) AFQT score percentile -0.077** -0.058** -0.065** (0.025) (0.018) (0.019) Age 0.0011 0.029* 0.0013 0.0027 (0.0022) (0.014) (0.0017) (0.0017) Tenure (in years) -0.0061* -0.021** -0.0056** -0.01** (0.0026) (0.003) (0.0018) (0.002) Tenure squared 0.00022† 0.00038** .00021** 0.00038** (0.00012) (0.00014) (0.00008) (0.00009) Union member -0.042** 0.045† -0.027** -0.027* (0.014) (0.025) (0.01) (0.011) Firm has multiple locations -0.062** -0.014 -0.044** -0.04** (0.011) (0.014) (0.0082) (0.009) Log number of employees -0.02** -0.0034 -0.015** -0.015** (0.0026) (0.0038) (0.0019) (0.002) Married 0.034** -0.03 0.023** 0.021* (0.012) (0.019) (0.0081) (0.0089) Female 0.026* 0.023** 0.04** (0.011) (0.0082) (0.0089) Black -0.062** -0.042** -0.038** (0.014) (0.0095) (0.01) Hispanic 0.047** 0.035** 0.041** (0.013) (0.01) (0.011) R-squared 0.0586 0.039 0.0331 0.0414 Estimation uses 18,364 observations on 5,388 individuals. Coefficients with standard errors in parentheses are reported in columns 1 and 2. Marginal effect on being highly satisfied provided in columns 3 and 4 with standard errors in parentheses. All models include industry and year indicators.
28
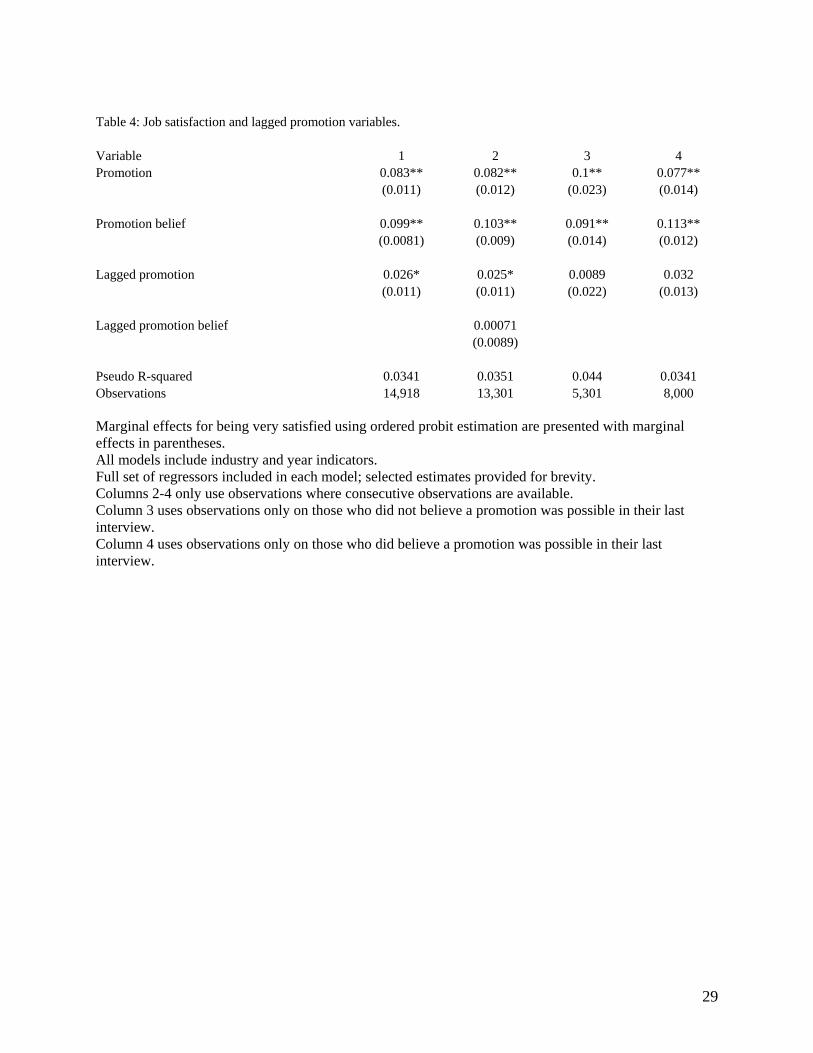
Table 4: Job satisfaction and lagged promotion variables. Variable 1 2 3 4 Promotion 0.083** 0.082** 0.1** 0.077** (0.011) (0.012) (0.023) (0.014) Promotion belief 0.099** 0.103** 0.091** 0.113** (0.0081) (0.009) (0.014) (0.012) Lagged promotion 0.026* 0.025* 0.0089 0.032 (0.011) (0.011) (0.022) (0.013) Lagged promotion belief 0.00071 (0.0089) Pseudo R-squared 0.0341 0.0351 0.044 0.0341 Observations 14,918 13,301 5,301 8,000 Marginal effects for being very satisfied using ordered probit estimation are presented with marginal effects in parentheses. All models include industry and year indicators. Full set of regressors included in each model; selected estimates provided for brevity. Columns 2-4 only use observations where consecutive observations are available. Column 3 uses observations only on those who did not believe a promotion was possible in their last interview. Column 4 uses observations only on those who did believe a promotion was possible in their last interview.
29
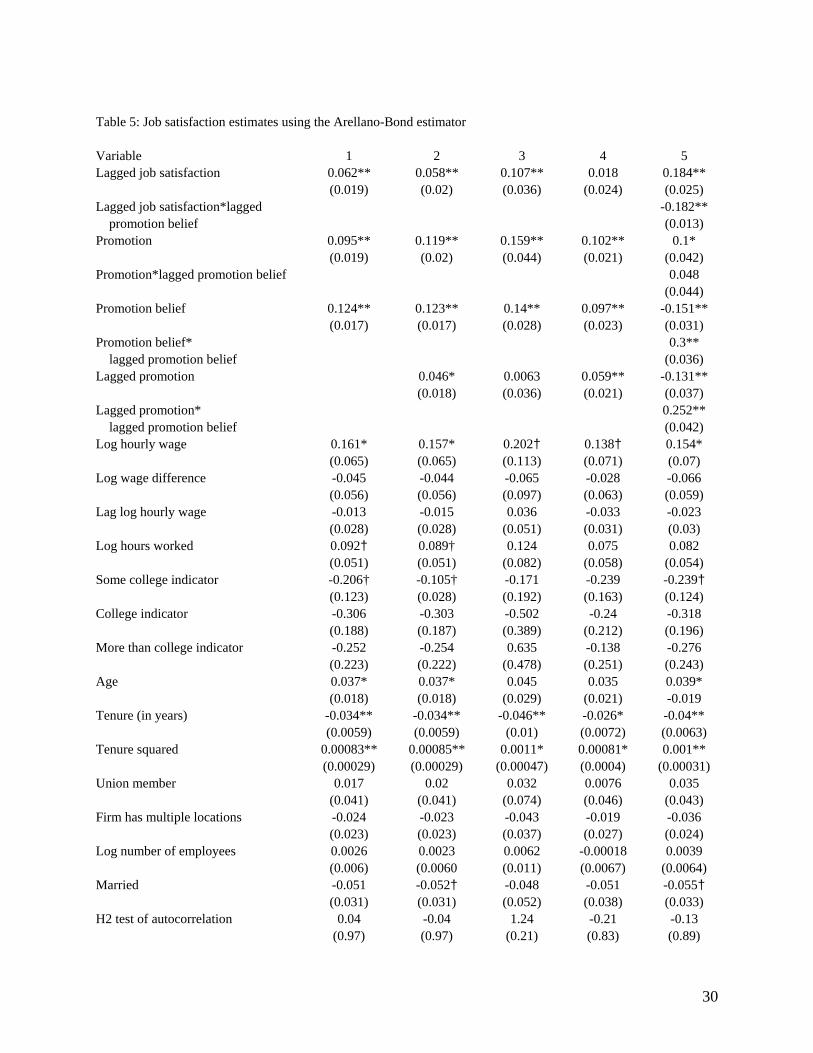
Table 5: Job satisfaction estimates using the Arellano-Bond estimator Variable 1 2 3 4 5 Lagged job satisfaction 0.062** 0.058** 0.107** 0.018 0.184** (0.019) (0.02) (0.036) (0.024) (0.025) Lagged job satisfaction*lagged -0.182** promotion belief (0.013) Promotion 0.095** 0.119** 0.159** 0.102** 0.1* (0.019) (0.02) (0.044) (0.021) (0.042) Promotion*lagged promotion belief 0.048 (0.044) Promotion belief 0.124** 0.123** 0.14** 0.097** -0.151** (0.017) (0.017) (0.028) (0.023) (0.031) Promotion belief* 0.3** lagged promotion belief (0.036) Lagged promotion 0.046* 0.0063 0.059** -0.131** (0.018) (0.036) (0.021) (0.037) Lagged promotion* 0.252** lagged promotion belief (0.042) Log hourly wage 0.161* 0.157* 0.202† 0.138† 0.154* (0.065) (0.065) (0.113) (0.071) (0.07) Log wage difference -0.045 -0.044 -0.065 -0.028 -0.066 (0.056) (0.056) (0.097) (0.063) (0.059) Lag log hourly wage -0.013 -0.015 0.036 -0.033 -0.023 (0.028) (0.028) (0.051) (0.031) (0.03) Log hours worked 0.092† 0.089† 0.124 0.075 0.082 (0.051) (0.051) (0.082) (0.058) (0.054) Some college indicator -0.206† -0.105† -0.171 -0.239 -0.239† (0.123) (0.028) (0.192) (0.163) (0.124) College indicator -0.306 -0.303 -0.502 -0.24 -0.318 (0.188) (0.187) (0.389) (0.212) (0.196) More than college indicator -0.252 -0.254 0.635 -0.138 -0.276 (0.223) (0.222) (0.478) (0.251) (0.243) Age 0.037* 0.037* 0.045 0.035 0.039* (0.018) (0.018) (0.029) (0.021) -0.019 Tenure (in years) -0.034** -0.034** -0.046** -0.026* -0.04** (0.0059) (0.0059) (0.01) (0.0072) (0.0063) Tenure squared 0.00083** 0.00085** 0.0011* 0.00081* 0.001** (0.00029) (0.00029) (0.00047) (0.0004) (0.00031) Union member 0.017 0.02 0.032 0.0076 0.035 (0.041) (0.041) (0.074) (0.046) (0.043) Firm has multiple locations -0.024 -0.023 -0.043 -0.019 -0.036 (0.023) (0.023) (0.037) (0.027) (0.024) Log number of employees 0.0026 0.0023 0.0062 -0.00018 0.0039 (0.006) (0.0060 (0.011) (0.0067) (0.0064) Married -0.051 -0.052† -0.048 -0.051 -0.055† (0.031) (0.031) (0.052) (0.038) (0.033) H2 test of autocorrelation 0.04 -0.04 1.24 -0.21 -0.13 (0.97) (0.97) (0.21) (0.83) (0.89)
30

Number of observations 8,227 8,227 3,223 5,004 7,705 Number of individuals 3,524 3,524 1,991 2,592 3,292 Job satisfaction is the dependent variable. All models control for industry and year effects. Column 3 (4) uses observations only on those who did not (did) believe a promotion was possible in their last interview.
31
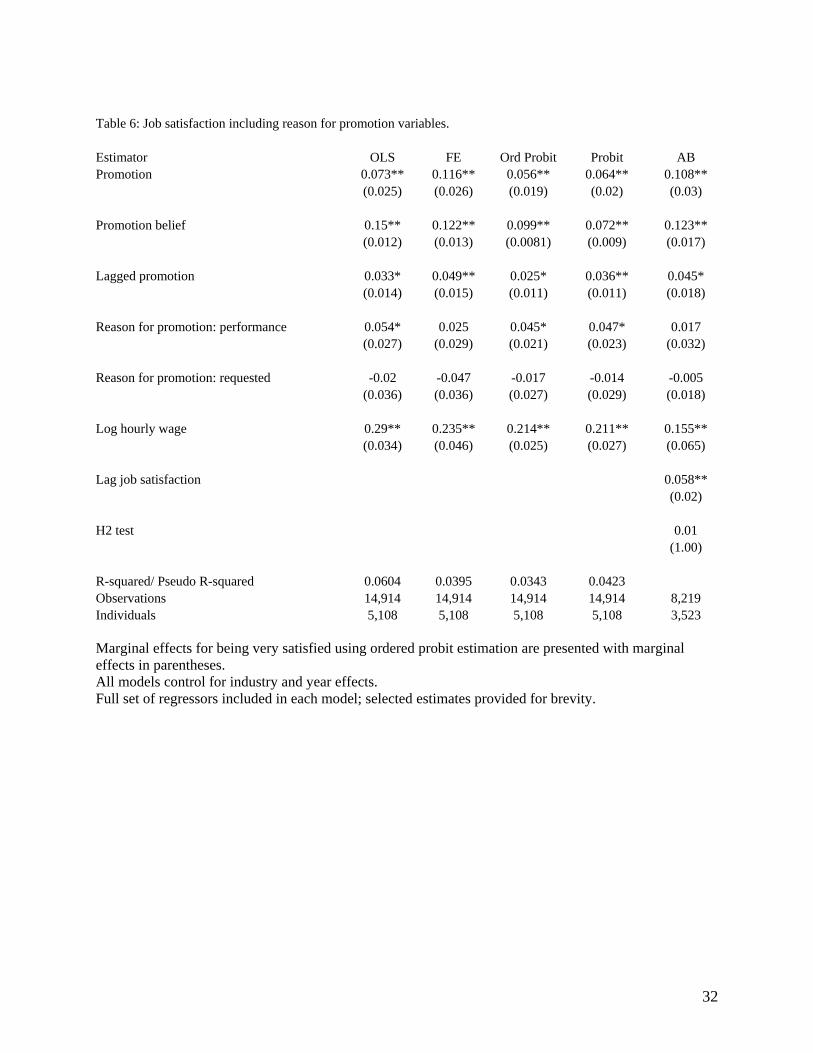
Table 6: Job satisfaction including reason for promotion variables. Estimator OLS FE Ord Probit Probit AB Promotion 0.073** 0.116** 0.056** 0.064** 0.108** (0.025) (0.026) (0.019) (0.02) (0.03) Promotion belief 0.15** 0.122** 0.099** 0.072** 0.123** (0.012) (0.013) (0.0081) (0.009) (0.017) Lagged promotion 0.033* 0.049** 0.025* 0.036** 0.045* (0.014) (0.015) (0.011) (0.011) (0.018) Reason for promotion: performance 0.054* 0.025 0.045* 0.047* 0.017 (0.027) (0.029) (0.021) (0.023) (0.032) Reason for promotion: requested -0.02 -0.047 -0.017 -0.014 -0.005 (0.036) (0.036) (0.027) (0.029) (0.018) Log hourly wage 0.29** 0.235** 0.214** 0.211** 0.155** (0.034) (0.046) (0.025) (0.027) (0.065) Lag job satisfaction 0.058** (0.02) H2 test 0.01 (1.00) R-squared/ Pseudo R-squared 0.0604 0.0395 0.0343 0.0423 Observations 14,914 14,914 14,914 14,914 8,219 Individuals 5,108 5,108 5,108 5,108 3,523 Marginal effects for being very satisfied using ordered probit estimation are presented with marginal effects in parentheses. All models control for industry and year effects. Full set of regressors included in each model; selected estimates provided for brevity.
32
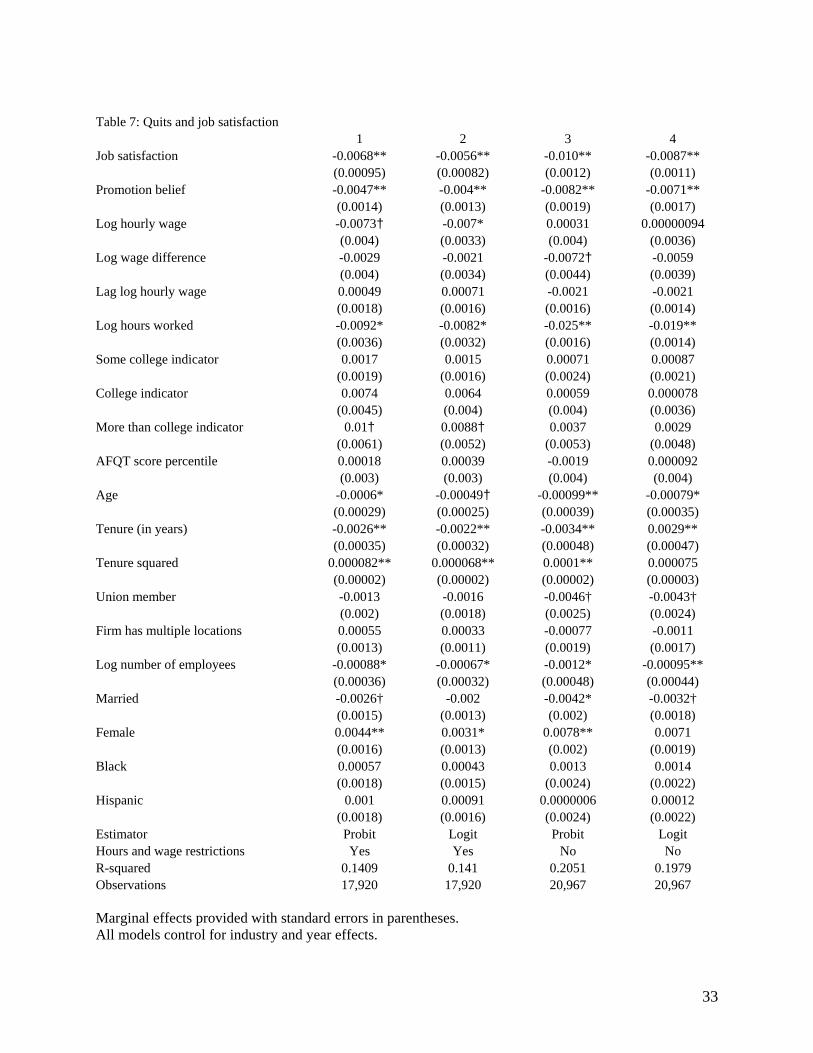
Table 7: Quits and job satisfaction 1 2 3 4 Job satisfaction -0.0068** -0.0056** -0.010** -0.0087** (0.00095) (0.00082) (0.0012) (0.0011) Promotion belief -0.0047** -0.004** -0.0082** -0.0071** (0.0014) (0.0013) (0.0019) (0.0017) Log hourly wage -0.0073† -0.007* 0.00031 0.00000094 (0.004) (0.0033) (0.004) (0.0036) Log wage difference -0.0029 -0.0021 -0.0072† -0.0059 (0.004) (0.0034) (0.0044) (0.0039) Lag log hourly wage 0.00049 0.00071 -0.0021 -0.0021 (0.0018) (0.0016) (0.0016) (0.0014) Log hours worked -0.0092* -0.0082* -0.025** -0.019** (0.0036) (0.0032) (0.0016) (0.0014) Some college indicator 0.0017 0.0015 0.00071 0.00087 (0.0019) (0.0016) (0.0024) (0.0021) College indicator 0.0074 0.0064 0.00059 0.000078 (0.0045) (0.004) (0.004) (0.0036) More than college indicator 0.01† 0.0088† 0.0037 0.0029 (0.0061) (0.0052) (0.0053) (0.0048) AFQT score percentile 0.00018 0.00039 -0.0019 0.000092 (0.003) (0.003) (0.004) (0.004) Age -0.0006* -0.00049† -0.00099** -0.00079* (0.00029) (0.00025) (0.00039) (0.00035) Tenure (in years) -0.0026** -0.0022** -0.0034** 0.0029** (0.00035) (0.00032) (0.00048) (0.00047) Tenure squared 0.000082** 0.000068** 0.0001** 0.000075 (0.00002) (0.00002) (0.00002) (0.00003) Union member -0.0013 -0.0016 -0.0046† -0.0043† (0.002) (0.0018) (0.0025) (0.0024) Firm has multiple locations 0.00055 0.00033 -0.00077 -0.0011 (0.0013) (0.0011) (0.0019) (0.0017) Log number of employees -0.00088* -0.00067* -0.0012* -0.00095** (0.00036) (0.00032) (0.00048) (0.00044) Married -0.0026† -0.002 -0.0042* -0.0032† (0.0015) (0.0013) (0.002) (0.0018) Female 0.0044** 0.0031* 0.0078** 0.0071 (0.0016) (0.0013) (0.002) (0.0019) Black 0.00057 0.00043 0.0013 0.0014 (0.0018) (0.0015) (0.0024) (0.0022) Hispanic 0.001 0.00091 0.0000006 0.00012 (0.0018) (0.0016) (0.0024) (0.0022) Estimator Probit Logit Probit Logit Hours and wage restrictions Yes Yes No No R-squared 0.1409 0.141 0.2051 0.1979 Observations 17,920 17,920 20,967 20,967 Marginal effects provided with standard errors in parentheses. All models control for industry and year effects.
33