job satisfaction and performance in jordanian...
TRANSCRIPT

International Journal of Humanities and Social Science Vol. 5, No. 11; November 2015
110
Job Satisfaction and Performance in Jordanian Banks
Jalal Anwar AlAjlouni
Jordan Abstract
The purpose of this study is to investigate the relationship between Job Satisfaction and performance in Jordanian banks. To achieve this, the researcher developed questionnaires which consisting of (55) items. The sample of the study consisted of 20 Jordanian banks. 120 respondents were obtained from the study sample. After the researcher collected the data obtained from of the study sample, the proper statistical procedures were performed on the data. The results of the study indicate the following: There was a significant positive correlation ( = 0.05) between the job satisfaction and performance.
Introduction
The banking sectors especially in Jordan, have witnessed significant changes over the past few years. These changes are supposed to affect their profitability greatly. In addition, banks have become increasingly concerned about controlling and analyzing their costs and revenues, as well as measuring the risks taken to produce Acceptable returns. In order to do that highly satisfied work force is an absolutely necessity for achieving a high level of performance advancement. Satisfied worker leads to extend more effort to job performance, then works harder and better. Thus every bank tries to create a satisfied work force to operate the well- being of the bank. However, the total performance depends on efficient and effective performance of individual employees. Therefore, every bank places a considerable reliance on their individual employee performance to gain high productivity. Employee effort is an important factor that determines an individual performance will be. When an employee feels a satisfaction about the job, he/she is motivated to do grater effort to the job performance. Then it tends to increase the overall performance of the bank. In other words, a satisfied individual employee and his effort and commitment are crucial for the successfulness of the bank.
Significance of the Study
The importance of this study emerges from the fact that Job Satisfaction is one of organizational success conditions, and it is an instrument which used to achieve creative distinguished companies and to generate competitive advantages as banks are considered to be an important part in Jordanian economy. So the research will attempt to answer the following questions: Is the job satisfaction exists in the Jordanian banks? And if it exists what is the effect of this job satisfaction on the financial performance of Jordanian banks?
Problems of the study
Banking sector as any other sectors has its importance in Jordan. So we need to know more about Job Satisfaction and how Job Satisfaction affecting their performance. Therefore, this study will attempt to answer the following questions:
1. What is job satisfaction? 2. Does job satisfaction exist in Jordanian banks? 3. What is the effect of job satisfaction on the bank financial performance?
Hypotheses of the Study
H1: Does job satisfaction exist in Jordanian banks?
H2: The greater the bank job satisfaction, the stronger the bank’s financial performance.

ISSN 2220-8488 (Print), 2221-0989 (Online) ©Center for Promoting Ideas, USA www.ijhssnet.com
111
Population and sample
The population for this study consisted of (20) Jordanian bank (120) respondents were obtained from top managers. Each one had at least three years of working experience in that bank. To achieve the study goals, the researcher choose the study sample randomly. The advantages of this sample are most efficient among all probability designs, and more representative.
Instrument
In the early stages of the proposal of the study, the researcher used the framework developed by Denison and his colleagues. This framework has developed an explicit model of organizational culture, effectiveness and a validated method of measurement Denison and colleagues showed that four different cultural traits (mission, consistency, adaptability and involvement) were related to different criteria of effectiveness. The researcher used some standards that considered to be important from the literature such as the relationship between managers, and between employees, respect and innovation of individuals in firms, respective reward and quality of service , planning and decision making, role clarity ,communication and other success condition in firms to develop a relevant questionnaire. The questionnaire goal was to see if Job Satisfaction prevails among Jordanian banks Envelopes were provided with the surveyors so that respondents could seal them for anonymous return. Three days later the banks were contacted again to collect the completed questionnaires. At the second stage the researcher classified banks according to the existence of Job Satisfaction: strong Job Satisfaction banks and weak Job Satisfaction banks using rank mean as cut point. The researcher ran step wise between Job Satisfaction and performance which was measured with financial ratios.
Performance indicators
This study adopted a number of procedures for assessing the bank’s performance. First, as units of comparison in this research were banks, performance indicators reflected the aggregate level of performance, and not at the subunit level. The study used criteria that are most critical to that sector. Financial indicators like return on assets, return on equity, earning per share, were used.
Data sources
Types of data needed for this study depended on both primary data and secondary data
Primary data
To get the required data from the study sample, questionnaire is prepared. To reach our sample, the data collection process, based on the questionnaire, the questionnaire is prepared in both English and Arabic as well the convenience to respondent
Secondary data
These data could be found in the financial statements of the banks.
Previous studies
“Job satisfaction is defined as the extent to which people like (satisfaction) or dislike (dissatisfaction) their jobs” (Spector, 1994, p. 2). As with job motivation, job satisfaction has several theories associated with it. Three predominant theories of job satisfaction include the historical situational occurrences theory (Quarstein, McAfee, & Glassman, 1992), discrepancy theory (Locke, 1976), and Herzberg, Mausner, & Snyderman, 1959) motivation-hygiene theory. Harrison, Newman, & Roth (2006) demonstrate the close relationship between job satisfaction and “affective commitment.” Also known as attitudinal commitment (Riketta, 2005), affective commitment shares a strong relationship with job satisfaction (Meyer, Stanley, Herscovitch, & Topolnytsky, 2002). Whereas the general target of job satisfaction is the work role, the target of affective commitment is the entire organization.
Affective commitment is an encompassing way of looking at job satisfaction and represents a general attitude that is a fundamental evaluation of one’s job experience (Harrison et al., 2006). Job satisfaction has numerous variables used to define and gauge its impact on other factors. To quantify job satisfaction, Spector (1994), came up with his own nine facet scale, Spector’s criteria include pay, promotion, supervision, fringe benefits, contingent rewards, operating conditions, co-workers, nature of work, and communication. Jamal (2007) suggests job performance is a function that an individual can successfully perform within framework of normal constraints and available resources. What constitutes job performance differs from job to job.

International Journal of Humanities and Social Science Vol. 5, No. 11; November 2015
112
A few researchers including Campbell (1990) developed some broad dimensions of job performance that could be generalizable across jobs. Campbell came up with eight general factors of job performance, which includes 1) jobs specific proficiency, 2) non-job-specific task proficiency, 3) written and oral communication, 4) demonstrating effort, 5) maintaining personal discipline, 6) maintaining peer and team performance, 7) supervision/leadership, and 8) management/administration. Campbell espoused that although each factor may not be relevant for all jobs, these eight factors can be used to describe job performance in every occupation. Although the content of each of the eight factors may vary across jobs, underlying each of them is a motivational component. Recent research adds social efficacy to these factors (Hochwarter, Kiewitz, Gundlach, & Stoner, 2004). These researchers propose that job performance is a multidimensional concept that encompasses both task-related and contextual performance factors that include the importance of social skills as a predictor of job performance. In a unique study, Schneider et al. (2003) explored the relationships between several facets of job satisfaction and organizational financial and market performance using data from 35 organizations over a period of 8 years.
Analyses revealed that ‘Overall Job Satisfaction and Satisfaction with Security were predicted by return on assets (ROA) and EPS more strongly than the reverse (although some of the reverse relationships were also significant; Satisfaction with Pay suggested a more reciprocal relationship with ROA and EPS’ (p. 836). Thus, in contrast to previous studies treating employee attitudes as a predictor of organizational performance, Schneider et al.’s (2003) longitudinal study demonstrated the reverse: that the causal directionality flows from financial performance to overall job satisfaction. On the basis of some 900 interviews with banking employees, McMurry (1958, p. 97) uncovered ‘a functional relationship between the structured, routinized character of banking operations and organization and the personality configurations of most bank employees’. Typically, employment in a bank is characterized by a number of features, chief among them are a relatively high degree of job security, high social status and prestige in the community, regularity of employment, pleasant working conditions, and a high degree of job structuring (pp. 90–91).
Such conditions, and attending recruitment policies, attract persons with high dependency needs (p. 87). In a relatively protected and structured work environment where supervision tends to be authoritarian, such persons make excellent employees (p. 93). Explored the satisfaction–performance relationship at the organizational level of analysis (Cole and Cole 2009). Ostroff (1992) investigated the relationship between employee satisfaction and organizational performance. Organizational performance data were collected for 298 schools, and employee satisfaction data were collected from 13,808 teachers within these schools. Ostroff found that teacher’s satisfaction was related to school performance: ‘organizations with more satisfied employees tended to be more effective than organizations with less satisfied employees. Furthermore, these relationships were somewhat stronger than those typically observed at the individual level’ (pp. 968–969).
Organizational environment
Hofstede et al. (1990) used six factors that measured organizational environment as follows:
Process oriented versus results oriented. Employee oriented versus job oriented. Parochial versus professional. Open system versus closed system. Loose control versus tight control. Normative versus prismatic.
Hofstede et al. (1990) realized that number 1 , 3 and 4 were to some extent associated with values, while number 2 , 5 and 6 described practices to which people have been socialized without their basic values being involved. Hofstede and his colleagues (1990) also argued that the six diminutions describe the culture of an organization, but they are not prescriptive: no position of the six dimensions is intrinsically good or bad. Labeling positions on the dimension scales as more or less desirable is a matter of strategic choice and may vary from one organization to another (Hofstede et al. 1990). The study has many dimensions and characteristic described as following. Involvement “Effective organizations empower their people, build their organizations around teams and develop human capability at all levels. Executives, managers and employees are committed to their work and feel that they own a piece of the organization.

ISSN 2220-8488 (Print), 2221-0989 (Online) ©Center for Promoting Ideas, USA www.ijhssnet.com
113
People at all levels feel that they have at least some input into decisions that will affect their work and that their work is directly connected to the goals of the organization. (Denison, D., Haaland, S., &. Goelzer, 2003, pp.100). Consistency “Organizations also tend to be effective because they have ‘‘strong cultures that are highly consistent, well-coordinated, and well integrated. Behavior is rooted in a set of fundamental values, while leaders and followers are skilled enough to reaching agreement even when there are diverse points of view. This type of consistency is a powerful source of stability and internal integration that results from a common mind set and a high degree of conformity. (Denison, D., Haaland, S., & Goelzer, 2003, p.100).
Adaptability
Ironically, organizations that are well integrated are often the most difficult ones to change. Internal integration and external adaptation can often be at odds. Adaptable organizations are driven by their customers, take risks and learn from their mistakes. They are the one that have capability and the experience of creating change. They are continuously changing the system so that they are improving the organizations ‘collective abilities to provide value for their customers. (Denison, D., Haaland, S., & Goelzer, .2003, p100).
Mission
“Successful organizations have a clear sense of purpose and direction that defines organizational goals and strategic objectives and expresses a vision of how the organization will look in the future. When an organization’s underlying mission changes, changes also occur in other aspects of the organization’s culture”. (Denison, D., Haaland, S., & Goelzer,.2003, p100).
Measuring job satisfaction
However, Dension has tried to form a general model for organizational effectiveness based on four cultural traits. This model is based on the following bases:
A- Involvement
Effective organizations empower their people, build their organizations around teams, and develop human capability at all levels Executives, managers and employees are committed to their work and feel that they own a piece of the organization. People at all levels feel that they have at least some input into decisions that will affect their work and that their work is directly connected to the goals of the organization.
B- Consistency
Organizations are effective because they have strong cultures that are highly consistent, well-coordinated, and well integrated. Behavior is rooted in a set of core values, and leaders and followers are skilled at reaching agreement even when there are diverse points of view. This type of consistence is a powerful source of stability and internal integration that results from a common mindset and a high degree of conformity.
C- Adaptability
Organizations that are well integrated are often the most difficult to change .Internal integration and external adaptation can often be at odds. Adaptable organizations are driven by their customers, take risks and learn from their mistakes, and have capability and experience of creating change. They are continuously changing the system so that they are improving the organizations’ collective abilities to provide value to their customers.
D- Mission
Successful organizations have a clear sense of purpose and direction that defines organizational goals and strategic objectives and expresses a vision of how the organization will look in the future. When an organization underlying mission change, changes also occur in other aspects of the organization’s culture.
Job satisfaction
Job satisfaction has been an important focal point for organizational and industrial psychology. In defining job satisfaction the reference is often made to Locke‟s (1976) description of job satisfaction as a “pleasurable or positive emotional state resulting from the appraisal of one’s job or job experiences” (Jex 2002 p.116). The appraisal involves various elements related to the job such as salary, working conditions, colleagues and boss, career prospects and, of course, the intrinsic aspects of the job itself (Arnold et al 1998 p. 204). So, simply put, job satisfaction is connected to how our personal expectations of work are in congruence with the actual outcomes.

International Journal of Humanities and Social Science Vol. 5, No. 11; November 2015
114
And since job satisfaction is merely an employee‟ s attitude towards his or job, previously discussed theories regarding attitudes are applicable to job satisfaction. Consequently job satisfaction can be seen as containing three components: an affective component, a cognitive component and a behavioral component (Jex 2002 p.116). While the affective component refers to a feeling about a job, the cognitive component represents a belief in regard to a job. Often these two aspects are related. The behavioral component is an indicator for behavioral intentions towards a job such as getting to work in time, working hard, etc.
Performance
On a very general level job performance can be defined as “all the behaviors employees engage in while at work” (Jex 2002 p. 88). More commonly, job performance refers to how well someone performs at his or her work. Performance in terms of the new culture “profitability and financial returns is measured according to the following parameters: Owner’s satisfaction with financial returns or profits from organizational operations. Employees’ satisfaction with the conditions of work, such as wages and remuneration, style of supervision,
rapid promotion and the ability of organization to guarantee job security. Employees expressed desire to stay with the organization and the ability of the organization to retain its
workforce. Costumers expressed satisfaction with the quality.
It is generally agreed that job performance consists of complicated series of interacting variables pertaining to aspects of the job, the employee and the environment (Milkovich et al 1991 pp. 48-49). Historically, there have been three approaches to define the dimensions of job performance (Milkovich et al 1991 p. 48): As a function of outcomes. As a function of behavior. As a function of personal traits.
The majority of the studies have shifted their focus on defining job performance in terms of outcomes and behavior, since these are easier and more objective to define and to observe than personal traits (Hersen 2004 p. 375).
The Relationship between Job Satisfaction and performance The relationship between job satisfaction and job performance appears to be more clearly quantified; it has
also been more controversial than job motivation and job performance as illustrated by Moorman (1993), Fisher (2003), and Judge et al. (2001).
Moorman (1993) discusses that a widely believed adage of managers is that happy workers are productive workers. However, Moorman states that most research on the relationship between job satisfaction and job performance does not show convincing evidence that this relationship is as strong as most managers believe it to be. He proposes that only a weak link exists between job satisfaction and job performance because most research measures the wrong kind of performance; job performance is measured by the degree an employee reaches either a quantity requirement or a preconceived standard for effective behavior. Moorman (1993) describes a theory also proposed by Organ (1997) that job performance should include behaviors Organ calls Organizational Citizenship Behaviors (OCB). OCBs are considered outside the realm of traditional tasks needed to get the job done but are an important part of an employee’s organizational contribution.
In notable commentary on what she calls “the happy-productive worker hypothesis,” Fisher (2003) explains why this belief is so pervasive. Fisher comments that research suggests only a modest correlation between job satisfaction and job performance. In one study, Fisher (2003) surveys the opinions of managers, supervisors, and employees, finding that the majority believe feelings of satisfaction are related to performance. In study two, Fisher (2003) explains why this happy-productive worker hypothesis is so widely believed. Fisher uses experienced sampling methodology (ESM), a set of techniques used to capture people’s behaviors, thought or feelings as they occur, prompting real- time reports of current mood, task satisfaction, and perceive task performance. Results demonstrate that the concurrent correlations between job satisfaction and job performance are small. She concludes that individual employees may believe in the connection between happy workers and job performance based on personal experiences of being more satisfied when performing effectively and less satisfied when performing below average level.

ISSN 2220-8488 (Print), 2221-0989 (Online) ©Center for Promoting Ideas, USA www.ijhssnet.com
115
Data Analysis and Interpretation of Results
The statistical Analysis
After listing the data obtained from the subject’s respondent, it was concluded to the following.
First: Testing the range of internal consisting of the questions of the questionnaire. The researcher examined the range of internal consistency. This is shown in Table(1):
Table (1) Reliability Test, (Cronbach - Alpha)
Reliability
****** Method 1 (space saver) was used for this analysis ******
Reliability analysis-Scale (Alpha)
Reliability Coefficients
N of Cases = 120.0 N of Items = 55 Alpha = .7374 Second: The following tables show the properties of the sample according to their Demographic profile.
Table (2): Distribution of the respondents according To their gender
Frequency percent Male 66 55.0 Female 54 45.0 Total 120 100.0
From Table (2) it was shown that the study subjects were males (n =22) from total number (40) subjects with proportion (55.0%).
Table (3): Distribution of the respondents according to their age group
Frequency percent 21-30 69 57.5 31-40 36 30.0 41-50 15 12.5 Total 120 100.0
As shown in Table (3), it is noted that the most of the study subjects belongs to the age group (21-30) years with proportion (57.5%).
Table (4): Distribution of the respondents according to the number of experience years group in the position
Frequency percent 0-4 75 62.5 5-9 36 30.0 10-14 9 7.5 Total 120 100.0
As shown in Table (4) the most of the study subjects belongs to the experience group (0-4) years with proportion (62.5%).
Table (5): Distribution of the respondents according to the number of experience years group in the bank
Frequency percent 0-4 81 67.5 5-9 33 27.5 10-14 6 5.0 Total 120 100.0
As shown in Table (5) the most of the study subjects belongs to the experience group (0-4) years with proportion (67.5%).

International Journal of Humanities and Social Science Vol. 5, No. 11; November 2015
116
Table (6): Distribution of the respondents according to their job
Frequency percent Supervisor 9 25.0 Manager 6 5.0 Head manager 75 62.5 Others 30 7.5 Total 120 100.0
Table (6) shows that most of the study subjects were heads of department (62.5%) and (25%) of the study sample were Supervisor.
Third: Testing and realizing data and attitudes of the study variables. Fourth: study aimed to examine and identify relation between job satisfaction and performance in Jordan. To achieve the study purpose the researcher developed a questionnaire were obtained.
The First Hypothesis
“Job satisfaction exists in Jordanian banks”.
To discuss this hypothesis, we should know the study subjects attitudes towards the first group of question which measures this hypothesis and the range of approval or not approval.
Table (7): Means of study subjects respondents on the first group of questions and SD
Mean Std. Deviation Empowerment 3.61 .50 Team orientation 4.19 .36 Capability development 3.56 .31 Core values 4.21 .38 Agreement 3.30 .42 Coordination and integration 3.18 .75 Creating change 3.81 .73 Customer focus 3.81 .46 Strategic direction an intent 3.80 .36 Goal & objective 4.02 .39 Vision 3.61 .62 Innovation 4.17 .49 Role clarity 4.04 .40 Respect 3.58 .93 Reward system 3.80 .65 Planning and decision making 3.53 .86 Quality of service 4.13 .67 Communication 4.15 .45 Job Satisfaction (All items) 3.82 .21
From the table we calculate that the “core value” has the largest mean ( 4.21 ) , then the second one is “team orientation” which has the mean value ( 4.19 ) but the “coordination and integration” has the smallest mean ( 3.18 ) also, the results show that the standard deviation is not large , which indicates that the respondents have the same opinion . To confirm wither the correlation has statistical significance; we will examine the questions by using T- test and as it is shown in table (8).
Table (8-a) ):one-sample T-Test
N MEAN STD.DEVIATIN Std. Error MEAN QQ 40 3.8030 .2091 3.306E-02
Table (8-b): one-sample T-Test
Test Value=3
t df Sig.(2-tailed) Mean Difference Confidence Interval of the Difference Lower Upper
QQ 24.288 39 .000 .8030 .7361 .8699
From Table (8) we conclude that the job satisfaction exists because the value of the significance level “0.000” is less than “0.05”. Also we note that the value of t is positive which supports the first hypothesis.
ISSN 2220-8488 (Print), 2221-0989 (Online) ©Center for Promoting Ideas, USA www.ijhssnet.com
117
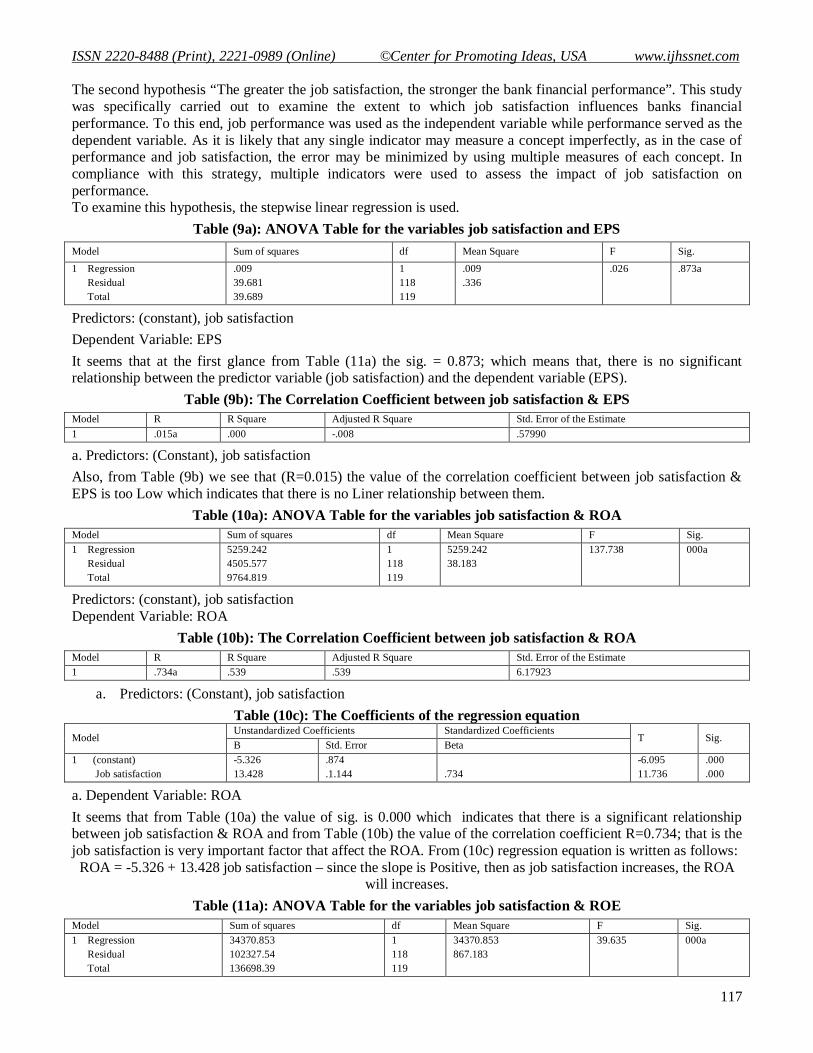
The second hypothesis “The greater the job satisfaction, the stronger the bank financial performance”. This study was specifically carried out to examine the extent to which job satisfaction influences banks financial performance. To this end, job performance was used as the independent variable while performance served as the dependent variable. As it is likely that any single indicator may measure a concept imperfectly, as in the case of performance and job satisfaction, the error may be minimized by using multiple measures of each concept. In compliance with this strategy, multiple indicators were used to assess the impact of job satisfaction on performance. To examine this hypothesis, the stepwise linear regression is used.
Table (9a): ANOVA Table for the variables job satisfaction and EPS
Model Sum of squares df Mean Square F Sig. 1 Regression Residual Total
.009 39.681 39.689
1 118 119
.009
.336 .026 .873a
Predictors: (constant), job satisfaction
Dependent Variable: EPS
It seems that at the first glance from Table (11a) the sig. = 0.873; which means that, there is no significant relationship between the predictor variable (job satisfaction) and the dependent variable (EPS).
Table (9b): The Correlation Coefficient between job satisfaction & EPS
Model R R Square Adjusted R Square Std. Error of the Estimate 1 .015a .000 -.008 .57990
a. Predictors: (Constant), job satisfaction
Also, from Table (9b) we see that (R=0.015) the value of the correlation coefficient between job satisfaction & EPS is too Low which indicates that there is no Liner relationship between them.
Table (10a): ANOVA Table for the variables job satisfaction & ROA
Model Sum of squares df Mean Square F Sig. 1 Regression Residual Total
5259.242 4505.577 9764.819
1 118 119
5259.242 38.183
137.738
000a
Predictors: (constant), job satisfaction Dependent Variable: ROA
Table (10b): The Correlation Coefficient between job satisfaction & ROA
Model R R Square Adjusted R Square Std. Error of the Estimate 1 .734a .539 .539 6.17923
a. Predictors: (Constant), job satisfaction
Table (10c): The Coefficients of the regression equation Model
Unstandardized Coefficients Standardized Coefficients T Sig.
B Std. Error Beta 1 (constant) Job satisfaction
-5.326 13.428
.874
.1.144 .734
-6.095 11.736
.000
.000
a. Dependent Variable: ROA
It seems that from Table (10a) the value of sig. is 0.000 which indicates that there is a significant relationship between job satisfaction & ROA and from Table (10b) the value of the correlation coefficient R=0.734; that is the job satisfaction is very important factor that affect the ROA. From (10c) regression equation is written as follows:
ROA = -5.326 + 13.428 job satisfaction – since the slope is Positive, then as job satisfaction increases, the ROA will increases.
Table (11a): ANOVA Table for the variables job satisfaction & ROE
Model Sum of squares df Mean Square F Sig. 1 Regression Residual Total
34370.853 102327.54 136698.39
1 118 119
34370.853 867.183
39.635 000a
International Journal of Humanities and Social Science Vol. 5, No. 11; November 2015
118
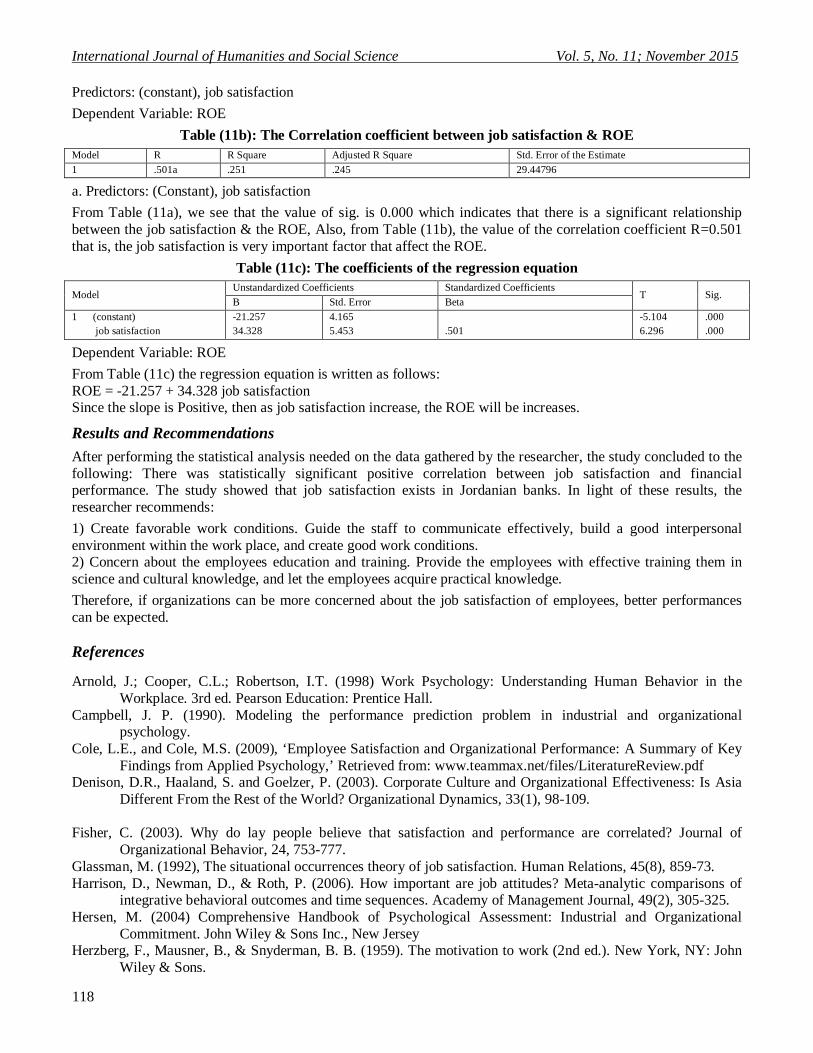
Predictors: (constant), job satisfaction
Dependent Variable: ROE
Table (11b): The Correlation coefficient between job satisfaction & ROE
Model R R Square Adjusted R Square Std. Error of the Estimate 1 .501a .251 .245 29.44796
a. Predictors: (Constant), job satisfaction
From Table (11a), we see that the value of sig. is 0.000 which indicates that there is a significant relationship between the job satisfaction & the ROE, Also, from Table (11b), the value of the correlation coefficient R=0.501 that is, the job satisfaction is very important factor that affect the ROE.
Table (11c): The coefficients of the regression equation
Model Unstandardized Coefficients Standardized Coefficients
T Sig. B Std. Error Beta
1 (constant) job satisfaction
-21.257 34.328
4.165 5.453
.501
-5.104 6.296
.000
.000
Dependent Variable: ROE
From Table (11c) the regression equation is written as follows: ROE = -21.257 + 34.328 job satisfaction Since the slope is Positive, then as job satisfaction increase, the ROE will be increases.
Results and Recommendations
After performing the statistical analysis needed on the data gathered by the researcher, the study concluded to the following: There was statistically significant positive correlation between job satisfaction and financial performance. The study showed that job satisfaction exists in Jordanian banks. In light of these results, the researcher recommends:
1) Create favorable work conditions. Guide the staff to communicate effectively, build a good interpersonal environment within the work place, and create good work conditions. 2) Concern about the employees education and training. Provide the employees with effective training them in science and cultural knowledge, and let the employees acquire practical knowledge.
Therefore, if organizations can be more concerned about the job satisfaction of employees, better performances can be expected. References Arnold, J.; Cooper, C.L.; Robertson, I.T. (1998) Work Psychology: Understanding Human Behavior in the
Workplace. 3rd ed. Pearson Education: Prentice Hall. Campbell, J. P. (1990). Modeling the performance prediction problem in industrial and organizational
psychology. Cole, L.E., and Cole, M.S. (2009), ‘Employee Satisfaction and Organizational Performance: A Summary of Key
Findings from Applied Psychology,’ Retrieved from: www.teammax.net/files/LiteratureReview.pdf Denison, D.R., Haaland, S. and Goelzer, P. (2003). Corporate Culture and Organizational Effectiveness: Is Asia
Different From the Rest of the World? Organizational Dynamics, 33(1), 98-109. Fisher, C. (2003). Why do lay people believe that satisfaction and performance are correlated? Journal of
Organizational Behavior, 24, 753-777. Glassman, M. (1992), The situational occurrences theory of job satisfaction. Human Relations, 45(8), 859-73. Harrison, D., Newman, D., & Roth, P. (2006). How important are job attitudes? Meta-analytic comparisons of
integrative behavioral outcomes and time sequences. Academy of Management Journal, 49(2), 305-325. Hersen, M. (2004) Comprehensive Handbook of Psychological Assessment: Industrial and Organizational
Commitment. John Wiley & Sons Inc., New Jersey Herzberg, F., Mausner, B., & Snyderman, B. B. (1959). The motivation to work (2nd ed.). New York, NY: John
Wiley & Sons.
ISSN 2220-8488 (Print), 2221-0989 (Online) ©Center for Promoting Ideas, USA www.ijhssnet.com
119
Hochwarter, W., Kiewitz, C., Gundlach, M., & Stoner, J.(2004). The impact of vocational and social efficacy on job performance and career satisfaction. Journal of Leadership & Organizational Studies, 10(3), 27-40.
Locke, E. A. (1976). The nature and causes of job satisfaction. Handbook of industrial and organizational psychology.
Hofstede ,G . (1990) , “Motivation , Leadership and organization : Do American Theories Apply Abroad ? in Pugh , D . (ed.) (1990),Organization Theory , pp . 473-499.
Jamal, M. (2007). Job stress and job performance controversy revisited: An empirical examination in two countries. International Journal of Stress Management, 14(2),175-187.
Jex, S.M. (2002) Organizational Psychology: A Scientist-Practitioner Approach. John Wiley & Sons, New York. John Wiley & Sons, New York Arnold, J.; Cooper, C.L.; Robertson, I.T. (1998) Work Psychology:
Understanding Human Behaviour in the Workplace. 3rd ed. Pearson Education: Prentice Hall. Judge, T. A., Thoresen, C. J., & Bono J. E. (2001). Relationship of core self-evaluation traits - self-esteem,
generalized self-efficacy, locus of control, and emotional stability- with job satisfaction and job performance: A metaanalysis.
Journal of Applied Psychology, 86(1),80-92.Palo Alto, CA: Consulting Psychologists Press. McMurry, R.N. (1958), ‘Recruitment, Dependency, and Morale in the Banking Industry,’Administrative Science
Quarterly, 3, 1, 87–117. Meyer, D., Stanley, L. Herscovitch, L., & Topolnytsky, L.(2002), Affective, continuance, and normative
commitment to the organization: A meta-analysis of antecedents, correlates, and consequences, Journal of Vocational Behavior, 61, 20-52.
Milkovich, G.T.: Wigdor, A.K. (1991) Pay for Performance: Evaluating Performance Appraisal and Merit Pay. National Academy Press, Washington
Moorman, R. H. (1993). The influence of cognitive and affective based job satisfaction measures on the relationship between satisfaction and organizational citizenship behavior. Human Relations, 46, 759-776.
Organ, D. (1997). Organizational citizenship behavior: It’s construct clean-up time. Human Performance, 10(2),85-97.
Ostroff, C. (1992), ‘The Relationship between Satisfaction, Attitudes, and Performance: An Organizational Level Analysis,’ Journal of Applied Psychology, 77, 963–974.
Riketta, M. (2005). Gender and socially responding as moderators of the correlation between implicit and explicit self-esteem. Current Research in Social Psychology, 11(2), 14-26.
Schneider, B., Hanges, P.J., Smith, D.B., and Salvaggio, A.N. (2003), ‘Which Comes First: Employee Attitudes or Organizational Financial and Market Performance?’ Journal of Applied Psychology, 88, 836–851.
Spector, P. (1994). Job satisfaction survey. Tampa, FL: University of South Florida.