job outlook 2017 - tougaloo college outlook 2017 november 2016 free to nace members | $49.95 list...
TRANSCRIPT

JOB OUTLOOK 2017
FREE TO NACE MEMBERS | $49.95 LIST PRICENovember 2016
NATIONAL ASSOCIATION OF COLLEGES AND EMPLOYERS62 Highland Avenue Bethlehem, PA 18017-9085 • 610-868-1421www.naceweb.org

About the Job Outlook 2017 Survey .............................................................. 3
U.S. College Hiring Expected to Be Flat With 5.8 Percent Increase ...... 4
Employers Rate the Job Market as “Good”Reassessing Hiring PlansFall Versus Spring HiringChanges in Recruiting MethodsHiring by IndustryHiring by Region
Who’s in Demand ............................................................................................... 12
Demand by Degree LevelTop MajorsInternational Student Hiring Plans
Employers’ View of Candidates ..................................................................... 22
Resume EssentialsCandidate 1 Versus Candidate 2: Deciding Attributes Career ReadinessWork Experience
Compensation and Signing Bonuses ........................................................... 27
Starting SalariesSigning Bonuses
Appendix .............................................................................................................31
Participating Organizations
2 | JOB OUTLOOK 2017
TABLE OF CONTENTS

ABOUT THE JOB OUTLOOK 2017 SURVEY
The Job Outlook survey is a forecast of hiring intentions of employers as they relate to new college graduates. Each year, the National Association of Colleges and Employers (NACE) surveys its employer members about their hiring plans and other employment-related issues in order to project the market for new college graduates for the current class and to assess a variety of conditions that may influence that market.
From August 5, 2016, through October 4, 2016, data were collected for the Job Outlook 2017 survey. A total of 169 surveys were returned—a 17 percent response rate.
Of those responding, 13.6 percent were from the West, 26.6 percent were from the Northeast, 25.4 percent were from the Southeast, and 34.3 percent were from the Midwest. For a list of respondents by industry and size, and a partial list of organizations that supplied data for this report, see the Appendix.
Note: Totals throughout the report may not equal 100 percent due to rounding.
NACE expects to provide a formal update of job market information once more in the 2016-17 academic year: The Job Outlook 2017 Spring Update survey (data collected in February – March) will give NACE members a final update on hiring for 2016-17 graduates. Results will be available in early April.
JOB OUTLOOK 2017 | 3
RESEARCH TEAM
Edwin W. KocDirector of Research, Public Policy, and Legislative Affairs
Andrea J. KonczResearch Manager
Kenneth C. TsangResearch Associate
Louisa EismannResearch Associate
Anna LongenbergerResearch Associate

4 | JOB OUTLOOK 2017
U.S. COLLEGE HIRING EXPECTED TO BE FLAT WITH 5.8 PERCENT INCREASE
Hiring for U.S. openings for Class of 2017 graduates is expected to be flat: Employers plan to hire 5.8 percent more new graduates during 2016-17 than they did in 2015-16 for their U.S. operations.
The current projection is in line with final projections employers reported for last year’s graduates in the Job Outlook 2016 Spring Update survey. While employers initially anticipated hiring 11 percent more Class of 2016 college graduates, they ended the cycle instead with a 5.2 percent increase. (See Figure 1.)
Exploring the individual hiring plans of respondents provides insight into the flat hiring market for new college graduates. Overall, as Figure 2 illustrates, fewer respondents to the 2017 survey anticipate hiring more new college graduates than was the case a year ago: 36 percent versus 40 percent. This marks the fourth consecutive year in that trend. On a positive note, the difference is made up by the majority of employers who anticipate keeping their hiring levels even with last year’s levels. Fewer expect to cut hiring.
13.5%
19.3%
9.5% 10.5%
13.0%
2.1%
7.8%8.6% 8.3%
9.6%11.0%
5.2% 5.8%
HIR
ING
PRO
JEC
TIO
NS
CLASS YEAR2011
0
5
10
15
20
2012 2013 2014 2015 2016 2017
FIGURE 1 JOB OUTLOOK HIRING PROJECTIONS, 2011 – 2017*
FALL SPRING
*Years 2014 through 2017 are the hiring projections for U.S. locations only. Prior years’ projections are shown for informational purposes only, and should not be compared to the 2014-17 projections.

JOB OUTLOOK 2017 | 5
Most of the respondents that are increasing their hiring numbers are doing so because of company growth, as there is an increased demand for their products and services. Employers also cited the importance of building talent pipelines with new college graduates as a catalyst for increasing college hiring. Some respondents noted that they are molding these new hires to become the future leaders of their organizations.
The largest group of respondents that are maintaining their hiring levels also pointed to company growth, which is encouraging. Most of these organizations indicated that they are experiencing a stable work force and consistent work load, hence the reason for neither increasing nor decreasing their hires. A small group of respondents that will maintain their numbers did mention budget constraints, but expect to keep hiring new graduates at the same level.
Some of those reporting plans to decrease their hiring numbers cited hiring freezes and business conditions, but others indicated that they hired large numbers of graduates in the past few years, and simply don’t need to hire as many in 2016-17. Of interest: Last year, nearly 42 percent of those cutting back cited the downturn in the oil and gas industry as a contributing factor, but just a handful of current respondents made note of that.
In addition to the projection for U.S. operations, employers that indicated they recruit college graduates for positions outside of the United States reported a hiring projection for international positions of 7.2 percent. This is a small improvement over last year, when respondents planned to increase international hiring for Class of 2016 graduates by 5.2 percent.
47.7
%
50.8
%
47.5
%
48.6
%
46.4
%
45.9
%
45.3
%
42.4
%
40.1
%
36.3
%
52.1
%
46.7
%
40.1
%
27.4
%
12.2
%
11.8
%
10.1
%
7.7% 13
.2%
11.6
%
6.1%
PERC
ENT
OF
RESP
ON
DEN
TS
RECRUITING YEAR
INCREASE MAINTAIN DECREASE
2010-110
30
20
10
40
50
60
2011-12 2012-13 2013-14 2014-15 2015-16 2016-17
FIGURE 2 EMPLOYERS’ HIRING EXPECTATIONS

6 | JOB OUTLOOK 2017
Overall for the Class of 2017, the total hiring projection for both U.S. and international students for U.S. and international positions is up 5.8 percent as the number of hires for international positions adds only a small amount to the number of total hires.
Employers Rate the Job Market as “Good”Even though the overall hiring projection for new college graduates appears flat, most employers view the overall job market for college graduates in a positive light. (See Figure 3.)
More than half of this year’s respondents rated the market as “good,” with almost 30 percent providing a “very good” rating and an additional 7.6 percent rating the market as “excellent.”
The group rating this year’s college job market as “fair” has dropped to less than 10 percent, and is down to less than half of the group that gave fair ratings to the job market in 2013-14. Additionally, just one respondent gave the overall job market a “poor” rating.
Reassessing Hiring PlansChanges in how frequently employers expect to reassess their hiring plans suggest that they believe their college hiring needs are more stable than has been the case, and therefore don’t need to tend to them as often.
This year, the largest group of respondents report that they will reassess their hiring plans on a quarterly basis. (See Figure 4.) In comparison, last year the largest group indicated they would reassess more frequently—on a monthly basis. In addition, the percentage of those planning to reassess on an annual basis has grown from just 16.6 percent in 2014-15 to nearly 21 percent in 2015-16 to almost one-quarter of respondents for 2016-17.
1.1%6.
1%
3.6%
35.9
%
45.9
% 51.6
%
16.5
%
7.6%
29.2
%
33.2
%
53.5
%
9.0% 12
.2%
11.2
%
20.9
%
0.7%
0.0%
0.4% 1.1%
60.4
%
PERC
ENT
OF
RESP
ON
DEN
TS
JOB MARKET RATING
2016-17 2015-16 2014-15
EXCELLENT0
30
20
10
40
50
70
60
VERY GOOD GOOD FAIR POOR
FIGURE 3 EMPLOYERS RATE THE JOB MARKET FOR 2016-17 GRADUATES
2013-14

JOB OUTLOOK 2017 | 7
Most of the “other” schedules reported were on an “as needed” basis, and a few reported that their schedules for reassessing hiring needs were aligned with the beginning/end of school semesters.
Fall Versus Spring HiringEmployers continue to prefer recruiting new graduates during the fall. The percentage of college recruiting that will be conducted in fall 2017 is approaching three-quarters, an all-time high. (See Figure 5.)
In fact, almost 14 percent of the total respondents that provided their fall/spring percentages reported that they will conduct 100 percent of their recruiting in the fall of 2016, with no recruiting planned for the spring of 2017.
Those employers that will be recruiting on campus in spring 2017 have plans that are very similar to employers’ plans last spring. (See Figure 6.) In both years, two-thirds of respondents indicated firm or tentative plans in place for the spring recruiting season.
FIGURE 5 PERCENTAGE OF COLLEGE RECRUITING CONDUCTED IN FALL VS. SPRING, 2012-2017JOB OUTLOOK SURVEY YEAR FALL SPRING
2017 72% 28%
2016 71% 29%
2015 66% 34%
2014 62% 38%
2013 68% 32%
2012 65% 35%
8.3% 8.4%
34.4%
25.9%
37.1%
32.2%
22.4%20.6%
4.4%6.3%PE
RCEN
T O
F RE
SPO
ND
ENTS
SCHEDULEWEEKLY
0
5
10
15
20
MONTHLY QUARTERLY ANNUALLY OTHER
FIGURE 4 EMPLOYERS’ PLANS TO REASSESS HIRING NEEDS
2015-16 2016-17

8 | JOB OUTLOOK 2017
Changes in Recruiting MethodsThe use of more technology, in general, continues to be the largest change respondents will make in their methods of recruiting new college graduates. This year, more than 60 percent of respondents indicated they will use more technology in recruiting, with more than half indicating they will specifically increase their use of social networks. (See Figure 7.) In addition, almost one-third will attend fewer career fairs, which may point to the increased use of technology. By comparison, the percentage of 2013 respondents attending fewer career fairs was less than one-quarter.
While the detailed uses of technology were not mentioned in this report, preliminary findings from NACE’s 2016 Recruiting Benchmarks Survey show that respondents plan to increase their use of video interviewing; this may be one reason for attending fewer career fairs.
FIGURE 6 SPRING 2017 RECRUITING PLANSRECRUITING PLANS SPRING 2017 SPRING 2016
Firm recruiting plans 39.0% 41.3%
Tentative plans in place 27.4% 25.7%
All recruiting in fall 17.1% 19.6%
Unsure 14.4% 12.3%
Not hiring 2.1% 1.1%
FIGURE 7 CHANGE IN RECRUITING METHODS BY PERCENTAGE OF RESPONDENTS, 2013-2017RECRUITING PLANS % OF 2017
RESPONDENTS% OF 2016
RESPONDENTS% OF 2015
RESPONDENTS% OF 2014
RESPONDENTS% OF 2013
RESPONDENTS
Using more technology in general 61.9% 58.1% 60.9% 48.5% 59.6%
Using more social networks 52.4% 54.2% 64.7% 50.9% 57.3%
Change in branding 47.6% 37.4% 42.4% 38.2% 34.8%
Attending fewer career fairs 31.7% 30.3% 23.9% 23.6% 24.7%
Attending more career fairs 31.7% 34.2% 32.1% 33.3% 39.3%
Less travel 21.4% 22.6% 20.1% 21.8% 21.3%
More travel 20.6% 19.4% 19.6% 18.2% 21.9%
Other 10.3% 6.4% 13.0% 14.5% 18.5%
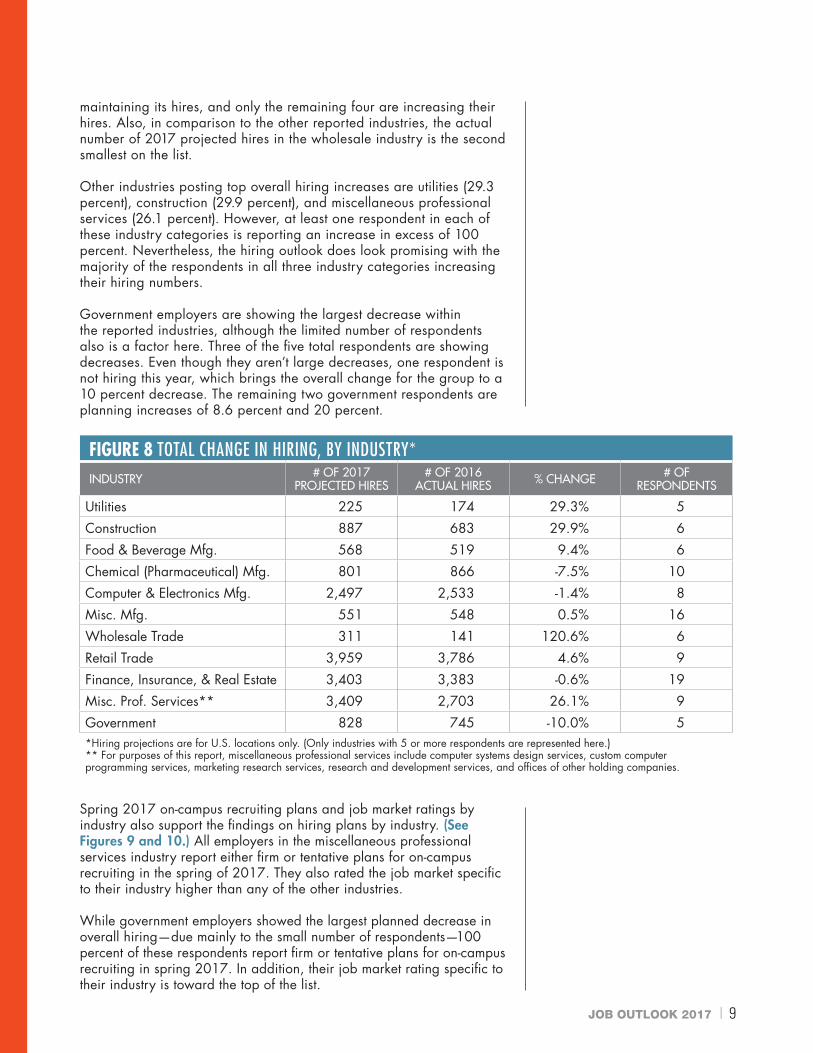
Hiring by IndustryOf the 11 industries represented in Figure 8 that had at least five respondents reporting their individual hiring numbers, seven reported increases in hiring, with the remaining four indicating decreases.
Wholesale trade employers appear to be planning on more than doubling their overall hires as half of their respondents are planning increases of 100 percent or more. With such a small number of respondents, the overall increase becomes extremely inflated and does not provide an accurate picture of the industry. In fact, of the six responding wholesale employers, one is decreasing its hires, one is
JOB OUTLOOK 2017 | 9
maintaining its hires, and only the remaining four are increasing their hires. Also, in comparison to the other reported industries, the actual number of 2017 projected hires in the wholesale industry is the second smallest on the list.
Other industries posting top overall hiring increases are utilities (29.3 percent), construction (29.9 percent), and miscellaneous professional services (26.1 percent). However, at least one respondent in each of these industry categories is reporting an increase in excess of 100 percent. Nevertheless, the hiring outlook does look promising with the majority of the respondents in all three industry categories increasing their hiring numbers.
Government employers are showing the largest decrease within the reported industries, although the limited number of respondents also is a factor here. Three of the five total respondents are showing decreases. Even though they aren’t large decreases, one respondent is not hiring this year, which brings the overall change for the group to a 10 percent decrease. The remaining two government respondents are planning increases of 8.6 percent and 20 percent.
Spring 2017 on-campus recruiting plans and job market ratings by industry also support the findings on hiring plans by industry. (See Figures 9 and 10.) All employers in the miscellaneous professional services industry report either firm or tentative plans for on-campus recruiting in the spring of 2017. They also rated the job market specific to their industry higher than any of the other industries.
While government employers showed the largest planned decrease in overall hiring—due mainly to the small number of respondents—100 percent of these respondents report firm or tentative plans for on-campus recruiting in spring 2017. In addition, their job market rating specific to their industry is toward the top of the list.
FIGURE 8 TOTAL CHANGE IN HIRING, BY INDUSTRY*INDUSTRY # OF 2017
PROJECTED HIRES# OF 2016
ACTUAL HIRES % CHANGE # OF RESPONDENTS
Utilities 225 174 29.3% 5
Construction 887 683 29.9% 6
Food & Beverage Mfg. 568 519 9.4% 6
Chemical (Pharmaceutical) Mfg. 801 866 -7.5% 10
Computer & Electronics Mfg. 2,497 2,533 -1.4% 8
Misc. Mfg. 551 548 0.5% 16
Wholesale Trade 311 141 120.6% 6
Retail Trade 3,959 3,786 4.6% 9
Finance, Insurance, & Real Estate 3,403 3,383 -0.6% 19
Misc. Prof. Services** 3,409 2,703 26.1% 9
Government 828 745 -10.0% 5*Hiring projections are for U.S. locations only. (Only industries with 5 or more respondents are represented here.)** For purposes of this report, miscellaneous professional services include computer systems design services, custom computer programming services, marketing research services, research and development services, and offices of other holding companies.

10 | JOB OUTLOOK 2017
Figure 9: Spring 2017 on-campus recruiting plans, by industry
Hiring by RegionIn this year’s survey, all four geographic regions show increases in college hiring. (See Figure 11. For a list of states that correspond to each region, please see Figure 54 in the Appendix.)
Not only does the Midwest region report the largest overall increase in hiring (7.1 percent), it also has the largest group of respondents (40.4
FIGURE 10 JOB MARKET RATINGS, BY INDUSTRYINDUSTRY AVERAGE
RATINGNUMBER OF
RESPONDENTS
Misc. Prof. Services 4.20 10
Computer & Electronics Mfg. 3.90 10
Accounting Services 3.80 5
Finance, Insurance, & Real Estate 3.62 21
Government 3.60 5
Misc. Mfg. 3.58 19
Food & Beverage Mfg. 3.43 7
Chemical (Pharmaceutical) Mfg. 3.42 12
Wholesale Trade 3.33 6
Construction 3.25 8
Utilities 3.17 6
Retail Trade 3.10 10
Transportation 3.00 5
Engineering Services 2.60 5
FIGURE 9 SPRING 2017 ON-CAMPUS RECRUITING PLANS, BY INDUSTRY
INDUSTRY FIRM PLANS IN PLACE
TENTATIVE PLANS
ALL RECRUITING
IN FALL 2016
NOT HIRING UNSURE NUMBER OF
RESPONDENTS
Utilities 0.0% 50.0% 16.7% 0.0% 33.3% 6
Construction 33.3% 44.4% 11.1% 0.0% 11.1% 9
Food & Beverage Mfg. 28.6% 28.6% 14.3% 0.0% 28.6% 7
Chemical (Pharmaceutical) Mfg. 16.7% 0.0% 50.0% 0.0% 33.3% 12
Computer & Electronics Mfg. 40.0% 40.0% 0.0% 10.0% 10.0% 10
Misc. Mfg. 31.6% 42.1% 0.0% 0.0% 26.3% 19
Wholesale Trade 16.7% 16.7% 33.3% 16.7% 16.7% 6
Retail Trade 70.0% 10.0% 10.0% 0.0% 10.0% 10
Transportation 40.0% 60.0% 0.0% 0.0% 0.0% 5
Finance, Insurance, & Real Estate 38.1% 33.3% 19.0% 0.0% 9.5% 21
Accounting Services 60.0% 0.0% 40.0% 0.0% 0.0% 5
Engineering Services 0.0% 20.0% 60.0% 0.0% 20.0% 5
Misc. Prof. Services 80.0% 20.0% 0.0% 0.0% 0.0% 10
Government 80.0% 20.0% 0.0% 0.0% 0.0% 5

JOB OUTLOOK 2017 | 11
percent) that indicate they will increase their individual hiring numbers. (See Figure 12.)
The West region is showing the lowest planned increase (3.9 percent); it also has the largest percentage of respondents planning to decrease their individual number of college hires (14.3 percent).
Typically, regional hiring projections are dependent upon the type of industries located within each geographic region. This year, however, the industry respondents appear to be distributed more evenly throughout all regions, causing the overall regional outlooks to be more similar and not driven by certain industries.
Like the hiring projections, spring 2017 recruiting plans by region are similar in nature this year. (See Figure 13.) In the West region, more than 80 percent of employers indicate firm or tentative plans for on-campus recruiting in the spring. The remaining three regions have nearly two-thirds of respondents with either firm or tentative plans.
Although the Midwest region is planning the largest hiring increase, it also has the largest percentage of respondents that are still unsure of their on-campus recruiting plans for the spring of 2017. However, none of the respondents in the Midwest region indicated that they aren’t hiring and won’t be on campus this spring. Similarly, none of the respondents from the Southeast reported they aren’t hiring on campus this spring; the overall increase in hiring among these employers is the second-highest at 6 percent.
FIGURE 13 SPRING 2017 RECRUITING PLANS, BY REGIONREGION FIRM PLANS IN
PLACE TENTATIVE PLANS ALL RECRUITING IN FALL 2016 NOT HIRING UNSURE
Northeast 43.9% 19.5% 19.5% 2.4% 14.6%
Southeast 29.7% 32.4% 24.3% 0.0% 13.5%
Midwest 38.3% 27.7% 17.0% 0.0% 17.0%
West 47.6% 33.3% 0.0% 9.5% 9.5%
FIGURE 12 HIRING EXPECTATIONS BY REGION, BY PERCENT OF RESPONDENTSREGION INCREASE MAINTAIN DECREASE
Northeast 31.7% 58.5% 9.8%
Southeast 37.8% 48.6% 13.5%
Midwest 40.4% 48.9% 10.6%
West 33.3% 52.4% 14.3%
FIGURE 11 TOTAL CHANGE IN HIRING, BY REGIONREGION # OF 2017
PROJECTED HIRES# OF 2016
ACTUAL HIRES % CHANGE # OFRESPONDENTS
Northeast 14,239 13,505 5.4% 38
Southeast 3,271 3,085 6.0% 29
Midwest 8,103 7,567 7.1% 39
West 2,854 2,746 3.9% 19
12 | JOB OUTLOOK 2017
WHO’S IN DEMAND?
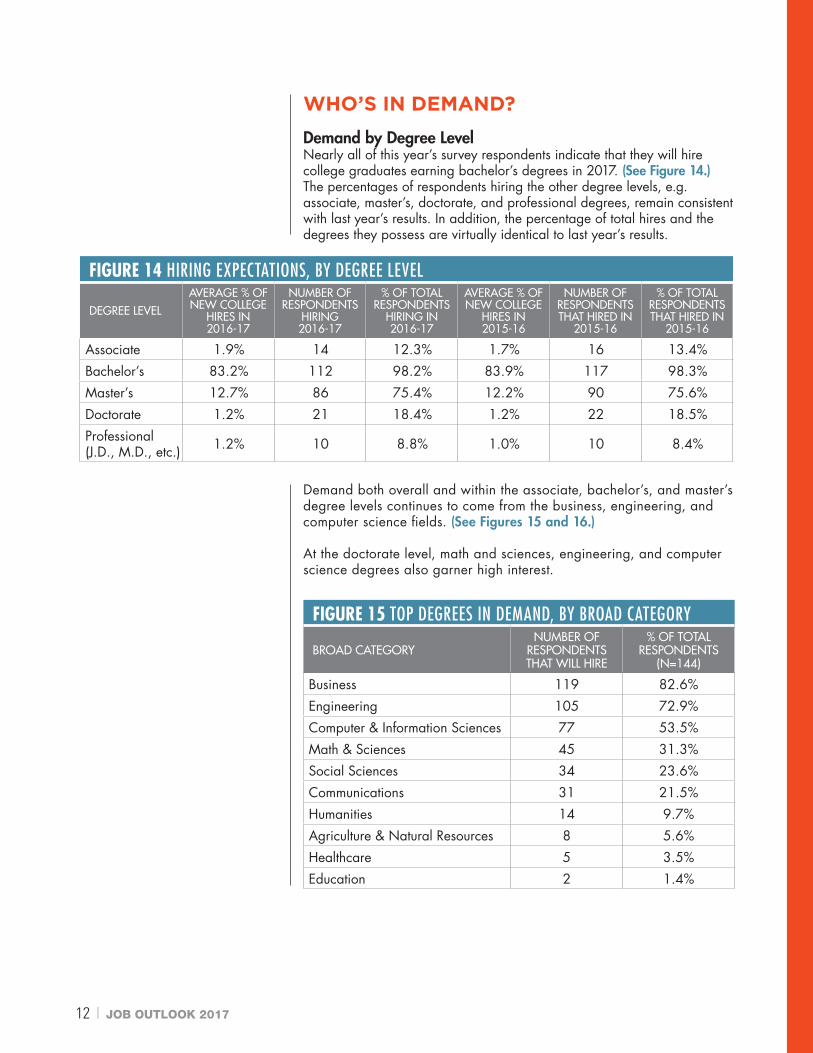
Demand by Degree LevelNearly all of this year’s survey respondents indicate that they will hire college graduates earning bachelor’s degrees in 2017. (See Figure 14.) The percentages of respondents hiring the other degree levels, e.g. associate, master’s, doctorate, and professional degrees, remain consistent with last year’s results. In addition, the percentage of total hires and the degrees they possess are virtually identical to last year’s results.
Demand both overall and within the associate, bachelor’s, and master’s degree levels continues to come from the business, engineering, and computer science fields. (See Figures 15 and 16.)
At the doctorate level, math and sciences, engineering, and computer science degrees also garner high interest.
FIGURE 14 HIRING EXPECTATIONS, BY DEGREE LEVEL
DEGREE LEVELAVERAGE % OF NEW COLLEGE
HIRES IN 2016-17
NUMBER OF RESPONDENTS
HIRING 2016-17
% OF TOTAL RESPONDENTS
HIRING IN 2016-17
AVERAGE % OF NEW COLLEGE
HIRES IN 2015-16
NUMBER OF RESPONDENTS THAT HIRED IN
2015-16
% OF TOTAL RESPONDENTS THAT HIRED IN
2015-16
Associate 1.9% 14 12.3% 1.7% 16 13.4%
Bachelor’s 83.2% 112 98.2% 83.9% 117 98.3%
Master’s 12.7% 86 75.4% 12.2% 90 75.6%
Doctorate 1.2% 21 18.4% 1.2% 22 18.5%
Professional (J.D., M.D., etc.) 1.2% 10 8.8% 1.0% 10 8.4%
FIGURE 15 TOP DEGREES IN DEMAND, BY BROAD CATEGORY
BROAD CATEGORYNUMBER OF
RESPONDENTS THAT WILL HIRE
% OF TOTAL RESPONDENTS
(N=144)
Business 119 82.6%
Engineering 105 72.9%
Computer & Information Sciences 77 53.5%
Math & Sciences 45 31.3%
Social Sciences 34 23.6%
Communications 31 21.5%
Humanities 14 9.7%
Agriculture & Natural Resources 8 5.6%
Healthcare 5 3.5%
Education 2 1.4%

JOB OUTLOOK 2017 | 13
FIGURE 16 TOP DEGREES IN DEMAND, BY DEGREE LEVEL AND BROAD CATEGORY
BROAD CATEGORYNUMBER OF
RESPONDENTS THAT WILL HIRE
% OF TOTAL RESPONDENTS
(N=144)
Computer & Information Sciences 6 4.2%
Business 3 2.1%
Engineering 2 1.4%
Communications 1 0.7%
Healthcare 1 0.7%
Agriculture & Natural Resources 0 0.0%
Education 0 0.0%
Humanities 0 0.0%
Math & Sciences 0 0.0%
Social Sciences 0 0.0%
BROAD CATEGORYNUMBER OF
RESPONDENTS THAT WILL HIRE
% OF TOTAL RESPONDENTS (N=144)
Business 112 77.8%
Engineering 101 70.1%
Computer & Information Sciences 78 54.2%
Math & Sciences 39 27.1%
Social Sciences 34 23.6%
Communications 27 18.8%
Humanities 14 9.7%
Agriculture & Natural Resources 8 5.6%
Healthcare 4 2.8%
Education 2 1.4%
BROAD CATEGORYNUMBER OF
RESPONDENTS THAT WILL HIRE
% OF TOTAL RESPONDENTS (N=144)
Business 65 45.1%
Engineering 47 32.6%
Computer & Information Sciences 36 25.0%
Math & Sciences 21 14.6%
Social Sciences 11 7.6%
Healthcare 4 2.8%
Communications 3 2.1%
Agriculture & Natural Resources 2 1.4%
Education 0 0.0%
Humanities 0 0.0%
ASSOCIATE
BACHELOR’S
MASTER’S

14 | JOB OUTLOOK 2017
Top MajorsDemand for individual majors at the bachelor’s degree level shows a slight shift toward business majors. (See Figure 17.) The top three bachelor’s degrees in demand for the Class of 2017 are finance, accounting, and business administration/management. While computer science falls fourth on the list this year, it was the second highest in demand last year.
Figures 18 through 24 show the demand for individual majors within seven broad categories at the bachelor’s degree level. Highlights are as follows:
• More than three-quarters of respondents that will hire business majors plan to hire finance, accounting, and business administration/management majors. All three majors are nearly equal in demand this year. (See Figure 18.)
FIGURE 16 TOP DEGREES IN DEMAND, BY DEGREE LEVEL AND BROAD CATEGORY
BROAD CATEGORYNUMBER OF
RESPONDENTS THAT WILL HIRE
% OF TOTAL RESPONDENTS
(N=144)
Engineering 13 9.0%
Math & Sciences 10 6.9%
Computer & Information Sciences 5 3.5%
Agriculture & Natural Resources 2 1.4%
Business 2 1.4%
Healthcare 1 0.7%
Social Sciences 1 0.7%
Communications 0 0.0%
Education 0 0.0%
Humanities 0 0.0%
DOCTORATE
FIGURE 17 TOP DEGREES IN DEMAND (BACHELOR’S DEGREE LEVEL)MAJOR # OF RESPONDENTS
THAT WILL HIRE% OF TOTAL RESPONDENTS
THAT WILL HIRE
Finance 87 60.4%
Accounting 86 59.7%
Business Administration/Mgmt. 86 59.7%
Computer Science 73 50.7%
Mechanical Engineering 70 48.6%
Management Information Systems 67 46.5%
Information Sciences & Systems 67 46.5%
Logistics/Supply Chain 63 43.8%
Electrical Engineering 57 39.6%
Economics 56 38.9%

JOB OUTLOOK 2017 | 15
• Mechanical and electrical engineering majors continue to gain the most interest from respondents hiring engineering majors, as more than half of respondents plan to hire these particular majors. (See Figure 19.)
• Among respondents that will hire computer-related majors, slightly more than 90 percent will hire specific “computer science” majors. (See Figure 20.) This demand is also evident in the most recent NACE Fall 2016 Salary Survey, which reported computer science majors as the highest-paid for the Class of 2016 at $75,980.
• More than 80 percent of respondents that plan to hire graduates with math and science degrees will directly target math/statistics majors. (See Figure 21.) Interest in the remaining science degrees specified drops to approximately one-quarter of respondents or less.
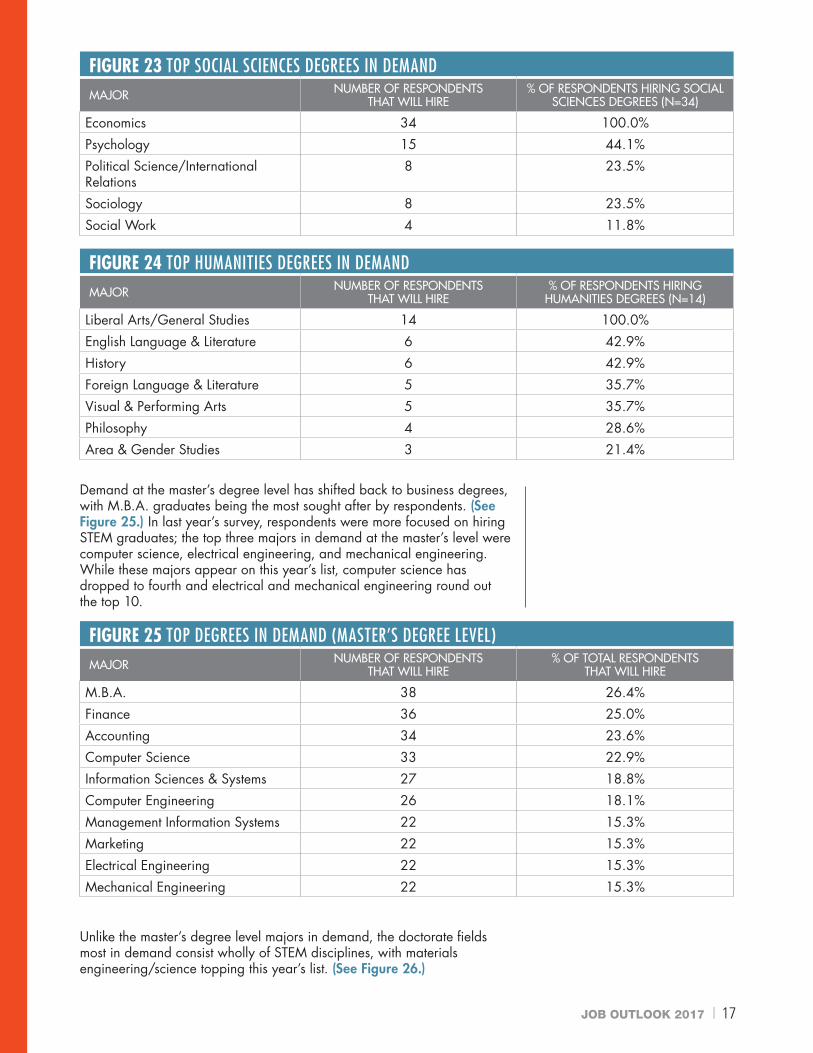
• All respondents hiring within the broad category of social sciences majors are planning to hire economics majors, exclusively. (See Figure 23.)
• Of students earning degrees in the humanities, those earning liberal arts/general studies will be pursued by all respondents hiring within this category of majors. (See Figure 24.)
FIGURE 18 TOP BUSINESS DEGREES IN DEMAND
MAJORNUMBER OF
RESPONDENTS THAT WILL HIRE
% OF RESPONDENTS
HIRING BUSINESS DEGREES (N=112)
Finance 87 77.7%
Accounting 86 76.8%
Business Administration/Mgmt. 86 76.8%
Management Information Systems 67 59.8%
Logistics/Supply Chain 63 56.3%
Economics 56 50.0%
Marketing 55 49.1%
Sales 55 49.1%
Human Resources 45 40.2%
International Business 22 19.6%
Actuary 16 14.3%
Hospitality Management 8 7.1%

16 | JOB OUTLOOK 2017
FIGURE 20 TOP COMPUTER AND INFORMATION SCIENCE DEGREES IN DEMAND
MAJOR NUMBER OF RESPONDENTS THAT WILL HIRE
% OF RESPONDENTS HIRING COMPUTER & INFORMATION
SCIENCE DEGREES (N=78)
Computer Science 73 93.6%
Information Sciences & Systems 67 85.9%
Software Applications 49 62.8%
FIGURE 21 TOP MATH AND SCIENCE DEGREES IN DEMANDMAJOR NUMBER OF RESPONDENTS THAT
WILL HIRE% OF RESPONDENTS HIRING MATH
& SCIENCE DEGREES (N=39)
Mathematics/Statistics 32 82.1%
Chemistry 11 28.2%
Biology/Biological Sciences 9 23.1%
Physics 8 20.5%
Environmental Science 7 17.9%
Construction Science 6 15.4%
Geology/Geological Sciences 6 15.4%
FIGURE 22 TOP COMMUNICATIONS DEGREES IN DEMAND
MAJOR NUMBER OF RESPONDENTS THAT WILL HIRE
% OF RESPONDENTS HIRING COMMUNICATIONS DEGREES
(N=27)
Communications 26 96.3%
Public Relations 13 48.1%
Advertising 8 29.6%
Journalism 8 29.6%
FIGURE 19 TOP ENGINEERING DEGREES IN DEMAND
MAJOR NUMBER OF RESPONDENTS THAT WILL HIRE
% OF RESPONDENTS HIRING ENGINEERING DEGREES
(N=101)
Mechanical Engineering 70 69.3%
Electrical Engineering 57 56.4%
Industrial/Manufacturing Engineering 47 46.5%
Computer Engineering 45 44.6%
Chemical Engineering 42 41.6%
Civil Engineering 33 32.7%
Software Engineering 32 31.7%
Materials Engineering/Science 31 30.7%
Engineering Technology 26 25.7%
Systems Engineering 22 21.8%
Environmental Engineering 19 18.8%
Aerospace/Aeronautical Engineering 16 15.8%
Biomedical Engineering 10 9.9%
Nuclear Engineering 9 8.9%
Petroleum Engineering 5 5.0%
JOB OUTLOOK 2017 | 17
Demand at the master’s degree level has shifted back to business degrees, with M.B.A. graduates being the most sought after by respondents. (See Figure 25.) In last year’s survey, respondents were more focused on hiring STEM graduates; the top three majors in demand at the master’s level were computer science, electrical engineering, and mechanical engineering. While these majors appear on this year’s list, computer science has dropped to fourth and electrical and mechanical engineering round out the top 10.
Unlike the master’s degree level majors in demand, the doctorate fields most in demand consist wholly of STEM disciplines, with materials engineering/science topping this year’s list. (See Figure 26.)
FIGURE 25 TOP DEGREES IN DEMAND (MASTER’S DEGREE LEVEL)MAJOR NUMBER OF RESPONDENTS
THAT WILL HIRE% OF TOTAL RESPONDENTS
THAT WILL HIRE
M.B.A. 38 26.4%
Finance 36 25.0%
Accounting 34 23.6%
Computer Science 33 22.9%
Information Sciences & Systems 27 18.8%
Computer Engineering 26 18.1%
Management Information Systems 22 15.3%
Marketing 22 15.3%
Electrical Engineering 22 15.3%
Mechanical Engineering 22 15.3%
FIGURE 23 TOP SOCIAL SCIENCES DEGREES IN DEMANDMAJOR NUMBER OF RESPONDENTS
THAT WILL HIRE% OF RESPONDENTS HIRING SOCIAL
SCIENCES DEGREES (N=34)
Economics 34 100.0%
Psychology 15 44.1%
Political Science/International Relations
8 23.5%
Sociology 8 23.5%
Social Work 4 11.8%
FIGURE 24 TOP HUMANITIES DEGREES IN DEMANDMAJOR NUMBER OF RESPONDENTS
THAT WILL HIRE% OF RESPONDENTS HIRING
HUMANITIES DEGREES (N=14)
Liberal Arts/General Studies 14 100.0%
English Language & Literature 6 42.9%
History 6 42.9%
Foreign Language & Literature 5 35.7%
Visual & Performing Arts 5 35.7%
Philosophy 4 28.6%
Area & Gender Studies 3 21.4%

18 | JOB OUTLOOK 2017
Not surprisingly, the bachelor’s degree majors in demand by all four geographic regions are predominantly business. (See Figures 27 through 30.)
FIGURE 26 TOP DEGREES IN DEMAND (DOCTORATE DEGREE LEVEL)MAJOR # OF RESPONDENTS THAT WILL HIRE % OF TOTAL RESPONDENTS THAT
WILL HIRE
Materials Engineering/Science 7 4.9%
Electrical Engineering 6 4.2%
Computer Science 5 3.5%
Chemical Engineering 5 3.5%
Mechanical Engineering 4 2.8%
Chemistry 4 2.8%
Software Applications 3 2.1%
Computer Engineering 3 2.1%
Software Engineering 3 2.1%
Mathematics/Statistics 3 2.1%
FIGURE 27 TOP FIVE UNDERGRADUATE MAJORS—NORTHEAST
MAJOR# OF NORTHEAST
RESPONDENTS THAT WILL HIRE
% OF NORTHEAST RESPONDENTS THAT
WILL HIRE
% OF TOTAL RESPONDENTS THAT
WILL HIRE
Finance 27 65.9% 60.4%
Business Administration/Mgmt. 26 63.4% 59.7%
Accounting 24 58.5% 59.7%
Economics 22 53.7% 38.9%
Logistics/Supply Chain 22 53.7% 43.8%
FIGURE 28 TOP FIVE UNDERGRADUATE MAJORS—SOUTHEAST
MAJOR# OF SOUTHEAST
RESPONDENTS THAT WILL HIRE
% OF SOUTHEAST RESPONDENTS THAT
WILL HIRE
% OF TOTAL RESPONDENTS THAT
WILL HIRE
Business Administration/Mgmt. 19 52.8% 59.7%
Computer Science 19 52.8% 50.7%
Accounting 18 50.0% 59.7%
Finance 16 44.4% 60.4%
Management Information Systems 16 44.4% 46.5%
FIGURE 29 TOP FIVE UNDERGRADUATE MAJORS—MIDWEST
MAJOR# OF MIDWEST
RESPONDENTS THAT WILL HIRE
% OF MIDWEST RESPONDENTS THAT
WILL HIRE
% OF TOTAL RESPONDENTS THAT
WILL HIRE
Accounting 30 63.8% 59.7%
Finance 29 61.7% 60.4%
Business Administration/Mgmt. 28 59.6% 59.7%
Mechanical Engineering 23 48.9% 48.6%
Sales 23 48.9% 38.2%

JOB OUTLOOK 2017 | 19
Employers in the utilities industry are the most interested in the top five majors in demand at the bachelor’s degree level. Five out of the six responding utilities employers indicate interest in four of the five top majors, with all respondents reporting they will hire mechanical engineering majors. (See Figure 31.) Government employers also show high interest in the top five majors, with all of their respondents indicating they will hire finance, accounting, and business administration/management majors.
While the West region is projecting the smallest increase in hiring for Class of 2017 college graduates, employers here exhibit the most interest in the top five majors in demand at the bachelor’s degree level. (See Figure 32.)
FIGURE 31 WHO IS HIRING, BY INDUSTRY (BACHELOR’S DEGREE LEVEL)MAJOR MOST INTERESTED INDUSTRIES % OF INDUSTRY RESPONDENTS
FINANCE
Government 100.0%
Finance, Insurance, & Real Estate 95.2%
Utilities 83.3%
ACCOUNTING
Accounting Services 100.0%
Government 100.0%
Utilities 83.3%
BUSINESS ADMINISTRATION/ MGMT.
Accounting Services 100.0%
Government 100.0%
Utilities 83.3%
COMPUTER SCIENCE
Misc. Prof. Services 90.0%
Utilities 83.3%
Transportation 80.0%
MECHANICAL ENGINEERING
Utilities 100.0%
Food & Beverage Mfg. 85.7%
Misc. Mfg. 83.3%
FIGURE 30 TOP FIVE UNDERGRADUATE MAJORS—WEST
MAJOR# OF WEST
RESPONDENTS THAT WILL HIRE
% OF WEST RESPONDENTS THAT
WILL HIRE
% OF TOTAL RESPONDENTS THAT
WILL HIRE
Finance 15 75.0% 60.4%
Accounting 14 70.0% 59.7%
Business Administration/Mgmt. 13 65.0% 59.7%
Computer Science 11 55.0% 50.7%
Mechanical Engineering 11 55.0% 48.6%

20 | JOB OUTLOOK 2017
International Student Hiring PlansThe percentage of respondents that will hire international students has fallen again this year to 27.5 percent, making it the second lowest group in the past five years. (See Figure 33.) In other recent Job Outlook surveys, respondents reported the specific majors from which they would hire international students, which were usually STEM disciplines. Although this year’s survey did not ask for the specific majors, those most in demand by this year’s survey respondents are primarily business majors, which may be causing the drop in respondents with plans to hire international students.
FIGURE 32 WHO IS HIRING, BY REGION (BACHELOR’S DEGREE LEVEL)MAJOR MOST INTERESTED
REGIONS % OF REGION’S RESPONDENTS
FINANCE
West 75.0%Northeast 65.9%Midwest 61.7%Southeast 44.4%
ACCOUNTING
West 70.0%Midwest 63.8%Northeast 58.5%Southeast 50.0%
BUSINESS ADMINISTRATION/ MGMT.
West 65.0%Northeast 63.4%Midwest 59.6%Southeast 52.8%
COMPUTER SCIENCE
West 55.0%
Northeast 53.7%
Southeast 52.8%
Midwest 44.7%
MECHANICAL ENGINEERING
West 55.0%
Northeast 51.2%
Midwest 48.9%
Southeast 41.7%
24.2%28.1% 27.5%
33.8% 34.2% 32.8%
PERC
ENT
OF
RESP
ON
DEN
TS
RECRUITING YEAR
0
10
20
40
30
2012 2013 2014 2015 2016 2017
FIGURE 33 INTERNATIONAL STUDENT HIRING PLANS, 2012 – 2017

JOB OUTLOOK 2017 | 21
By industry, computer and electronics manufacturers show the most interest in hiring international students from the Class of 2017, as almost two-thirds of respondents have plans to do so. (See Figure 34.) Employers in computer and electronics manufacturing—an industry that hires mainly STEM disciplines—had the most interest in hiring international students in last year’s report.
Demand for international students has dropped in three of the four geographic regions this year. (See Figure 35.) More employers in the West region plan to hire international students, with more than one-third reporting they will do so. This may be due to the fact that the type of industries located in the West region exhibit the most interest in hiring these graduates.
FIGURE 34 INTERNATIONAL STUDENT HIRING PLANS, BY INDUSTRYINDUSTRY % OF RESPONDENTS THAT PLAN TO
HIRE INTERNATIONAL STUDENTS
Computer & Electronics Mfg. 63.6%
Accounting Services 60.0%
Misc. Prof. Services 58.3%
Construction 55.6%
Transportation 40.0%
Information 33.3%
Finance, Insurance & Real Estate 27.6%
Food & Beverage Mfg. 25.0%
Chemical (Pharmaceutical) Mfg. 23.1%
Engineering Services 20.0%
Government 16.7%
Misc. Mfg. 10.0%
37%
24%
29%
36%
29%
28%
26%
31%
28%
33% 35
%
32%
49%
41%
39%
32%
PERC
ENT
OF
RESP
ON
DEN
TS
REGION
2017 2016 2015
0
30
20
10
40
50
NORTHEAST SOUTHEAST MIDWEST WEST
FIGURE 35 INTERNATIONAL STUDENT HIRING PLANS, BY REGION
2014
22 | JOB OUTLOOK 2017
EMPLOYERS’ VIEW OF CANDIDATES
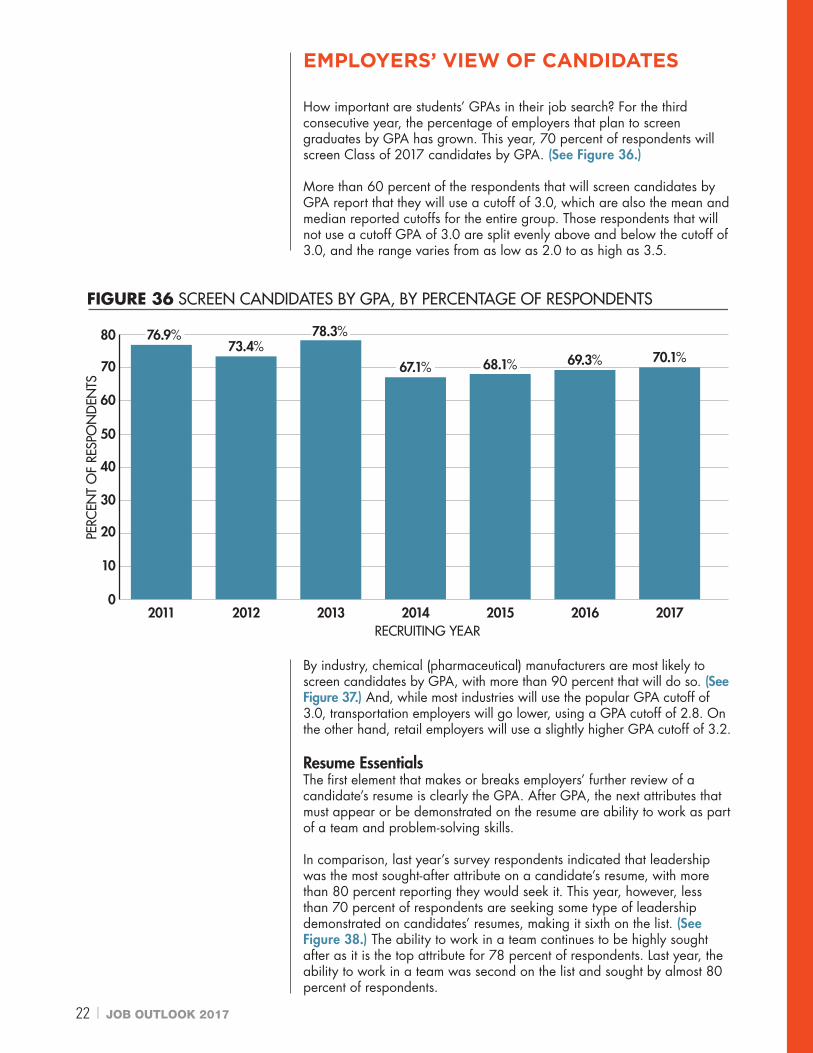
How important are students’ GPAs in their job search? For the third consecutive year, the percentage of employers that plan to screen graduates by GPA has grown. This year, 70 percent of respondents will screen Class of 2017 candidates by GPA. (See Figure 36.)
More than 60 percent of the respondents that will screen candidates by GPA report that they will use a cutoff of 3.0, which are also the mean and median reported cutoffs for the entire group. Those respondents that will not use a cutoff GPA of 3.0 are split evenly above and below the cutoff of 3.0, and the range varies from as low as 2.0 to as high as 3.5.
By industry, chemical (pharmaceutical) manufacturers are most likely to screen candidates by GPA, with more than 90 percent that will do so. (See Figure 37.) And, while most industries will use the popular GPA cutoff of 3.0, transportation employers will go lower, using a GPA cutoff of 2.8. On the other hand, retail employers will use a slightly higher GPA cutoff of 3.2.
Resume EssentialsThe first element that makes or breaks employers’ further review of a candidate’s resume is clearly the GPA. After GPA, the next attributes that must appear or be demonstrated on the resume are ability to work as part of a team and problem-solving skills.
In comparison, last year’s survey respondents indicated that leadership was the most sought-after attribute on a candidate’s resume, with more than 80 percent reporting they would seek it. This year, however, less than 70 percent of respondents are seeking some type of leadership demonstrated on candidates’ resumes, making it sixth on the list. (See Figure 38.) The ability to work in a team continues to be highly sought after as it is the top attribute for 78 percent of respondents. Last year, the ability to work in a team was second on the list and sought by almost 80 percent of respondents.
73.4%76.9% 78.3%
67.1% 68.1% 69.3% 70.1%
PERC
ENT
OF
RESP
ON
DEN
TS
RECRUITING YEAR2011
0
20
10
40
30
60
50
70
80
2012 2013 2014 2015 2016 2017
FIGURE 36 SCREEN CANDIDATES BY GPA, BY PERCENTAGE OF RESPONDENTS

JOB OUTLOOK 2017 | 23
While problem-solving skills may be difficult to exhibit on a resume, they are second on this year’s list of attributes and will be required by more than two-thirds of respondents. Rounding out the top three are written communication skills, which will be sought by 75 percent of respondents.
FIGURE 37 SCREEN CANDIDATES BY GPA, BY INDUSTRYINDUSTRY % OF RESPONDENTS GPA CUTOFF (REPORTED MEDIAN)
Chemical (Pharmaceutical) Mfg. 90.9% 3.0
Misc. Prof. Services 85.7% 3.0
Misc. Mfg. 84.2% 3.0
Accounting Services 80.0% 3.0
Retail Trade 77.8% 3.2
Management Consulting 75.0% 3.0
Finance, Insurance & Real Estate 73.7% 3.0
Food & Beverage Mfg. 66.7% 2.9
Computer & Electronics Mfg. 66.7% 3.0
Transportation 60.0% 2.8
Engineering Services 60.0% 2.9
Motor Vehicle Mfg. 50.0% 3.0
Wholesale Trade 50.0% 3.0
Government 40.0% 2.9
Construction 11.1% 3.0
FIGURE 38 ATTRIBUTES EMPLOYERS SEEK ON A CANDIDATE’S RESUMEATTRIBUTE % OF RESPONDENTS
Ability to work in a team 78.0%
Problem-solving skills 77.3%
Communication skills (written) 75.0%
Strong work ethic 72.0%
Communication skills (verbal) 70.5%
Leadership 68.9%
Initiative 65.9%
Analytical/quantitative skills 64.4%
Flexibility/adaptability 63.6%
Detail-oriented 62.1%
Interpersonal skills (relates well to others) 58.3%
Technical skills 56.8%
Computer skills 49.2%
Organizational ability 47.7%
Strategic planning skills 37.9%
Friendly/outgoing personality 25.8%
Tactfulness 25.8%
Creativity 21.2%
Entrepreneurial skills/risk-taker 19.7%
Fluency in a foreign language 4.5%

24 | JOB OUTLOOK 2017
Candidate 1 Versus Candidate 2: Deciding AttributesWhen two candidates are equally qualified for a position, respondents indicate that the academic major is still the deciding factor. In both this year’s and last year’s surveys, respondents rated “academic major” as having a great deal of influence when deciding on one candidate over another. (See Figure 39.)
While it may not need to be seen specifically on a candidate’s resume, having held a leadership position may be the second most influential deciding factor when considering two candidates. In addition, involvement in extracurricular activities and a high GPA (above 3.0) also have at least somewhat of an influence on deciding between candidates.
The remaining attributes—school attended, volunteer work, fluency in a foreign language, and study abroad—have far less of an influence in the hiring decisions made by respondents.
Career ReadinessIn October 2015, NACE released its definition of and competencies associated with career readiness.
In this report, employers were asked to rate the seven competencies plus an additional competency—“global/multicultural fluency”—in terms of essential need in the scope of hiring their new college graduates, and rate recent graduates in terms of their proficiency in each of the eight competencies. The results are outlined in Figures 40 and 41.
In terms of essential need ratings, the competency “critical think/problem solving” has been rated highest for the third time since employers have been asked to provide these particular ratings. “Professionalism/work ethic” is rated second highest, as it was in last year’s Job Outlook 2016 Spring Update Survey. (See Figure 40.)
“Oral/written communications” and “teamwork/collaboration” are rated equally as essential this year, with last year’s results showing a slightly higher need for teamwork (4.6) than communications (4.4). (Note: The preference for teamwork was also indicated earlier in this report; see Figure 38, which showed that 78 percent of respondents looked for teamwork as the most important attribute on a candidate’s resume.)
FIGURE 39 INFLUENCE OF ATTRIBUTESATTRIBUTE 2017 AVERAGE
INFLUENCE RATING*2016 AVERAGE
INFLUENCE RATING
Major 4.0 4.0
Has held leadership position 3.9 3.9
Has been involved in extracurricular activities (clubs, sports, student government, etc.)
3.6 3.6
High GPA (3.0 or above) 3.6 3.5
School attended 2.9 2.9
Has done volunteer work 2.6 2.8
Is fluent in a foreign language 2.1 2.2
Has studied abroad 2.0 2.0*5-point scale, where 1=No influence at all, 2=Not much influence, 3=Somewhat of an influence, 4=Very much influence, and 5=Extreme influence.

JOB OUTLOOK 2017 | 25
“Leadership,” “information technology application,” and “career management” were somewhat essential in terms of rating; respondents rated “global/multicultural fluency” as just less than somewhat essential in terms of need.
In terms of proficiency, recent graduates come closest to the “very proficient” rating in just two competencies—“teamwork/collaboration” and “information technology application.” (See Figure 41.)
Work ExperienceNot only do employers look for certain attributes on their candidates’ resumes and want them to possess certain key skills and qualities, but they also consider work experience when hiring new graduates. Nearly two-thirds of respondents this year prefer that their candidates have relevant work experience, and the group of respondents having this preference has dominated over the last several years. (See Figure 42.) Although slightly more than one-quarter of remaining respondents prefer work experience of any type, a mere 5 percent this year say that work experience is not a factor when hiring new graduates.
FIGURE 41 EMPLOYERS RATE RECENT GRADUATES ON THE 8 CAREER READINESS COMPETENCIESCOMPETENCIES WEIGHTED AVERAGE RATING*
Teamwork/Collaboration 3.96
Information Technology Application 3.92
Critical Thinking/Problem Solving 3.59
Professionalism/Work Ethic 3.43
Oral/Written Communications 3.41
Leadership 3.38
Career Management 3.09
Global/Multicultural Fluency 2.93*5-point scale, where 1=Not at all proficient, 2=Not very proficient, 3=Somewhat proficient, 4=Very proficient, 5=Extremely proficient
FIGURE 40 EMPLOYERS RATE THE ESSENTIAL NEED OF THE CAREER READINESS COMPETENCIESCOMPETENCIES WEIGHTED AVERAGE RATING*
Critical Thinking/Problem Solving 4.58
Professionalism/Work Ethic 4.56
Oral/Written Communications 4.43
Teamwork/Collaboration 4.43
Leadership 3.86
Information Technology Application 3.78
Career Management 3.47
Global/Multicultural Fluency 2.85*5-point scale, where 1=Not essential, 2=Not very essential, 3=Somewhat essential, 4=Essential, 5=Absolutely essential

26 | JOB OUTLOOK 2017
As far as how a graduate’s work experience was gained, more than half of respondents prefer that it came from an internship or co-op. (See Figure 43.) This group of respondents has fallen some, down from 60 percent of respondents two years ago and 57 percent last year to 56 percent this year. The remaining 44 percent of respondents have no preference in how work experience was gained.
FIGURE 42 EMPLOYERS HIRING PREFERENCES RELATIVE TO EXPERIENCE, BY PERCENT OF RESPONDENTSHIRING PREFERENCE 2017 2016 2015 2014 2013
I prefer to hire candidates with relevant work experience
64.5% 64.2% 72.5% 74.1% 71.0%
I prefer to hire candidates with any type of work experience (doesn’t matter if it’s relevant or not, just some type of experience)
26.1% 27.0% 20.1% 20.7% 19.9%
Work experience doesn’t typically factor into my decision when hiring a new college graduate
5.1% 6.3% 3.9% 1.1% 4.8%
Other 4.3% 2.5% 3.4% 4.0% 4.3%
44%
56%
NO PREFERENCE
INTERNSHIP/CO-OP
FIGURE 43 EMPLOYERS’ PREFERENCE AS TO HOW WORK EXPERIENCE WAS GAINED, BY PERCENT OF RESPONDENTS
JOB OUTLOOK 2017 | 27
COMPENSATION AND SIGNING BONUSES
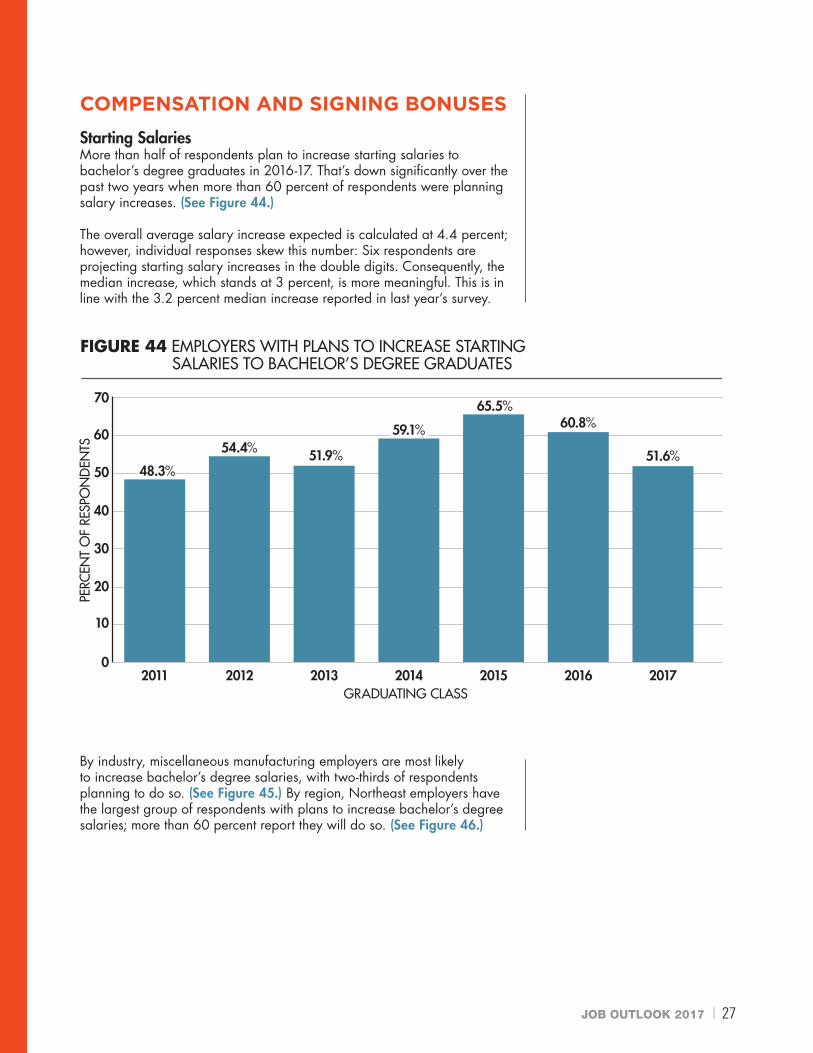
Starting SalariesMore than half of respondents plan to increase starting salaries to bachelor’s degree graduates in 2016-17. That’s down significantly over the past two years when more than 60 percent of respondents were planning salary increases. (See Figure 44.)
The overall average salary increase expected is calculated at 4.4 percent; however, individual responses skew this number: Six respondents are projecting starting salary increases in the double digits. Consequently, the median increase, which stands at 3 percent, is more meaningful. This is in line with the 3.2 percent median increase reported in last year’s survey.
By industry, miscellaneous manufacturing employers are most likely to increase bachelor’s degree salaries, with two-thirds of respondents planning to do so. (See Figure 45.) By region, Northeast employers have the largest group of respondents with plans to increase bachelor’s degree salaries; more than 60 percent report they will do so. (See Figure 46.)
54.4%
48.3%51.9%
59.1%
65.5%60.8%
51.6%
PERC
ENT
OF
RESP
ON
DEN
TS
GRADUATING CLASS2011
0
20
10
40
30
50
60
70
2012 2013 2014 2015 2016 2017
FIGURE 44 EMPLOYERS WITH PLANS TO INCREASE STARTING SALARIES TO BACHELOR’S DEGREE GRADUATES

28 | JOB OUTLOOK 2017
Signing Bonuses This year, the percentage of respondents that plan to offer signing bonuses to Class of 2017 graduates is the highest it has been in the last five years. More than 55 percent of respondents have plans to offer signing bonuses to graduates of the Class of 2017. (See Figure 47.)
The original plans for Class of 2016 graduates to receive signing bonuses in last year’s survey was also the highest, and this year’s findings show that the percentage of respondents that actually extended signing bonuses to Class of 2016 graduates was even higher than planned at 54.2 percent of respondents.
Although a large percentage of respondents will offer signing bonuses in 2016-17, not all graduates can expect to receive them. More than six in 10 respondents will only offer signing bonuses to selected graduates, and those most likely to receive them will be in the business, engineering, or computer science fields.
By industry, the manufacturing sector contains the industries most likely to offer signing bonuses to Class of 2017 graduates. More than 70 percent of respondents in chemical (pharmaceutical), computer and electronics, and food and beverage manufacturing have plans to offer signing bonuses. (See Figure 48.) By region, employers in the Northeast have the most respondents planning to offer signing bonuses in 2016-17. (See Figure 49.)
FIGURE 46 EMPLOYERS WITH PLANS TO INCREASE STARTING SALARIES, BY REGION
REGION# OF RESPONDENTS WITH
PLANS TO INCREASE BACHELOR’S SALARIES
# OF RESPONDENTSBY REGION % OF RESPONDENTS
BY REGION
AVERAGE PROJECTED INCREASE
Northeast 17 28 60.7% 4.2%
Southeast 9 21 42.9% 7.4%*
Midwest 16 30 53.3% 3.6%
West 7 16 43.8% 3.0%*The average projected increase in the Southeast is skewed. Of the nine total respondents, three are planning increases of 10 percent, 12.5 percent, and 20 percent. This is driving the overall average projected increase upward.
FIGURE 45 EMPLOYERS WITH PLANS TO INCREASE STARTING SALARIES, BY INDUSTRY
INDUSTRY
# OF RESPONDENTS WITH PLANS TO
INCREASE BACHELOR’S SALARIES
# OF RESPONDENTSBY INDUSTRY
% OF RESPONDENTSBY INDUSTRY
Misc. Mfg. 8 12 66.7%
Food & Beverage Mfg. 3 5 60.0%
Chemical (Pharmaceutical) Mfg. 4 9 44.4%
Retail Trade 4 9 44.4%
Finance, Insurance, & Real Estate 6 14 42.9%
Construction 2 5 40.0%
Misc. Prof. Services 2 5 40.0%
Utilities 2 5 40.0%

JOB OUTLOOK 2017 | 29
FIGURE 48 PERCENT OF EMPLOYERS OFFERING SIGNING BONUSES TO 2016-17 GRADUATES, BY INDUSTRYINDUSTRY % OFFERING SIGNING BONUSES # OF RESPONDENTS
Chemical (Pharmaceutical) Mfg. 81.8% 11
Computer & Electronics Mfg. 80.0% 10
Food & Beverage Mfg. 71.4% 7
Retail Trade 70.0% 10
Misc. Prof. Services 66.7% 9
Accounting Services 60.0% 5
Finance, Insurance & Real Estate 55.0% 20
Construction 44.4% 9
Misc. Mfg. 42.1% 19
Engineering Services 40.0% 5
Government 40.0% 5
Wholesale Trade 33.3% 6
Transportation 20.0% 5
Utilities 16.7% 6
FIGURE 49 PERCENT OF EMPLOYERS OFFERING SIGNING BONUSES TO 2016-17 GRADUATES, BY REGIONREGION % OFFERING SIGNING BONUSES # OF RESPONDENTS
Northeast 63.4% 41
Southeast 55.6% 36
Midwest 55.6% 45
West 38.1% 21
48.4% 48.0% 47.1% 48.8%52.9%51.0%
54.2%51.8%
55.2%
PERC
ENT
OF
RESP
ON
DEN
TS
RECRUITING YEAR2012-13
0
20
10
50
40
30
60
2013-14 2014-15 2015-16 2016-17
FIGURE 47 EMPLOYERS OFFERING SIGNING BONUSES
PLANNED ACTUAL

30 | JOB OUTLOOK 2017
Although data on signing bonus amounts by major tend to be somewhat limited, Figure 50 shows the projected average signing bonuses for nine majors at the bachelor’s degree level. In three out of the four cases where data were reported both this year and last year, the 2016-17 projected bonuses are somewhat higher than last year.
At the master’s degree level, data were only provided for M.B.A.s and unspecified engineering graduates. The M.B.A. projection is sizable due to six of the seven total respondents planning extremely large signing bonuses. (See Figure 51.)
FIGURE 51 AVERAGE SIGNING BONUS, BY MAJOR (MASTER’S DEGREES)*
MAJOR2016-17
AVERAGE BONUS (PROJECTED)
# OF RESPONDENTS
2016-17
2015-16 AVERAGEBONUS
(PROJECTED)
# OF RESPONDENTS
2015-16
M.B.A. $21,429 7 $9,929 7
Engineering – not specified $4,545 11 $6,100 5*Where 5 or more data points were provided.
FIGURE 50 AVERAGE SIGNING BONUS, BY MAJOR (BACHELOR’S DEGREES)*
MAJOR2016-17
AVERAGE BONUS (PROJECTED)
# OF RESPONDENTS
2016-17
2015-16 AVERAGE BONUS
(PROJECTED)
# OF RESPONDENTS
2015-16
Accounting $3,104 12 $2,929 7
Business $5,429 7 $3,100 5
Finance $3,643 7 Not reported --
Chemical Engineering $4,786 7 Not reported --
Electrical Engineering $4,250 6 Not reported --
Mechanical Engineering $3,938 8 Not reported --
Computer Science $9,654 13 $6,357 7
Engineering – not specified $5,188 8 $5,750 8
Logistics/Supply chain $3,750 6 Not reported --*Where 5 or more data points were provided.
ADDITIONAL INFORMATION FOR THE CLASS OF 2017
Data will be collected in February and March of 2017 to provide a final hiring update for the Class of 2017 in the Job Outlook 2017 Spring Update survey. Results will be available in April 2017.
The first look at salaries for the Class of 2017 will be published in January 2017 in the Winter 2017 Salary Survey. Data will be based upon salary projections provided by employers responding to this Job Outlook 2017 survey.

JOB OUTLOOK 2017 | 31
APPENDIX
FIGURE 53 RESPONDENTS BY INDUSTRY
INDUSTRY # OF RESPONDENTS
% OF RESPONDENTS
Oil & Gas Extraction 4 2.4%
Utilities 7 4.1%
Construction 9 5.3%
Food & Beverage Mfg. 8 4.7%
Chemical (Pharmaceutical) Mfg. 13 7.7%
Computer & Electronics Mfg. 11 6.5%
Motor Vehicle Mfg. 2 1.2%
Misc. Mfg. 20 11.8%
Wholesale Trade 7 4.1%
Retail Trade 11 6.5%
Transportation 5 3.0%
Information 6 3.6%
Finance, Insurance & Real Estate 30 17.8%
Accounting Services 5 3.0%
Engineering Services 5 3.0%
Management Consulting 4 2.4%
Misc. Prof. Services 12 7.1%
Social Services 3 1.8%
Misc. Support Services 1 0.6%
Government 6 3.6%
FIGURE 54 REGIONS, BY STATEREGION
NORTHEAST
Connecticut, Delaware, Maryland, Maine, Massachusetts,
New Hampshire, New Jersey, New York, Pennsylvania, Rhode Island, Vermont,
Washington, D.C.
SOUTHEAST
Alabama, Arkansas, Florida, Georgia, Kentucky, Louisiana, Mississippi, North Carolina,
South Carolina, Tennessee, Texas, Virginia, West Virginia
MIDWEST
Iowa, Illinois, Indiana, Kansas, Michigan, Minnesota, Missouri, North Dakota, Nebraska, Ohio,
Oklahoma, South Dakota, Wisconsin
WEST
Alaska, Arizona, California, Colorado, Hawaii, Idaho,
Montana, New Mexico, Nevada, Oregon, Utah, Washington,
Wyoming
30.4%
15.5%
10.7%
13.7%
14.9%
14.9%
LESS THAN 500
500-1,000
FIGURE 52 RESPONDENTS BY SIZE OF DEPARTMENT/BUSINESS UNIT
1,001-2,500
2,501-5,000
5,001-10,000
MORE THAN 10,000

32 | JOB OUTLOOK 2017
PARTICIPATING ORGANIZATIONS
Below is a list of the organizations that responded to the Job Outlook 2017 survey. (Please note: Although 169 organizations responded, the list below includes 129, as 40 organizations preferred not to be listed.)
Abbott Laboratories
Alcatel-Lucent
ALCOA Inc.
Anadarko Petroleum Corporation
Anheuser-Busch Companies, Inc.
ArcelorMittal USA
AREVA, Inc.
Arkema Inc.
Arthur J. Gallagher & Co.
Ascend Performance Materials
Automobile Club of Southern California
BASF Corporation
Baylor Scott & White Health
Bechtel Bettis, Inc.
Becton Dickinson & Company
Black Duck Software
Blount International, Inc.
BOK Financial Corporation
Brady Corp.
California State Auditor
Cambridge Associates LLC
Carbon Black
Carpenter Technology Corporation
Cerner Corporation
Charter Manufacturing Company, Inc.
CohnReznick
Con Edison
ConocoPhillips Company
COVERIS
CSM Bakery Solutions
DHL Supply Chain
Dick’s Sporting Goods
Duff & Phelps LLC
E. & J. Gallo Winery
Edward Jones
Emerson Climate Technologies
Epsilon
EY
FirstBank Holding Co.
FIS
General Electric Company
Georgia Tech Research Institute
Glazer’s Distributors
Great Lakes Dredge & Dock Company
Gulf Interstate Engineering
Hajoca Corporation
Hazen and Sawyer P.C.
Herbert, Rowland & Grubic, Inc.
Hormel Foods Corporation
Huhtamaki, Inc.
Huntington National Bank
INEOS
Infineum USA L.P.
Ingevity Corporation
Intuit Inc.
Irvine Company
Jet Propulsion Laboratory
Kellogg Company
KeyBank
KPMG LLP
L-3 Mission Integration
Lennox International Inc.
Liberty Mutual Insurance Company
Linde
Link-Belt Construction Equipment Co.
Macy’s, Inc.
Manhattan Associates, Inc.
Marathon Oil Corporation
Mars, Incorporated
MassMutual Financial Group
MAVERICK Technologies
Nestle USA
Old Republic International
Owens Corning
Pacific Gas and Electric Company
Parsons Corporation
Pfizer Inc.
Phillips-Medisize Corporation
Polaris Industries, Inc.
PPL Corporation
PriceKubecka, PLLC
PrimeSource Building Products, Inc.
Procter & Gamble Co.
Progressive Insurance
Protiviti Inc.
PVH
QVC Inc.
Raytheon Company
Regal Beloit Corp.
Robert W. Baird & Co. Inc.
Rolls-Royce North America Inc.
Ross Stores Inc.
SapientNitro
Save-A-Lot
Seagate Technology
Sears Holdings Corporation
Shaw Industries, Inc.
South Jersey Industries
Southern California Edison
Southwest Airlines Co.
Spectra Energy Corp.
Speedway LLC

JOB OUTLOOK 2017 | 33
Synchrony Financial
TE Connectivity
Teradata Corporation
Terracon
Texas Department of Transportation
Textron Inc.
The Babcock & Wilcox Company
The Estee Lauder Companies
The MITRE Corporation
The Nielsen Company
The Rehmann Group
The Timken Company
The Vanguard Group
The Walsh Group
TIAA
TimkenSteel Corporation
Towers Watson
Toys “R” Us, Inc.
Turner Construction Company
U.S. Comptroller of the Currency
Union Pacific Railroad Company
USS-POSCO Industries
VW Group of America
Walgreens
Whiting Petroleum Corporation
William Blair
Zynga, Inc.

62 HIGHLAND AVENUEBETHLEHEM, PA 18017-9085
610.868.1421 | www.naceweb.org