jlt re viewpoint - national association of insurance ... › sites › default › files ›...
TRANSCRIPT

www.jltre.com 1
JLT Re VIEWPOINT
Catastrophe models: In the eye of the storm

2 JLT RE VIEWPOINT | Catastrophe models: In the eye of the storm
TOGETHER, WE DELIVER RESULTS
JLT Re Viewpoint is JLT Re’s regular series of reports that comment on or give insight into key topics, occurrences or changes in the (re)insurance and broking marketplace.
At JLT Re, our trusted team combines market leading expertise and proprietary analytical tools with the freedom to challenge conventions. We create new insights and explore innovative capital solutions tailored to meet client needs.
SECTION 1:
NEW MODEL ARMY ............................ 4
SECTION 2:
THE LOSS
FORECASTING BUSINESS ...............8
SECTION 3:
IN THE EYE OF THE STORM .......... 16
CONTENTS

www.jltre.com 3
EXECUTIVE SUMMARY
Catastrophe models are once again firmly under the spotlight. Nearly a year on since hurricanes Harvey, Irma and Maria (HIM) devastated coastal regions of the United States and parts of the Caribbean, there is continued uncertainty about the magnitude of insured losses for all three events. How much HIM will ultimately cost the (re)insurance sector remains unclear, and divergent views amongst vendor catastrophe modelling firms are contributing to this uncertainty. As a result, modelled loss estimates are coming in for additional scrutiny, both at industry and individual company levels. The lack of consensus around modelled market losses potentially points to even greater levels of uncertainty for company-level loss estimates.
Scepticism of vendor models is not new. Model limitations exposed by events such as hurricanes Katrina and Ike and Superstorm Sandy have led to recalibrations to address issues such as coastal flooding, storm surge and inland damage. The events of 2017 were therefore an important test for the latest generation of commercial hurricane models. Given the unease expressed by many market participants over the wide-ranging modelled loss estimates that followed HIM, this JLT Re Viewpoint report examines how the vendor firms have performed in predicting industry-wide losses for North Atlantic hurricane events in previous large-loss years, and how the results in 2017 compared.
By analysing modelled estimates released by both AIR Worldwide (AIR) and Risk Management Solutions (RMS) for significant hurricanes since 2004, and comparing them to fully incurred losses for each respective event, this report provides a unique perspective in assessing the modelling companies’ real-time loss estimation process. One key takeaway to emerge from the study was that modelled loss accuracy for hurricanes suffers when events are both costly and complex (often due to an array of un-modelled loss components). Other conclusions were more illuminating. For example, strong model performance was observed when hurricane losses are both anticipated and contained. In addition, whilst the accuracy of the modelled losses released for HIM in 2017 was mixed, certain results taken in isolation revealed some encouraging signs given the levels of complexities involved. Important lessons learned during HIM, along with technological advancements, should allow for improved accuracy going forward as they are incorporated into future generations of hurricane models.
That said, due to multiple areas of uncertainty in predicting industry-wide losses, vendor firms are likely struggling to satisfy market expectations for real-time loss information. Catastrophe models, after all, were not designed to predict losses for individual events immediately. And it is important to recognise the wider role that catastrophe modelling companies play in the (re)insurance market. Carriers today have a better understanding of their catastrophe risk potential than ever before. Equally importantly, catastrophe models have been crucial in helping to attract a permanent allocation of third-party capital to the reinsurance market by increasing investor confidence in pricing catastrophe risk. As a result, buyers of reinsurance are today benefitting from competitively priced capacity, even after the most expensive catastrophe loss year on record.
This paper is a continuation of a series of JLT Re Viewpoint reports which endeavour to provide impactful analysis for the benefit of clients. With the peak months of this year’s hurricane season fast approaching, it is hoped that the study in this report will assist investors, catastrophe modellers and reinsurance buyers in assessing how any modelled industry losses released in the coming months are likely to perform by considering the levels of uncertainty associated with each estimate. Additionally, we hope it will encourage an open dialogue within the catastrophe modelling community that leads to greater levels of transparency and increased market confidence in the post-event loss estimation process.

SECTION 1: NEW MODEL ARMY Catastrophe modelling was a concept born in the late 1980s to assist insurers and reinsurers in analysing, pricing and underwriting natural catastrophe risk. Up to this point, risk carriers typically relied on actuarial models to help estimate losses, the focus of which was on hurricanes in the United States, given the loss potential from the peril. Whilst these statistical models enabled carriers to make loss projections based on historical event frequency and claims data, they did not consider changing demographics such as new building codes or shifting meteorological conditions.
Lulled into a false sense of security by relatively quiet hurricane activity in the United States during the two preceding decades (with the exception of Hugo), most (re)insurers were grossly underestimating the full loss potential of hurricane risk in the country.
A MODEL BREAKTHROUGHThis became painfully clear when Hurricane Andrew made landfall as a category 5 storm in southern Florida in August 1992. With sustained winds in excess of 150 miles per hour, more than 63,000 houses were destroyed and another 125,000 were damaged. Andrew’s intensity and landfall location meant that the magnitude of the loss was well beyond market expectations, exposing the limitations of using past experience alone as a basis for estimating future losses.
Aside from the devastating costs Andrew caused, the storm was also instrumental in bringing about a sea change to the (re)insurance market as the industry moved quickly to embrace scientifically-derived models. Prior to
1992, start-up modelling companies such as AIR and RMS had struggled to persuade sceptical (re)insurers of the value catastrophe models could bring in informing risk management decisions. Indeed, the sector responded with incredulity when AIR estimated shortly after Andrew’s landfall that total insured losses would reach approximately USD 13 billion.
Attitudes quickly changed, however, as claims mounted. Andrew ultimately cost the (re)insurance market USD 17 billion (at original values), discrediting figures projected by actuarial models at the time, which typically pointed to a mid-single digit loss. Given this vast disparity, a number of carriers were unable to pay claims, leading to several bankruptcies and a Florida property market in dire need of reconstruction. It also brought about a widespread recognition in the post-Andrew world that a more scientific approach was needed for natural catastrophe risk, particularly low frequency, high-severity hurricane events. As a result, catastrophe models soon became fundamental to carriers’ underwriting and capital
4

www.jltre.com 5
management processes. Both AIR and RMS benefitted as they quickly established themselves as major players in the catastrophe market.
MODEL DEVELOPMENTIn the 25 years since Andrew came ashore, catastrophe models’ theoretical framework has remained essentially the same. Models still consist of three basic components: hazard, vulnerability and loss. They also still simulate the impacts hazards have on built environments in order to estimate costs to insurable assets.
The sophistication and range of modelling products have nevertheless changed during this time, due in large part to increasing computer processing power and the growing availability of high-resolution hazard data. And new generations of models
have been created on the back of lessons learned from recent events. The wealth of claims data post-event has enabled modelling companies to significantly refine the damageability curves for specific aspects of exposure such as occupancy, construction, year of construction, number of storeys, as well as a host of secondary characteristics. This is especially true for North Atlantic hurricane models after successive storms have caused significant insured losses this century (see Figure 1 for the top 10 most costly hurricanes on record).
Katrina, Ike and Sandy in particular brought about significant revisions to hurricane models as each storm’s distinct characteristics exposed their limitations and weaknesses. The unexpected levee failure in New Orleans after Katrina made landfall,
for example, showed that the models did not capture adequately the impacts from flooding and storm surge. And the costs associated with loss amplification, event clustering (after Rita and Wilma quickly followed) and other ‘super-cat’ characteristics (such as civil unrest, evacuations and National Guard deployment) were likewise not anticipated. Both AIR and RMS responded to these developments by recalibrating their models. Similar updates followed Ike and Sandy as new lessons were learned about inland damage and building code adherence (Ike), as well as storm surge along the US Northeast coast (Sandy).
After experiencing disruption from some of these revisions, the industry will be closely monitoring how the modelling companies respond to last year’s successive landfalls of HIM,
Figure 1: Top 10 Most Costly North Atlantic Topical Cyclones (USD million) (Source: JLT Re, Munich Re)
Oct 2012Superstorm Sandy• 29,500• 31,500
Aug1992Hurricane Andrew• 17,000• 29,700
Sep 2017Hurricane Irma• 30,000• 30,000
Sep 2017Hurricane Maria• 32,000• 32,000
Sep 2005Hurricane Rita• 12,100• 15,200
Sep 2008Hurricane Ike• 18,500• 21,000
Oct 2005Hurricane Wilma• 12,500• 15,700
Sep 2004Hurricane Ivan• 13,800• 17,900
Aug 2005Hurricane Katrina• 60,500• 76,000
Aug 2017Hurricane Harvey• 30,000• 30,000
• Insured loss (original values)
• Inflation-adjusted insured loss (2017 prices)

all three of which rank in the top five most expensive hurricanes on record (in terms of inflation-adjusted insured losses). Both AIR and RMS have already indicated that insights obtained from HIM will be important factors in future hurricane model releases.
MARKET IMPACTUsing history as a guide, these recalibrations could have an important bearing on the property-catastrophe market. Figure 2 illustrates how the evolution of catastrophe modelling has been crucial to the development of the property market over the last 25 years. During this time, catastrophe models have become integral to the property underwriting process by assisting decision-making on exposure management, risk aggregation, pricing and reinsurance buying.
Hurricane Katrina was a watershed moment for the market for two key reasons.
First, catastrophe modelling became embedded into carriers’ risk management strategies as metrics made readily available by the probabilistic vendor models were used to satisfy new rating agency requirements around capital allocation for catastrophe risks. Second, catastrophe models facilitated the rapid expansion of the insurance-linked securities (ILS) market as institutional investors utilised recalibrated models (post-Katrina and Ike) to price catastrophe risks. It is no exaggeration to say that the ILS market in its current form would not exist today without catastrophe modelling.
The impact alternative capital has had on the reinsurance sector is difficult to overstate. It has brought about a structural change in how capital is provided to the market and in how much capital can enter (and exit) the sector.
Early use ofcat models
Birth and nascent growth of ILS market
General acceptance of vendor models increase investor confidence in pricing cat risk
Huge influx of alterative capital
Andrew(numerous carrier insolvencies)
CharleyFrancesIvanJeanne
KatrinaRitaWilma Gustav
Ike IreneSandy
HarveyIrmaMaria
20181992
JLT Re Global Property-Catastrophe ROL Index at 1.1Significant hurricane eventsTraditional reinsurance capital at previous year-endAlternative reinsurance capital at previous year-end
Figure 2: Key Developments in the Property-Catastrophe Market (Source: JLT Re)
6

www.jltre.com 7
And, as JLT Re’s Risk-Adjusted Global Property-Catastrophe Reinsurance Rate-on-Line (ROL) Index in Figure 2 shows, it has played a leading role in driving pricing down to levels last seen in the early 2000s. Whilst traditional capital levels have essentially remained flat since 2012, alternative capital (which is overwhelmingly focused on US wind risks) has doubled. Investor confidence in the current suite of catastrophe modelling applications has underpinned this growth.
Of course, these new capital inflows coincided with an unusual lull in hurricane activity, meaning recent model recalibrations had gone largely untested. Indeed, the period of no major US hurricane landfalls in the decade between 2005 (Wilma) and 2016 was historically unprecedented. But then the 2017 hurricane season happened, bringing three massive hurricane strikes to US territories and causing widespread devastation across the Caribbean as hurricanes Harvey, Irma and Maria formed in quick succession.
UNDER THE SPOTLIGHTAfter every large-loss year, it seems questions are asked about the accuracy of vendor market loss estimates, and the value they bring. This was the case in 2005, 2008, 2011 and 2012. And 2017 was no different. Figure 3 shows the high and low post-landfall estimates provided by different modelling firms for HIM. Subsequent (and significant) revisions made to estimates are also captured in the chart, with the patterned and filled (combined) entries of the same colour representing initial estimates
and the filled entries showing most recent updates. The fact that such significant ranges were generated for HIM has raised questions over whether modelling tools can be relied upon to produce credible information for catastrophes in real time.
But are these charges fair? After all, catastrophe models are built to provide probabilistic outcomes for a wide range of scenarios rather than predict the monetary cost of any single event in real time. And, in doing the latter, catastrophe modelling firms are responding to intense pressure from various market participants, including carriers, brokers, investors and the media, to release market loss estimates as quickly as possible. In fact, HIM reinforced the need for real-time loss information as modelled estimates were used to inform traditional carriers’ loss guidance and post-event capital deployment strategies. Additionally, pressing
reporting requirements saw many ILS funds rely on modelled loss estimates to provide initial loss evaluations to investors.
But with greater reliance comes greater scrutiny. Given the large divergences of loss estimates for HIM, catastrophe models are once again under the spotlight. And as the peak months of this year’s hurricane season approach, several questions remain unanswered. Are unfavourable perceptions with regard to historical modelled loss estimates justified? Did 2017 mark a deterioration in accuracy compared to previous large-loss years? How did the modelling companies perform last year when compared to other significant hurricane events? And can the market expect modelled loss estimates to become more accurate and narrow as techniques and technologies mature? All these points will be explored in the following pages.
RMS low
RMS high
Karen Clark & Co
Corelogic low
CoreLogic high
AIR low
AIR high
0
Harvey
20 40 60 80 100 120 140 160
Irma MariaInsured loss estimates (USD billion)
Figure 3: Loss Estimates for HIM by Catastrophe Modelling Company (Source: JLT Re, AIR, CoreLogic, KCC, RMS)

8 JLT RE VIEWPOINT | Catastrophe models: In the eye of the storm
SECTION 2: THE LOSS FORECASTING BUSINESS
For major events, loss estimates are further refined once post-landfall hazard data are made available from the National Hurricane Center (NHC) and incorporated into the models to create bespoke wind and storm surge footprints. During this entire process, crucial judgements are made by catastrophe modelling experts when examining the models’ statistical outcomes and determining where in the distribution losses are likely to occur.
To help inform the debate, JLT Re has undertaken an exercise to explore the precision of modelled market loss estimates for significant hurricanes since 2004 by comparing them to fully incurred losses for each respective event1. The purpose of this study is to gauge the performance of loss estimates during the lifespan of hurricane events and assess whether any trends or lessons can be gleaned for future reference.
The parameters of the analysis have been restricted to North Atlantic hurricanes, given they are the world’s most comprehensively analysed region and peril. Ultimately, if US hurricane estimates do not stand up to scrutiny, they will not do so anywhere else. Loss estimates provided by AIR and RMS have been used in the exercise2.
METHODS AND TIMELINESFigure 4 shows the timeline that catastrophe modelling firms typically work towards when releasing market loss estimates for significant hurricane events. Whilst this, of course, only applies to storms that develop out at sea with sufficient lead time before US landfall (i.e. three to four days), it illustrates the rigorous steps these companies undertake when compiling market loss estimates.
In the lead up to, and immediately after, landfall, meticulous work goes into modelling unique scenarios for each event by selecting tracks from hundreds of thousands of stochastic events that closely resemble forecasted path and intensity. The number of tracks dwindles quickly as landfall nears as factors such as location, forward speed and windfield size are almost impossible to replicate in combination. After all, every storm is unique and whilst the imminent release of high-definition models will help provide more clarity going forward, this will continue to be a major source of uncertainty.
Once a range of simulated events has been selected, they are then applied to industry exposure databases (IEDs) to calculate market loss estimates. This is a crucial step in the process as recent events have highlighted how differing exposure assumptions can lead to hugely divergent views.
1 The sample of hurricanes used in the study included: Charley, Frances, Ivan, Jeanne, Katrina, Rita, Wilma, Gustav, Ike, Irene, Sandy, Harvey, Irma and Maria.2 Catastrophe modelling firms’ loss data points have been compiled from a variety of sources, including firms’ websites, press releases and media reports.
During the entire loss estimation process, crucial judgements are made by the vendors when examining the models’ statistical outcomes and determining where in the distribution losses are likely to occur.

www.jltre.com 9
3-4 daysbefore landfall
1–2 daysbefore landfall
Within ~7 daysof landfall
2-3 weekspost-event
Every 60days
Day of landfall
Historical analogues
Simulations of NHC forecast
Cat model estimates from stochastic tracks
Simulations of NHC forecast
Vendors issue:
Windfield and surge footprintsbased on actual parameters
Market loss ranges
PCS first estimate PCS revisions as neededFirst release of externalindustry loss ranges
• Cat model experts to examine statistical outcomes of models to determine where in distribution losses are likely to occur
• Precompiled results from hurricane models by each stochastic event
• NHC forecast
• Knowledge of weather models and recent/ historical biases
• Industry exposure database
TOOLS LEVERAGED FOR LOSS ESTIMATION TIMELINE
Figure 4: Timelines for US Hurricane Loss Estimation (Source: JLT Re)

10 JLT RE VIEWPOINT | Catastrophe models: In the eye of the storm
MODELLED LOSS (IN)ACCURACYThe culmination of these efforts is shown in Figure 5, which provides a helicopter view of how the modelled industry loss estimates collected in our study evolved during the loss estimation period. The line in the middle of both graphics represents the final, total insured loss for each respective hurricane as per Munich Re (including flood losses) and the bars show how AIR’s (dark blue) and RMS’s (light blue) estimates compared as a percentage of this total.
Pre-landfall industry loss estimates, which AIR provides to its clients up to 48 hours or 24 hours before US mainland landfall, and which will be shown in the individual case studies that follow, have not been included in Figure 5 as the huge permutations around track trajectories and storm parameters at landfall typically result in ranges that deviate massively from the actual insured loss. RMS, meanwhile, does not provide any predictions before or immediately after landfall, focusing instead on post-landfall industry loss estimates.
Whilst the uncertainty in vendor-modelled loss estimates decreases significantly after landfall, this has not always translated into increased accuracy relative to the ultimate loss. It is important to note here that the ultimate loss data used in our study will occasionally include loss components – such as flood, loss adjustment expenses (LAE) and contingent business interruption (CBI) – that are un-modelled by AIR and RMS and are therefore not included in their loss estimates.
3 Please note that for Harvey, AIR’s estimates (both ‘first post-landfall’ and ‘final’) do not include National Flood Insurance Program (NFIP) losses whilst RMS’s and Munich Re’s figures do.
Figure 5: Evolution of Modelled Loss Estimates for Select US Hurricanes – 2004 to 20173 (Source: JLT Re, AIR, RMS, Munich Re)
FIRST POST-LANDFALL ESTIMATE
Underestimation(% of ultimate loss)
Overestimation (% of ultimate loss)
Underestimation(% of ultimate loss)
Overestimation (% of ultimate loss)
FINAL ESTIMATE
0% 0%
Charley
Frances
Ivan
Jeanne
Katrina
Rita
Wilma
Gustav
Ike
Irene
Sandy
Harvey
Irma
Maria
Charley
Frances
Ivan
Jeanne
Katrina
Rita
Wilma
Gustav
Ike
Irene
Sandy
Harvey
Irma
MariaAIR
RMS
Ultimate loss(Munich Re)
www.jltre.com 11
There is an overriding trend towards significant loss underestimation, and it is not even immediately apparent that the range of loss estimates narrows during the lifespan of storms, or that they always become more accurate.
As alluded to earlier, this has important consequences in today’s data-hungry world. With real-time loss information playing an increasingly crucial role in setting initial loss guidance, several carriers have been forced to make significant revisions to their own loss estimates as claims develop unexpectedly. Investor confidence and carriers’ share prices can suffer in instances where expected losses develop adversely (as they did for most of the devastating storms in the recent past), fuelling unfavourable perceptions of modelling companies and other loss forecasters within the market. This, over time, has encouraged a general predisposition within the market to discount the bottom-end of ranges and expect losses to settle at, or above, the top.
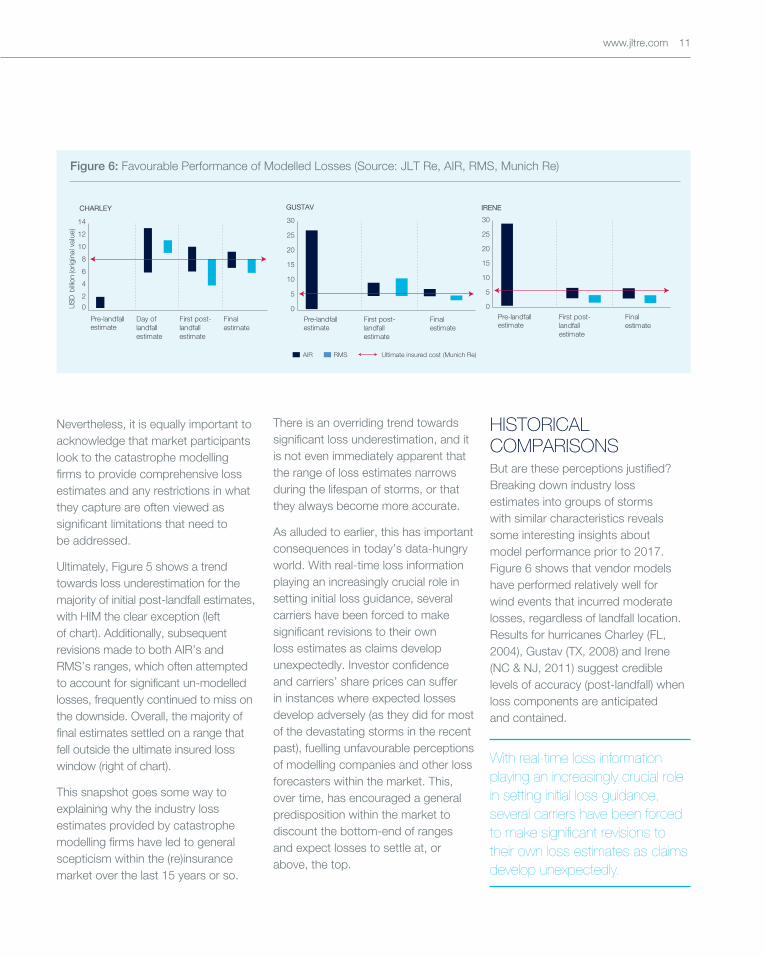
HISTORICAL COMPARISONSBut are these perceptions justified? Breaking down industry loss estimates into groups of storms with similar characteristics reveals some interesting insights about model performance prior to 2017. Figure 6 shows that vendor models have performed relatively well for wind events that incurred moderate losses, regardless of landfall location. Results for hurricanes Charley (FL, 2004), Gustav (TX, 2008) and Irene (NC & NJ, 2011) suggest credible levels of accuracy (post-landfall) when loss components are anticipated and contained.
Figure 6: Favourable Performance of Modelled Losses (Source: JLT Re, AIR, RMS, Munich Re)
20
4
6
8
10
12
14
Pre-landfall
CHARLEY
estimateDay of landfall estimate
First post-landfall estimate
Final estimate
USD
billi
on (o
rigin
al v
alue
)
Pre-landfall estimate
First post-landfall estimate
Final estimate
0
5
10
15
20
25
30
GUSTAV
Pre-landfall estimate
First post-landfall estimate
Final estimate
0
5
10
15
20
25
30
IRENE
Nevertheless, it is equally important to acknowledge that market participants look to the catastrophe modelling firms to provide comprehensive loss estimates and any restrictions in what they capture are often viewed as significant limitations that need to be addressed.
Ultimately, Figure 5 shows a trend towards loss underestimation for the majority of initial post-landfall estimates, with HIM the clear exception (left of chart). Additionally, subsequent revisions made to both AIR’s and RMS’s ranges, which often attempted to account for significant un-modelled losses, frequently continued to miss on the downside. Overall, the majority of final estimates settled on a range that fell outside the ultimate insured loss window (right of chart).
This snapshot goes some way to explaining why the industry loss estimates provided by catastrophe modelling firms have led to general scepticism within the (re)insurance market over the last 15 years or so.
With real-time loss information playing an increasingly crucial role in setting initial loss guidance, several carriers have been forced to make significant revisions to their own loss estimates as claims develop unexpectedly.
(Munich Re)Ultimate insured costRMSAIR

12 JLT RE VIEWPOINT | Catastrophe models: In the eye of the storm
Or, in other words, conventional hurricane events that do not assume super-cat characteristics are captured adequately by vendor catastrophe models, and this is reflected in the loss estimates provided for such events.
All three hurricanes had different intensities and landfall regions. Whilst Charley was a major hurricane when it came ashore along Florida’s western coastline, Gustav was a category 2 storm when it made landfall in Texas (having moved through the Gulf of Mexico and caused damage to offshore oil assets) and Irene was a category 1 hurricane when it hit North Carolina. Each of these events generated insured losses of less than USD 10 billion, demonstrating that the market can expect modelled post-landfall estimates to be within a reasonable range of the fully developed figure for losses that are both wind driven and moderate in magnitude.
The models, however, have not performed as well for hurricane events where losses extend beyond wind into areas that are not modelled or well understood. Katrina, Ike and Sandy are three examples of such storms, and the evolutions of AIR’s and RMS’s modelled loss estimates for each are shown in Figure 7.
Despite a number of revisions being made in the days and weeks after Katrina’s landfall, both AIR and RMS consistently underestimated the magnitude of the ultimate insured loss. This can mostly be explained by the flooding of New Orleans, a secondary consequence that virtually eclipsed the original catastrophe. Indeed, the models’ limitations were laid bare by
the extent of the flood damage, as well as other non-modelled factors such as loss amplification (which includes demand surge and claims inflation) and wind versus flood disputes.
Such unique super-cat effects are extremely challenging to model and go a long way to explaining the huge divergence between AIR’s and RMS’s final Katrina estimates (which, unsurprisingly, is the largest of the entire sample in our study). AIR’s much narrower range was in line with previous estimates but ultimately proved to be less than half of the ultimate insured loss. RMS, meanwhile, significantly increased its final projection, albeit with a wide margin for error (i.e. a USD 20 billion difference between the high and low end), and even this proved insufficient.
Ike and Sandy provide other, albeit less exaggerated, examples of loss underestimation around the time of landfall. Both storms had unforeseen attributes, which again helps to
Breaking down industry loss estimates into groups of storms with similar characteristics reveals some interesting insights about model performance.
Figure 7: Substandard Performance of Modelled Losses (Source: JLT Re, AIR, RMS, Munich Re)
(Munich Re)Ultimate insured costRMSAIR
0
10
20
30
40
50
60
70
Pre-Louisiana landfall estimate
Day of LA landfall estimate
First post-LA landfall estimate
Second post-LAlandfall estimate
Final estimate
KATRINA
USD
billi
on (o
rigin
al v
alue
)
5
0
10
15
20
25
Pre-landfall estimate
First post-landfall estimate
Final estimate
IKE
Pre-landfall estimate
Day of landfall estimate
First post-landfall estimate
Final estimate
5
0
10
15
20
25
30
SANDY

account for the sub-par accuracy of the modelled loss estimates. Although neither event was classified as a major hurricane, they still packed a punch as Ike caused more damage inland than modellers expected and Sandy was largely a surge and flood event after it made landfall in New Jersey on an unusual trajectory.
All this highlights the inherent difficulties modelling companies face in predicting losses when tropical cyclones strike highly populated urban areas. These types of events often bring unforeseen (and often un-modelled) consequences that cause losses to spiral. The results for Katrina, Ike and Sandy show that catastrophe models have struggled to generate accurate loss ranges in such circumstances. Beyond these three storms, there have been other significant hurricanes, including Ivan and Wilma, where both AIR and RMS significantly underestimated the cost to the sector.
HIM: A NEW BENCHMARK?On the face of it, the estimates released by the modelling companies in the days and weeks after HIM made landfall in 2017 seemed to reinforce market perceptions that catastrophe models cannot be relied on to predict accurately industry loss estimates. After all, the loss ranges were both vast and diverse. But whilst there is no denying that the accuracy of the modelled losses released in 2017 was mixed, closer analysis reveals that important differences emerged last year.
Figure 8 on page 14 shows the ranges released by AIR and RMS for Hurricane Irma. Despite the magnitude of the catastrophe (insured losses are currently expected to exceed USD 30 billion), neither AIR nor RMS underestimated the total and their post-landfall estimates remained largely consistent. In addition, whilst the loss estimates released by both modelling companies were initially deemed high, there is still significant uncertainty associated with Irma’s loss and there is some evidence that claims development in the US may yet move Irma’s ultimate insured cost into the lower end of AIR’s and RMS’s final estimates. Notwithstanding criticisms over the range of the estimates, this is a reasonable performance given the complexities associated with the event.
This initial consensus was short-lived, however, as Maria split opinion as never before (see Figure 9 on page 14). AIR’s original top-end Maria estimate was nearly three times that of RMS and there was no overlap between its lower-end and RMS’s top. The gulf stemmed in large part from differing judgements made over Maria’s windfield size at landfall, ground-up exposures, repair costs and insurance coverages and terms (for business interruption especially) in Puerto Rico. Whilst RMS maintained its view, AIR substantially revised its estimate downwards as it altered assumptions around modelled wind speeds, insurance take-up rates in Puerto Rico and loss distributions across each line of business (industrial lines in particular).
www.jltre.com 13

14 JLT RE VIEWPOINT | Catastrophe models: In the eye of the storm
Post-Maria, it is evident that the increasing sophistication of windfield generation during and after the event, along with timely event reconnaissance trips to the most heavily impacted areas, influenced both the evolution of loss estimates and the range of uncertainty. Although the range of AIR’s final estimate was subsequently narrowed to USD 21 billion (from USD 45 billion originally), it remains the largest in the entirety of this
study and raises questions about how large modelled market estimates can be, given a mid-point range of expectations, before they lose utility and credibility.
Two important points should not be lost in all of this, however. The first is that RMS deserves credit for the precision of its one and only loss estimate, especially given the high amount of uncertainty that was associated with Maria (see Figure 10).
The second, frequently overlooked by industry participants, including the media in particular, is the need for catastrophe modelling firms to balance any incentive of being first to market with accuracy. The requirements and expectations of real-time information will only increase and it is important that catastrophe modelling companies strengthen their authority in this area: accuracy needs to be the focus so that decision-makers can be confident in the numbers. Reducing core components of uncertainty in the real-time loss estimation process, particularly for hazard and exposure assessments, will augment accuracy and reduce the need for large ranges.
Unfortunately for catastrophe modelling firms, failures endure far longer in the memory than successes and a significant credibility gap remains, justified or not. Progress is being made (as supported by the results of our study) but perhaps the market can further assist the catastrophe modelling firms by refraining from the call for immediate estimates and waiting for a more considered view.
Figure 10: Complex Loss Profile of Hurricane Maria (Source: JLT Re, RMS)
Wind-only loss
10bn
20bn
30bn
15bn
30bn+20%
+10%
+20%
+15%
+25%
+15%
USD
Super-cat effects
Extended BI Rain-driven floodingtransportation
Few historical data points to quantify: every event has a unique set of circumstances that are difficult to model
LAE
CBI
Aggressive legal environment
Unmodelledpotential losses
Figure 8: Evolution of Modelling Companies' Market Loss Estimates for Hurricane Irma (Source: JLT Re, AIR, RMS, Munich Re)
Figure 9: Evolution of Modelling Companies' Market Loss Estimates for Hurricane Maria (Source: JLT Re, AIR, RMS, Munich Re)
Pre-FLlandfall estimate
First post-FLlandfall estimate
Final estimate
20
10
0
30
40
50
60
70
USD
billi
on (o
rigin
al v
alue
)
First post-landfall estimate Final estimate
20100
30405060708090
(Munich Re)Ultimate insured costRMSAIR

The requirements and expectations of real-time information
will only increase and it is important that catastrophe
modelling companies strengthen their authority in this area:
accuracy needs to be the focus so that decision-makers
can be confident in the numbers.
www.jltre.com 15

SECTION 3: IN THE EYE OF THE STORM
Having assessed vendor market loss estimates for recent US hurricanes, it is clear that no catastrophe model is perfect. Given the multiple areas of uncertainty in determining the hazards, exposures and vulnerabilities during major events, vendor loss estimates are always likely to fall short of the precision levels desired by the market. With this being the case for hurricane risks, even greater variability can be expected for other natural hazards such as earthquakes, floods and convective storm outbreaks, as they are comparatively underdeveloped as modelled perils.
Challenged modelled loss accuracy for hurricane events is not an unexpected conclusion to emerge from the study and should not be interpreted as degrading the value of vendor modelling tools. After all, catastrophe models were not designed to predict the costs of individual events in real time and their primary purpose of assisting carriers in understanding and quantifying their risks is undisputed. The results are clear: whilst several carrier insolvencies followed Andrew (and Katrina to a lesser degree), billions of dollars in claims have been paid out post-HIM with no significant capital impairments.
A number of key conclusions emerge from this study, some, such as the importance of understanding differences between estimates, are more clear-cut than others. Having a range of views post-event can actually benefit carriers, brokers and investors as long as the important drivers are clearly communicated, particularly in situations where significant divergences occur.
Catastrophe modelling firms can assist the market further here by better communicating the levels of uncertainty contained within each estimate and providing more transparency around the various assumptions that are driving loss estimates. It is likewise incumbent on market participants to review rigorously, or even challenge, some of the more extreme loss estimates released by modelling firms. Scrutinising assumptions that can drive vastly different views of events (such as the physical parameters of the hazard or insurance take-up rates) is recommended best practice in establishing whether loss estimates pass initial tests of credibility.
Challenged modelled loss accuracy for hurricane events is not an unexpected conclusion to emerge from the study and should not be interpreted as degrading the value of vendor modelling tools.
16
www.jltre.com 17
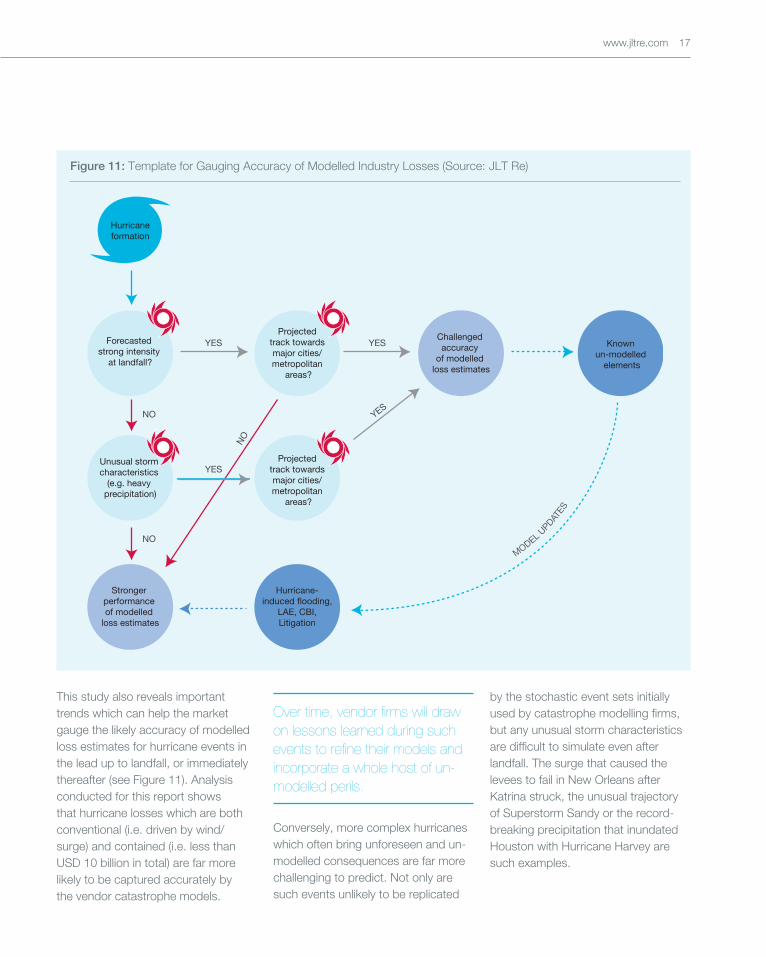
This study also reveals important trends which can help the market gauge the likely accuracy of modelled loss estimates for hurricane events in the lead up to landfall, or immediately thereafter (see Figure 11). Analysis conducted for this report shows that hurricane losses which are both conventional (i.e. driven by wind/surge) and contained (i.e. less than USD 10 billion in total) are far more likely to be captured accurately by the vendor catastrophe models.
Conversely, more complex hurricanes which often bring unforeseen and un-modelled consequences are far more challenging to predict. Not only are such events unlikely to be replicated
by the stochastic event sets initially used by catastrophe modelling firms, but any unusual storm characteristics are difficult to simulate even after landfall. The surge that caused the levees to fail in New Orleans after Katrina struck, the unusual trajectory of Superstorm Sandy or the record-breaking precipitation that inundated Houston with Hurricane Harvey are such examples.
Over time, vendor firms will draw on lessons learned during such events to refine their models and incorporate a whole host of un-modelled perils.
Figure 11: Template for Gauging Accuracy of Modelled Industry Losses (Source: JLT Re)
Forecasted strong intensity
at landfall?
Hurricaneformation
YES
YES
NO
NO
YES
NO
YES
Unusual storm characteristics
(e.g. heavy precipitation)
Stronger performance of modelled
loss estimates
Projected track towards major cities/ metropolitan
areas?
Projected track towards major cities/ metropolitan
areas?
Challenged accuracy
of modelled loss estimates
Known un-modelled
elements
Hurricane-induced flooding,
LAE, CBI,Litigation
MODEL UPDAT
ES

18 JLT RE VIEWPOINT | Catastrophe models: In the eye of the storm
All three of these storms saw vast differences in estimates between AIR and RMS due to un-modelled elements. In each case, un-modelled loss components accounted for a significant proportion (if not the majority) of the total cost. Ultimately, making real-time loss predictions for events that bring new loss phenomena is more art than science. This is reflected by the highly divergent views between the modelling companies.
Over time, however, vendor firms will draw on lessons learned during such events to refine their models and incorporate a whole host of un-modelled perils. Contributions from the academic and engineering communities will also continue to assist them in this area. Hurricane-induced flood and LAE are likely to be key areas of focus in the near term following HIM. Another theme that is starting to emerge from 2017 claims data, particularly for Irma, is the strong performance of newer construction and roofs in the highest wind zones. One possible implication for future model updates is that the building codes implemented and enforced, post the 2008 financial crisis, have performed even better than current modelling assessments. This may go some way to explaining why AIR’s and RMS’s estimates in 2017 broke the overriding trend of underestimating major losses and raises questions over whether recent model revisions (which were only first tested during HIM) may have overcorrected previous shortcomings.
Technological advancements will also drive future improvements to catastrophe models. Remote sensing on next generation satellites, as well as drone data, are already having an impact by facilitating the capture of more accurate satellite-derived wind speeds, improving post-event damage assessments (augmented by artificial intelligence detection methods) and enhancing the exposure calibration processes for higher resolution IEDs. Hurricane Maria was a stark example of how differing views on industry exposure can lead to disproportionate levels of variance between modelled estimates.
By leveraging increased skill in weather prediction, catastrophe modelling firms will soon be able to move away from pure stochastic track-driven estimates pre- (and immediately following) landfall and utilise real-time clustering methods to generate probabilistic scenarios. This will greatly enhance the windfield generation process and lead to a more robust statistical assessment of outcomes. Improved weather forecasting will also bring more tangible impacts by enabling further hurricane preparation and loss mitigation measures ahead of landfall.
Catastrophe modelling firms can assist the market by better communicating the levels of uncertainty contained within each estimate and providing more transparency around various assumptions.
Even with these advances, modelled loss estimates will no doubt continue to be the subject of scrutiny and scepticism in future years. And yet, their utility looks set to only grow as demand from carriers, brokers and investors for real-time loss information will only increase in today’s data-hungry world. With peak hurricane season upon us, JLT Re’s Analytics team is committed to providing differentiated real-time catastrophe reporting through its CATz blog to help clients understand and quantify the uncertainties associated with each event and any published modelled loss estimate. JLT Re’s Cat Model Insight (CMI) function has also been created to assist clients with the model validation process by assessing various model components and identifying potential un-modelled elements of loss.

www.jltre.com 19

20 JLT RE VIEWPOINT | Catastrophe models: In the eye of the storm
UK & Europe • North America • Asia Pacific • Middle East • Africa www.jltre.com
David Flandro Global Head of Analytics London +44 (0)20 7466 1311 [email protected]
Julian Alovisi Head of Research and Publications London +44 (0)20 7558 3376 [email protected]
Isabella Gaster Head of Communications and Marketing, London +44 (0)20 7558 3387 [email protected]
Keith Leung Head of Catastrophe Modelling – International, London +44 (0)20 7466 1389 [email protected]
Josh Darr Lead Meteorologist Chicago +1 312 637 6108 [email protected]
Chris Zumbrum Catastrophe Risk Management Services Officer, Philadelphia +1 215 309 4581 [email protected]
Ming Li Global Head of Catastrophe Modelling Philadelphia +1 215 309 4560 [email protected]
Joseph Qiu Head of Catastrophe Modelling – Americas, Philadelphia +1 215 309 4588 [email protected]
Apoorv Dabrai Head of Catastrophe Modelling – APAC Singapore+65 6411 9916 [email protected]
CONTACTS
This publication is for the benefit of clients and prospective clients of JLT Re. It is intended only to highlight general issues that may be of interest in relation to the subject matter and does not necessarily deal with every important topic nor cover every aspect of the topics with which it deals. The information and opinions contained in this publication may change without notice at any time. If you intend to take any action or make any decision on the basis of the content of this publication, you should first seek specific professional advice and verify its content.
JLT Re specifically disclaims any express or implied warranty, including but not limited to implied warranties of satisfactory quality or fitness for a particular purpose, with regard to the content of this publication. JLT Re shall not be liable for any loss or damage (whether direct, indirect, special, incidental, consequential or otherwise) arising from or related to any use of the contents of this publication.
JLT Re is a trading name and logo of various JLT reinsurance broking entities and divisions globally and any services provided to clients by JLT Re may be through one or more of JLT’s regulated businesses.
© 277451 July 2018