jinhui shipping
TRANSCRIPT

Third Quarter and
Nine Months Report
2015
JINHUI SHIPPING
AND TRANSPORTATION LIMITED

Third Quarter and Nine Months Report 2015 1
HIGHLIGHTS
For the Nine Months Ended 30 September 2015
For the Third Quarter of 2015
Revenue for the period dropped 35% to US$67 million
Net loss for the period: US$40 million
Gearing ratio as at 30 September 2015: 27%
Basic loss per share: US$0.480
EBITDA : US$4 million
Revenue for the quarter declined 11% to US$24 million
Net loss for the quarter: US$32 million
Basic loss per share: US$0.385

Third Quarter and Nine Months Report 2015 2
The Board of Jinhui Shipping and Transportation Limited (the “Company”) is pleased to announce the
unaudited condensed consolidated results of the Company and its subsidiaries (the “Group”) for the quarter
and nine months ended 30 September 2015.
THIRD QUARTER AND NINE-MONTH RESULTS
The Group’s revenue amounted to US$24,171,000 for the third quarter of 2015, representing a decrease of
11% as compared to US$27,036,000 in the same quarter of 2014. The Company reported a consolidated net
loss for the current quarter was US$32,389,000, as compared to a consolidated net loss of US$15,734,000
for the corresponding quarter in 2014. Basic loss per share was US$0.385 for the third quarter of 2015 while
basic loss per share was US$0.187 for the corresponding quarter in 2014.
Revenue for the first nine months of 2015 declined 35% to US$66,580,000, comparing to US$102,095,000 for
the same period in 2014. The Company recorded a consolidated net loss for the first nine months of 2015 was
US$40,314,000, as compared to a consolidated net loss of US$18,321,000 in the same period of 2014. Basic
loss per share was US$0.480 for the current period as compared to US$0.218 for the corresponding period in
2014.
The considerable consolidated net loss for the third quarter and nine months ended 30 September 2015 was
largely driven by the weak dry bulk shipping market which continued to dent the Group’s hire and freight
revenue and substantial realized and unrealized loss recognized on financial assets through profit or loss
from the abrupt correction of global stock markets. The Group recorded net loss of US$21,917,000 on
investment portfolio during the third quarter of 2015 as compared to US$3,789,000 for the corresponding
quarter of 2014. For the first nine months of 2015, the net loss on investment portfolio was US$20,980,000 as
compared to US$3,629,000 for the corresponding period in 2014.
INTERIM DIVIDEND
The Board has resolved not to recommend the payment of any interim dividend for the quarter ended
30 September 2015.
REVIEW OF OPERATIONS
Third Quarter of 2015. Dry bulk shipping market remained under pressure by the depressed market charter
rates as the global economic recovery remained slow during the first nine months of 2015. China is still facing
a slowdown in economic growth; economic structure has undergone significant changes during transition from
medium to long term. The languid dry bulk shipping market continued to be affected by the weak demand
growth due to the slowdown of Chinese coal and iron ore imports and continued supply of new bulk carriers in
the market.

Third Quarter and Nine Months Report 2015 3
During the third quarter, the dry bulk shipping market had shown a slight improvement as the market rates had
grown marginally. Baltic Dry Index opened at 800 points at the beginning of July and continued to climb to its
peak at 1,222 points in early August and closed at 900 points by the end of September. The average daily
time charter equivalent rates ("TCE") earned by the Group’s fleet of Post-Panamax / Panamax fleet and
Supramax / Handymax / Handysize fleet in the third quarter of 2015 was US$7,228 and US$7,006
respectively, compared with US$5,153 and US$6,352 in the second quarter of 2015, which had shown an
improvement of 40% and 10% respectively.
Revenue for the third quarter of 2015 declined 11% to US$24,171,000, comparing to US$27,036,000 for the
corresponding quarter in 2014. The decrease in revenue was mainly due to the falling market freight rates.
The average daily TCE of the Group’s fleet were as follows:
2015
Q3
2014
Q3
2015
1st nine
months
2014
1st nine
months
2014
Average daily TCE US$ US$ US$ US$ US$
Capesize fleet - - - 13,477 13,477
Post-Panamax / Panamax fleet 7,228 7,320 5,457 9,442 9,139
Supramax / Handymax / Handysize fleet 7,006 7,750 6,797 9,540 9,235
In average 7,027 7,706 6,667 9,541 9,234
Other operating income increased from US$2,498,000 for the third quarter of 2014 to US$4,949,000 for the
third quarter of 2015. The increase was mainly attributed to the settlement income of US$2,100,000 from a
charterer in relation to repudiation claims. The Group will continue to seek all legal means to recover the
amounts granted in the arbitration awards.
Shipping related expenses dropped from US$22,972,000 for the third quarter of 2014 to US$20,841,000 for
the current quarter. The decrease was mainly attributable to the lower spare parts and consumable stores
expenses were incurred during the current quarter under the Group’s continuing effort on cost reduction
strategy in order to remain competitive in the current tough market environment.
The Group’s operating results for the third quarter of 2015 was negatively impacted by the substantial
increase of other operating expenses from US$5,695,000 for the third quarter of 2014 to US$23,826,000 for
the third quarter of 2015. The increase was primarily attributable to the recognition of net loss of
US$21,917,000 on investment portfolio, predominantly in equity securities listed in Hong Kong as major
global stock markets plunged during the third quarter of 2015. For the last corresponding quarter, the Group
recorded net loss on investment portfolio of US$3,789,000.
Finance costs for the third quarter decreased 6% from US$1,318,000 in 2014 to US$1,240,000 in 2015. The
decrease was mainly attributable to the reduction in average outstanding loan principal under aggressive loan
repayment schedules of the Group.
Third Quarter and Nine Months Report 2015 4
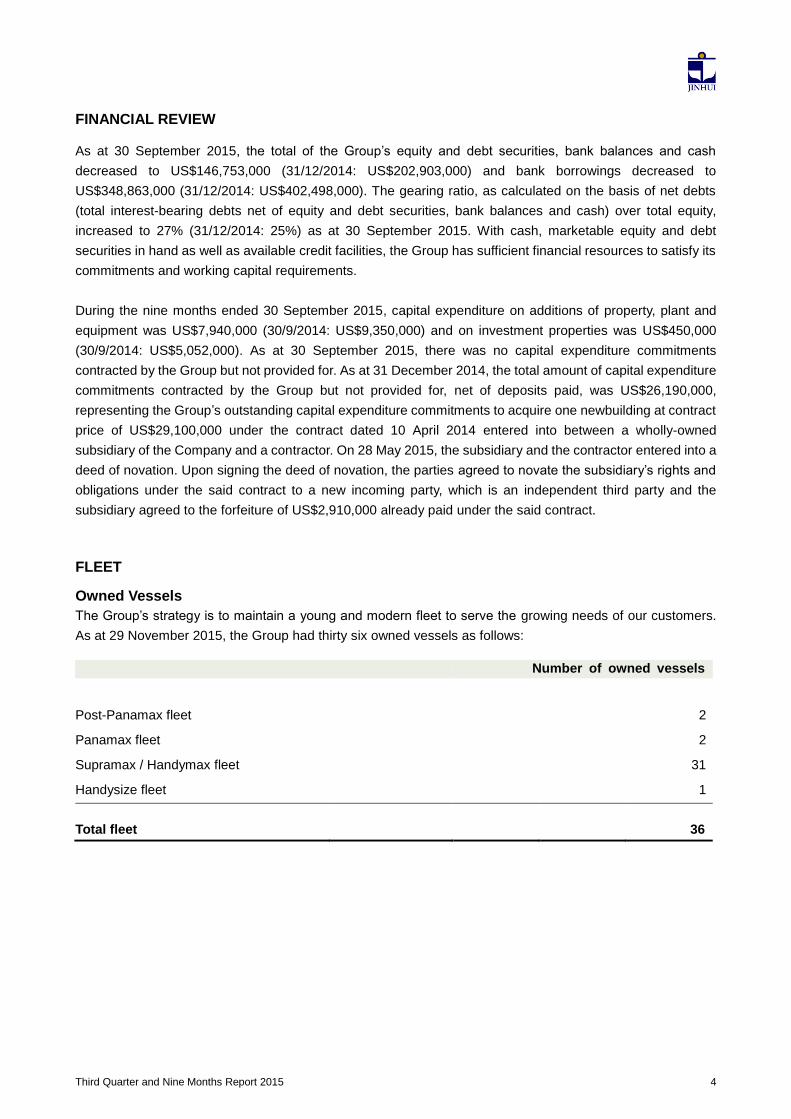
FINANCIAL REVIEW
As at 30 September 2015, the total of the Group’s equity and debt securities, bank balances and cash
decreased to US$146,753,000 (31/12/2014: US$202,903,000) and bank borrowings decreased to
US$348,863,000 (31/12/2014: US$402,498,000). The gearing ratio, as calculated on the basis of net debts
(total interest-bearing debts net of equity and debt securities, bank balances and cash) over total equity,
increased to 27% (31/12/2014: 25%) as at 30 September 2015. With cash, marketable equity and debt
securities in hand as well as available credit facilities, the Group has sufficient financial resources to satisfy its
commitments and working capital requirements.
During the nine months ended 30 September 2015, capital expenditure on additions of property, plant and
equipment was US$7,940,000 (30/9/2014: US$9,350,000) and on investment properties was US$450,000
(30/9/2014: US$5,052,000). As at 30 September 2015, there was no capital expenditure commitments
contracted by the Group but not provided for. As at 31 December 2014, the total amount of capital expenditure
commitments contracted by the Group but not provided for, net of deposits paid, was US$26,190,000,
representing the Group’s outstanding capital expenditure commitments to acquire one newbuilding at contract
price of US$29,100,000 under the contract dated 10 April 2014 entered into between a wholly-owned
subsidiary of the Company and a contractor. On 28 May 2015, the subsidiary and the contractor entered into a
deed of novation. Upon signing the deed of novation, the parties agreed to novate the subsidiary’s rights and
obligations under the said contract to a new incoming party, which is an independent third party and the
subsidiary agreed to the forfeiture of US$2,910,000 already paid under the said contract.
FLEET
Owned Vessels
The Group’s strategy is to maintain a young and modern fleet to serve the growing needs of our customers.
As at 29 November 2015, the Group had thirty six owned vessels as follows:
Number of owned vessels
Post-Panamax fleet 2
Panamax fleet 2
Supramax / Handymax fleet 31
Handysize fleet 1
Total fleet 36
Third Quarter and Nine Months Report 2015 5
RISK FACTORS
This report may contain forward looking statements. These statements are based upon various assumptions,
many of which are based, in turn, upon further assumptions, including the Company’s management's
examination of historical operating trends. Although the Company believes that these assumptions were
reasonable when made, because assumptions are inherently subject to significant uncertainties which are
difficult or impossible to predict and are beyond its control, the Company cannot give assurance that it will
achieve or accomplish these expectations, beliefs or targets.
Key risk factors that could cause actual results to differ materially from those discussed in this report will
include but not limited to the way world economies, currencies and interest rate environment may evolve
going forward, general market conditions including fluctuations in charter rates and vessel values,
counterparty risk, changes in demand in the dry bulk market, changes in operating expenses including bunker
prices, crewing costs, drydocking and insurance costs, changes in governmental rules and regulations or
actions taken by regulatory authorities, potential liability from pending or future litigation, general domestic
and international political conditions, potential disruption of shipping routes due to accidents, piracy or political
events, and other important factors described from time to time in the reports filed by the Company.
OUTLOOK
We expected the 2015 dry bulk shipping market will be a tough market, it turns out to be unprecedentedly
tough. This tough trading environment is expected to continue and could result in more companies
experiencing financial distress similar to Daiichi Chuo Kisen Kaisha’s recent filing for bankruptcy protection,
for example.
A number of factors continue to hinder the dry bulk market recovery: (1) slower demand growth in key dry bulk
commodities importing activities from China due to economic slowdown, with a weak demand growth largely
due to the continued slowdown in Chinese coal and iron ore imports which together represent a large
proportion of overall dry bulk trade; (2) a much lower oil price which discourages slow steaming and
effectively releasing further supply to the market; (3) the irrational ordering of newbuildings.
On a positive note, this excess newbuilding orders driven by irrational expectations of financial return by
parties with limited operating experience, backed by access to cheap funding in the capital market, and fee
driven intermediary institutions seems to come to a halt. In fact, given the reality of the prevailing tough trading
environment, delays, conversions, cancellations, and shipyard defaults are leading to fewer actual deliveries
than previously scheduled.
We continue to see uncertainties with respect to the global economic outlook, particularly the freight market
as well as the financial and currency markets. This will inevitably introduce volatility to our business
performance, as well as the carrying value of our shipping assets and financial assets. We will continue to
refrain from using freight, bunker, currencies or interest rate derivatives.

Third Quarter and Nine Months Report 2015 6
Looking ahead, we will continue to focus on the basics: maintain a strong financial position with an emphasis
on liquidity and low indebtedness, safeguard our financial assets, monitor cargo flows in order to deploy our
vessels efficiently to optimize revenue, lock in longer term charters to enhance the stability of income at the
right time, ensuring the maintenance of a high quality, safe fleet of vessels, and keeping costs in check to
enhance our margins. We will continue to operate with a conservative yet nimble mindset, and be ready to act
in the best interest of our shareholders under different kinds of scenarios.
PUBLICATION OF FINANCIAL INFORMATION
This report is available on the website of the Company at www.jinhuiship.com and the NewsWeb of the Oslo
Stock Exchange at www.newsweb.no.
By Order of the Board
Ng Siu Fai
Chairman
30 November 2015
Third Quarter and Nine Months Report 2015 7
CONDENSED CONSOLIDATED STATEMENT OF PROFIT OR LOSS AND
OTHER COMPREHENSIVE INCOME
3 months
ended
30/9/2015
3 months
ended
30/9/2014
9 months
ended
30/9/2015
9 months
ended
30/9/2014
Year
ended
31/12/2014
(Unaudited) (Unaudited) (Unaudited) (Unaudited) (Audited)
Note US$’000 US$’000 US$’000 US$’000 US$’000
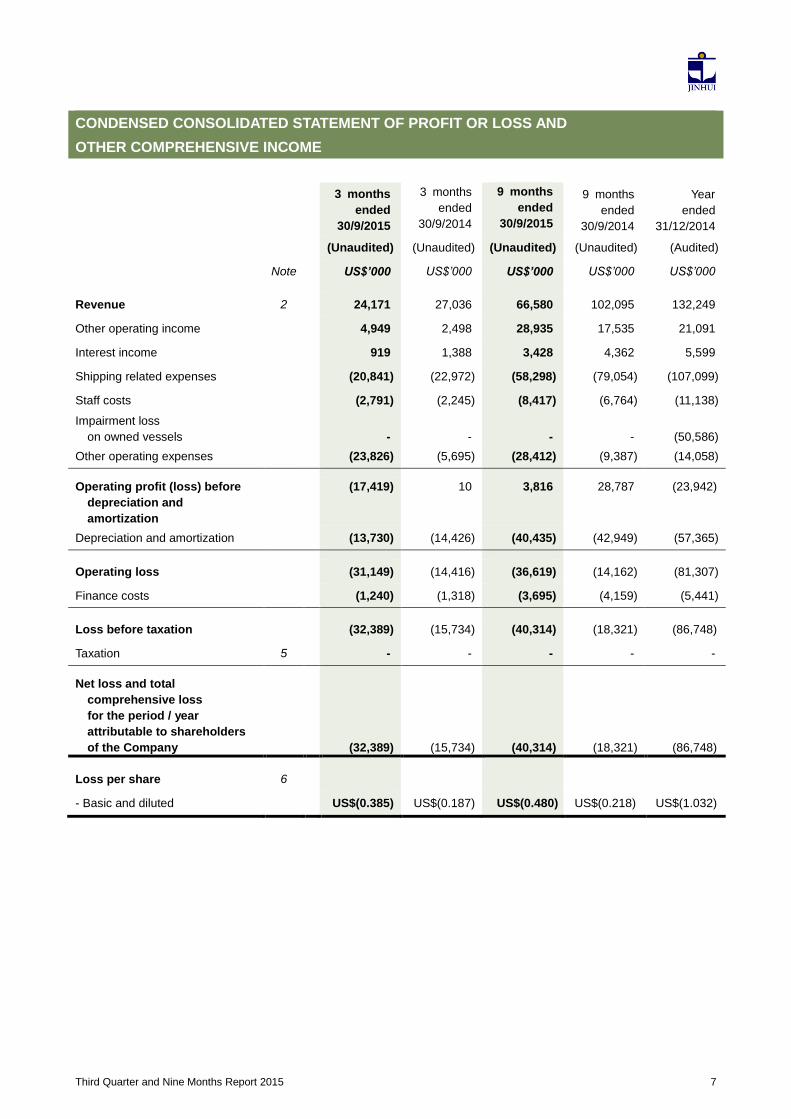
Revenue 2 24,171 27,036 66,580 102,095 132,249
Other operating income 4,949 2,498 28,935 17,535 21,091
Interest income 919 1,388 3,428 4,362 5,599
Shipping related expenses (20,841) (22,972) (58,298) (79,054) (107,099)
Staff costs (2,791) (2,245) (8,417) (6,764) (11,138)
Impairment loss
on owned vessels
-
- - -
(50,586)
Other operating expenses (23,826) (5,695) (28,412) (9,387) (14,058)
Operating profit (loss) before
depreciation and
amortization
(17,419) 10 3,816 28,787 (23,942)
Depreciation and amortization (13,730) (14,426) (40,435) (42,949) (57,365)
Operating loss (31,149) (14,416) (36,619) (14,162) (81,307)
Finance costs (1,240) (1,318) (3,695) (4,159) (5,441)
Loss before taxation (32,389) (15,734) (40,314) (18,321) (86,748)
Taxation 5 - - - - -
Net loss and total
comprehensive loss
for the period / year
attributable to shareholders
of the Company
(32,389)
(15,734) (40,314) (18,321) (86,748)
Loss per share 6
- Basic and diluted US$(0.385) US$(0.187) US$(0.480) US$(0.218) US$(1.032)

Third Quarter and Nine Months Report 2015 8
CONDENSED CONSOLIDATED STATEMENT OF FINANCIAL POSITION
30/9/2015 30/9/2014 31/12/2014
(Unaudited) (Unaudited) (Audited)
Note US$’000 US$’000 US$’000
ASSETS
Non-current assets
Property, plant and equipment 932,536 1,030,664 967,941
Investment properties 8 8,996 8,565 8,546
Available-for-sale financial assets 9 373 373 373
941,905 1,039,602 976,860
Current assets
Inventories 1,797 666 2,452
Trade and other receivables 20,200 28,108 20,879
Financial assets at fair value through profit or loss 10 102,984 146,150 132,339
Pledged deposits 22,685 25,739 22,617
Bank balances and cash 11 43,769 69,352 70,564
191,435 270,015 248,851
Total assets 1,133,340 1,309,617 1,225,711
EQUITY AND LIABILITIES
Capital and reserves
Issued capital 4,202 4,202 4,202
Reserves 747,634 856,375 787,948
Total equity 751,836 860,577 792,150
Non-current liabilities
Secured bank loans 271,688 353,404 338,638
Current liabilities
Trade and other payables 32,558 31,380 30,961
Amount due to holding company 83 43 102
Secured bank loans 77,175 64,213 63,860
109,816 95,636 94,923
Total equity and liabilities 1,133,340 1,309,617 1,225,711

Third Quarter and Nine Months Report 2015 9
CONDENSED CONSOLIDATED STATEMENT OF CHANGES IN EQUITY
Issued
capital
Share
premium
Capital
redemption
reserve
Contributed
surplus
Employee
share-based
compensation
reserve
Reserve for
available-
for-sale
financial
assets
Retained
profits
Total
equity
(Unaudited) (Unaudited) (Unaudited) (Unaudited) (Unaudited) (Unaudited) (Unaudited) (Unaudited)
US$’000 US$’000 US$’000 US$’000 US$’000 US$’000 US$’000 US$’000
At 1 January 2014 4,202 72,087 719 16,297 4,758 48 780,787 878,898
Net loss and
total comprehensive
loss for the period - - - - - - (18,321) (18,321)
At 30 September 2014 4,202 72,087 719 16,297 4,758 48 762,466 860,577
At 1 January 2015 4,202 72,087 719 16,297 4,758 48 694,039 792,150
Net loss and
total comprehensive
loss for the period - - - - - - (40,314) (40,314)
At 30 September 2015 4,202 72,087 719 16,297 4,758 48 653,725 751,836

Third Quarter and Nine Months Report 2015 10
CONDENSED CONSOLIDATED STATEMENT OF CASH FLOWS
9 months
ended
30/9/2015
9 months
ended
30/9/2014
Year
ended
31/12/2014
(Unaudited) (Unaudited) (Audited)
Note US$’000 US$’000 US$’000
OPERATING ACTIVITIES
Cash generated from operations 33,669 24,946 40,239
Interest paid (3,746) (4,268) (5,553)
Net cash from operating activities 29,923 20,678 34,686
INVESTING ACTIVITIES
Interest received 3,935 4,506 5,454
Decrease (Increase) in bank deposits with more than
three months to maturity when placed
14,408 - (14,408)
Dividend income received 1,421 1,380 1,912
Purchase of property, plant and equipment (7,921) (9,350) (11,629)
Purchase of investment properties (450) (5,052) (5,052)
Proceeds from disposal of assets held for sale - 56,000 56,000
Net cash from investing activities 11,393 47,484 32,277
FINANCING ACTIVITIES
New secured bank loans 1,683 2,765 4,144
Repayment of secured bank loans (55,318) (78,084) (94,582)
Decrease (Increase) in pledged deposits (68) (2,162) 960
Net cash used in financing activities (53,703) (77,481) (89,478)
Net decrease in cash and cash equivalents (12,387) (9,319) (22,515)
Cash and cash equivalents at beginning of the period / year 56,156 78,671 78,671
Cash and cash equivalents at end of the period / year 11 43,769 69,352 56,156
Third Quarter and Nine Months Report 2015 11
NOTES:
1. Basis of preparation and accounting policies
The unaudited condensed consolidated interim financial statements have been prepared in accordance with
International Accounting Standard 34 “Interim Financial Reporting” issued by the International Accounting
Standards Board and Hong Kong Accounting Standard 34 “Interim Financial Reporting” issued by the Hong Kong
Institute of Certified Public Accountants and have not been reviewed by our auditor, Grant Thornton Hong Kong
Limited. The accounting policies and basis of preparation adopted in these interim financial statements are
consistent with those adopted in the annual financial statements for the year ended 31 December 2014.
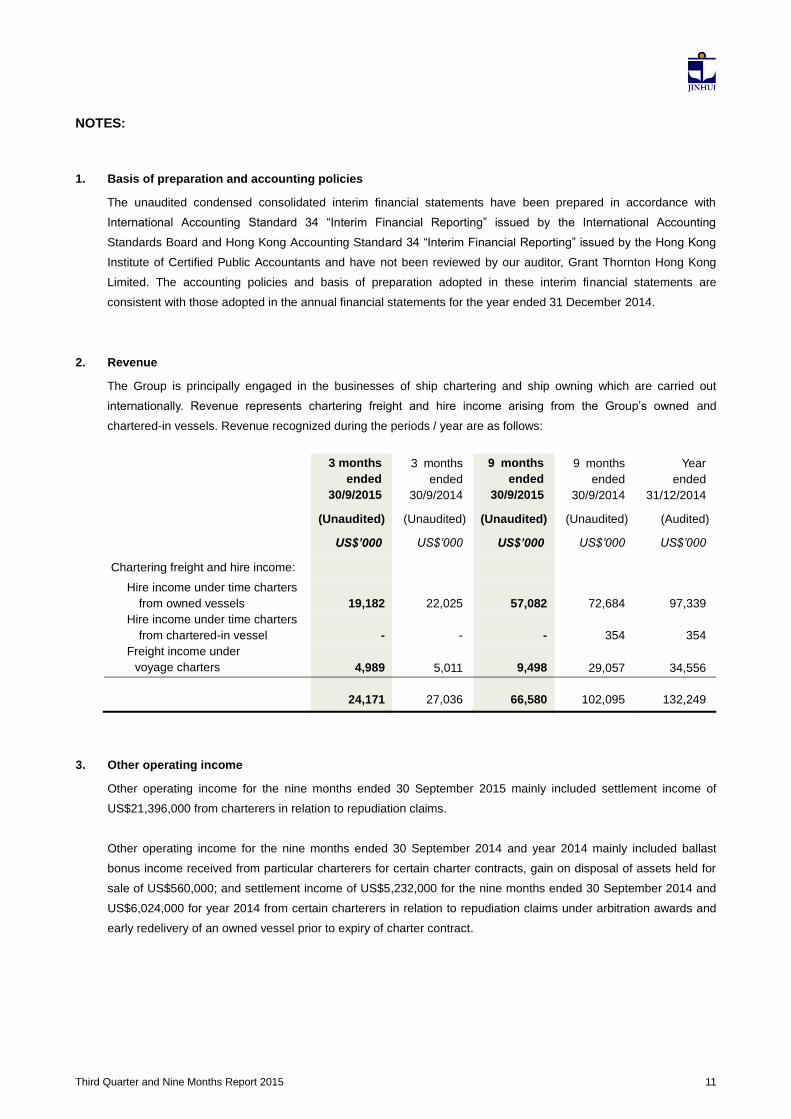
2. Revenue
The Group is principally engaged in the businesses of ship chartering and ship owning which are carried out
internationally. Revenue represents chartering freight and hire income arising from the Group’s owned and
chartered-in vessels. Revenue recognized during the periods / year are as follows:
3 months
ended
30/9/2015
3 months
ended
30/9/2014
9 months
ended
30/9/2015
9 months
ended
30/9/2014
Year
ended
31/12/2014
(Unaudited) (Unaudited) (Unaudited) (Unaudited) (Audited)
US$’000 US$’000 US$’000 US$’000 US$’000
Chartering freight and hire income:
Hire income under time charters
from owned vessels 19,182 22,025 57,082 72,684 97,339
Hire income under time charters
from chartered-in vessel - - - 354 354
Freight income under
voyage charters 4,989 5,011 9,498 29,057 34,556
24,171 27,036 66,580 102,095 132,249
3. Other operating income
Other operating income for the nine months ended 30 September 2015 mainly included settlement income of
US$21,396,000 from charterers in relation to repudiation claims.
Other operating income for the nine months ended 30 September 2014 and year 2014 mainly included ballast
bonus income received from particular charterers for certain charter contracts, gain on disposal of assets held for
sale of US$560,000; and settlement income of US$5,232,000 for the nine months ended 30 September 2014 and
US$6,024,000 for year 2014 from certain charterers in relation to repudiation claims under arbitration awards and
early redelivery of an owned vessel prior to expiry of charter contract.

Third Quarter and Nine Months Report 2015 12
4. Operating profit (loss) before depreciation and amortization
This is stated after charging / (crediting):
3 months
ended
30/9/2015
3 months
ended
30/9/2014
9 months
ended
30/9/2015
9 months
ended
30/9/2014
Year
ended
31/12/2014
(Unaudited) (Unaudited) (Unaudited) (Unaudited) (Audited)
US$’000 US$’000 US$’000 US$’000 US$’000
Impairment loss
(Reversal of impairment loss)
on trade receivables (12) 197 (357) (252) (644)
Dividend income (1,113) (881) (1,663) (1,502) (2,053)
Loss on write-off of
vessel under construction - - 2,910 - -
Net loss on financial assets at
fair value through profit or loss 21,917 3,789 20,980 3,629 5,923
5. Taxation
Taxation has not been provided as the Group has no assessable profit for all relevant periods / year.
6. Loss per share
Basic and diluted loss per share for the quarter and nine months ended 30 September 2015 were calculated on the
respective net loss of US$32,389,000 for the quarter and US$40,314,000 for the nine months ended 30 September
2015 and the weighted average number of 84,045,341 ordinary shares in issue during the quarter / period.
Basic and diluted loss per share for the quarter and nine months ended 30 September 2014 were calculated on the
respective net loss of US$15,734,000 for the quarter and US$18,321,000 for the nine months ended 30 September
2014 and the weighted average number of 84,045,341 ordinary shares in issue during the quarter / period.
Basic and diluted loss per share for the year ended 31 December 2014 were calculated on the net loss of
US$86,748,000 for year 2014 and the weighted average number of 84,045,341 ordinary shares in issue during the
year.
7. Interim dividend
The Board has resolved not to recommend the payment of any interim dividend for the quarter ended
30 September 2015 (30/9/2014: nil).

Third Quarter and Nine Months Report 2015 13
8. Investment properties
30/9/2015 30/9/2014 31/12/2014
(Unaudited) (Unaudited) (Audited)
US$’000 US$’000 US$’000
At 1 January 8,546 3,513 3,513
Additions 450 5,052 5,052
Change in fair value - - (19)
8,996 8,565 8,546
The Group’s investment properties were stated at fair value and comprised of premises and car parks held under
operating leases to earn rentals or held for capital appreciation, or both. These premises and car parks are held
under long term leases.
The investment properties of the Group were not revalued at 30 September 2015 by independent valuers. The
management was aware of the possible change in the conditions of the property market and considered that the
carrying amount of the Group’s investment properties did not differ significantly from that which had been
determined using fair values at 31 December 2014. Consequently, no increase or decrease in fair value of
investment properties has been recognized in the current period.
9. Available-for-sale financial assets
30/9/2015 30/9/2014 31/12/2014
(Unaudited) (Unaudited) (Audited)
US$’000 US$’000 US$’000
Unlisted club membership, at fair value 203 203 203
Unlisted club membership, at cost 170 170 170
373 373 373
Unlisted club membership stated at fair value represented investment in club membership which its fair value can
be determined directly by reference to published price quotation in active market. At the reporting date, the fair value
measurement of this unlisted club membership was categorized as Level 1 of the three-level fair value hierarchy as
defined under IFRS 13 and HKFRS 13 and there was no transfer among the three levels of the fair value hierarchy
during the periods / year.
For the unlisted club membership stated at cost, as there is no quoted market price in active market, the range of
reasonable fair value estimates can be varied significantly that its fair value cannot be measured reliably.
Third Quarter and Nine Months Report 2015 14
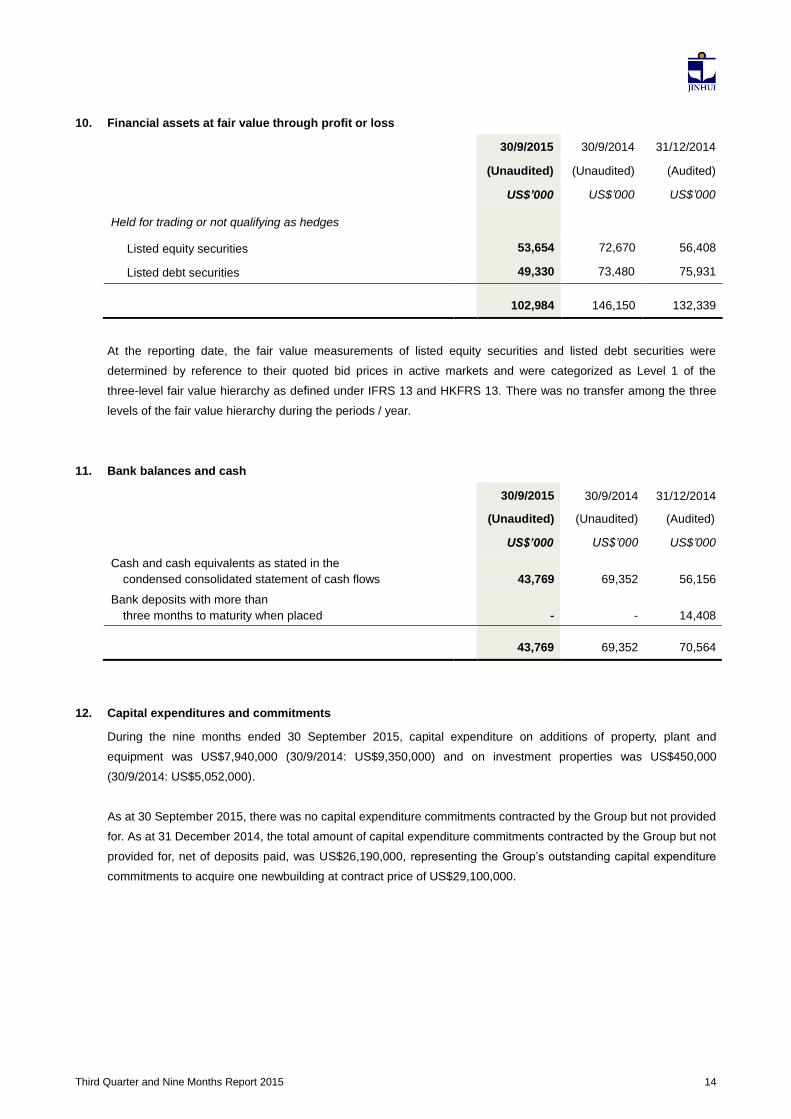
10. Financial assets at fair value through profit or loss
30/9/2015 30/9/2014 31/12/2014
(Unaudited) (Unaudited) (Audited)
US$’000 US$’000 US$’000
Held for trading or not qualifying as hedges
Listed equity securities 53,654 72,670 56,408
Listed debt securities 49,330 73,480 75,931
102,984 146,150 132,339
At the reporting date, the fair value measurements of listed equity securities and listed debt securities were
determined by reference to their quoted bid prices in active markets and were categorized as Level 1 of the
three-level fair value hierarchy as defined under IFRS 13 and HKFRS 13. There was no transfer among the three
levels of the fair value hierarchy during the periods / year.
11. Bank balances and cash
30/9/2015 30/9/2014 31/12/2014
(Unaudited) (Unaudited) (Audited)
US$’000 US$’000 US$’000
Cash and cash equivalents as stated in the
condensed consolidated statement of cash flows
43,769 69,352 56,156
Bank deposits with more than
three months to maturity when placed
- - 14,408
43,769 69,352 70,564
12. Capital expenditures and commitments
During the nine months ended 30 September 2015, capital expenditure on additions of property, plant and
equipment was US$7,940,000 (30/9/2014: US$9,350,000) and on investment properties was US$450,000
(30/9/2014: US$5,052,000).
As at 30 September 2015, there was no capital expenditure commitments contracted by the Group but not provided
for. As at 31 December 2014, the total amount of capital expenditure commitments contracted by the Group but not
provided for, net of deposits paid, was US$26,190,000, representing the Group’s outstanding capital expenditure
commitments to acquire one newbuilding at contract price of US$29,100,000.

Third Quarter and Nine Months Report 2015 15
13. Related party transactions
During the periods / year, the Group had related party transactions in relation to compensation of key management
personnel as follows:
3 months
ended
30/9/2015
3 months
ended
30/9/2014
9 months
ended
30/9/2015
9 months
ended
30/9/2014
Year
ended
31/12/2014
(Unaudited) (Unaudited) (Unaudited) (Unaudited) (Audited)
US$’000 US$’000 US$’000 US$’000 US$’000
Salaries and other benefits 1,594 1,133 4,782 3,435 7,111
Contributions to
retirement benefits schemes 91 63 273 191 254
1,685 1,196 5,055 3,626 7,365

Registered office:
Clarendon House, 2 Church Street, Hamilton HM 11, Bermuda
Correspondence address:
26th Floor, Yardley Commercial Building, 1-6 Connaught Road West, Hong Kong SAR, PRC
Tel: (852) 2545 0951 E-mail: i n f o @ j i n h u i s h i p . c o m
Fax: (852) 2541 9794 Website: w w w . j i n h u i s h i p . c o m
Jinhui Shipping and Transpor tation Limited