jg summit holdings, inc. and subsidiaries...management's discussion and analysis of financial...
TRANSCRIPT


COVER SHEET
1 8 4 0 4 4 SEC Registration Number
J G S U M M I T H O L D I N G S , I N C . A N D S U B S
I D I A R I E S
(Company’s Full Name)
4 3 r d F l o o r , R o b i n s o n s - E q u i t a b l e T
o w e r , A D B A v e n u e c o r n e r P o v e d a R o
a d , P a s i g C i t y
(Business Address: No. Street City/Town/Province)
Constante T. Santos 633-7631 (Contact Person) (Company Telephone Number)
1 2 3 1 1 7 Q - A M E N D E D Month Day (Form Type) Month Day
(Fiscal Year) (Annual Meeting)
(Secondary License Type, If Applicable)
Dept. Requiring this Doc. Amended Articles Number/Section Total Amount of Borrowings
Total No. of Stockholders Domestic Foreign
To be accomplished by SEC Personnel concerned
File Number LCU
Document ID Cashier
S T A M P S Remarks: Please use BLACK ink for scanning purposes.
SECURITIES AND EXCHANGE COMMISSION
SEC FORM 17-Q
QUARTERLY REPORT PURSUANT TO SECTION 17 OF THE SECURITIES REGULATION CODE AND SRC RULE 17(2)(b) THEREUNDER
1. For the quarterly period ended June 30, 2009 2. Commission identification number 184044 3. BIR Tax Identification No 000-775-860 4. Exact name of registrant as specified in its charter JG Summit Holdings, Inc. 5. Province, country or other jurisdiction of incorporation or organization
Pasig City, Philippines
6. Industry Classification Code: (SEC Use Only) 7. Address of registrant's principal office Postal Code
43rd Floor, Robinsons-Equitable Tower ADB Ave. corner Poveda Road, Pasig City 1600 8. Registrant's telephone number, including area code
(632) 633-7631
9. Former name, former address and former fiscal year, if changed since last report Not Applicable 10. Securities registered pursuant to Sections 4 and 8 of the RSA Title of each Class Number of shares of common stock outstanding and amount of debt outstanding Common Stock 6,797,191,657 11. Are any or all of the securities listed on the Philippine Stock Exchange? Yes [ / ] No [ ]
2

12. Indicate by check mark whether the registrant: (a) has filed all reports required to be filed by Section 11 of the Revised Securities Act (RSA) and RSA Rule 11(a)-1 thereunder and Sections 26 and 141 of the Corporation Code of the Philippines, during the preceding 12 months (or for such shorter period the registrant was required to file such reports) Yes [ / ] No [ ] (b) has been subject to such filing requirements for the past 90 days. Yes [ / ] No [ ]
PART I--FINANCIAL INFORMATION
Item 1. Financial Statements.
The unaudited consolidated financial statements are filed as part of this Form 17-Q. Item 2. Management's Discussion and Analysis of Financial Condition and Results of Operations. Results of Operations Six Months Ended June 30, 2009 vs. June 30, 2008 JG Summit’s net income for the 1st half of the fiscal year 2009 amounted to P=3.61 billion, a substantial increase of 473.4% compared to last year of the same period. The 2nd quarter brought in record results as the Company netted profits of P=2.75 billion (compared to P=864 million in the 1st qtr) since the Company benefited from the initial signs of stabilization on the global financial markets front even as the peso depreciated during the period. Even excluding the effects of the financial and foreign exchange markets, our Company still showed marked improvement as our core earnings for the 1st six months increased 8.4% from P=4.90 billion in 2008 to P=5.31 billion in 2009. Likewise, our Core EBITDA for the period increased 24.3% from P=10.51 billion to P=13.06 billion. Consolidated revenues were up 15.5% from P=46.20 billion to P=53.34 billion driven by the continued growth in sales and revenues of our core businesses, mainly: foods, airline and the mobile phone business. In addition, equity in net earnings of associates recorded an 82.4% growth during the period, from P=911.62 million last year to P=1.66 billion during the first half of this year. Revenue growth, however was tempered by the decline in sales of our petrochemical business by 42.4% to P=2.50 billion during the period. Consolidated cost of sales and services for the first half of the year increased by 7.9% from P=29.72 billion last year to P=32.08 billion for the first six months of fiscal 2009. Foods business recorded higher cost of sales due to increased sales volume coupled with the increase in costs of its major raw materials. Aside from this, the airline and the telecoms businesses also recorded higher cost of services relative to their revenues for the first half of 2009.
3

Consolidated operating expenses increased 27.6% to P=13.71 billion as a result of higher general and administrative expenses in our food operations, mobile phone business, and increased airline operations. Financing costs and other charges incurred for the six months of the year increased 19.2% to P=3.29 billion mainly due to higher level of debt financing during the period as well as the higher peso-exchange rate used. Mark-to-market gains recognized during the period amounted to P=782.20 million as compared to a loss of P=1.78 billion recorded for the same period last year. The market values of the Group’s financial assets have shown signs of recovery especially in 2nd qtr., brought about by the improving confidence in the global financial markets. Market valuation losses reported by URC in its six-month financial statements as of March 31, 2009 were adjusted to reflect the change in the fair values from April to June 2009. Foreign exchange loss recorded for the first six months of 2009 amounted to P=1.06 billion, a 59.7% decrease from P=2.64 billion for the same period last year mainly due to higher peso devaluation during the first six months of last year. Interest income declined 19.5% for the first six months of 2009 from P=1.17 billion last year to P=943.66 million this year due to lower average investment portfolio during the period as compared to last year’s. The Other income account dropped 86.9% for the first half of 2009 from P=752.57 million in 2008 to P=98.37 million mainly due to lower trading gains (actual) realized this year in our financial assets as compared to the same period last year and also due to last year’s recognition of gain on early repayment of various debts by a certain subsidiary. FOODS Universal Robina Corporation (URC) posted consolidated sale of goods and services of P=25.69 billion for the six months ended March 31, 2009, 21.4% higher than the revenues reported in the same period of last year. Sale of goods and services by business segment follows: (1) URC’s BCFG (excluding packaging) increased by P=3.50 billion or 22.3% to P=19.15 billion in the first half of fiscal 2009 from P=15.66 billion recorded in the same period of fiscal 2008. This increase was primarily due to a 15.5% increase in net sales from BCFG’s domestic operations, which was largely driven by the strong performance of its snackfoods which posted an 18.2% growth in savory snacks, candies, chocolates and biscuit sales. Export also posted a 55.1% growth in sales value. BCFG international sales significantly increased by 41.4% to P=5.86 billion due to considerable increase in sales volume. Sales in URC’s packaging division went down by 26.4% to P=529 million in the first half of fiscal 2009 from P=719 million posted in the same period last year due to decrease in sales volume and selling price. (2) URC’s AIG recorded net sales of P=2.94 billion, a 4.8% increase from P=2.80 billion recorded in the same period last year. This was due to increase in hog and feeds sales driven by higher selling prices which offset the decrease in sales of poultry products. (3) URC’s CFG revenues amounted to P=3.07 billion in the first half of fiscal 2009 up 55.3% from P=1.98 billion reported in the same period last year primarily due to increase in sales volume of sugar as a result of better performance by SONEDCO in the first half of this year against last year, coupled with higher average selling prices of sugar and flour. URC’s cost of sales increased by P=3.75 billion or 23.4% to P=19.74 billion for the first half of fiscal 2009 from P=15.99 billion recorded for the same period last year. Cost of sales went up due to increases in sales volume coupled with significant increases in costs of major raw materials during the first quarter of fiscal 2009. URC’s gross profit for the first half of fiscal 2009 amounted to P=5.95 billion, an increase of P=785 million or 15.2% from P=5.16 billion posted in the same period last year.
4
Operating expenses increased by P=644 million or 19.2% to P=4.0 billion in the first half of fiscal 2009 from P=3.36 billion recorded in the same period of fiscal 2008. The increase was primarily due to 25.8% or P=285 million increase in advertising and promotion costs to support new SKUs launched and boost up sales of existing products in light of increasing market competition. Freight and delivery charges amounted to P=885 million in the first half of fiscal 2009, a 12.2% increase brought about by higher trucking and shipping costs associated with higher fuel prices and increased volume. Compensation and other benefits also increased by P=181 million due to annual salary adjustments and retirement expense. Market valuation loss on financial instruments at FVPL increased by P=379 million or 49.0% to P=1.15 billion in the first half of fiscal 2009 due to drop in the market values of investments in bonds and equity securities as a result of global financial crisis (based on March 31, 2009 prices since URC presents its six-month’s financial statements as of that date). Finance costs slightly dropped 3.3% to P=665 million for the first half of fiscal 2009 mainly due to capitalization of certain borrowings in accordance with revised PAS 23 on Borrowing Costs. Impairment losses recognized for the period pertaining to certain receivables, AFS investments and assets held for sale amounted to P=315 million. No impairment loss was recorded during the same period last year. URC’s net income attributable to equity holders of the parent decreased by P=273 million or 55.3% to P=221 million in the first half of 2009 from P=494 million as a result of the significant mark-to-market loss in bond and equity holdings and recognition of impairment losses. URC’s unaudited core earnings before tax (operating profit after equity earnings, net finance costs and other income – net) for the first half of fiscal year 2009 amounted to P=1.94 billion, an increase of P=136 million from P=1.80 million reported in the same period last year. URC reported an EBITDA (operating income plus depreciation, amortization) of P=3.41 billion for the first half of fiscal 2009, 9.3% higher than P=3.12 billion recorded in the same period of fiscal 2008. URC is not aware of any material off-balance sheet transactions, arrangements and obligations (including contingent obligations), and other relationship of URC with unconsolidated entities or other persons created during the reporting period that would have a significant impact on its operations and/or financial condition. PROPERTY Robinsons Land Corporation (RLC) posted a P=1.6 billion net income for the first six months of fiscal year 2009. Realized revenues stood at P=5.1 billion while EBITDA and EBIT amounted to P=2.9 billion and P=2.1 billion, respectively. Commercial Centers Division contributed 40% or P=2.0 billion of the gross revenues posting a 10% growth. Significant growth contributors are the Metro Manila malls led by the Midtown Mall of Robinsons Place Manila. Other provincial malls also posted decent growth in rental revenues while significant rental increment was also contributed by the newly opened mall in CabanatuanCity, Nueva Ecija. RLC’s High Rise Residential Buildings Division’s accounted for 34% of RLC’s revenues. Its six months’ performance resulted in realized revenues amounting to P=1.7 billion. Significant revenues were realized from recently launched projects such as East of Galleria, Gateway Garden Heights, Woodsville Viverde, Otis 888, Gateway Garden Ridge, Fifth Avenue Place and Bloomfields, projects launched earlier, have lower realized revenues since these are nearing completion. The Office Buildings Division contributed 10% or P=503.1 million of RLC’s revenues, up by 33% from last year’s P=379.3 million. The increase in office rentals was due to rentals from Cybergate Centers 2 and 3. The Hotels Division showed a decline in revenue by 16% from P=581.3 million last year to P=491.0 million this year. Occupancy rates for the three hotels, Crowne Plaza Galleria Manila, Holiday Inn Galleria Manila and Cebu Midtown Hotel, stood at 71%, 79% and 56%, respectively.
5
The Housing and Land Development Division reported realized revenues amounting to P=334.2 million, against last year’s P=319.5 million posting a steady 5% growth. This was brought about by higher percentage completion of various ongoing projects. Real Estate cost decreased by 5% from P=1.9 billion last year to P=1.8 billion this year due to lower level of project completion of several residential condominium projects. Interest income decreased by 23% to P=197.6 million due to lower level of interest amortization on installment contracts arising from sales of condo and housing units. Interest expense went up by P=3.4 million due to higher level of mall tenant deposits classified as financial instruments. Hotel costs decreased by 10% due to lower utility costs brought about by lower room occupancy. General and administrative expenses went up by 3% due to higher operating expenses. TELECOMMUNICATIONS DIGITEL’s consolidated service and nonservice revenues for the first semester of 2009 totaled to P=6.69 billion, up by 35.9% from last year’s P=4.92 billion. The wireless segment, which comprised 71% of the total, grew 62.4% year on year. The wireline voice communication services registered service revenues and non-service revenues of P=1.71 billion for the six months ended June 30, 2009. This is a 7.2% decline over same period last year of P=1.8 billion mainly due to lower international and domestic tolls. Providing cushion to the reduced international and domestic traffic is the growth of ADSL products. This service registered an increase of 38% compared to same period last year. Revenues for wireline data communication services for the six months ended June 30, 2009 amounted to P=205.5 million posting a slight decrease of 0.7% over same period last year of P=207.0 million. The wireless communications business posted a remarkable 62.4% improvement in its operating revenues of P=4.78 billion during the six-month period ended June 30, 2009 from P=2.94 billion during the same period last year. Net service revenues, 66.1% of which accounts for unlimited services, improved substantially by 61.4% against reported revenues of the same period last year. This is mainly attributable to the continued success of the unlimited service portfolio (e.g. 24/7 Call & Text Unlimited and Text Unlimited) and increase in subscriber count from the Group Plans and Plan 350 products. Non-service revenues from the wireless communications segment also grew by 238.8% brought about by higher sales of SIM packs and phonekits. Furthermore, competitive SIM pack prices and new products launched at very affordable prices aggressively contributed to enlarge market share. Consolidated cost and operating expenses increased by 26.7% to P=4.56 billion from last year’s consolidated figure of P=3.60 billion. Higher cost of sales, network-related expenses and general and administrative expenses primarily contributed to the increase. Consolidated EBITDA (earnings before interest, taxes, depreciation and amortization) for the period is P=2.13 billion, higher by 60.9% against P=1.32 billion during the same period in 2008 due primarily to the higher service and non-service revenues generated by the wireless business. EBITDA margin improved to 32% from last year’s 27%. Net loss for the first semester of 2009 amounted to P=638.0 million from last year’s P=2.04 billion. AIR TRANSPORTATION Cebu Air, Inc. (Cebu Pacific) generated gross revenues of P=11.39 billion for the six-month period ended June 30, 2009, a 21.3% growth over last year’s P=9.39 billion brought about by additional routes, increase in flight frequencies and capacity due to additional Airbus A320 and ATR72-500 acquired in recent months. Correspondingly, costs and operating expenses increased from P=8.19 billion last year to P=9.28 billion this year. Foreign exchange loss recognized during the first half of
6

2009 amounted to P=222.0 million a 76.8% drop from last year’s P=958.72 million. Fuel hedging gains recorded a significant increase during the period, from P=77.11 million last year to P=556.02 million for the first six months this year. All these factors contributed to the turnaround in the airlines’ bottomline, from a net loss of P=15.66 million last year to a net income of P=1.99 billion this year. PETROCHEMICALS JG Summit Petrochemicals Corporation’s (JGSPC) revenue for the first six months of 2009 amounted to P=2.50 billion a 42.4% drop from last year’s P=4.35 billion as a result of decrease in sales volume from 67,432 MT last year to only 44,491 MT this year. A gross loss of P=93.88 million was recorded this year from a gross income of P=356.59 million last year. Operating expenses also dropped 25.6% relative to lower production during the period. A foreign exchange loss of P=104.73 million was also recognized during the first half of fiscal 2009 compared to a foreign exchange gain of P=37.0 million for the same period last year. All these factors contributed to a higher net loss for the petrochemical business from P=100.14 million last year to P=670.79 million this year. EQUITY EARNINGS Equity earnings from associated companies and joint ventures were reported at P=1.66 billion for the six-month period ended June 30, 2009, an 82.4% increase from last year’s equity earnings of P=911.62 million. The growth was attributable to higher income recorded by UIC this year, from SGD 79.64 million last year to SGD 135.57 million this year due to higher rental income and gain on sales of residential properties. Also, UIC booked a write-back of deferred income tax amounting to SGD 21.71 million during the period. BANK Robinsons Savings Bank recognized net income of P=92.66 million for the first half of fiscal 2009 an 11.1% decrease from last year’s P=104.28 million. The drop in net income is mainly due to lower trading gain recorded during the period, from P=51.38 million last year to P=13.69 million for the same period this year. Financial Position June 30, 2009 vs. December 31, 2008 As of June 30, 2009, the Company’s balance sheet remains solid, with consolidated assets of P=260.90 billion from P=251.24 billion as of December 31, 2008. Current ratio stood at 1.03. The Company’s indebtedness remained manageable with a gearing ratio of 1.07:1 and net debt to equity of 0.86:1 as of June 30, 2009. Cash and cash equivalents totaled P=9.37 billion as of June 30, 2009 up by 21.0% from P=7.74 billion as of December 31, 2008. The principal sources of cash were from operating and financing activities amounting to P=11.94 billion and P=1.14 billion, respectively. As of June 30, 2009, net cash used in investing activities amounted to P=11.46 billion mainly for the Company’s capital expenditure program. Our financial assets, including those held at fair value through profit and loss, available for sale investments and held-to-maturity investments, increased 5.1% from P=15.21 billion as of December 31, 2008 to P=16.0 billion as of June 30, 2009. Receivables went up 2.6% from P=21.58 billion as of December 31, 2008 to P=22.14 billion as of June 30, 2009 due to higher finance receivables and other receivables of the banking business. Biological assets, including the noncurrent portion, dropped 9.4% as of June 30, 2009 from P=1.44 billion in December 31, 2008 due to decrease in population of livestocks, net of increase in market prices of hogs.
7
Other current assets dropped 20.6% to P=6.84 billion as of June 30, 2009 from P=8.62 billion as of December 31, 2008 due to decline in balance of refundable deposits of the airline business. Assets of disposal group classified as held for sale pertains to Tianjin Pacific Foods Manufacturing Co., Ltd., a subsidiary of the food group. Investments in associates and joint ventures increased 5.8% due to increase in equity ownership in UIC during the period and higher translated value of foreign-denominated investments. Investment properties increased 12.2% from P=27.69 billion as of December 31, 2008 to P=31.06 billion as of June 30, 2009 mainly due to adoption of revised PAS 40, wherein the Company’s assets which are being constructed or developed for future use has been reclassified from construction in progress to this account. Property, plant and equipment rose to P=128.65 billion as of June 30, 2009, from P=124.77 billion in December 31, 2008 mainly due to the on-going expansion of the facilities of our cellular telecommunications business, additional aircrafts by the airline division, expansion of our branded consumer foods business and continuous construction of the real estate business. Other noncurrent assets increased 6.2% from P=4.08 billion in December 31, 2008 to P=4.34 billion as of June 30, 2009 due to higher security deposits during the period. Accounts payable and accrued expenses increased 7.5% from P=27.31 billion as of year-end 2008 to P=29.36 billion due to higher level of accrued expenses as the Group continues to beef up its marketing and promotional activities in the foods and mobile phone businesses. Short-term debt dropped 10.7% from P=25.14 billion as of December 31, 2008 to P=22.46 billion as of June 30, 2009 due to settlement of loans/trust receipts by the food business upon its issuance of a P=3.0 billion peso bond. Derivative liabilities, including noncurrent portion, dropped by 66.9% to P=978.21 billion as of June 30, 2009 from P=2.96 billion in December 31, 2008 mainly due to settlement of air transportation’s fuel hedges. Income tax payable dropped 49.5% to P=148.08 million as of June 30, 2009 from P=293.0 million as of December 31, 2008 mainly due to lower level of the real estate business’ interim tax payable. Other current liabilities increased 20.5% to P=5.59 billion as of June 30, 2009 from P=4.64 billion as of December 31, 2008 due to higher level of customer deposits of the real estate business and unearned revenue of the airline business. Long-term debt, including current portion, increased by 5.8% from P=76.94 billion as of December 31, 2008 to P=81.34 billion due to recovery of the US dollar, which affected the translated level of the Group’s foreign-denominated obligations. In addition, certain subsidiaries also availed of additional loans to meet their capital expenditure requirements. Other noncurrent liabilities increased by 6.9% to P=16.10 billion as of June 30, 2009 due to higher level of accrued project costs recorded by the telecoms business and accrued maintenance cost by the airline business. Stockholders’ equity grew to P=77.80 billion as of June 30, 2009 from P=72.91 billion at the end of 2008. Minority interest reached P=20.85 billion, bringing our total equity to P=98.67 billion. Book value per share improved from P=10.73 per share as of December 31, 2008 to P=11.45 per share as of June 30, 2009.
8
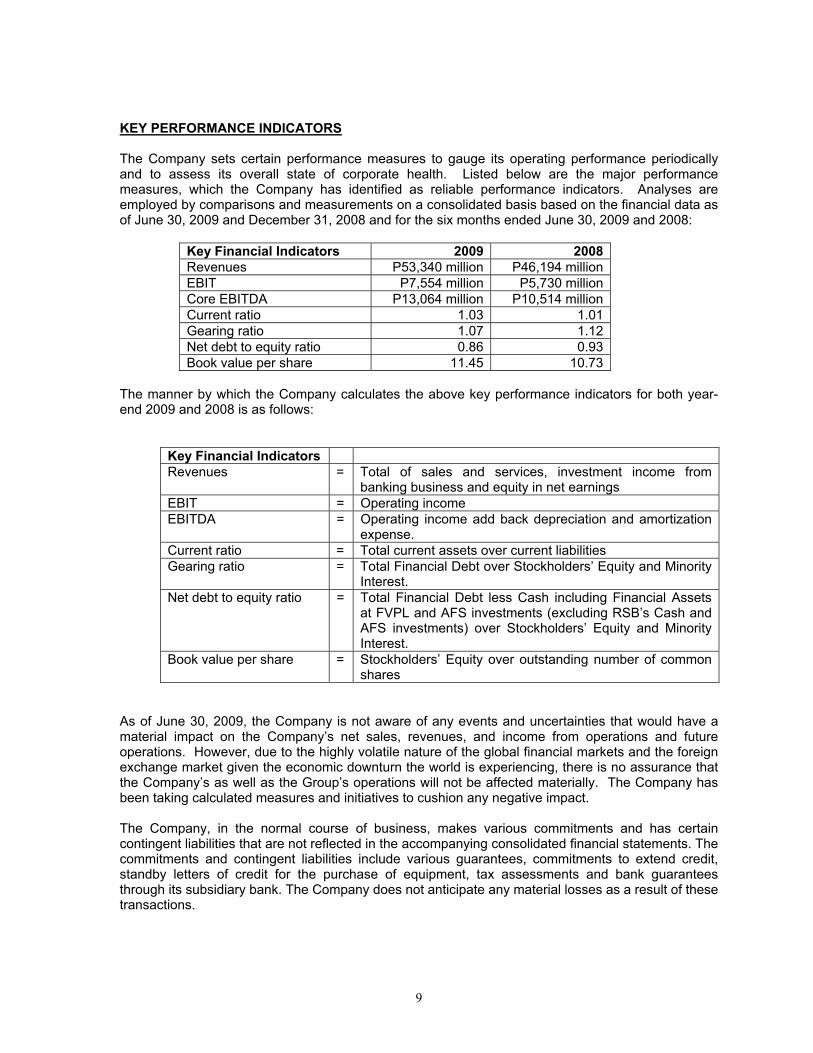
KEY PERFORMANCE INDICATORS The Company sets certain performance measures to gauge its operating performance periodically and to assess its overall state of corporate health. Listed below are the major performance measures, which the Company has identified as reliable performance indicators. Analyses are employed by comparisons and measurements on a consolidated basis based on the financial data as of June 30, 2009 and December 31, 2008 and for the six months ended June 30, 2009 and 2008:
Key Financial Indicators 2009 2008 Revenues P53,340 million P46,194 million EBIT P7,554 million P5,730 million Core EBITDA P13,064 million P10,514 million Current ratio 1.03 1.01 Gearing ratio 1.07 1.12 Net debt to equity ratio 0.86 0.93 Book value per share 11.45 10.73
The manner by which the Company calculates the above key performance indicators for both year-end 2009 and 2008 is as follows:
Key Financial Indicators Revenues = Total of sales and services, investment income from
banking business and equity in net earnings EBIT = Operating income EBITDA = Operating income add back depreciation and amortization
expense. Current ratio = Total current assets over current liabilities Gearing ratio = Total Financial Debt over Stockholders’ Equity and Minority
Interest. Net debt to equity ratio = Total Financial Debt less Cash including Financial Assets
at FVPL and AFS investments (excluding RSB’s Cash and AFS investments) over Stockholders’ Equity and Minority Interest.
Book value per share = Stockholders’ Equity over outstanding number of common shares
As of June 30, 2009, the Company is not aware of any events and uncertainties that would have a material impact on the Company’s net sales, revenues, and income from operations and future operations. However, due to the highly volatile nature of the global financial markets and the foreign exchange market given the economic downturn the world is experiencing, there is no assurance that the Company’s as well as the Group’s operations will not be affected materially. The Company has been taking calculated measures and initiatives to cushion any negative impact. The Company, in the normal course of business, makes various commitments and has certain contingent liabilities that are not reflected in the accompanying consolidated financial statements. The commitments and contingent liabilities include various guarantees, commitments to extend credit, standby letters of credit for the purchase of equipment, tax assessments and bank guarantees through its subsidiary bank. The Company does not anticipate any material losses as a result of these transactions.
9
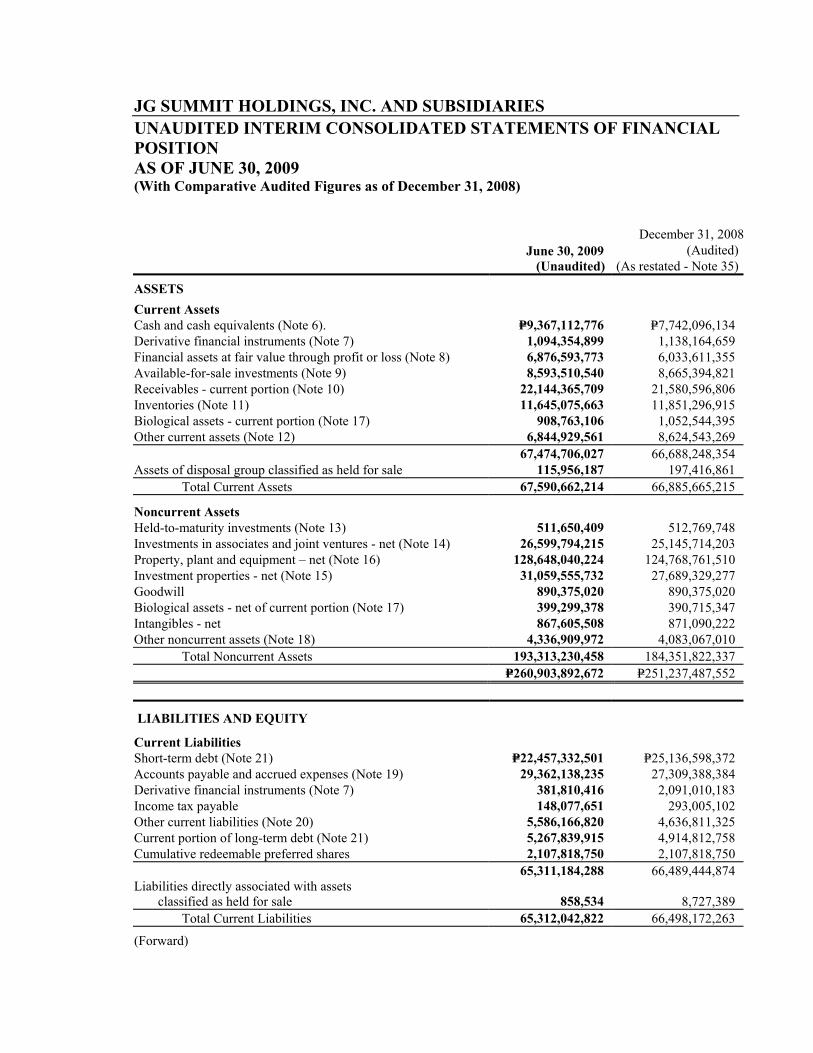
JG SUMMIT HOLDINGS, INC. AND SUBSIDIARIES UNAUDITED INTERIM CONSOLIDATED STATEMENTS OF FINANCIAL POSITION AS OF JUNE 30, 2009 (With Comparative Audited Figures as of December 31, 2008)
June 30, 2009
(Unaudited)
December 31, 2008(Audited)
(As restated - Note 35)
ASSETS Current Assets Cash and cash equivalents (Note 6). P=9,367,112,776 P=7,742,096,134 Derivative financial instruments (Note 7) 1,094,354,899 1,138,164,659 Financial assets at fair value through profit or loss (Note 8) 6,876,593,773 6,033,611,355 Available-for-sale investments (Note 9) 8,593,510,540 8,665,394,821 Receivables - current portion (Note 10) 22,144,365,709 21,580,596,806 Inventories (Note 11) 11,645,075,663 11,851,296,915 Biological assets - current portion (Note 17) 908,763,106 1,052,544,395 Other current assets (Note 12) 6,844,929,561 8,624,543,269 67,474,706,027 66,688,248,354 Assets of disposal group classified as held for sale 115,956,187 197,416,861 Total Current Assets 67,590,662,214 66,885,665,215
Noncurrent Assets Held-to-maturity investments (Note 13) 511,650,409 512,769,748 Investments in associates and joint ventures - net (Note 14) 26,599,794,215 25,145,714,203 Property, plant and equipment – net (Note 16) 128,648,040,224 124,768,761,510 Investment properties - net (Note 15) 31,059,555,732 27,689,329,277 Goodwill 890,375,020 890,375,020 Biological assets - net of current portion (Note 17) 399,299,378 390,715,347 Intangibles - net 867,605,508 871,090,222 Other noncurrent assets (Note 18) 4,336,909,972 4,083,067,010 Total Noncurrent Assets 193,313,230,458 184,351,822,337 P=260,903,892,672 P=251,237,487,552
LIABILITIES AND EQUITY
Current Liabilities Short-term debt (Note 21) P=22,457,332,501 P=25,136,598,372 Accounts payable and accrued expenses (Note 19) 29,362,138,235 27,309,388,384 Derivative financial instruments (Note 7) 381,810,416 2,091,010,183 Income tax payable 148,077,651 293,005,102 Other current liabilities (Note 20) 5,586,166,820 4,636,811,325 Current portion of long-term debt (Note 21) 5,267,839,915 4,914,812,758 Cumulative redeemable preferred shares 2,107,818,750 2,107,818,750 65,311,184,288 66,489,444,874 Liabilities directly associated with assets
classified as held for sale 858,534 8,727,389 Total Current Liabilities 65,312,042,822 66,498,172,263
(Forward)

- 2 -
June 30, 2009
(Unaudited) December 31, 2008
(Audited)
Noncurrent Liabilities Long-term debt - net of current portion (Note 21) P=76,077,454,575 P=72,024,713,333 Deferred income tax liabilities - net 4,762,379,388 4,990,340,268 Other noncurrent liabilities (Note 22) 16,099,462,055 15,062,121,294 Total Noncurrent Liabilities 96,939,296,018 92,077,174,895 Total Liabilities 162,251,338,840 158,575,347,158
Equity Equity attributable to equity holders of the parent: Paid-up capital (Note 23) 12,856,988,094 12,856,988,094 Retained earnings (Note 23) 68,052,996,835 64,646,857,852 Other reserves (2,373,952,680) (3,870,347,260) Treasury shares (Note 23) (721,848,289) (721,848,289) 77,814,183,960 72,911,650,397 Minority interest 20,838,369,872 19,750,489,997 Total Equity 98,652,553,832 92,662,140,394 P=260,903,892,672 P=251,237,487,552 See accompanying Notes to Unaudited Interim Condensed Consolidated Financial Statements.
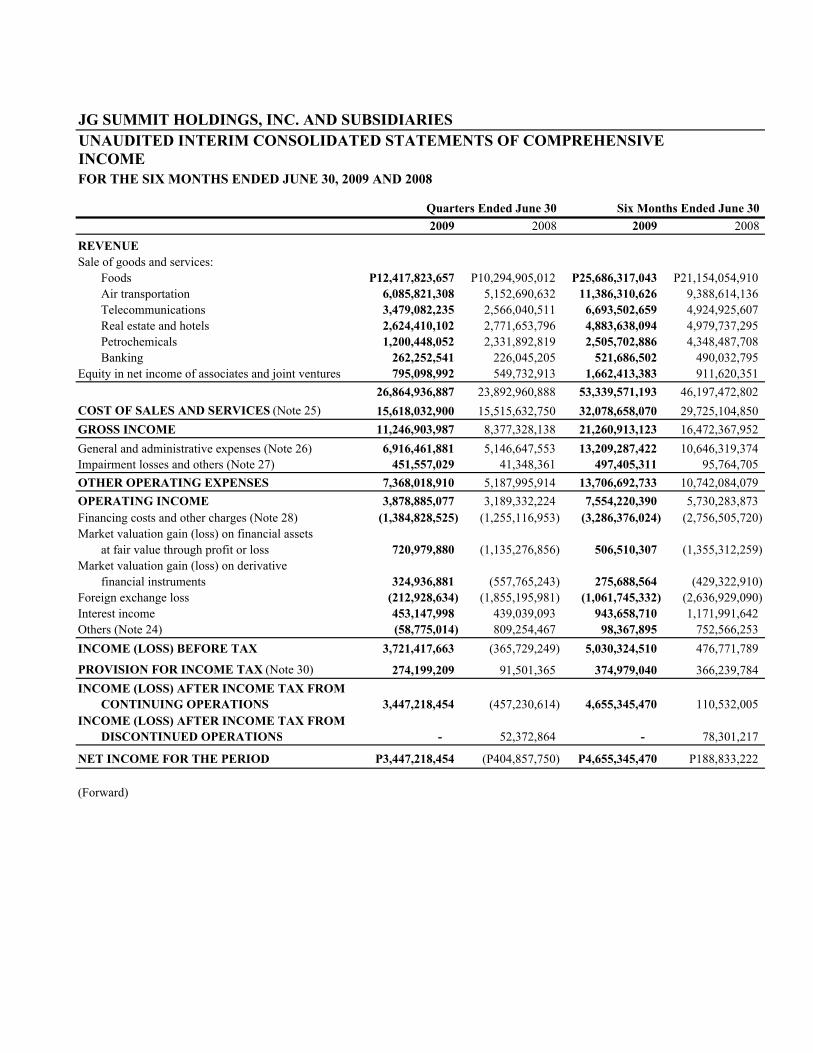
JG SUMMIT HOLDINGS, INC. AND SUBSIDIARIESUNAUDITED INTERIM CONSOLIDATED STATEMENTS OF COMPREHENSIVEINCOMEFOR THE SIX MONTHS ENDED JUNE 30, 2009 AND 2008
Quarters Ended June 30 Six Months Ended June 30 2009 2008 2009 2008
REVENUESale of goods and services:
Foods P12,417,823,657 P10,294,905,012 P25,686,317,043 P21,154,054,910Air transportation 6,085,821,308 5,152,690,632 11,386,310,626 9,388,614,136 Telecommunications 3,479,082,235 2,566,040,511 6,693,502,659 4,924,925,607 Real estate and hotels 2,624,410,102 2,771,653,796 4,883,638,094 4,979,737,295 Petrochemicals 1,200,448,052 2,331,892,819 2,505,702,886 4,348,487,708 Banking 262,252,541 226,045,205 521,686,502 490,032,795
Equity in net income of associates and joint ventures 795,098,992 549,732,913 1,662,413,383 911,620,351 26,864,936,887 23,892,960,888 53,339,571,193 46,197,472,802
COST OF SALES AND SERVICES (Note 25) 15,618,032,900 15,515,632,750 32,078,658,070 29,725,104,850 GROSS INCOME 11,246,903,987 8,377,328,138 21,260,913,123 16,472,367,952 General and administrative expenses (Note 26) 6,916,461,881 5,146,647,553 13,209,287,422 10,646,319,374 Impairment losses and others (Note 27) 451,557,029 41,348,361 497,405,311 95,764,705 OTHER OPERATING EXPENSES 7,368,018,910 5,187,995,914 13,706,692,733 10,742,084,079 OPERATING INCOME 3,878,885,077 3,189,332,224 7,554,220,390 5,730,283,873 Financing costs and other charges (Note 28) (1,384,828,525) (1,255,116,953) (3,286,376,024) (2,756,505,720) Market valuation gain (loss) on financial assets
at fair value through profit or loss 720,979,880 (1,135,276,856) 506,510,307 (1,355,312,259) Market valuation gain (loss) on derivative
financial instruments 324,936,881 (557,765,243) 275,688,564 (429,322,910) Foreign exchange loss (212,928,634) (1,855,195,981) (1,061,745,332) (2,636,929,090) Interest income 453,147,998 439,039,093 943,658,710 1,171,991,642 Others (Note 24) (58,775,014) 809,254,467 98,367,895 752,566,253 INCOME (LOSS) BEFORE TAX 3,721,417,663 (365,729,249) 5,030,324,510 476,771,789
PROVISION FOR INCOME TAX (Note 30) 274,199,209 91,501,365 374,979,040 366,239,784 INCOME (LOSS) AFTER INCOME TAX FROM
CONTINUING OPERATIONS 3,447,218,454 (457,230,614) 4,655,345,470 110,532,005 INCOME (LOSS) AFTER INCOME TAX FROM
DISCONTINUED OPERATIONS - 52,372,864 - 78,301,217
NET INCOME FOR THE PERIOD P3,447,218,454 (P404,857,750) P4,655,345,470 P188,833,222
(Forward)
Quarters Ended June 30 Six Months Ended June 30 2009 2008 2009 2008
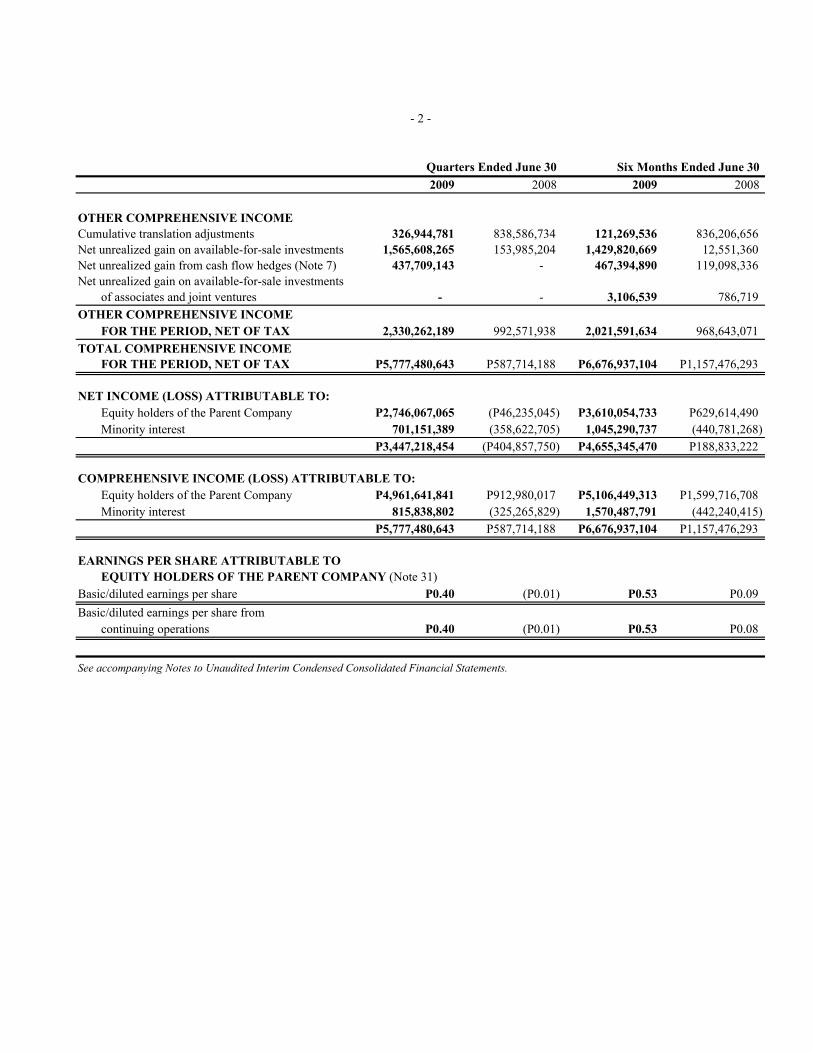
OTHER COMPREHENSIVE INCOMECumulative translation adjustments 326,944,781 838,586,734 121,269,536 836,206,656 Net unrealized gain on available-for-sale investments 1,565,608,265 153,985,204 1,429,820,669 12,551,360 Net unrealized gain from cash flow hedges (Note 7) 437,709,143 - 467,394,890 119,098,336 Net unrealized gain on available-for-sale investments
of associates and joint ventures - - 3,106,539 786,719 OTHER COMPREHENSIVE INCOME
FOR THE PERIOD, NET OF TAX 2,330,262,189 992,571,938 2,021,591,634 968,643,071 TOTAL COMPREHENSIVE INCOME
FOR THE PERIOD, NET OF TAX P5,777,480,643 P587,714,188 P6,676,937,104 P1,157,476,293
NET INCOME (LOSS) ATTRIBUTABLE TO:Equity holders of the Parent Company P2,746,067,065 (P46,235,045) P3,610,054,733 P629,614,490Minority interest 701,151,389 (358,622,705) 1,045,290,737 (440,781,268)
P3,447,218,454 (P404,857,750) P4,655,345,470 P188,833,222
COMPREHENSIVE INCOME (LOSS) ATTRIBUTABLE TO:Equity holders of the Parent Company P4,961,641,841 P912,980,017 P5,106,449,313 P1,599,716,708Minority interest 815,838,802 (325,265,829) 1,570,487,791 (442,240,415)
P5,777,480,643 P587,714,188 P6,676,937,104 P1,157,476,293
EARNINGS PER SHARE ATTRIBUTABLE TO EQUITY HOLDERS OF THE PARENT COMPANY (Note 31)
Basic/diluted earnings per share P0.40 (P0.01) P0.53 P0.09Basic/diluted earnings per share from
continuing operations P0.40 (P0.01) P0.53 P0.08
See accompanying Notes to Unaudited Interim Condensed Consolidated Financial Statements.
- 2 -
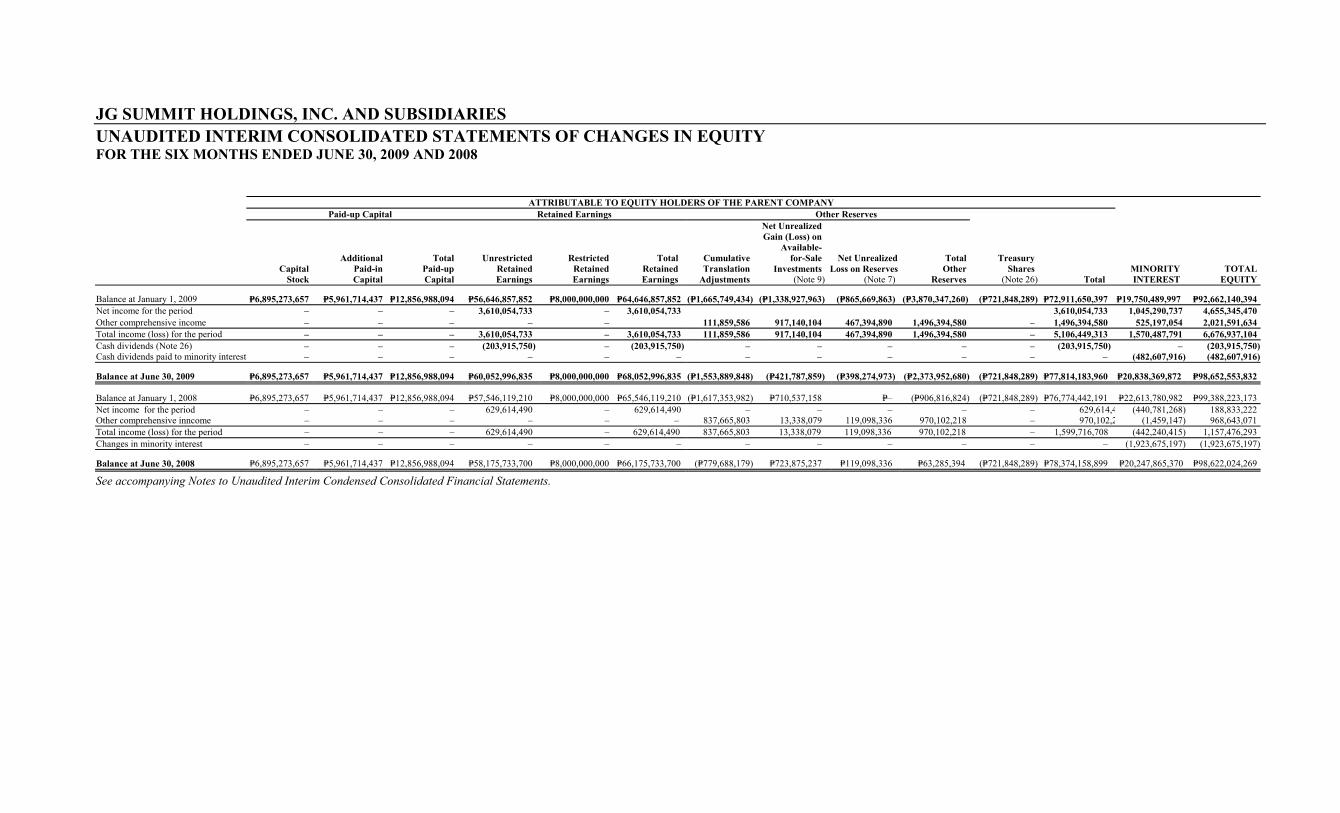
JG SUMMIT HOLDINGS, INC. AND SUBSIDIARIES UNAUDITED INTERIM CONSOLIDATED STATEMENTS OF CHANGES IN EQUITY FOR THE SIX MONTHS ENDED JUNE 30, 2009 AND 2008 ATTRIBUTABLE TO EQUITY HOLDERS OF THE PARENT COMPANY Paid-up Capital Retained Earnings Other Reserves
Capital
Stock
AdditionalPaid-inCapital
TotalPaid-upCapital
UnrestrictedRetainedEarnings
RestrictedRetainedEarnings
TotalRetainedEarnings
CumulativeTranslation
Adjustments
Net UnrealizedGain (Loss) on
Available-for-Sale
Investments (Note 9)
Net UnrealizedLoss on Reserves
(Note 7)
TotalOther
Reserves
Treasury Shares
(Note 26) Total MINORITY INTEREST
TOTAL EQUITY
Balance at January 1, 2009 P=6,895,273,657 P=5,961,714,437 P=12,856,988,094 P=56,646,857,852 P=8,000,000,000 P=64,646,857,852 (P=1,665,749,434) (P=1,338,927,963) (P=865,669,863) (P=3,870,347,260) (P=721,848,289) P=72,911,650,397 P=19,750,489,997 P=92,662,140,394 Net income for the period – – – 3,610,054,733 – 3,610,054,733 3,610,054,733 1,045,290,737 4,655,345,470 Other comprehensive income –
– – – – 111,859,586 917,140,104 467,394,890 1,496,394,580 – 1,496,394,580 525,197,054 2,021,591,634
Total income (loss) for the period – – – 3,610,054,733 – 3,610,054,733 111,859,586 917,140,104 467,394,890 1,496,394,580 – 5,106,449,313 1,570,487,791 6,676,937,104Cash dividends (Note 26) – – – (203,915,750) – (203,915,750) – – – – – (203,915,750) – (203,915,750)Cash dividends paid to minority interest –
– – – – – – – – – – – (482,607,916) (482,607,916)
Balance at June 30, 2009 P=6,895,273,657 P=5,961,714,437 P=12,856,988,094 P=60,052,996,835 P=8,000,000,000 P=68,052,996,835 (P=1,553,889,848) (P=421,787,859) (P=398,274,973) (P=2,373,952,680) (P=721,848,289) P=77,814,183,960 P=20,838,369,872 P=98,652,553,832
Balance at January 1, 2008 P=6,895,273,657 P=5,961,714,437 P=12,856,988,094 P=57,546,119,210 P=8,000,000,000 P=65,546,119,210 (P=1,617,353,982) P=710,537,158 P=– (P=906,816,824) (P=721,848,289) P=76,774,442,191 P=22,613,780,982 P=99,388,223,173 Net income for the period – – – 629,614,490 – 629,614,490 – – – – – 629,614,4 (440,781,268) 188,833,222 Other comprehensive inncome – – – – – – 837,665,803 13,338,079 119,098,336 970,102,218 – 970,102,2 (1,459,147)
968,643,071
Total income (loss) for the period – – – 629,614,490 – 629,614,490 837,665,803 13,338,079 119,098,336 970,102,218 – 1,599,716,708 (442,240,415) 1,157,476,293 Changes in minority interest – – – – – – – – – – – – (1,923,675,197) (1,923,675,197)
Balance at June 30, 2008 P=6,895,273,657 P=5,961,714,437 P=12,856,988,094 P=58,175,733,700 P=8,000,000,000 P=66,175,733,700 (P=779,688,179) P=723,875,237 P=119,098,336 P=63,285,394 (P=721,848,289) P=78,374,158,899 P=20,247,865,370 P=98,622,024,269
See accompanying Notes to Unaudited Interim Condensed Consolidated Financial Statements.
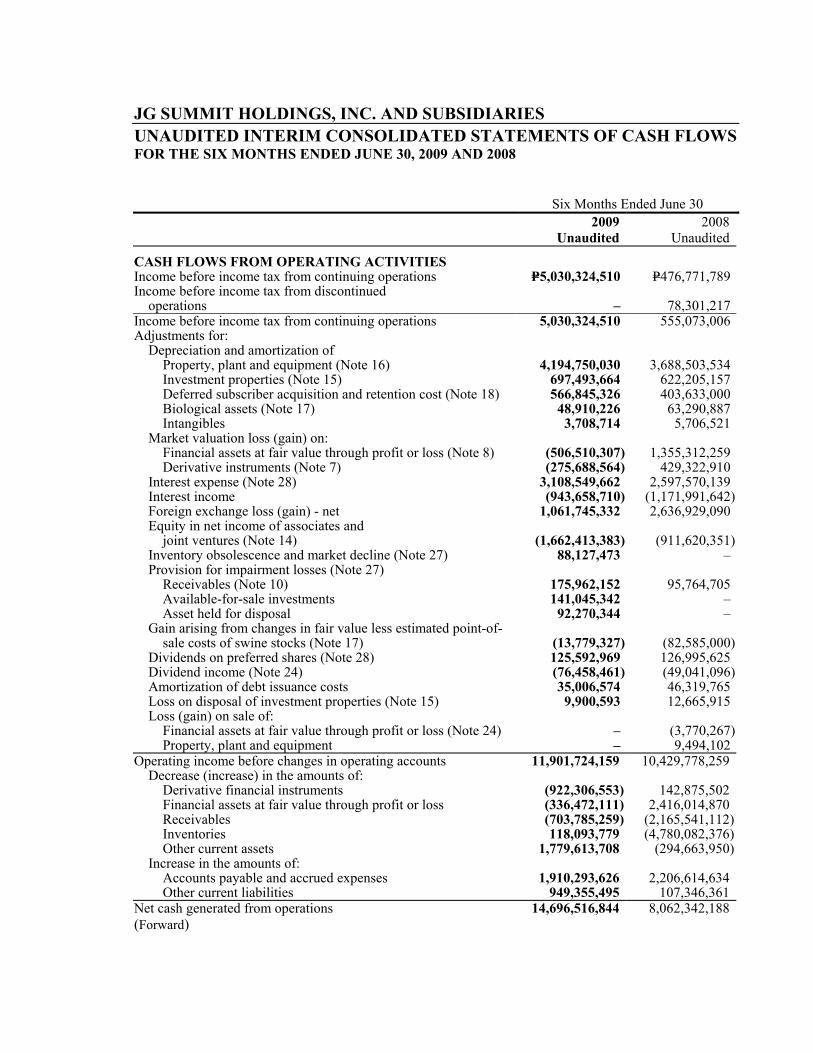
JG SUMMIT HOLDINGS, INC. AND SUBSIDIARIES UNAUDITED INTERIM CONSOLIDATED STATEMENTS OF CASH FLOWS FOR THE SIX MONTHS ENDED JUNE 30, 2009 AND 2008 Six Months Ended June 30
2009
Unaudited 2008
Unaudited
CASH FLOWS FROM OPERATING ACTIVITIES Income before income tax from continuing operations P=5,030,324,510 P=476,771,789Income before income tax from discontinued
operations – 78,301,217 Income before income tax from continuing operations 5,030,324,510 555,073,006Adjustments for: Depreciation and amortization of Property, plant and equipment (Note 16) 4,194,750,030 3,688,503,534 Investment properties (Note 15) 697,493,664 622,205,157 Deferred subscriber acquisition and retention cost (Note 18) 566,845,326 403,633,000 Biological assets (Note 17) 48,910,226 63,290,887 Intangibles 3,708,714 5,706,521 Market valuation loss (gain) on: Financial assets at fair value through profit or loss (Note 8) (506,510,307) 1,355,312,259 Derivative instruments (Note 7) (275,688,564) 429,322,910 Interest expense (Note 28) 3,108,549,662 2,597,570,139 Interest income (943,658,710) (1,171,991,642) Foreign exchange loss (gain) - net 1,061,745,332 2,636,929,090 Equity in net income of associates and
joint ventures (Note 14) (1,662,413,383) (911,620,351) Inventory obsolescence and market decline (Note 27) 88,127,473 – Provision for impairment losses (Note 27) Receivables (Note 10) 175,962,152 95,764,705 Available-for-sale investments 141,045,342 – Asset held for disposal 92,270,344 – Gain arising from changes in fair value less estimated point-of-
sale costs of swine stocks (Note 17) (13,779,327) (82,585,000) Dividends on preferred shares (Note 28) 125,592,969 126,995,625 Dividend income (Note 24) (76,458,461) (49,041,096) Amortization of debt issuance costs 35,006,574 46,319,765 Loss on disposal of investment properties (Note 15) 9,900,593 12,665,915 Loss (gain) on sale of: Financial assets at fair value through profit or loss (Note 24) – (3,770,267) Property, plant and equipment – 9,494,102Operating income before changes in operating accounts 11,901,724,159 10,429,778,259 Decrease (increase) in the amounts of: Derivative financial instruments (922,306,553) 142,875,502 Financial assets at fair value through profit or loss (336,472,111) 2,416,014,870 Receivables (703,785,259) (2,165,541,112) Inventories 118,093,779 (4,780,082,376) Other current assets 1,779,613,708 (294,663,950) Increase in the amounts of: Accounts payable and accrued expenses 1,910,293,626 2,206,614,634 Other current liabilities 949,355,495 107,346,361Net cash generated from operations 14,696,516,844 8,062,342,188(Forward)
- 2 -
Six Months Ended June 30
2009
Unaudited 2008
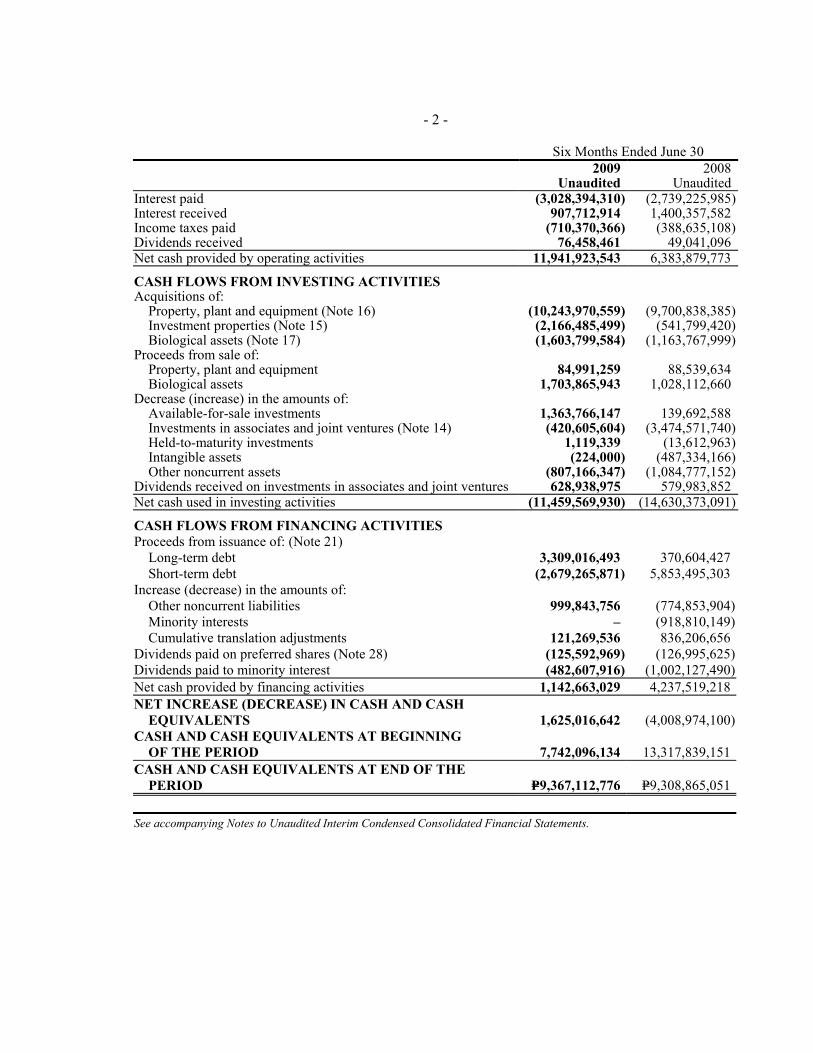
UnauditedInterest paid (3,028,394,310) (2,739,225,985)Interest received 907,712,914 1,400,357,582 Income taxes paid (710,370,366) (388,635,108)Dividends received 76,458,461 49,041,096 Net cash provided by operating activities 11,941,923,543 6,383,879,773
CASH FLOWS FROM INVESTING ACTIVITIES Acquisitions of: Property, plant and equipment (Note 16) (10,243,970,559) (9,700,838,385) Investment properties (Note 15) (2,166,485,499) (541,799,420) Biological assets (Note 17) (1,603,799,584) (1,163,767,999)Proceeds from sale of: Property, plant and equipment 84,991,259 88,539,634 Biological assets 1,703,865,943 1,028,112,660 Decrease (increase) in the amounts of: Available-for-sale investments 1,363,766,147 139,692,588 Investments in associates and joint ventures (Note 14) (420,605,604) (3,474,571,740) Held-to-maturity investments 1,119,339 (13,612,963) Intangible assets (224,000) (487,334,166) Other noncurrent assets (807,166,347) (1,084,777,152)Dividends received on investments in associates and joint ventures 628,938,975 579,983,852 Net cash used in investing activities (11,459,569,930) (14,630,373,091)
CASH FLOWS FROM FINANCING ACTIVITIES Proceeds from issuance of: (Note 21) Long-term debt 3,309,016,493 370,604,427 Short-term debt (2,679,265,871) 5,853,495,303Increase (decrease) in the amounts of: Other noncurrent liabilities 999,843,756 (774,853,904) Minority interests – (918,810,149) Cumulative translation adjustments 121,269,536 836,206,656Dividends paid on preferred shares (Note 28) (125,592,969) (126,995,625)Dividends paid to minority interest (482,607,916) (1,002,127,490)Net cash provided by financing activities 1,142,663,029 4,237,519,218NET INCREASE (DECREASE) IN CASH AND CASH
EQUIVALENTS 1,625,016,642 (4,008,974,100)CASH AND CASH EQUIVALENTS AT BEGINNING
OF THE PERIOD 7,742,096,134 13,317,839,151CASH AND CASH EQUIVALENTS AT END OF THE
PERIOD P=9,367,112,776 P=9,308,865,051 See accompanying Notes to Unaudited Interim Condensed Consolidated Financial Statements.
33 JG SUMMIT HOLDINGS, INC. AND SUBSIDIARIES NOTES TO UNAUDITED INTERIM CONDENSED CONSOLIDATED FINANCIAL STATEMENTS 1. Corporate Information
JG Summit Holdings, Inc. (the Parent Company) is incorporated in the Republic of the Philippines. The registered office address of the Parent Company is 43rd Floor Robinsons-Equitable Tower, ADB Avenue corner Poveda Road, Pasig City.
The Parent Company is the holding company of the JG Summit Group (the Group). The Group has principal business interests in branded consumer foods, agro-industrial and commodity food products, real property development, hotels, banking and financial services, telecommunications, petrochemicals, air transportation and power generation.
The Group conducts business throughout the Philippines, but primarily in and around Metro Manila where it is based. The Group also has branded food businesses in the People’s Republic of China and in the Association of Southeast Asian Nations region, and an interest in a property development business in Singapore.
The principal activities of the Group are further described in Note 3 to the unaudited interim condensed consolidated financial statements.
The interim condensed consolidated financial statements of the Group for the six months ended June 30,
2009 were authorized for issue in accordance with the resolution of the Board of Directors on September 15, 2009.
2. Basis of Preparation and Changes in Accounting Policies
Basis of Preparation The accompanying unaudited interim condensed consolidated financial statements of the Group have been prepared on a historical cost basis, except for financial assets at fair value through profit or loss (FVPL), available-for-sale (AFS) investments and derivative financial instruments that have been measured at fair value, and biological assets and agricultural produce that have been measured at fair value less estimated point-of-sale costs. The unaudited interim condensed consolidated financial statements of the Group are presented in Philippine Peso. The functional and presentation currency of the Parent Company and its subsidiaries (except for certain consolidated foreign subsidiaries) is the Philippine Peso.
4
Statement of Compliance The accompanying unaudited interim condensed consolidated financial statements of the Group have been prepared in compliance with Philippine Accounting Standards (PAS) 34, Interim Financial Reporting. Accordingly, the unaudited interim condensed consolidated financial statements do not include all of the information and disclosures required in the annual financial statements, and should be read in conjunction with the Group’s annual financial statements as of and for the year ended December 31, 2008.
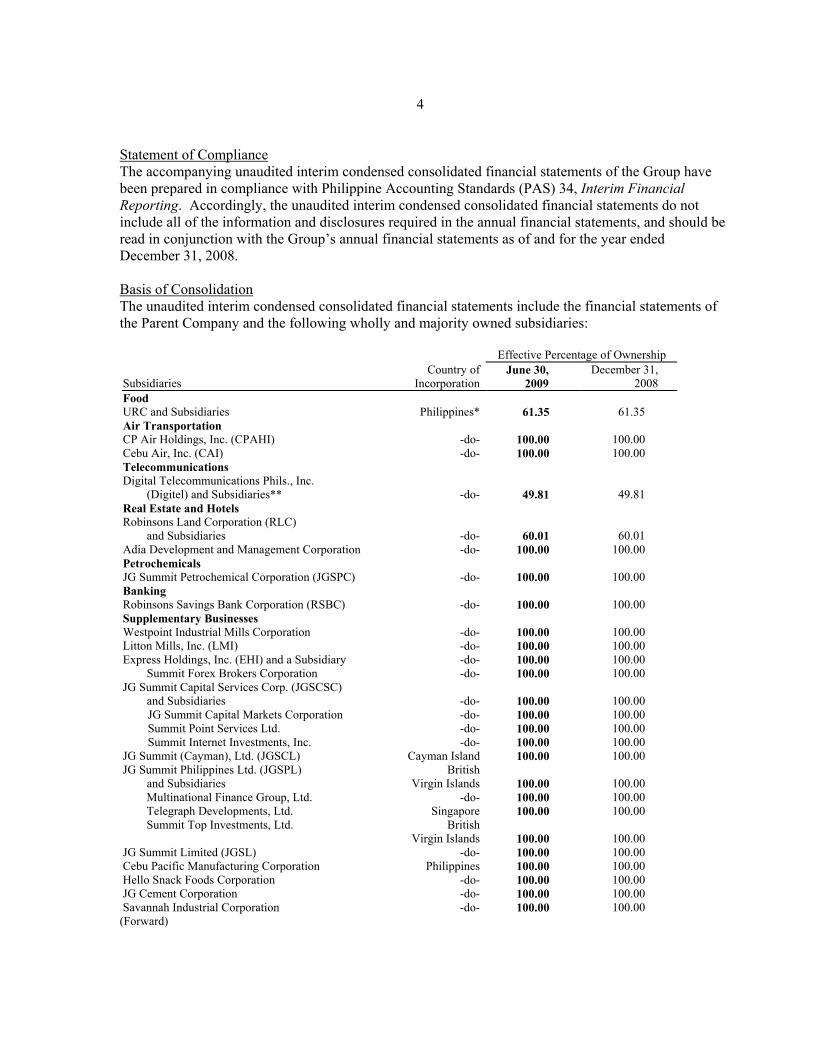
Basis of Consolidation The unaudited interim condensed consolidated financial statements include the financial statements of the Parent Company and the following wholly and majority owned subsidiaries:
Effective Percentage of Ownership
Subsidiaries Country of
IncorporationJune 30,
2009 December 31,
2008 Food URC and Subsidiaries Philippines* 61.35 61.35 Air Transportation CP Air Holdings, Inc. (CPAHI) -do- 100.00 100.00 Cebu Air, Inc. (CAI) -do- 100.00 100.00 Telecommunications Digital Telecommunications Phils., Inc.
(Digitel) and Subsidiaries** -do- 49.81 49.81 Real Estate and Hotels Robinsons Land Corporation (RLC)
and Subsidiaries -do- 60.01 60.01 Adia Development and Management Corporation -do- 100.00 100.00 Petrochemicals JG Summit Petrochemical Corporation (JGSPC) -do- 100.00 100.00 Banking Robinsons Savings Bank Corporation (RSBC) -do- 100.00 100.00 Supplementary Businesses Westpoint Industrial Mills Corporation -do- 100.00 100.00 Litton Mills, Inc. (LMI) -do- 100.00 100.00 Express Holdings, Inc. (EHI) and a Subsidiary -do- 100.00 100.00 Summit Forex Brokers Corporation -do- 100.00 100.00 JG Summit Capital Services Corp. (JGSCSC)
and Subsidiaries -do- 100.00 100.00 JG Summit Capital Markets Corporation -do- 100.00 100.00 Summit Point Services Ltd. -do- 100.00 100.00 Summit Internet Investments, Inc. -do- 100.00 100.00 JG Summit (Cayman), Ltd. (JGSCL) Cayman Island 100.00 100.00 JG Summit Philippines Ltd. (JGSPL)
and Subsidiaries British
Virgin Islands 100.00 100.00 Multinational Finance Group, Ltd. -do- 100.00 100.00 Telegraph Developments, Ltd. Singapore 100.00 100.00 Summit Top Investments, Ltd. British
Virgin Islands 100.00 100.00 JG Summit Limited (JGSL) -do- 100.00 100.00 Cebu Pacific Manufacturing Corporation Philippines 100.00 100.00 Hello Snack Foods Corporation -do- 100.00 100.00 JG Cement Corporation -do- 100.00 100.00 Savannah Industrial Corporation -do- 100.00 100.00
(Forward)

5
Country of Effective Percentage of Ownership
Subsidiaries IncorporationJune 30,
2009 December 31,
2008 Terai Industrial Corporation -do- 100.00 100.00 Unicon Insurance Brokers Corporation -do- 100.00 100.00 Premiere Printing Company, Inc. -do- 100.00 100.00 JG Summit Olefins Corporation -do- 100.00 –
* Certain URC subsidiaries are located in other countries, such as China, Vietnam, Thailand, Malaysia, etc. ** The consolidated financial statements include the accounts of entities over which the Group has the ability to govern the
financial and operating policies to obtain benefits from their activities. The Group’s consolidated financial statements include the accounts of Digital Telecommunications Phils., Inc, and its wholly owned subsidiaries (the Digitel Group). As disclosed above, the Digitel Group is 49.81% -owned company as of June 30, 2009 and December 31, 2008,, respectively.
Standing Interpretations Committee (SIC) 12, Consolidation - Special Purpose Entities, prescribes guidance on the consolidation of special purpose entities (SPE). Under SIC 12, an SPE should be consolidated when the substance of the relationship between a certain company and the SPE indicates that the SPE is controlled by the company. Control over an entity may exist even in cases where an enterprise owns little or none of the SPE’s equity, such as when an entity retains majority of the residual risks related to the SPE or its assets in order to obtain benefits from its activities. In accordance with SIC 12, the Group’s unaudited interim condensed consolidated financial statements include the accounts of SPEs namely: Surigao Leasing Limited (SLL), Cebu Aircraft Leasing Limited (CALL), IBON Leasing Limited (ILL) and Boracay Leasing Limited (BLL). SLL, CALL, ILL and BLL are SPE’s in which the Group does not have equity interest. SLL, CALL, ILL and BLL acquired the passenger aircraft for lease to CAI under finance lease arrangement and funded the acquisitions through long-term debt.
The unaudited interim condensed consolidated financial statements are prepared using uniform accounting policies for like transactions and other events in similar circumstances. All significant intercompany transactions and balances, including intercompany profits and unrealized profits and losses, are eliminated in the consolidation.
Subsidiaries are fully consolidated from the date of acquisition, being the date on which the Parent Company obtains control. Control is achieved where the Parent Company has the power to govern the financial and operating policies of the entity so as to obtain benefits from its activities. Subsidiaries under de facto control are also fully consolidated. Consolidation of subsidiaries ceases when control is transferred out of the Parent Company.
Under PAS 27, Consolidated and Separate Financial Statements, it is acceptable to use, for consolidation purposes, the financial statements of subsidiaries for fiscal periods differing from that of the Parent Company if the difference is not more than three months.

6
Below are the subsidiaries with a different fiscal year from that of the Parent Company:
Subsidiaries Fiscal YearFood URC and Subsidiaries September 30Real Estate and Hotels RLC and Subsidiaries -do-Petrochemicals JGSPC -do-Textiles Westpoint Industrial Mills Corporation -do-LMI -do-Supplementary Businesses Cebu Pacific Manufacturing Corporation -do-Hello Snack Foods Corporation -do-JG Cement Corporation -do-Savannah Industrial Corporation -do-Unicon Insurance Brokers Corporation -do-
Any significant transactions or events that occur between the date of the subsidiaries’ financial statements and the date of the Parent Company’s financial statements are adjusted in the unaudited interim condensed consolidated financial statements.
Acquisitions of subsidiaries are accounted for using the purchase method. The cost of an acquisition is measured as the fair value of the assets given, equity instruments issued and liabilities incurred or assumed at the date of exchange, plus costs directly attributable to the acquisition. Identifiable assets acquired and liabilities and contingent liabilities assumed in a business combination are measured initially at their fair value at the acquisition date, irrespective of the extent of any minority interest. Any excess of the cost of the business combination over the Group’s interest in the net fair value of the identifiable assets, liabilities and contingent liabilities represents goodwill. Any excess of the Group’s interest in the net fair value of the identifiable assets, liabilities and contingent liabilities over the cost of business combination is recognized in the unaudited interim condensed consolidated statement of income on the date of acquisition.
Minority Interests Minority interests represent the portion of income or loss and net assets not held by the Group and are presented separately in the unaudited interim consolidated statement of income and within equity in the unaudited interim consolidated statement of financial position, separately from the Group’s equity attributable to the equity holders of the Parent Company. Acquisitions of minority interests are accounted for using the parent entity extension method, whereby, the difference between the consideration and the book value of the share of the net assets acquired is recognized as goodwill.
7
Changes in Accounting Policies Adopted in the Preparation of the Unaudited Interim Condensed Financial Statements The accounting policies adopted are consistent with those followed in the preparation of the Group’s annual financial statements for the year ended December 31, 2008 except for the adoption of the new and amended Standards and Interpretations as of January 1, 2009 noted below:
• Amendments to PFRS 7, Financial Instruments - Disclosures
The amended Standard requires additional disclosure about fair value measurement and liquidity risk. The amendment to this Standard has no significant impact on the unaudited interim condensed financial statements of the Group except for additional disclosures presented in Notes 4 and 5 in the notes to unaudited interim condensed financial statements.
• PFRS 8, Operating Segments
This Standard adopts a full management approach to identifying, measuring and disclosing the results of an entity’s operating segments. The information reported would be that which management uses internally for evaluating the performance of operating segments and allocating resources to those segments. The Group determined that the operating segments were the same as the business segments previously identified under PAS 14, Segment Reporting. Additional disclosures about each of these segments are shown in Note 3, including revised comparative information. Except for the additional disclosures, adoption of this Standard did not have any effect on the financial position or performance of the Group.
• Amendment to PAS 1, Amendment on Statement of Comprehensive Income
In accordance with the amendment to PAS 1, the statement of changes in equity shall include only transactions with owners, while all non-owner changes will be presented in equity as a single line with details included in a separate statement. Owners are defined as the holders of instruments classified as equity.
In addition, the amendment to PAS 1 provides for the introduction of a new statement of comprehensive income that combines all items of income and expense recognized in the statement of income together with ‘other comprehensive income’. The revisions specify what is included in other comprehensive income, such as gains and losses on AFS assets, actuarial gains and losses on defined benefit pension plans and changes in the asset revaluation reserve. Entities can choose to present all items in one statement, or to present two linked statements, a separate statement of income and a statement of comprehensive income. The Group has elected to present single statement of comprehensive income.
• Amendment to PAS 23, Borrowing Costs
This Standard has been revised to require capitalization of borrowing costs when such costs relate to a qualifying asset. A qualifying asset is an asset that necessarily takes a substantial period of time to get ready for its intended use or sale. The amendment to this Standard has no significant impact on the unaudited interim condensed financial statements of the Group since the group currently capitalizes borrowing cost that are related to qualifying assets.

8
•
Improvements to PFRS In May 2008, the International Accounting Standards Board (IASB) issued its first omnibus of amendments to certain standards, primarily with a view of removing inconsistencies and clarifying wording. Below are the separate transitional provisions for each standard which are applicable to the Group. The adoption of the following amendments resulted in changes to accounting policies but did not have any impact on the financial position or performance of the Group.
PAS 1, Presentation of Financial Statements • Assets and liabilities classified as held for trading are not automatically classified as current in the
statement of financial position. The Group amended its accounting policy accordingly and analyzed whether management’s expectation of the period of realization of financial assets and liabilities differs from classification of the instruments. This does not result on any re-classification of financials instruments between current and noncurrent classification in the statement of financial position.
PAS 16, Property, Plant and Equipment • The amendment replaces the term ‘net selling price’ with ‘fair value less costs to sell’, to be
consistent with PFRS 5, Non-current Assets Held for Sale and Discontinued Operations and PAS 36, Impairment of Assets. The Group amended its accounting policy accordingly which did not result in any changes in the financial position.
PAS 23, Borrowing Costs
The definition of borrowing costs is revised to consolidate the types of items that are considered components of ‘borrowing costs’, i.e., components of the interest expense calculated using the effective interest method in accordance with PAS 39. The Group has amended its accounting policy accordingly which did not result in any change in its financial position.
PAS 40, Investment Property • The Standard has been revised to include property that is being constructed or developed for future
use as an investment property. The Group amended its accounting policy accordingly which did not result in any changes in the financial position.
The amendments to the following standards did not have any impact on the accounting policies, financial position or performance of the Group: • PFRS 1, First-time Adoption of PFRS – Cost of an Investment in a Subsidiary, Jointly Controlled
Entity or Associate • PFRS 2, Share-based Payment - Vesting Condition and Cancellations • PFRS 5, Noncurrent Assets Held for Sale and Discontinued Operations • PAS 19, Employee Benefits • PAS 28, Investment in Associates • PAS 31, Interest in Joint Ventures • PAS 36, Impairment of Assets • PAS 38, Intangible Assets • PAS 39, Financial Instruments: Recognition and Measurement • PAS 41, Agriculture
9
• Amendments to PAS 27, Consolidated and Separate Financial Statements - Cost of an Investment in a Subsidiary, Jointly Controlled Entity or Associate
• Amendment to PAS 32, Financial Instruments: Presentation, and PAS 1, Presentation of Financial Statements - Puttable Financial Instruments and Obligations Arising on Liquidation
• Philippine Interpretation IFRIC 9, Reassessment of Embedded Derivatives and IAS 39, Financial Instruments: Recognition and Measurement
• Philippine Interpretation IFRIC 13, Customer Loyalty Programmes • Philippine Interpretation IFRIC 16, Hedges of a Net Investment in a Foreign Operation
3. Segment Information
Business Segments The Group’s operating businesses are organized and managed separately according to the nature of the products and services provided, with each segment representing a strategic business unit that offers different products and serves different markets.
The industry segments where the Group operates are as follows:
• Food, agro-industrial and commodities businesses - manufacturing of snack foods, granulated coffee
and pre-mixed coffee, chocolates, candies, biscuits, instant noodles, ice cream and frozen novelties, pasta and tomato-based products and canned beans; raising of hog, chicken and manufacturing and distribution of animal feeds, corn products and vegetable oil and the synthesis of veterinary compound; and sugar milling and refining and flour milling.
• Air transportation - air transport services, both domestic and international.
• Telecommunications - service provider of voice and data telecommunications services which include
international gateway facilities, a local exchange network and traditional business services (fax, telex, leased lines and other value-added network products, value-added network provider using electronics data interchange).
• Real estate and hotels - ownership, development, leasing and management of shopping malls and
retail developments; ownership and operation of prime hotels in major Philippine cities; development, sale and leasing of office condominium space in office buildings and mixed use developments including high rise residential condominiums; and development of land into residential subdivisions and sale of subdivision lots and residential houses and the provision of customer financing for sales.
• Petrochemicals - manufacturer of polyethylene (PE) and polypropylene (PP), and other industrial
chemicals.
• Banking - thrift banking operations.
• Other supplementary businesses - printing services, textile, insurance brokering, foreign exchange and securities dealing.

10
Management monitors the operating results of its business units separately for the purpose of making decisions about resource allocation and performance assessment. Segment performance is evaluated based on operating profit or loss which in certain respects is measured differently from operating profit or loss in the consolidated financial statements. Group financing (including finance costs and revenue) and income taxes are managed on a group basis and are not allocated to operating segments.

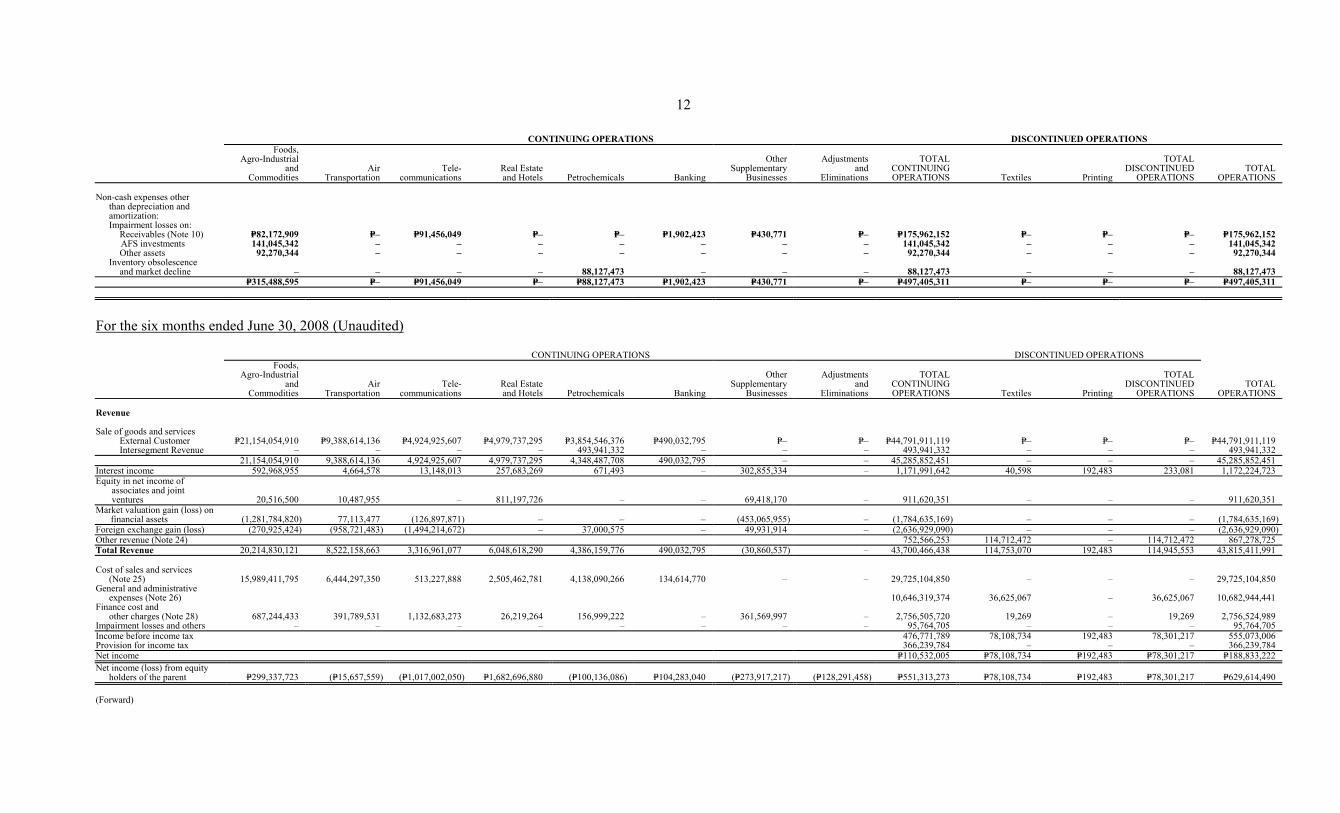
11 The Group’s business segment information follows: For the six months ended June 30, 2009 (Unaudited)
CONTINUING OPERATIONS DISCONTINUED OPERATIONS
Foods, Agro-Industrial
and Commodities
AirTransportation
Tele-communications
Real Estateand Hotels Petrochemicals Banking
OtherSupplementary
Businesses
Adjustmentsand
Eliminations
TOTALCONTINUINGOPERATIONS Textiles Printing
TOTAL DISCONTINUED
OPERATIONS TOTAL
OPERATIONS Revenue
Sale of goods and services External Customer P=25,686,317,043 P=11,386,310,626
P=6,693,502,659
P=4,883,638,094
P=2,112,481,484 P=521,686,502
P=– P=– P=51,283,936,408 P=– P=– P=– P=51,283,936,408
Intersegment Revenue – – – – 393,221,402 – – – 393,221,402 – – – 393,221,402 25,686,317,043 11,386,310,626 6,693,502,659 4,883,638,094 2,505,702,886 521,686,502 – – 51,677,157,810 – – – 51,677,157,810Interest income 559,696,903 5,650,756 23,190,851 197,586,395 338,078 – 157,195,727 – 943,658,710 – – – 943,658,710Equity in net income of associates and joint ventures 18,705,500 (6,368,445) – 1,552,607,087 – – 97,469,241 – 1,662,413,383 – – – 1,662,413,383Market valuation gain (loss) on
financial assets 279,528,757 556,019,430 (18,322,937)
–
–
– (35,026,379) – 782,198,871 – – – 782,198,871Foreign exchange loss (97,372,263) (221,995,194) (307,431,517) – (104,727,725) – (330,218,633) – (1,061,745,332) – – – (1,061,745,332)Other revenue (Note 24) 98,367,895 – – – 98,367,895Total Revenue 26,446,875,940 – – 11,719,617,173 6,390,939,056 6,633,831,576 2,401,313,239 521,686,502 (110,580,044) – 54,102,051,337 – 54,102,051,337 Cost of sales and services (Note 25) 19,736,248,748
6,573,567,018 750,060,213 2,280,757,109
2,599,587,302 138,437,680 – – 32,078,658,070 – – – 32,078,658,070General and administrative expenses (Note 26) –
–
–
–
–
–
–
– 13,209,287,422 – – – 13,209,287,422
Finance cost and other charges (Note 28) 664,652,841 372,854,384
1,006,524,073
29,629,999 221,382,389
– 991,332,338
– 3,286,376,024 – – – 3,286,376,024Impairment losses and others – – – – – – – – 497,405,311 – – – 497,405,311Income before income tax 5,030,324,510 – – – 5,030,324,510Provision for income tax
374,979,040 – – – 374,979,040
Net income P=4,655,345,470 P=– P=– P=– P=4,655,345,470 Net income (loss) from equity holders of the parent P=135,549,087 P=1,987,916,255 (P=317,752,821) P=2,521,082,331 (P=670,794,406) P=92,661,107 (P=1,738,471,477) P=1,599,864,657 P=3,610,054,733 P=– P=– P=– P=3,610,054,733 Other Information
Segment assets P=59,311,534,290 P=34,981,924,962
P=79,324,556,992
P=41,541,013,222
P=5,265,893,423
P=12,460,256,635
P=147,599,096,575
(P=119,580,383,427)
P=260,903,892,672
P=– P=– P=– P=260,903,892,672
Investments in associates (Note 14) P=81,762,231
P=402,678,557
P=– P=24,972,385,408
P=– P=– P=1,142,968,019
P=– P=26,599,794,215
P=– P=– P=– P=26,599,794,215
Segment liabilities P=27,102,580,125
P=31,508,898,054
P=78,873,241,347
P=16,938,671,190
P=7,334,582,494
P=10,580,907,379
P=78,994,379,898
(P=89,081,921,647)
P=162,251,338,840
P=– P=– P=– P=162,251,338,840
Capital expenditures (Note 16) P=2,449,641,422
P=2,808,473,978
P=4,782,742,000
P=2,309,257,034
P=50,259,012
P=8,518,663
P=1,563,949
P=– P=12,410,456,058
P=– P=– P=– P=12,410,456,058
Depreciation and amortization (Notes 16, 25, and 26)
P=1,508,067,634
P=942,717,122
P=2,137,164,325
P=814,128,906
P=62,395,406
P=30,140,677
P=15,710,072
P=– P=5,510,324,142
P=– P=– P=– P=5,510,324,142 (Forward)
12
CONTINUING OPERATIONS DISCONTINUED OPERATIONS
Foods, Agro-Industrial
and Commodities
AirTransportation
Tele-communications
Real Estateand Hotels Petrochemicals Banking
OtherSupplementary
Businesses
Adjustmentsand
Eliminations
TOTALCONTINUINGOPERATIONS Textiles Printing
TOTAL DISCONTINUED
OPERATIONS TOTAL
OPERATIONS Non-cash expenses other than depreciation and amortization: Impairment losses on:
Receivables (Note 10) P=82,172,909 P=– P=91,456,049
P=– P=– P=1,902,423
P=430,771 P=– P=175,962,152 P=– P=– P=– P=175,962,152 AFS investments 141,045,342 – – – – – – – 141,045,342
– – – 141,045,342
Other assets 92,270,344 – – – – – – – 92,270,344 – – – 92,270,344 Inventory obsolescence and market decline – – – – 88,127,473 – – – 88,127,473 – – – 88,127,473 P=315,488,595 P=– P=91,456,049 P=– P=88,127,473 P=1,902,423 P=430,771 P=– P=497,405,311 P=– P=– P=– P=497,405,311
For the six months ended June 30, 2008 (Unaudited) CONTINUING OPERATIONS DISCONTINUED OPERATIONS
Foods, Agro-Industrial
and Commodities
AirTransportation
Tele-communications
Real Estateand Hotels Petrochemicals Banking
OtherSupplementary
Businesses
Adjustmentsand
Eliminations
TOTALCONTINUINGOPERATIONS Textiles Printing
TOTAL DISCONTINUED
OPERATIONS TOTAL
OPERATIONS Revenue
Sale of goods and services External Customer P=21,154,054,910
P=9,388,614,136
P=4,924,925,607
P=4,979,737,295
P=3,854,546,376 P=490,032,795
P=– P=– P=44,791,911,119 P=– P=– P=– P=44,791,911,119
Intersegment Revenue
– – – – 493,941,332 – – – 493,941,332 – – – 493,941,33221,154,054,910 9,388,614,136 4,924,925,607 4,979,737,295 4,348,487,708 490,032,795 – – 45,285,852,451 – – – 45,285,852,451
Interest income 592,968,955 4,664,578 13,148,013 257,683,269 671,493 – 302,855,334 – 1,171,991,642 40,598 192,483 233,081 1,172,224,723 Equity in net income of associates and joint ventures 20,516,500 10,487,955 – 811,197,726 – – 69,418,170 – 911,620,351 – – – 911,620,351Market valuation gain (loss) on
financial assets (1,281,784,820) 77,113,477 (126,897,871) – –
– (453,065,955) – (1,784,635,169) – – – (1,784,635,169)Foreign exchange gain (loss) (270,925,424) (958,721,483) (1,494,214,672) – 37,000,575 – 49,931,914 – (2,636,929,090) – – – (2,636,929,090) Other revenue (Note 24) 752,566,253 114,712,472 – 114,712,472 867,278,725Total Revenue 20,214,830,121 8,522,158,663 3,316,961,077 6,048,618,290 4,386,159,776 490,032,795 (30,860,537) – 43,700,466,438 114,753,070 192,483 114,945,553 43,815,411,991 Cost of sales and services (Note 25) 15,989,411,795 6,444,297,350 513,227,888 2,505,462,781 4,138,090,266 134,614,770
– – 29,725,104,850 – – – 29,725,104,850 General and administrative expenses (Note 26) 10,646,319,374 36,625,067 – 36,625,067 10,682,944,441Finance cost and other charges (Note 28) 687,244,433
391,789,531
1,132,683,273
26,219,264 156,999,222
– 361,569,997
– 2,756,505,720
19,269 – 19,269 2,756,524,989
Impairment losses and others – – – – – – – – 95,764,705 – – – 95,764,705Income before income tax 476,771,789 78,108,734 192,483 78,301,217 555,073,006Provision for income tax
et income
366,239,784 – – – 366,239,784
N P=110,532,005 P=78,108,734 P=192,483 P=78,301,217 P=188,833,222 Net income (loss) from equity holders of the parent P=299,337,723 (P=15,657,559) (P=1,017,002,050) P=1,682,696,880 (P=100,136,086) P=104,283,040 (P=273,917,217) (P=128,291,458) P=551,313,273 P=78,108,734 P=192,483 P=78,301,217 P=629,614,490 (Forward)

13
CONTINUING OPERATIONS DISCONTINUED OPERATIONS
Foods, Agro-Industrial
and Commodities
AirTransportation
Tele-communications
Real Estateand Hotels Petrochemicals Banking
OtherSupplementary
Businesses
Adjustmentsand
Eliminations
TOTALCONTINUINGOPERATIONS Textiles Printing
TOTAL DISCONTINUED
OPERATIONS TOTAL
OPERATIONS Other Information
Segment assets
P=57,799,895,000 P=27,274,309,081
P=67,878,493,062
P=37,198,607,370
P=6,603,746,255
P=11,763,581,851
P=146,672,664,780
(P=117,001,656,752)
P=238,189,640,647
P=501,933,127
P=5,677,437
P=507,610,564
P=238,697,251,211
Investments in associates (Note 14)
P=110,389,075
P=101,467,451
P=– P=21,753,287,776
P=– P=– P=974,627,250
P=– P=22,939,771,552
P=– P=– P=– P=22,939,771,552
Segment liabilities
P=22,866,984,000
P=22,544,965,351
P=66,853,069,975
P=14,450,146,650
P=7,427,974,160
P=10,124,285,617
P=78,388,760,096
(P=82,610,959,337)
P=140,045,226,512
P=29,574,229
P=426,201 P=30,000,430
P=140,075,226,942
Capital expenditures (Note 16)
P=2,234,133,000
P=2,440,740,560
P=4,404,101,000
P=1,093,447,226
P=52,181,772
P=16,960,524
P=1,073,723
P=– P=10,242,637,805
P=– P=– P=– P=10,242,637,805
Depreciation and amortization (Notes 16, 25, and 26)
P=1,281,396,977
P=722,113,729
P=1,949,123,155
P=730,938,785
P=55,037,563
P=27,879,670
P=11,379,502
P=– P=4,777,869,381
P=5,469,718
P=– P=5,469,718
P=4,783,339,099
Non-cash expenses other than depreciation and amortization:
losses on:
Impairment Receivables (Note 10) P=– P=– P=93,336,754 P=– P=– P=2,427,951 P=– P=– P=95,764,705 P=– P=– P=– P=95,764,705
14
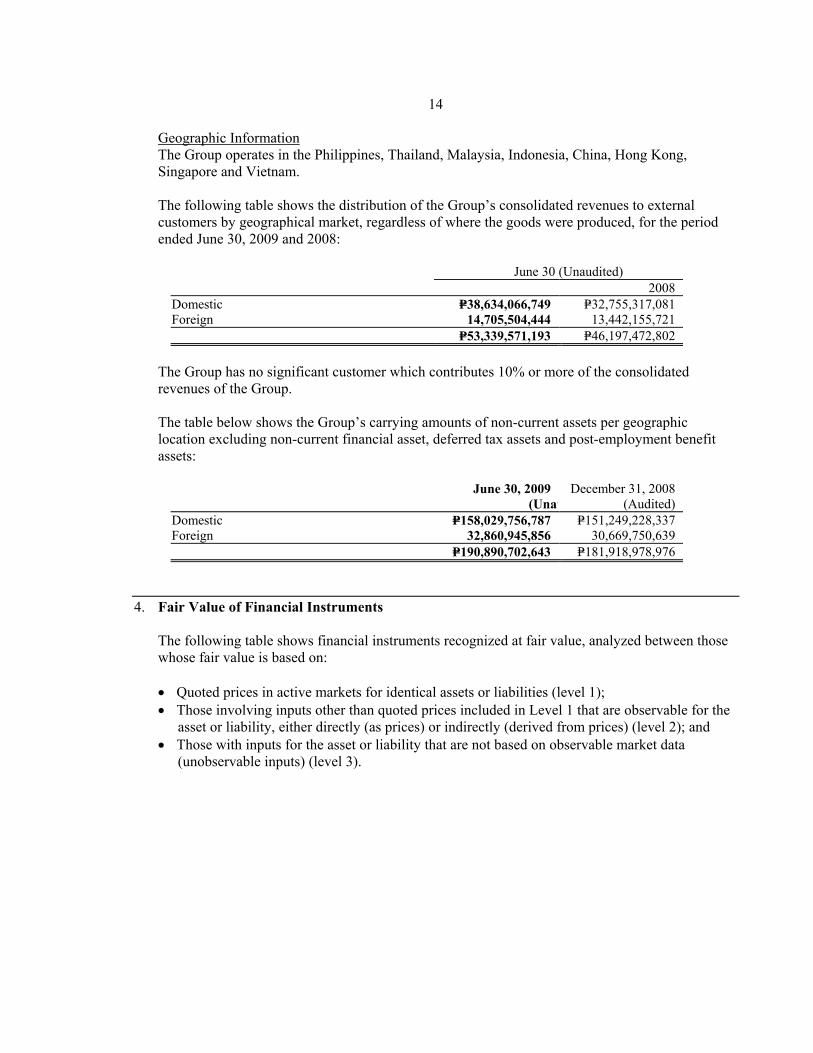
Geographic Information The Group operates in the Philippines, Thailand, Malaysia, Indonesia, China, Hong Kong, Singapore and Vietnam.
The following table shows the distribution of the Group’s consolidated revenues to external customers by geographical market, regardless of where the goods were produced, for the period ended June 30, 2009 and 2008:
June 30 (Unaudited) 2008 Domestic P=38,634,066,749 P=32,755,317,081 Foreign 14,705,504,444 13,442,155,721 P=53,339,571,193 P=46,197,472,802
The Group has no significant customer which contributes 10% or more of the consolidated revenues of the Group.
The table below shows the Group’s carrying amounts of non-current assets per geographic location excluding non-current financial asset, deferred tax assets and post-employment benefit assets:
June 30, 2009 December 31, 2008 (Unau (Audited) Domestic P=158,029,756,787 P=151,249,228,337 Foreign 32,860,945,856 30,669,750,639 P=190,890,702,643 P=181,918,978,976
4. Fair Value of Financial Instruments
The following table shows financial instruments recognized at fair value, analyzed between those whose fair value is based on: • Quoted prices in active markets for identical assets or liabilities (level 1); • Those involving inputs other than quoted prices included in Level 1 that are observable for the
asset or liability, either directly (as prices) or indirectly (derived from prices) (level 2); and • Those with inputs for the asset or liability that are not based on observable market data
(unobservable inputs) (level 3).
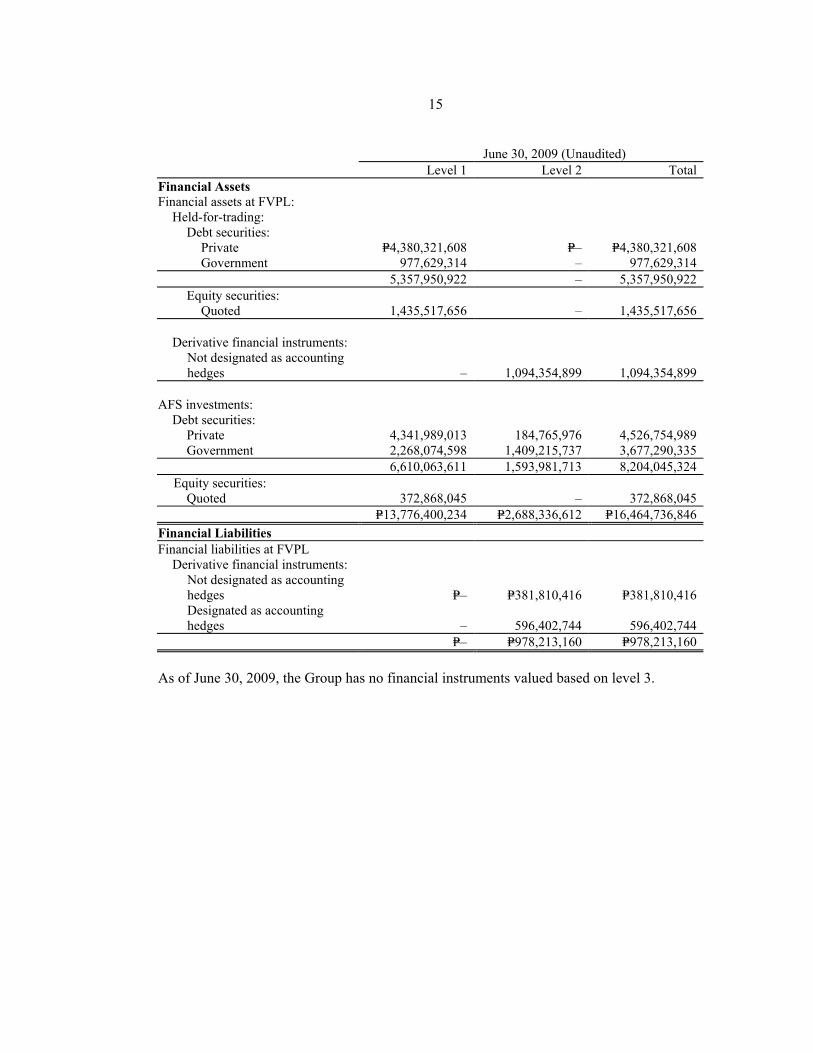
15
June 30, 2009 (Unaudited) Level 1 Level 2 Total Financial Assets Financial assets at FVPL: Held-for-trading: Debt securities: Private P=4,380,321,608 P=– P=4,380,321,608 Government 977,629,314 – 977,629,314
5,357,950,922 – 5,357,950,922 Equity securities: Quoted 1,435,517,656 – 1,435,517,656 Derivative financial instruments: Not designated as accounting
hedges – 1,094,354,899 1,094,354,899 AFS investments:
Debt securities: Private 4,341,989,013 184,765,976 4,526,754,989 Government 2,268,074,598 1,409,215,737 3,677,290,335
6,610,063,611 1,593,981,713 8,204,045,324 Equity securities:
Quoted 372,868,045 – 372,868,045 P=13,776,400,234 P=2,688,336,612 P=16,464,736,846 Financial Liabilities Financial liabilities at FVPL Derivative financial instruments: Not designated as accounting
hedges P=– P=381,810,416 P=381,810,416 Designated as accounting
hedges – 596,402,744 596,402,744 P=– P=978,213,160 P=978,213,160 As of June 30, 2009, the Group has no financial instruments valued based on level 3.
16
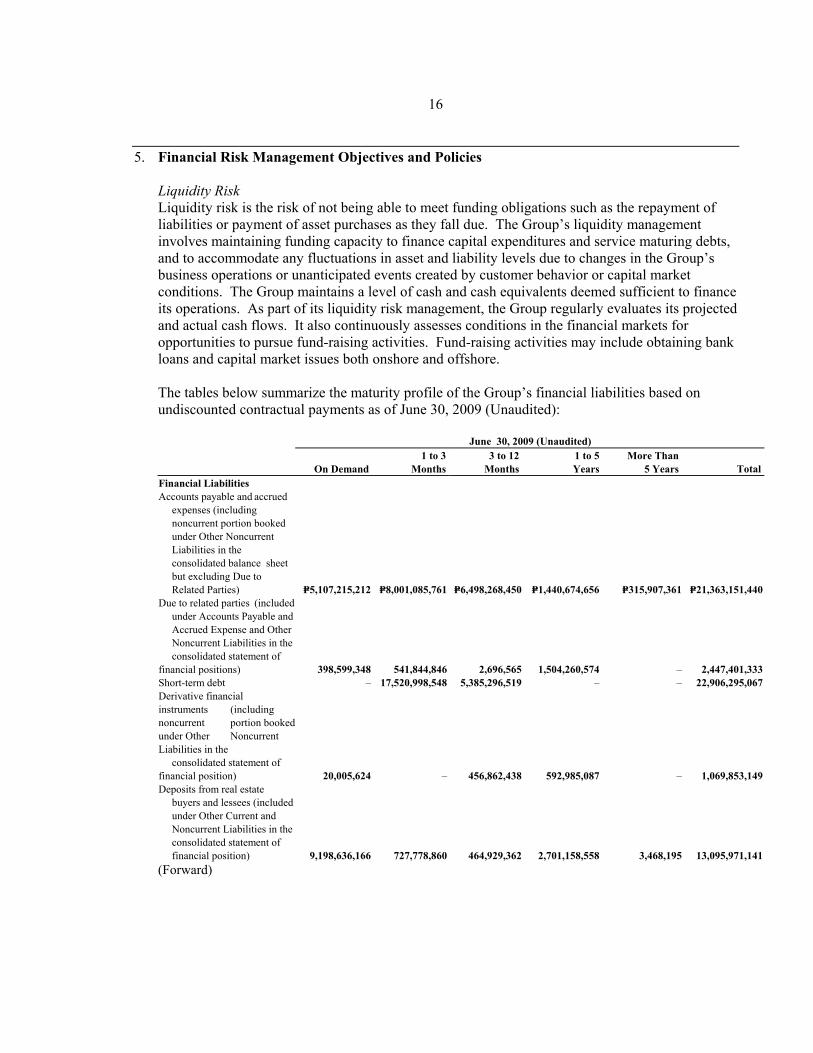
5. Financial Risk Management Objectives and Policies
Liquidity Risk Liquidity risk is the risk of not being able to meet funding obligations such as the repayment of liabilities or payment of asset purchases as they fall due. The Group’s liquidity management involves maintaining funding capacity to finance capital expenditures and service maturing debts, and to accommodate any fluctuations in asset and liability levels due to changes in the Group’s business operations or unanticipated events created by customer behavior or capital market conditions. The Group maintains a level of cash and cash equivalents deemed sufficient to finance its operations. As part of its liquidity risk management, the Group regularly evaluates its projected and actual cash flows. It also continuously assesses conditions in the financial markets for opportunities to pursue fund-raising activities. Fund-raising activities may include obtaining bank loans and capital market issues both onshore and offshore. The tables below summarize the maturity profile of the Group’s financial liabilities based on undiscounted contractual payments as of June 30, 2009 (Unaudited):
June 30, 2009 (Unaudited)
On Demand1 to 3
Months3 to 12
Months 1 to 5 Years
More Than5 Years Total
Financial Liabilities Accounts payable and accrued expenses (including noncurrent portion booked under Other Noncurrent Liabilities in the consolidated balance sheet but excluding Due to Related Parties) P=5,107,215,212 P=8,001,085,761 P=6,498,268,450 P=1,440,674,656 P=315,907,361 P=21,363,151,440Due to related parties (included under Accounts Payable and Accrued Expense and Other Noncurrent Liabilities in the consolidated statement of financial positions) 398,599,348 541,844,846 2,696,565 1,504,260,574 – 2,447,401,333Short-term debt – 17,520,998,548 5,385,296,519 – – 22,906,295,067Derivative financial instruments (including noncurrent portion booked under Other Noncurrent Liabilities in the consolidated statement of financial position) 20,005,624 – 456,862,438 592,985,087 – 1,069,853,149Deposits from real estate
buyers and lessees (included under Other Current and Noncurrent Liabilities in the consolidated statement of financial position) 9,198,636,166 727,778,860 464,929,362 2,701,158,558 3,468,195 13,095,971,141
(Forward)
17
June 30, 2009 (Unaudited)
On Demand1 to 3
Months3 to 12
Months 1 to 5 Years
More Than5 Years Total
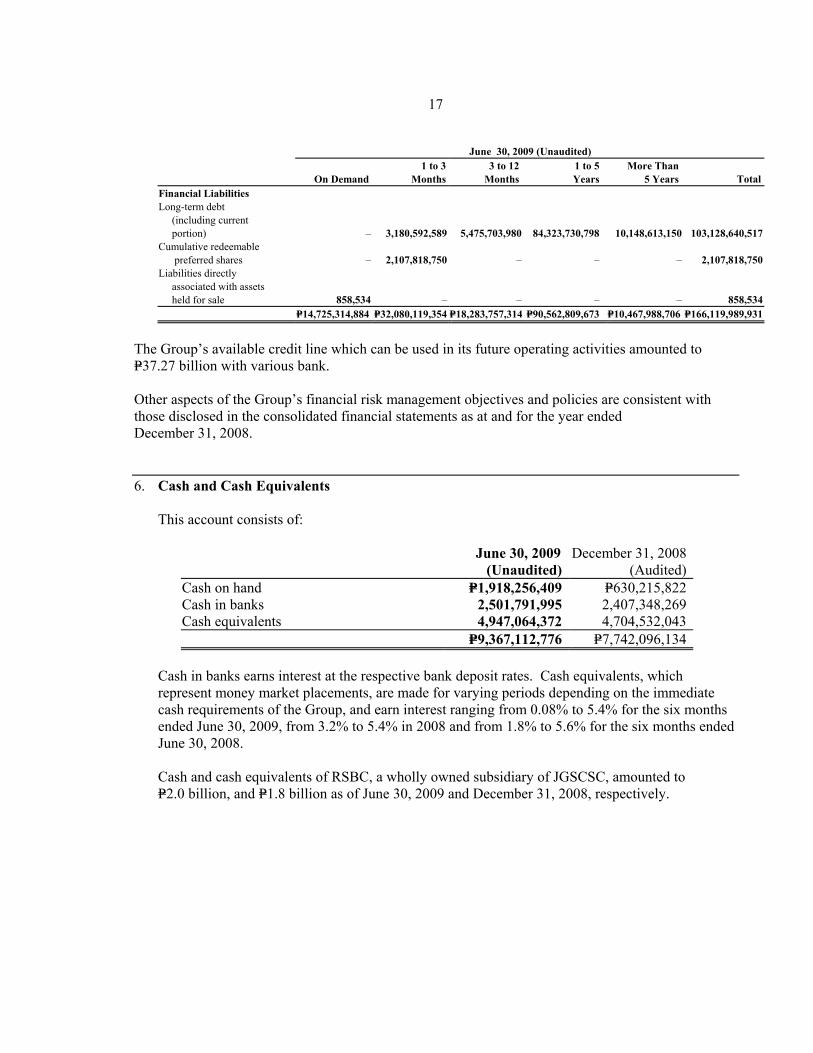
Financial Liabilities Long-term debt (including current portion) – 3,180,592,589 5,475,703,980 84,323,730,798 10,148,613,150 103,128,640,517Cumulative redeemable
preferred shares – 2,107,818,750 – – – 2,107,818,750Liabilities directly associated with assets held for sale 858,534 – – – – 858,534 P=14,725,314,884 P=32,080,119,354 P=18,283,757,314 P=90,562,809,673 P=10,467,988,706 P=166,119,989,931
The Group’s available credit line which can be used in its future operating activities amounted to P=37.27 billion with various bank. Other aspects of the Group’s financial risk management objectives and policies are consistent with those disclosed in the consolidated financial statements as at and for the year ended December 31, 2008. 6. Cash and Cash Equivalents
This account consists of:
June 30, 2009
(Unaudited)December 31, 2008
(Audited)Cash on hand P=1,918,256,409 P=630,215,822Cash in banks 2,501,791,995 2,407,348,269Cash equivalents 4,947,064,372 4,704,532,043 P=9,367,112,776 P=7,742,096,134
Cash in banks earns interest at the respective bank deposit rates. Cash equivalents, which represent money market placements, are made for varying periods depending on the immediate cash requirements of the Group, and earn interest ranging from 0.08% to 5.4% for the six months ended June 30, 2009, from 3.2% to 5.4% in 2008 and from 1.8% to 5.6% for the six months ended June 30, 2008.
Cash and cash equivalents of RSBC, a wholly owned subsidiary of JGSCSC, amounted to P=2.0 billion, and P=1.8 billion as of June 30, 2009 and December 31, 2008, respectively.

18
7. Derivative Financial Instruments
The tables below show the fair value of the Group’s outstanding derivative financial instruments, reported as assets or liabilities, together with their notional amounts as of June 30, 2009 and December 31, 2008. The notional amount is the basis upon which changes in the value of derivatives are measured.
June 30, 2009 (Unaudited)
Notional Amounts
US
Dollar Euro
PhilippinePeso
Equivalent Derivative
Assets DerivativeLiabilities
(Amounts in Millions) Derivatives Not Designated as Accounting Hedges Freestanding: Foreign currency forwards US$101.5 €– P=4,980.0 P=95.2 P=20.4 Cross currency swaps 38.1 – 1,810.5 332.7 – Currency options – 15.9 – – 17.3 Commodity options (a) – – – 120.6 344.1 Embedded – – – – – Embedded forwards 346.9 – – 545.9 – 1,094.4 381.8 Derivatives Designated as Accounting Hedges Freestanding: Interest rate swaps 300.0 – – – 593.0 Cross currency swaps 38.1 – 1,810.5 – 3.4 – 596.4 P=1,094.4 P=978.2Presented in the consolidated statement of financial position as: Current P=1,094.4 P=381.8 Noncurrent (Note 22) – 596.4 P=1,094.4 P=978.2
(a) Nominal quantity amounts to 960,000 US barrels as of June 30, 2009

19
December 31, 2008 (Audited)
Notional Amounts
US
Dollar Euro
PhilippinePeso
Equivalent Derivative
Assets DerivativeLiabilities
(Amounts in
Millions) Derivatives Not Designated as Accounting Hedges Freestanding: Foreign currency forwards US$151.5 €– P=7,200.0 P=218.3 P=124.0 Cross currency swaps 38.1 – 1,810.5 393.4 – Currency options 50.6 0.8– 2,454.2 9.9 21.0 Commodity options (b) – – – – 1,946.0Embedded Embedded forwards 313.8 – 14,911.8 516.6 – 1,138.2 2,091.0 Derivatives Designated as Accounting Hedges Freestanding: Interest rate swaps US$300.0 €– P=9,504.0 P=– P=862.3 Cross currency swaps 38.1 – 1,810.5 – 3.4 – 865.7 P=1,138.2 P=2,956.7Presented in the consolidated statement of financial position as: Current P=1,138.2 P=2,091.0 Noncurrent (Note 22) – 865.7 P=1,138.2 P=2,956.7(b) Nominal quantity amounts to 840,000 US barrels as of December 31, 2008
Updates on derivatives not designated as accounting hedges The Group’s derivatives not designated as accounting hedges include transactions to take positions with the expectation of generating profit from favorable movements in prices and rates on indices. Also, included under this heading are any derivatives which do not meet PAS 39 hedging requirements.
• Foreign currency forwards
The Group entered into short-term nondeliverable foreign currency forward contracts. The Group’s short-term forwards have varying tenors ranging from one to three months and have a total notional amount of US$101.5 million. As of June 30, 2009, the short-term foreign currency forward contracts have weighted average rates of P=48.15:US$1.00 and P=47.89:US$1.00 for forward USD bought and forward USD sold contracts, respectively.
20
• Cross currency swaps
The outstanding cross currency swap transactions of the Parent Company were collateralized by investment in equity securities booked under AFS investments with a total carrying value of US$5.2 million (P=252.2 million) as of June 30, 2009 (Note 9).
• Commodity options
In 2009, three-way fuel option contracts of the Group with nominal amount of 540 thousand US barrels have been settled during the six month period which resulted to the decrease in the derivative liability. The Group is required by its counterparties to confer credit support (collaterals) related to the commodity price risk in anticipation for risk exposures. As of June 30, 2009, the collaterals (included under Other Current Assets in the consolidated statement of financial position) amounted to P=111.1 million (Note 12).
Updates on derivatives designated as accounting hedges As part of its asset and liability management, the Group used derivatives, particularly currency swaps and interest rate swaps as cash flow hedges in order to reduce its exposure to market risks that is achieved by hedging portfolios of floating rate financial instruments.
Hedge accounting varies according to the nature of the item hedged and compliance with the hedge criteria. Hedges entered into by the Group which provide economic hedges but do not meet the hedge accounting criteria are included under derivatives not designated as accounting hedges.
Hedge Effectiveness Results As of June 30, 2009 and December 31, 2008, the net effective fair value changes on the Group’s cash flow hedges that were deferred in equity under Net Unrealized Gain (Loss) on Reserves amounted to P=392.3 million and P=865.7 million, respectively. In June 30, 2009, the Group recognized a loss amounting to P=196.9 million recorded under ‘Market Valuation Gain (Loss) in Derivative Financial Instruments’ in the unaudited interim condensed statement of comprehensive income which pertain to the ineffectiveness from a certain cash flow hedge. The distinction of the results of hedge accounting into “Effective” or “Ineffective” represent designations based on PAS 39 and are not necessarily reflective of the economic effectiveness of the instruments.
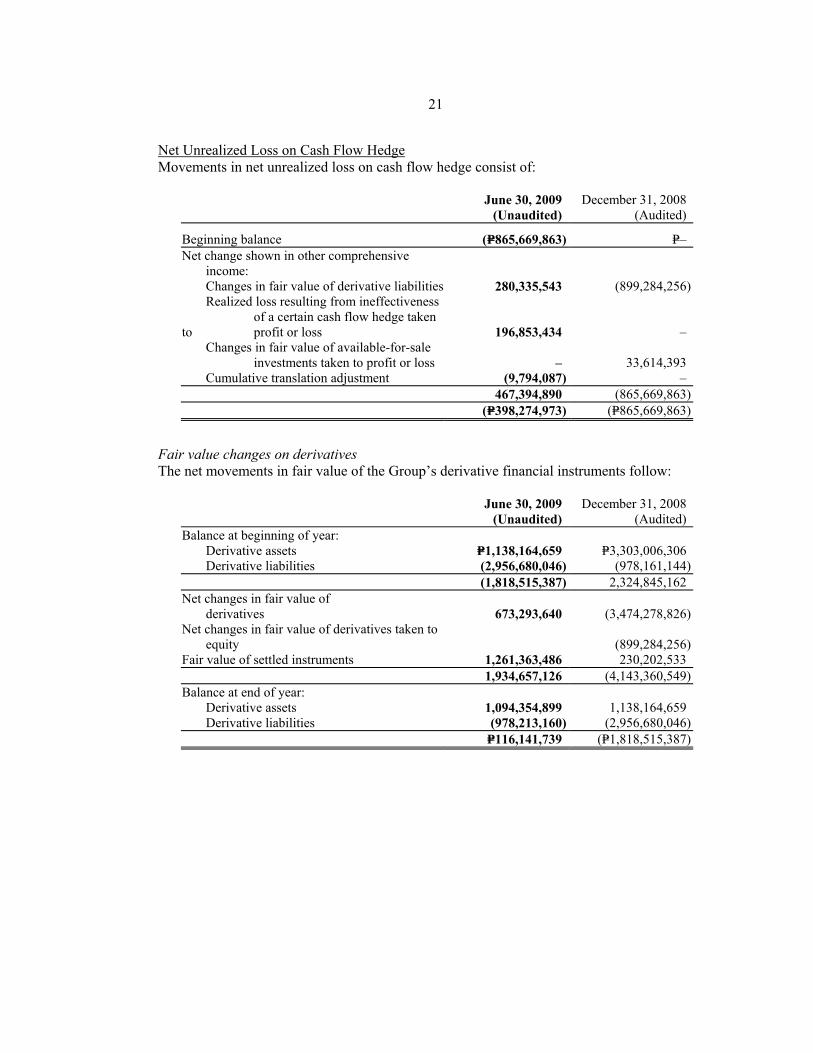
21
Net Unrealized Loss on Cash Flow Hedge
Movements in net unrealized loss on cash flow hedge consist of:
June 30, 2009(Unaudited)
December 31, 2008(Audited)
Beginning balance (P=865,669,863) P=– Net change shown in other comprehensive income:
Changes in fair value of derivative liabilities 280,335,543 (899,284,256) Realized loss resulting from ineffectiveness of a certain cash flow hedge taken to profit or loss 196,853,434 – Changes in fair value of available-for-sale investments taken to profit or loss – 33,614,393 Cumulative translation adjustment (9,794,087) – 467,394,890 (865,669,863) (P=398,274,973) (P=865,669,863)
Fair value changes on derivatives The net movements in fair value of the Group’s derivative financial instruments follow:
June 30, 2009
(Unaudited) December 31, 2008
(Audited) Balance at beginning of year: Derivative assets P=1,138,164,659 P=3,303,006,306 Derivative liabilities (2,956,680,046) (978,161,144) (1,818,515,387) 2,324,845,162 Net changes in fair value of derivatives 673,293,640
(3,474,278,826)
Net changes in fair value of derivatives taken to equity (899,284,256)
Fair value of settled instruments 1,261,363,486 230,202,533 1,934,657,126 (4,143,360,549)Balance at end of year: Derivative assets 1,094,354,899 1,138,164,659 Derivative liabilities (978,213,160) (2,956,680,046) P=116,141,739 (P=1,818,515,387)

22
8. Financial Assets at Fair Value through Profit or Loss
These investments that are held for trading consist of:
June 30, 2009
(Unaudited) December 31, 2008
(Audited) Debt securities Private P=4,463,441,836 P=3,774,797,039 Government 977,629,314 856,664,493 5,441,071,150 4,631,461,532 Equity securities Quoted 1,435,517,656 1,402,144,918 Unquoted 4,967 4,905 1,435,522,623 1,402,149,823 P=6,876,593,773 P=6,033,611,355
The above investments consist of quoted debt and equity securities issued by certain domestic and foreign entities. Net market valuation gain on financial assets at FVPL amounted to P=506.5 million for the period June 30, 2009. Net market valuation loss on financial assets at FVPL amounted to P=1.4 billion for the period ended June 30, 2008.
Reclassification of Financial Assets at FVPL Following the amendments to PAS 39 and PFRS 7, URC reclassified certain trading assets from the Financial Assets at FVPL category to the AFS Investments category in the consolidated statement of financial position. The recent global credit crunch had prompted the amendments to be issued by the IASB, and the adoption of these amendments permitted the Group to revisit the existing classification of their financial assets. The Group identified assets, eligible under the amendments, for which at July 1, 2008, it had a clear change of intent to hold for the foreseeable future rather than to exit or trade in the short term. The disclosures below detail the impact of the reclassifications in the Group’s financial statements.
The following table shows carrying values of the reclassified assets:
September 30,2007* July 1, 2008 September 30, 2008* Debt securities: Private P=5,416,514,163 P=4,885,178,163 P=4,080,459,883 Government 2,482,946,123 2,337,022,421 2,224,382,820 P=7,899,460,286 P=7,222,200,584 P=6,304,842,703 *URC and Subsidiaries’ financial year-end
As of reclassification date, effective interest rates on reclassified trading assets ranged from 6.06%
to 18.94%, with expected recoverable cash flows of P=12.5 billion. Ranges of effective interest rates were determined based on weighted average rates by business.
Prior to reclassification, reduction in the fair values of the Group’s financial assets at FVPL at
July 1, 2008 amounted to P=1.3 billion, which is included under Market Valuation Gain (Loss) on Financial Assets at FVPL in the 2008 consolidated statement of income.
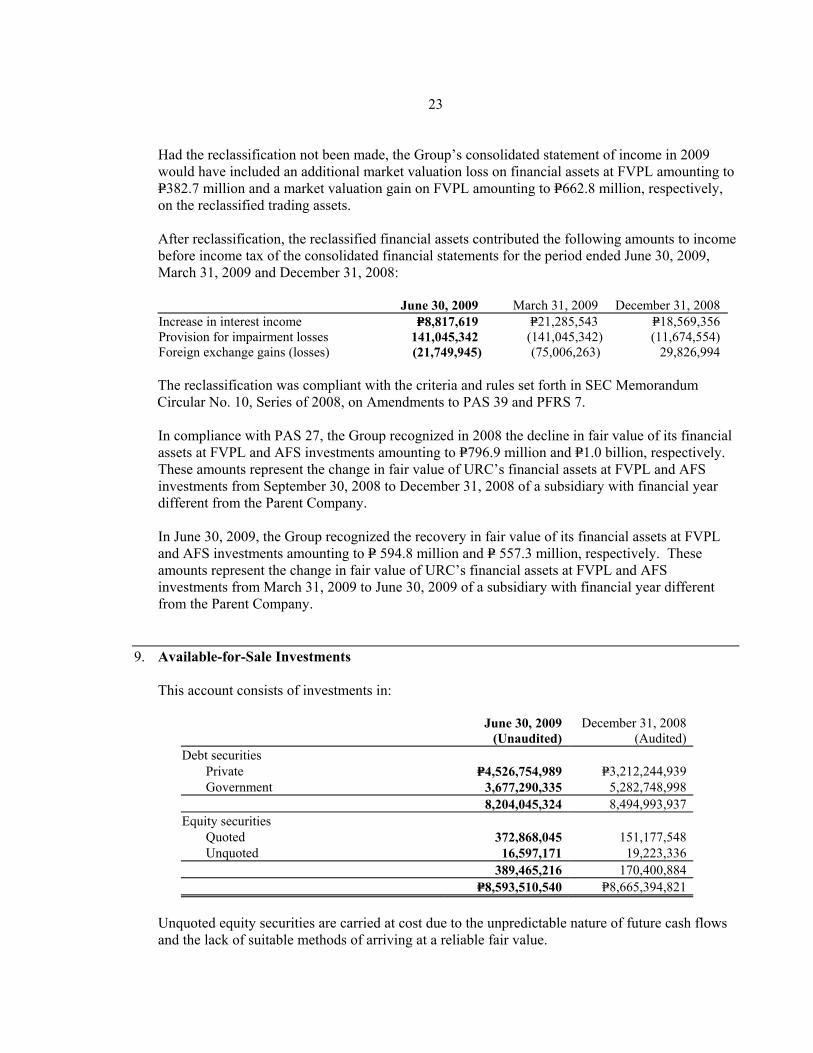
23
Had the reclassification not been made, the Group’s consolidated statement of income in 2009 would have included an additional market valuation loss on financial assets at FVPL amounting to P=382.7 million and a market valuation gain on FVPL amounting to P=662.8 million, respectively, on the reclassified trading assets.
After reclassification, the reclassified financial assets contributed the following amounts to income before income tax of the consolidated financial statements for the period ended June 30, 2009, March 31, 2009 and December 31, 2008:
June 30, 2009 March 31, 2009 December 31, 2008 Increase in interest income P=8,817,619 P=21,285,543 P=18,569,356 Provision for impairment losses 141,045,342 (141,045,342) (11,674,554) Foreign exchange gains (losses) (21,749,945) (75,006,263) 29,826,994
The reclassification was compliant with the criteria and rules set forth in SEC Memorandum Circular No. 10, Series of 2008, on Amendments to PAS 39 and PFRS 7.
In compliance with PAS 27, the Group recognized in 2008 the decline in fair value of its financial
assets at FVPL and AFS investments amounting to P=796.9 million and P=1.0 billion, respectively. These amounts represent the change in fair value of URC’s financial assets at FVPL and AFS investments from September 30, 2008 to December 31, 2008 of a subsidiary with financial year different from the Parent Company.
In June 30, 2009, the Group recognized the recovery in fair value of its financial assets at FVPL
and AFS investments amounting to P= 594.8 million and P= 557.3 million, respectively. These amounts represent the change in fair value of URC’s financial assets at FVPL and AFS investments from March 31, 2009 to June 30, 2009 of a subsidiary with financial year different from the Parent Company.
9. Available-for-Sale Investments
This account consists of investments in:
June 30, 2009
(Unaudited) December 31, 2008
(Audited) Debt securities Private P=4,526,754,989 P=3,212,244,939 Government 3,677,290,335 5,282,748,998 8,204,045,324 8,494,993,937 Equity securities Quoted 372,868,045 151,177,548 Unquoted 16,597,171 19,223,336 389,465,216 170,400,884 P=8,593,510,540 P=8,665,394,821
Unquoted equity securities are carried at cost due to the unpredictable nature of future cash flows and the lack of suitable methods of arriving at a reliable fair value.

24
For the periods ending June 30, 2009 and December 31, 2008, the Group recognized permanent decline on its AFS investments under private debt securities amounting to P= 141.01 million and P=11.7 million (Note 27). In 2008, the Group reclassified certain debt securities classified as AFS investments to HTM investments (Note 13).
Movements in net unrealized gains (losses) on AFS investments follow:
June 30, 2009 December 31, 2008 Balance at beginning of year (P=1,338,927,963) P=710,537,158 Unrealized gain (loss) recognized in equity 695,002,578 (1,949,695,133) Amounts realized in the statement of income – (99,769,988) Balance at end of period (P=643,925,385) (P=1,338,927,963)
Certain investments in equity securities were collateralized as support to the Parent Company’s cross currency swap transactions (Note 7).
10. Receivables
This account consists of:
June 30, 2009
(Unaudited) December 31, 2008
(Audited) Trade receivables P=13,099,010,744 P=14,329,504,672 Finance receivables 7,690,041,539 6,968,913,078 Due from related parties (Note 32) 3,247,611,441 3,248,747,625 Interest receivable 442,234,021 406,288,225 Other receivables 2,324,852,461 1,907,290,961 26,803,750,206 26,860,744,561 Less allowance for impairment loss 3,493,525,560 4,215,091,502 P=23,310,224,646 P=22,645,653,059
Total receivables shown in the statement of financial position follow:
June 30, 2009
(Unaudited) December 31, 2008
(Audited) Current portion P=22,144,365,709 P=21,580,596,806 Noncurrent portion (Note 18) 1,165,858,937 1,065,056,253 P=23,310,224,646 P=22,645,653,059
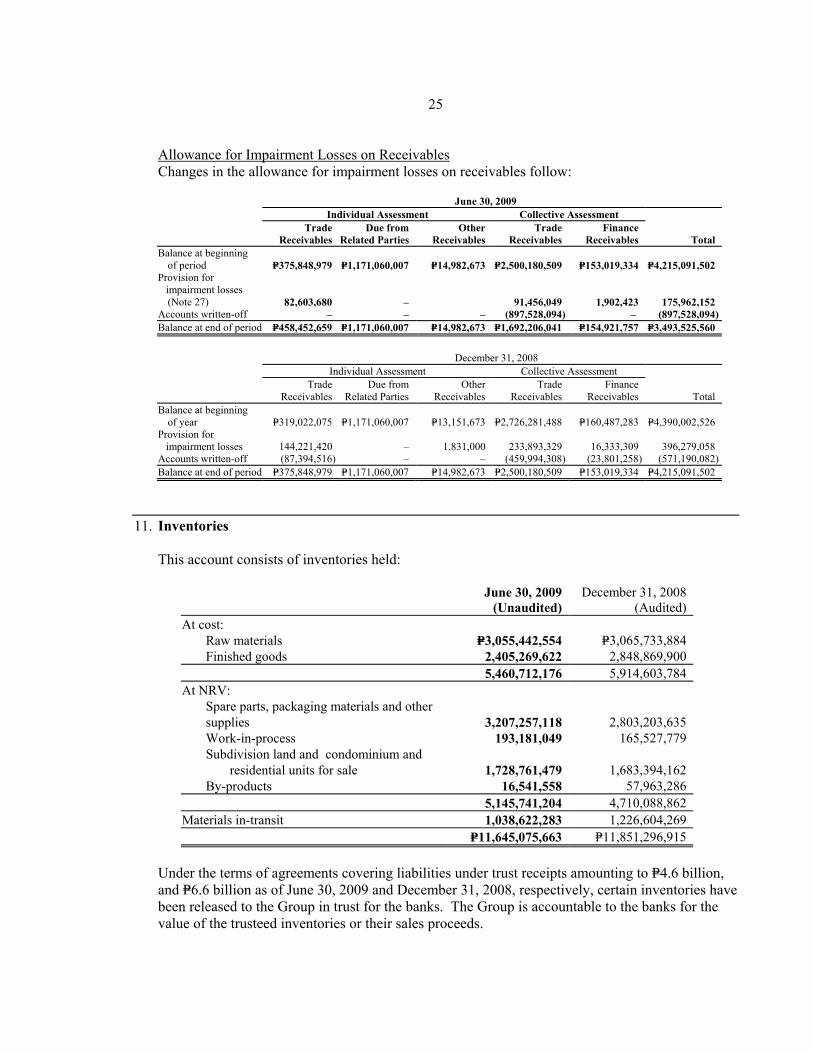
25
Allowance for Impairment Losses on Receivables
Changes in the allowance for impairment losses on receivables follow:
June 30, 2009 Individual Assessment Collective Assessment
Trade
Receivables Due from
Related Parties Other
Receivables Trade
Receivables Finance
Receivables Total Balance at beginning
of period P=375,848,979 P=1,171,060,007 P=14,982,673 P=2,500,180,509 P=153,019,334 P=4,215,091,502 Provision for
impairment losses (Note 27) 82,603,680 – 91,456,049 1,902,423 175,962,152
Accounts written-off – – – (897,528,094) – (897,528,094)Balance at end of period P=458,452,659 P=1,171,060,007 P=14,982,673 P=1,692,206,041 P=154,921,757 P=3,493,525,560
December 31, 2008 Individual Assessment Collective Assessment
Trade
Receivables Due from
Related Parties Other
Receivables Trade
Receivables Finance
Receivables Total Balance at beginning
of year P=319,022,075 P=1,171,060,007 P=13,151,673 P=2,726,281,488 P=160,487,283 P=4,390,002,526 Provision for
impairment losses 144,221,420 – 1,831,000 233,893,329 16,333,309 396,279,058 Accounts written-off (87,394,516) – – (459,994,308) (23,801,258) (571,190,082)Balance at end of period P=375,848,979 P=1,171,060,007 P=14,982,673 P=2,500,180,509 P=153,019,334 P=4,215,091,502
11. Inventories
This account consists of inventories held:
June 30, 2009
(Unaudited) December 31, 2008
(Audited) At cost: Raw materials P=3,055,442,554 P=3,065,733,884 Finished goods 2,405,269,622 2,848,869,900 5,460,712,176 5,914,603,784 At NRV: Spare parts, packaging materials and other
supplies 3,207,257,118 2,803,203,635 Work-in-process 193,181,049 165,527,779 Subdivision land and condominium and
residential units for sale 1,728,761,479 1,683,394,162 By-products 16,541,558 57,963,286 5,145,741,204 4,710,088,862 Materials in-transit 1,038,622,283 1,226,604,269 P=11,645,075,663 P=11,851,296,915
Under the terms of agreements covering liabilities under trust receipts amounting to P=4.6 billion, and P=6.6 billion as of June 30, 2009 and December 31, 2008, respectively, certain inventories have been released to the Group in trust for the banks. The Group is accountable to the banks for the value of the trusteed inventories or their sales proceeds.
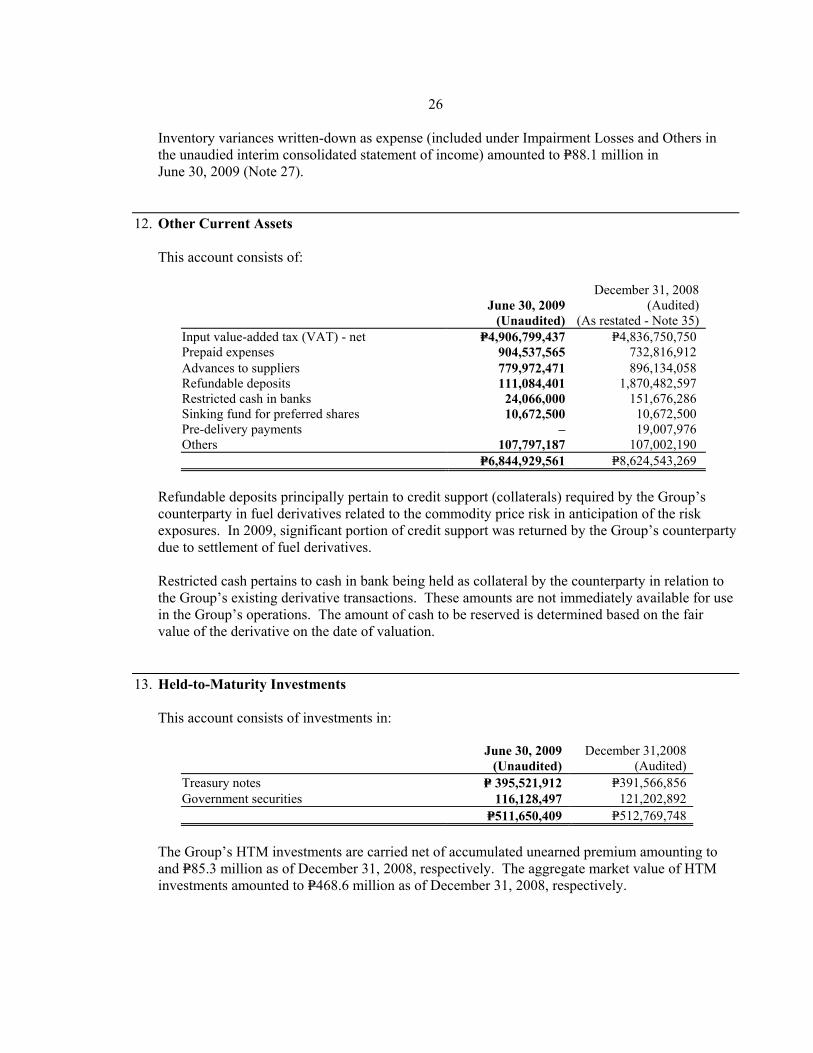
26
Inventory variances written-down as expense (included under Impairment Losses and Others in the unaudied interim consolidated statement of income) amounted to P=88.1 million in June 30, 2009 (Note 27).
12. Other Current Assets
This account consists of:
June 30, 2009
(Unaudited)
December 31, 2008(Audited)
(As restated - Note 35) Input value-added tax (VAT) - net P=4,906,799,437 P=4,836,750,750 Prepaid expenses 904,537,565 732,816,912 Advances to suppliers 779,972,471 896,134,058 Refundable deposits 111,084,401 1,870,482,597 Restricted cash in banks 24,066,000 151,676,286 Sinking fund for preferred shares 10,672,500 10,672,500 Pre-delivery payments – 19,007,976 Others 107,797,187 107,002,190 P=6,844,929,561 P=8,624,543,269
Refundable deposits principally pertain to credit support (collaterals) required by the Group’s counterparty in fuel derivatives related to the commodity price risk in anticipation of the risk exposures. In 2009, significant portion of credit support was returned by the Group’s counterparty due to settlement of fuel derivatives.
Restricted cash pertains to cash in bank being held as collateral by the counterparty in relation to the Group’s existing derivative transactions. These amounts are not immediately available for use in the Group’s operations. The amount of cash to be reserved is determined based on the fair value of the derivative on the date of valuation.
13. Held-to-Maturity Investments
This account consists of investments in:
June 30, 2009
(Unaudited) December 31,2008
(Audited) Treasury notes P= 395,521,912 P=391,566,856 Government securities 116,128,497 121,202,892 P=511,650,409 P=512,769,748
The Group’s HTM investments are carried net of accumulated unearned premium amounting to and P=85.3 million as of December 31, 2008, respectively. The aggregate market value of HTM investments amounted to P=468.6 million as of December 31, 2008, respectively.
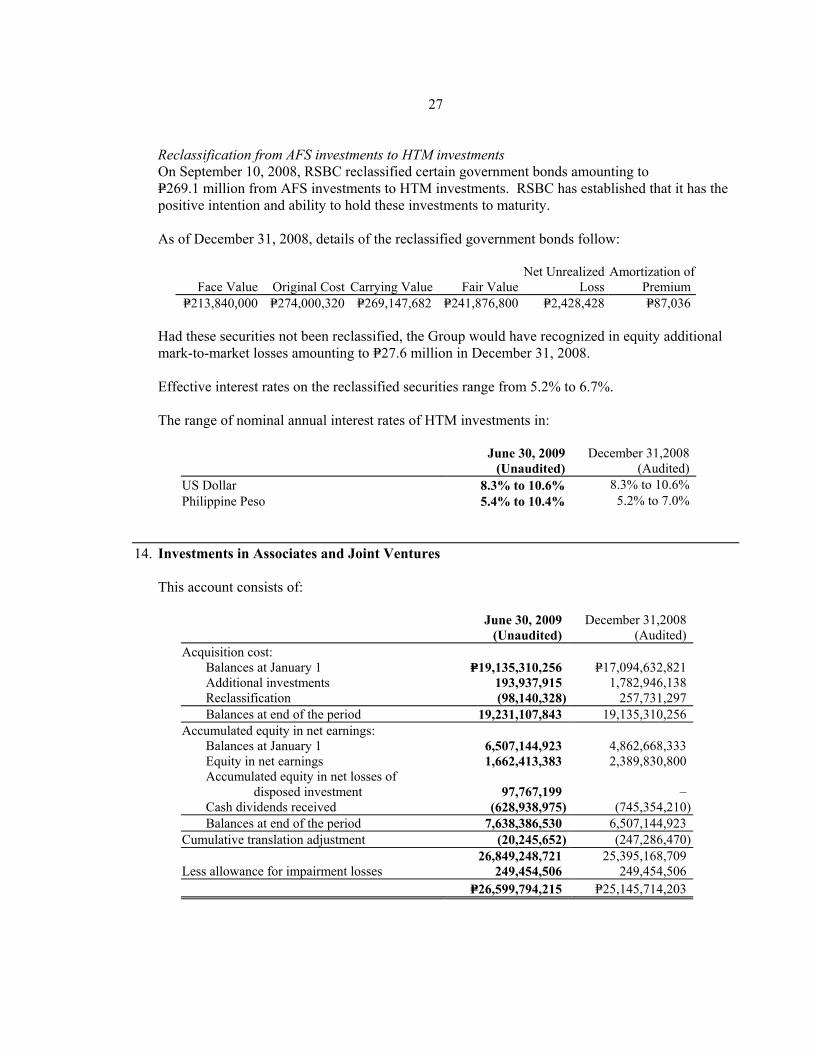
27
Reclassification from AFS investments to HTM investments On September 10, 2008, RSBC reclassified certain government bonds amounting to P=269.1 million from AFS investments to HTM investments. RSBC has established that it has the positive intention and ability to hold these investments to maturity.
As of December 31, 2008, details of the reclassified government bonds follow:
Face Value Original Cost Carrying Value Fair ValueNet Unrealized
Loss Amortization of
PremiumP=213,840,000 P=274,000,320 P=269,147,682 P=241,876,800 P=2,428,428 P=87,036
Had these securities not been reclassified, the Group would have recognized in equity additional mark-to-market losses amounting to P=27.6 million in December 31, 2008.
Effective interest rates on the reclassified securities range from 5.2% to 6.7%.
The range of nominal annual interest rates of HTM investments in:
June 30, 2009
(Unaudited)December 31,2008
(Audited) US Dollar 8.3% to 10.6% 8.3% to 10.6% Philippine Peso 5.4% to 10.4% 5.2% to 7.0%
14. Investments in Associates and Joint Ventures
This account consists of:
June 30, 2009
(Unaudited) December 31,2008
(Audited) Acquisition cost: Balances at January 1 P=19,135,310,256 P=17,094,632,821 Additional investments 193,937,915 1,782,946,138 Reclassification (98,140,328) 257,731,297 Balances at end of the period 19,231,107,843 19,135,310,256 Accumulated equity in net earnings: Balances at January 1 6,507,144,923 4,862,668,333 Equity in net earnings 1,662,413,383 2,389,830,800 Accumulated equity in net losses of disposed investment 97,767,199 – Cash dividends received (628,938,975) (745,354,210) Balances at end of the period 7,638,386,530 6,507,144,923 Cumulative translation adjustment (20,245,652) (247,286,470) 26,849,248,721 25,395,168,709 Less allowance for impairment losses 249,454,506 249,454,506 P=26,599,794,215 P=25,145,714,203

28
United Industrial Corporation Limited (UICL) Financial information of UICL follows (amounts in millions):
June 30, 2009
(Unaudited) December 31,2008
(Audited)Total assets P=214,076 P=190,590Total liabilities 68,383 37,540Net assets 145,693 153,050Revenue 15,037 12,292Net income 4,394 5,648
UICL follows the revaluation method of valuing property, plant and equipment. Since the Group’s accounting policy for the valuation of property, plant and equipment is the cost basis, the financial information above of UICL represents the adjusted amounts after reversal of the effect of revaluation on the said assets.
On April 15, 2009, the Group sold its investment in BayanTrade Dotcom, Inc. for P=1.0 per share to a third party. The Group recognized gain on sale of investment amounting to P=8.7 million recorded under ‘Other income’ account in the unaudited interim condensed consolidated statement of comprehensive income.
15. Investment Properties
Movements in Investment Properties account as of June 30, 2009 (Unaudited) follow:
Landand Land
Improvements Buildings and
Improvements
TheaterFurniture and
Equipment Construction in
Progress Total Cost Balance at beginning of the
period P=12,419,036,302 P=23,294,700,371 P=254,274,144 P=– P=35,968,010,817 Additions 1,743,370 773,961,952 – 1,390,780,177 2,166,485,499 Retirements/disposals (9,900,593) – – – (9,900,593)Transfers/other adjustments (24,331,411) (14,194,768) – 1,949,661,392 1,911,135,213 Balance at end of the period 12,386,547,668 24,054,467,555 254,274,144 3,340,441,569 40,035,730,936 Accumulated Depreciation
and Amortization
Balances at beginning of
period 41,092,269 8,043,554,759 194,034,512 – 8,278,681,540 Depreciation and amortization 2,174,172 685,571,081 9,748,411 – 697,493,664 Balance at end of the period 43,266,441 8,729,125,840 203,782,923 – 8,976,175,204 Net Book Value at End of the
Period P=12,343,281,227 P=15,325,341,715 P=50,491,221 P=3,340,441,569 P=31,059,555,732

29
Movements in Investment Properties account as of December 31, 2008 (Audited) follow:
Landand Land
Improvements Buildings andImprovements
Theater Furniture and
Equipment Total Cost Balance at beginning of the year P=10,831,283,607 P=19,912,343,661 P=254,274,144 P=30,997,901,412 Additions 2,501,811,623 218,459,412 – 2,720,271,035 Retirements/disposals (46,652,923) – – (46,652,923)Transfers/other adjustments (867,406,005) 3,163,897,298 – 2,296,491,293 Balance at end of the year 12,419,036,302 23,294,700,371 254,274,144 35,968,010,817 Accumulated Depreciation
and Amortization Balance at beginning of the year 40,994,348 6,736,593,273 174,537,691 6,952,125,312 Depreciation and amortization 4,880,398 1,306,961,486 19,496,821 1,331,338,705 Transfers/other adjustments (4,782,477) – – (4,782,477)Balance at end of the year 41,092,269 8,043,554,759 194,034,512 8,278,681,540 Net Book Value at End of the Year P=12,377,944,033 P=15,251,145,612 P=60,239,632 P=27,689,329,277
Investment properties consisted mainly of land held for appreciation, shopping malls and commercial centers and office buildings that are held to earn rentals. Most of the Group’s properties are in prime locations across the Philippines. Rent Income from Investment Properties Consolidated rent income from investment properties included under Real Estate and Hotels Revenue in the unaudited interim condensed consolidated statement of income amounted to P=2.8 billion and P=2.4 billion for the six-month periods ended June 30, 2009 and 2008, respectively. Direct operating expenses pertaining to rental operations (included under Cost of Sales and Services account in the unaudited interim consolidated statement of income) amounted to P=73.7 million and P=73.2 million in for the six months period ended June 30, 2009 and June 30, 2008, respectively.
Depreciation and Amortization The breakdown of consolidated depreciation and amortization on investment properties follows:
June 30, 2009 June 30, 2008 Depreciation and amortization expense included under: Cost of sales and services (Note 25) P=695,321,136 P=620,031,387 General and administrative expenses (Note 26) 2,172,528 2,173,770 P=697,493,664 P=622,205,157

30
16. Property, Plant and Equipment
Movements in the Property, Plant and Equipment account as of June 30, 2009 (Unaudited) follow:
Land and
Improvements Buildings and
Improvements
Machinery and Equipment
TelecommunicationsEquipment
Investment in Cable Systems Sub-total
Cost Balance at beginning of the period P=4,293,690,981 P=16,851,097,517
P=39,966,043,425
P=43,157,960,583 P=758,846,103 P=105,027,638,609
Additions 93,850,036 194,355,806 1,855,052,207
12,446,900 – 2,155,704,949Transfers, disposals and other adjustments (1,365,989) 13,362,862 (295,689,429) – – (283,692,556)Balance at end of the period 4,386,175,028 17,058,816,185 41,525,406,203 43,170,407,483 758,846,103 106,899,651,002Accumulated Depreciation, Amortization
and Impairment Balance at beginning of the period 825,955,398
7,454,038,091 22,948,354,459 24,526,391,288 149,766,575 55,904,505,811Depreciation and amortization expense 19,633,224 278,407,344 1,355,718,464 1,240,822,200
21,466,000 2,916,047,232
Disposals and other adjustments 32,959,135 541,763 (98,927,963) 1,000 – (65,426,065)Balance at end of the period 878,547,757 7,732,987,198 24,205,144,960 25,767,214,488 171,232,575 58,755,126,978Net Book Value at End of the Period P=3,507,627,271 P=9,325,828,987 P=17,320,261,243 P=17,403,192,995 P=587,613,528 P=48,144,524,024
Transportation,Furnishing and
Other Equipment
Passenger Aircraftand Other Flight
Equipment
Construction In-progress
EquipmentIn-transit
Cost Total
Balance at beginning of the period P=7,607,066,619
P=29,837,257,909 P=48,677,739,559 P=283,315,592 P=191,433,018,288 Additions 365,867,489 2,168,517,900
5,401,510,524 152,369,697
10,243,970,559
Transfers, disposals and other adjustments 22,209,543 – (1,954,543,821) – (2,216,026,834)Balance at end of the period 7,995,143,651 32,005,775,809 52,124,706,262 435,685,289 199,460,962,013Accumulated Depreciation, Amortization
and Impairment Balance at beginning of the period 5,811,192,614
4,948,558,353 – – 66,664,256,778Depreciation and amortization 335,985,676 942,717,122
– – 4,194,750,030
Disposals and other adjustments 19,340,846 – – – (46,085,219)Balance at end of the period 6,166,519,136 5,891,275,475 – – 70,812,921,589Net Book Value at End of the Period P=1,828,624,515 P=26,114,500,334 P=52,124,706,262 P=435,685,289 P=128,648,040,424
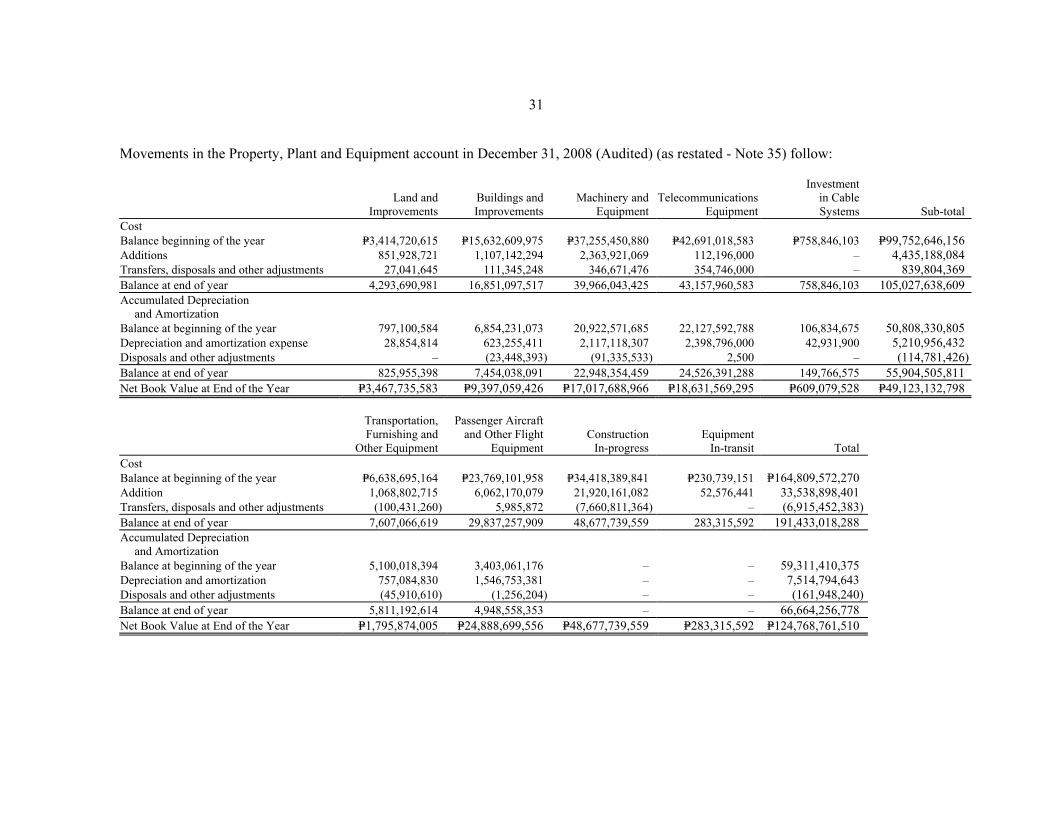
31
Cost
Movements in the Property, Plant and Equipment account in December 31, 2008 (Audited) (as restated - Note 35) follow:
Land and
Improvements Buildings andImprovements
Machinery and Equipment
TelecommunicationsEquipment
Investmentin CableSystems Sub-total
Balance beginning of the year P=3,414,720,615
P=15,632,609,975 P=37,255,450,880 P=42,691,018,583 P=758,846,103 P=99,752,646,156 Additions 851,928,721 1,107,142,294 2,363,921,069 112,196,000 – 4,435,188,084 Transfers, disposals and other adjustments 27,041,645 111,345,248 346,671,476 354,746,000 – 839,804,369 Balance at end of year 4,293,690,981 16,851,097,517 39,966,043,425 43,157,960,583 758,846,103 105,027,638,609 Accumulated Depreciation
and Amortization Balance at beginning of the year 797,100,584
6,854,231,073 20,922,571,685 22,127,592,788 106,834,675 50,808,330,805 Depreciation and amortization expense 28,854,814 623,255,411 2,117,118,307 2,398,796,000 42,931,900
5,210,956,432
Disposals and other adjustments – (23,448,393) (91,335,533) 2,500 – (114,781,426)Balance at end of year 825,955,398 7,454,038,091 22,948,354,459 24,526,391,288 149,766,575 55,904,505,811 Net Book Value at End of the Year P=3,467,735,583 P=9,397,059,426 P=17,017,688,966 P=18,631,569,295 P=609,079,528 P=49,123,132,798
Transportation,Furnishing and
Other Equipment
Passenger Aircraftand Other Flight
Equipment Construction
In-progress Equipment
In-transit
TotalCost Balance at beginning of the year
P=6,638,695,164
P=23,769,101,958 P=34,418,389,841 P=230,739,151 P=164,809,572,270 Addition 1,068,802,715 6,062,170,079 21,920,161,082 52,576,441 33,538,898,401
Transfers, disposals and other adjustments (100,431,260) 5,985,872 (7,660,811,364) – (6,915,452,383)Balance at end of year 7,607,066,619 29,837,257,909 48,677,739,559 283,315,592 191,433,018,288 Accumulated Depreciation
and Amortization Balance at beginning of the year
5,100,018,394 3,403,061,176 – – 59,311,410,375 Depreciation and amortization 757,084,830 1,546,753,381 – – 7,514,794,643 Disposals and other adjustments (45,910,610) (1,256,204) – – (161,948,240)Balance at end of year 5,811,192,614 4,948,558,353 – – 66,664,256,778 Net Book Value at End of the Year P=1,795,874,005 P=24,888,699,556 P=48,677,739,559 P=283,315,592 P=124,768,761,510

32
Depreciation, Amortization and Impairment Loss The breakdown of consolidated depreciation, amortization and provision for impairment losses on property, plant and equipment follows:
June 30 (Unaudited) 2009 2008 Depreciation and amortization expense (included under): General and administrative expenses (Note 26) P=2,697,994,968 P=2,544,270,609 Cost of sales and services (Note 25) 1,496,755,062 1,144,232,925 P=4,194,750,030 P=3,688,503,534
Borrowing Costs Borrowing costs capitalized to property, plant and equipment under construction amounted to about P=604.0 million and P=331.0 million for the six months ended June 30, 2009, and in 2008, respectively. The average capitalization rate used to determine the amount of borrowing costs eligible for capitalization in 2008, 2007 and 2006 is 7.1%, 7.6% and 8.7%, respectively.
Transfer to Investment Properties and Inventories Property, plant and equipment transferred to investment property and inventory, particularly, subdivision land, condominium and residential units for sale, aggregated to P=2.2 billion, P=6.9 billion for the six months ended June 30, 2009 and for the year ended December 31, 2008, respectively.
17. Biological Assets
Movements in the Biological Assets account as of June 30, 2009 (Unaudited) follow:
Swine (At Fair Values Less Estimated Point-of-Sale Costs) Poultry (At Cost) Mature Immature Sub-total Mature TotalBalance at beginning of the period P=837,471,440 P=390,715,347 P=1,228,186,787 P=265,385,575 P=1,493,572,362Additions 791,219,847 476,636,147 1,267,855,994 335,943,590 1,603,799,584Disposal (864,929,525) (474,944,599) (1,339,874,124) (418,731,907) (1,758,606,031)Gain arising from changes in fair value less estimated point-of- sale costs 6,886,844 6,892,483 13,779,327 – 13,779,327Balance at end of the period 770,648,606 399,299,378 1,169,947,984 182,597,258 1,352,545,242Accumulated Depreciation Balance at beginning of the period – – – 50,312,620 50,312,620Depreciation – – – 48,910,226 48,910,226Disposal – – – (54,740,088) (54,740,088)Balance at end of the period – – – 44,482,758 44,482,758Net Carrying Value at End of the Period P=770,648,606 P=399,299,378 P=1,169,947,984 P=138,114,500 P=1,308,062,484

33
Movements in the Biological Assets account as of December 31, 2008 (Audited) follow:
Swine (At Fair Values Less Estimated Point-of-Sale Costs) Poultry (At Cost) Mature Immature Sub-total Mature TotalBalance at beginning of the year P=692,772,061 P=273,462,319 P=966,234,380 P=138,024,030 P=1,104,258,410Additions 1,434,647,245 788,664,241 2,223,311,486 555,610,525 2,778,922,011Disposal (1,430,057,316) (811,635,368) (2,241,692,684) (428,248,980) (2,669,941,664)Gain arising from changes in fair value less estimated point of- sale costs 140,109,450 140,224,155 280,333,605 – 280,333,605Balance at end of the year 837,471,440 390,715,347 1,228,186,787 265,385,575 1,493,572,362Accumulated Depreciation Balances at beginning of year – – – 53,689,637 53,689,637Depreciation – – – 81,504,856 81,504,856Disposal – – – (84,881,873) (84,881,873)Balance at end the year – – – 50,312,620 50,312,620Net Carrying Value at End of the Year P=837,471,440 P=390,715,347 P=1,228,186,787 P=215,072,955 P=1,443,259,742
The Group has about 175,541 and 180,718 heads of swine as of June 30, 2009 and December 31, 2008, respectively, and about 531,588, and 468,211 heads of poultry as of June 30, 2009 and December 31, 2008, respectively.
Total biological assets shown in the statement of financial position follow:
June 30, 2009
(Unaudited) December 31, 2008
(Audited)Current portion P=908,763,106 P=1,052,544,395Noncurrent portion 399,299,378 390,715,347 P=1,308,062,484 P=1,443,259,742
18. Other Noncurrent Assets
This account consists of:
June 30, 2009
(Unaudited)
December 31, 2008(Audited)
(As restated - Note 35) Deferred subscriber acquisition and retention costs - net P=1,216,297,031 P=1,137,425,100 Finance receivables (Note 10) 1,165,858,937 1,065,056,253 Security and miscellaneous deposits (pre-delivery payment) 527,781,648 526,919,249 Pension assets (Note 29) 113,673,504 243,810,600 Others 1,313,298,852 1,109,855,808 P=4,336,909,972 P=4,083,067,010

34
Security Deposits Security deposits relate to the Group’s leased buildings, cellsite lots and commercial spaces. These will be collected in full or offset against rent payable at the end of the lease terms subject to adjustments by the lessor to cover damages incurred on the properties.
Deferred Subscriber Acquisition and Retention Costs
Changes in deferred subscriber acquisition and retention costs follow:
June 30, 2009
(Unaudited) December 31, 2008
(Audited) Balance at beginning of year P=1,137,425,100 P=733,021,983 Deferral of subscriber acquisition and retention costs during the period 645,717,257 1,295,258,680 Amortization during the period (566,845,326) (890,855,563) Balance at end of the period P=1,216,297,031 P=1,137,425,100
19. Accounts Payable and Accrued Expenses
This account consists of:
June 30, 2009
(Unaudited) December 31, 2008
(Audited) Deposit liabilities P=8,939,194,841 P=9,674,815,130 Accrued expenses 8,755,314,444 6,539,376,317 Trade payables 8,402,577,921 8,714,910,451 Due to related parties (Note 32) 943,140,758 553,316,085 Withholding taxes payable 200,853,139 239,264,882 Dividends payable 210,935,953 6,000,198 Other payables 1,910,121,179 1,581,705,321 P=29,362,138,235 P=27,309,388,384
Deposit Liabilities Deposit liabilities represent the savings, demand and time deposit liabilities of RSBC. Of the total deposit liabilities of RSBC as of December 31, 2008, 53.5% are subject to periodic interest repricing.

35
Accrued Expenses Accrued expenses and other payables include accruals for interest and various expenses. The
Group’s Accrued Expenses account consists of accruals for:
June 30, 2009
(Unaudited) December 31, 2008
(Audited) Advertising and promotions P=1,566,294,055 P=966,622,937 Landing and take-off, navigational charges, and other aircraft- related expenses 1,501,827,982 537,967,662 Import bills payable 1,426,371,856 1,004,610,897 Accrued interest payable 1,301,493,041 1,293,015,155 Rental expense 1,223,619,873 1,106,217,441 Compensation and benefits 413,420,416 268,026,874 Utilities 306,245,135
256,880,940 229,779,259 117,587,432
237,392,466 Contracted services 175,133,295 Royalties 85,279,983 Freight and handling costs 132,883,538 Insurance 98,682,869 97,246,322 Taxes and licenses 71,453,314 57,532,680 Other accrued expenses 241,658,272 577,447,067 P=8,755,314,444 P=6,539,376,317
Other accrued expenses include accruals for travel and transportation, repairs and maintenance and other professional services.
20. Other Current Liabilities
June 30, 2009
(Unaudited) December 31, 2008
(Audited) Unearned revenue P=3,697,511,862 P=3,132,414,636 Deposits from real estate buyers and lessees (Note 24) 1,856,341,358 1,401,605,247 Others 32,313,600 102,791,442 P=5,586,166,820 P=4,636,811,325
Unearned Revenue Unearned revenue account includes the Group’s (a) unearned air transportation revenue, and (b) unearned telecommunications revenue.
Unearned air transportation revenue Passenger ticket and cargo waybill sales are initially recorded under Unearned Revenue account in the unaudited interim consolidated statement of financial position, until recognized under Revenue account in the unaudited interim consolidated statement of income, when the transportation service is rendered by the Group (or once tickets are flown).
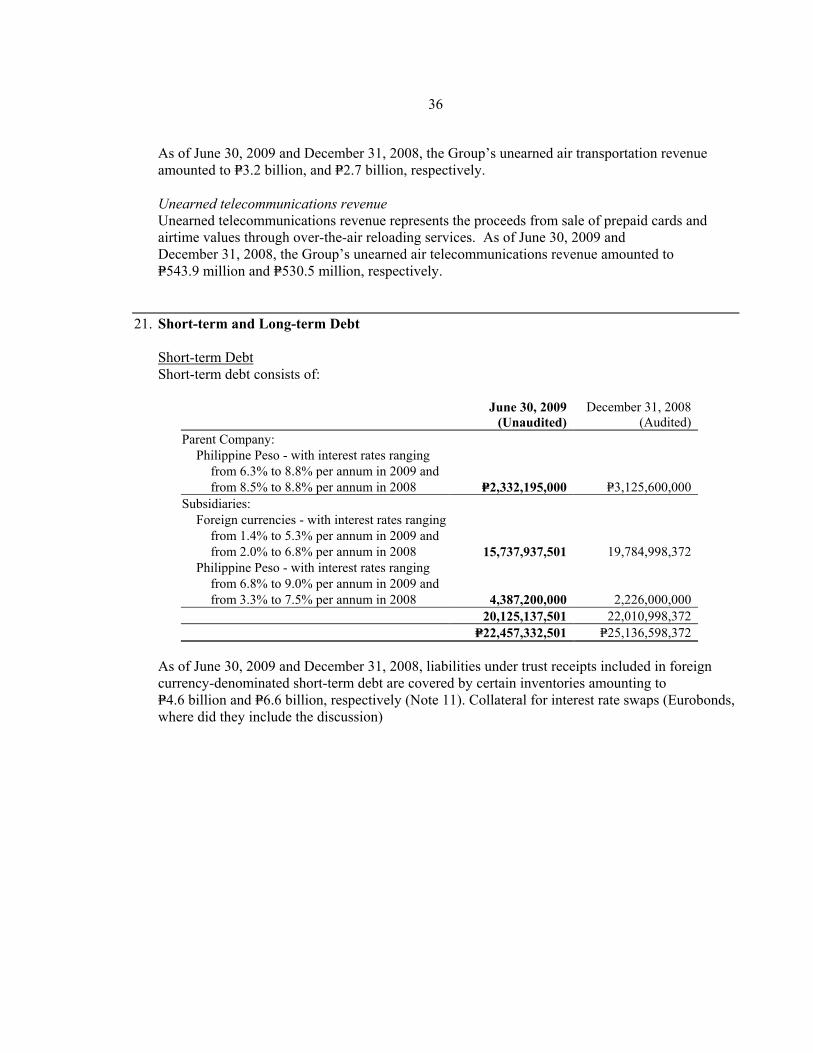
36
As of June 30, 2009 and December 31, 2008, the Group’s unearned air transportation revenue amounted to P=3.2 billion, and P=2.7 billion, respectively.
Unearned telecommunications revenue Unearned telecommunications revenue represents the proceeds from sale of prepaid cards and airtime values through over-the-air reloading services. As of June 30, 2009 and December 31, 2008, the Group’s unearned air telecommunications revenue amounted to P=543.9 million and P=530.5 million, respectively.
21. Short-term and Long-term Debt
Short-term Debt Short-term debt consists of:
June 30, 2009
(Unaudited) December 31, 2008
(Audited) Parent Company: Philippine Peso - with interest rates ranging
from 6.3% to 8.8% per annum in 2009 and from 8.5% to 8.8% per annum in 2008 P=2,332,195,000 P=3,125,600,000
Subsidiaries: Foreign currencies - with interest rates ranging
from 1.4% to 5.3% per annum in 2009 and from 2.0% to 6.8% per annum in 2008 15,737,937,501 19,784,998,372
Philippine Peso - with interest rates ranging from 6.8% to 9.0% per annum in 2009 and from 3.3% to 7.5% per annum in 2008 4,387,200,000 2,226,000,000
20,125,137,501 22,010,998,372 P=22,457,332,501 P=25,136,598,372
As of June 30, 2009 and December 31, 2008, liabilities under trust receipts included in foreign currency-denominated short-term debt are covered by certain inventories amounting to P=4.6 billion and P=6.6 billion, respectively (Note 11). Collateral for interest rate swaps (Eurobonds, where did they include the discussion)
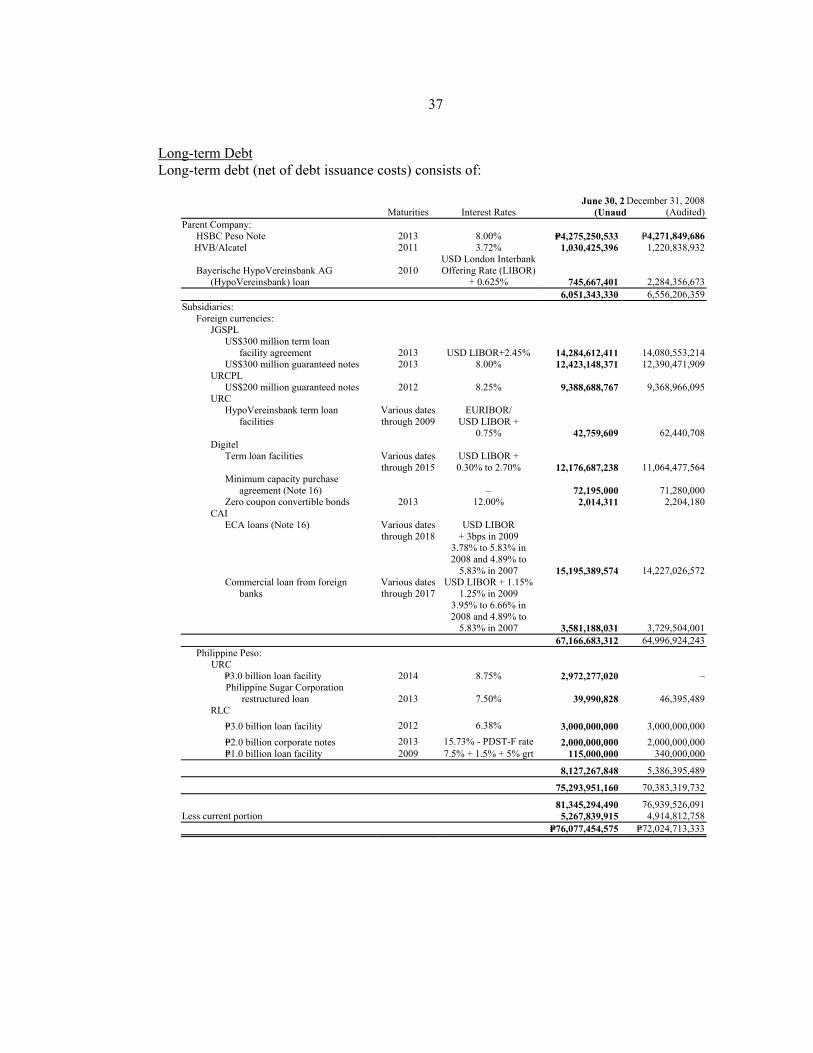
37
Long-term Debt Long-term debt (net of debt issuance costs) consists of:
Maturities June 30,
Interest Rates
2(Unaud
December 31, 2008 (Audited)
Parent Company: HSBC Peso Note 2013 8.00%
3.72% 1,030,425,396
2,284,356,673 6,556,206,359
P=4,275,250,533 P=4,271,849,686 HVB/Alcatel 2011 1,220,838,932
Bayerische HypoVereinsbank AG (HypoVereinsbank) loan
2010
USD London Interbank Offering Rate (LIBOR)
+ 0.625% 745,667,401 6,051,343,330
Subsidiaries: Foreign currencies:
US$300 million term loan
facility agreement 2013
9,388,688,767
12,176,687,238 11,064,477,564 Minimum capacity purchase
agreement (Note 16)
+ 3bps in 2009
67,166,683,312
JGSPL
USD LIBOR+2.45% 14,284,612,411 14,080,553,214 US$300 million guaranteed notes 2013 8.00% 12,423,148,371 12,390,471,909 URCPL US$200 million guaranteed notes 2012 8.25% 9,368,966,095 URC HypoVereinsbank term loan
facilities Various datesthrough 2009
EURIBOR/ USD LIBOR +
0.75% 42,759,609 62,440,708 Digitel Term loan facilities Various dates
through 2015USD LIBOR + 0.30% to 2.70%
– 72,195,000 71,280,000 Zero coupon convertible bonds 2013 12.00% 2,014,311 2,204,180 CAI ECA loans (Note 16) Various dates
through 2018USD LIBOR
3.78% to 5.83% in 2008 and 4.89% to
5.83% in 2007 15,195,389,574 14,227,026,572 Commercial loan from foreign
banks Various datesthrough 2017
USD LIBOR + 1.15% 1.25% in 2009
3.95% to 6.66% in 2008 and 4.89% to
5.83% in 2007 3,581,188,031 3,729,504,001 64,996,924,243 Philippine Peso:
URC 2014
115,000,000
P=3.0 billion loan facility 8.75% 2,972,277,020 – Philippine Sugar Corporation
restructured loan
2013 7.50% 39,990,828 46,395,489 RLC P=3.0 billion loan facility 2012 6.38% 3,000,000,000 3,000,000,000 P=2.0 billion corporate notes 2013 15.73% - PDST-F rate 2,000,000,000 2,000,000,000 P=1.0 billion loan facility 2009 7.5% + 1.5% + 5% grt 340,000,000
8,127,267,848 5,386,395,489
75,293,951,160 70,383,319,732
81,345,294,490 76,939,526,091Less current portion 5,267,839,915 4,914,812,758 P=76,077,454,575 P=72,024,713,333
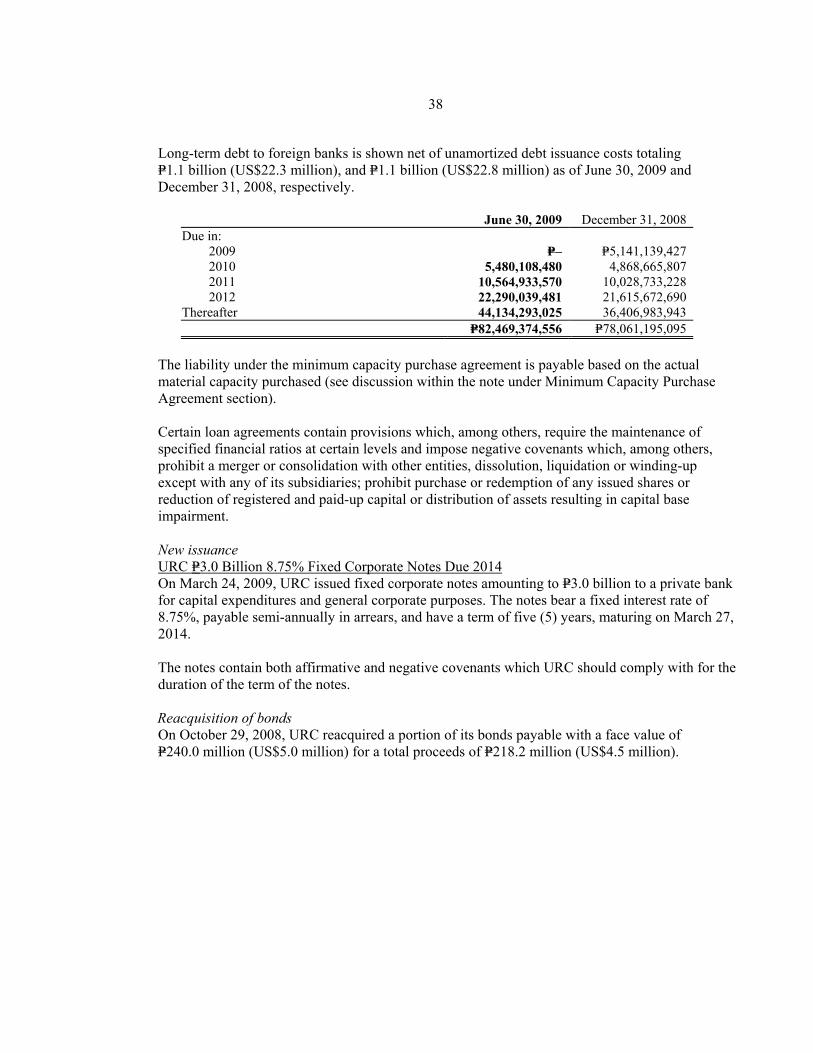
38
Long-term debt to foreign banks is shown net of unamortized debt issuance costs totaling P=1.1 billion (US$22.3 million), and P=1.1 billion (US$22.8 million) as of June 30, 2009 and December 31, 2008, respectively.
June 30, 2009 December 31, 2008 Due in: 2009 P=– P=5,141,139,427 2010 5,480,108,480 4,868,665,807 2011 10,564,933,570 10,028,733,228 2012 22,290,039,481 21,615,672,690 Thereafter 44,134,293,025 36,406,983,943 P=82,469,374,556 P=78,061,195,095
The liability under the minimum capacity purchase agreement is payable based on the actual material capacity purchased (see discussion within the note under Minimum Capacity Purchase Agreement section).
Certain loan agreements contain provisions which, among others, require the maintenance of specified financial ratios at certain levels and impose negative covenants which, among others, prohibit a merger or consolidation with other entities, dissolution, liquidation or winding-up except with any of its subsidiaries; prohibit purchase or redemption of any issued shares or reduction of registered and paid-up capital or distribution of assets resulting in capital base impairment.
New issuance URC P=3.0 Billion 8.75% Fixed Corporate Notes Due 2014 On March 24, 2009, URC issued fixed corporate notes amounting to P=3.0 billion to a private bank for capital expenditures and general corporate purposes. The notes bear a fixed interest rate of 8.75%, payable semi-annually in arrears, and have a term of five (5) years, maturing on March 27, 2014.
The notes contain both affirmative and negative covenants which URC should comply with for the duration of the term of the notes.
Reacquisition of bonds On October 29, 2008, URC reacquired a portion of its bonds payable with a face value of P=240.0 million (US$5.0 million) for a total proceeds of P=218.2 million (US$4.5 million).

39
22. Other Noncurrent Liabilities
This account consists of:
June 30, 2009
(Unaudited) December 31, 2008
(Audited) Accrued project costs P=7,379,625,485 P=6,702,497,178 Asset Retirement Obligation (ARO) 1,752,225,398 Deposits from real estate buyers and lessees (Note 21) 1,693,358,755 1,708,630,090
981,382,940 848,018,556 596,402,744
Pension liabilities 434,874,143 909,313,460
1,610,891,948
Due to related parties (Note 32) 1,504,260,574 1,481,542,198 Deposit liabilities 776,383,253 Accrued maintenance cost 650,935,361 Derivative liabilities (Note 7) 865,669,863
422,094,477 Others 843,476,926 P=16,099,462,055 P=15,062,121,294
Accrued Project Costs Accrued project costs represent costs of unbilled materials, equipment and labor relating to telecommunications projects which are already eligible for capitalization as of June 30, 2009 and 2008. The determination of costs to be capitalized is based on the contract price multiplied by the percentage of shipped materials and/or delivered services. ARO Movements in the Group’s ARO follow:
June 30, 2009
(Unaudited) December 31, 2008
(Audited) Balance at beginning of the period P=1,610,891,948 P=1,119,176,248 Capitalized to property, plant and equipment 256,440,946 493,435,242 Accretion expense (Note 31) 71,677,466 102,852,875 Payments of restorations during the year (186,784,962) (104,572,417)Balance at the end of the period P=1,752,225,398 P=1,610,891,948
Deposits from Real Estate Buyers and Lessees The Customers’ Deposits account represents cash received from tenants representing three (3) to six (6) months rent which shall be refunded to tenants at the end of lease term. The Group recognized discount on deposits from leases amounting to 102 million and 103 million as of June 30, 2009 and December 31, 2008. The related interest expense on the discount amounted to P=24 million and P=61 million in 2009 and 2008, respectively. The deposits from real estate buyers and lessees were discounted using MART 1 rates plus 2.0% spread.
In addition, other customers’ deposits represent cash received from buyers which shall be applied against the total contract price of the subdivision land, condominium and residential units that are for sale. The deposits from buyers are normally applied against the total contract price within a year from the date the deposits were made.
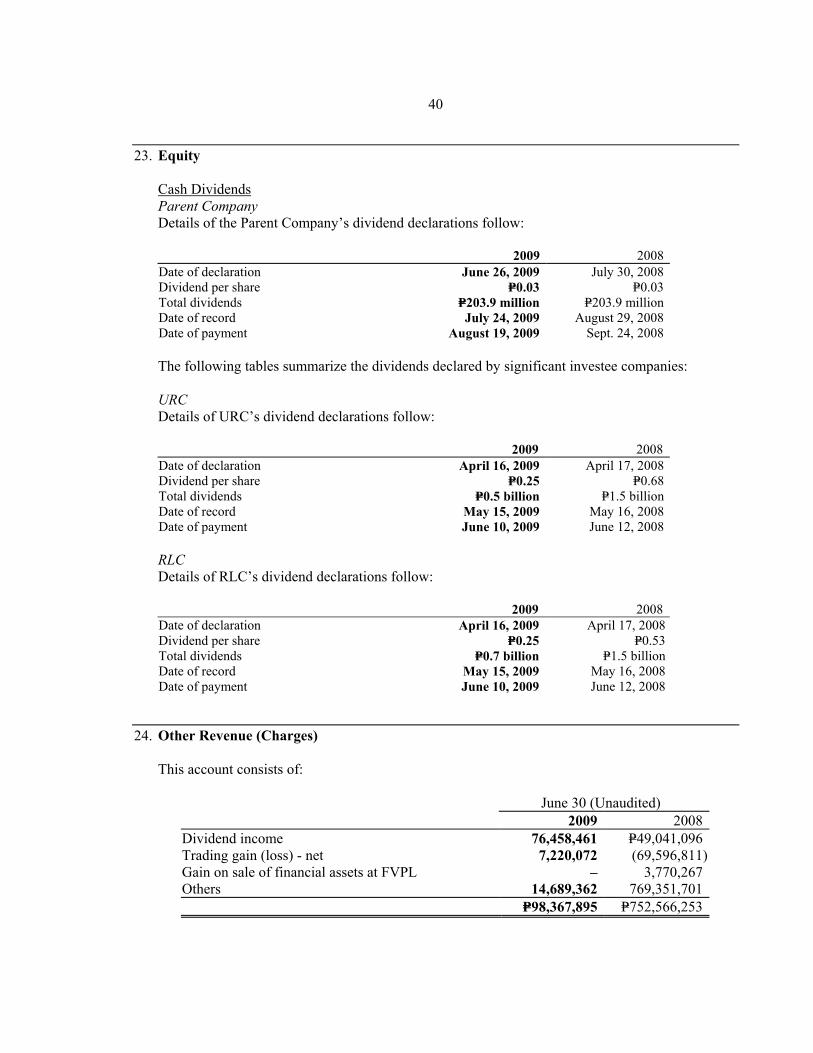
40
23. Equity
Cash Dividends Parent Company Details of the Parent Company’s dividend declarations follow: 2009 2008Date of declaration June 26, 2009 July 30, 2008Dividend per share P=0.03 P=0.03Total dividends P=203.9 million
URC
P=203.9 millionDate of record July 24, 2009 August 29, 2008Date of payment August 19, 2009 Sept. 24, 2008
The following tables summarize the dividends declared by significant investee companies:
Details of URC’s dividend declarations follow: 2009 2008 Date of declaration April 16, 2009 April 17, 2008Dividend per share P=0.25 P=0.68Total dividends P=0.5 billion P=1.5 billionDate of record May 15, 2009 May 16, 2008
Details of RLC’s dividend declarations follow:
Date of payment June 10, 2009 June 12, 2008 RLC
2009 Date of declaration
2008 April 16, 2009 April 17, 2008
Dividend per share P=0.25 P=0.53Total dividends P=0.7 billion
May 15, 2009P=1.5 billion
Date of record May 16, 2008Date of payment June 10, 2009 June 12, 2008
24. Other Revenue (Charges)
This account consists of:
June 30 (Unaudited) 2009 2008
Dividend income 76,458,461 P=49,041,096Trading gain (loss) - net 7,220,072 (69,596,811)Gain on sale of financial assets at FVPL 3,770,267– Others 14,689,362 769,351,701 P=98,367,895 P=752,566,253

41
25. Cost of Sales and Services
This account consists of:
June 30 (Unaudited) 2009 2008Raw materials used P=14,436,881,579 P=15,157,702,288Direct labor 877,681,419 Overhead cost 9,086,505,027
833,725,3047,800,517,130
Total manufacturing cost 24,401,068,025 23,791,944,722Goods in process (27,653,270) (29,924,481)Cost of goods manufactured 24,373,414,755 23,762,020,241Finished goods 243,178,404 (1,129,055,399)Cost of sales 24,616,593,159 22,632,964,842Cost of services 7,462,064,911 Cost of sales and services P=32,078,658,070
7,092,140,008P=29,725,104,850
26. General and Administrative Expenses
This account consists of:
June 30 (Unaudited) 2009 2008 Outside services P=3,551,411,893 P=3,014,319,357 Depreciation and amortization (Note 16) 2,700,167,496 2,546,444,379 Personnel expenses Rent Aircraft and engine lease 408,290,024
Repairs and maintenance Travel and transportation Taxes, licenses and fees Insurance Communication Others
1,775,339,038 1,584,043,347 956,255,373 724,583,290 903,747,599
Utilities and supplies 778,327,646 499,135,417 527,772,666 484,213,343 377,002,853 277,176,490 321,447,203 308,850,339 128,183,619 110,113,179 101,803,499 89,848,393
1,087,828,537 599,301,816 P=13,209,287,422 P=10,646,319,374
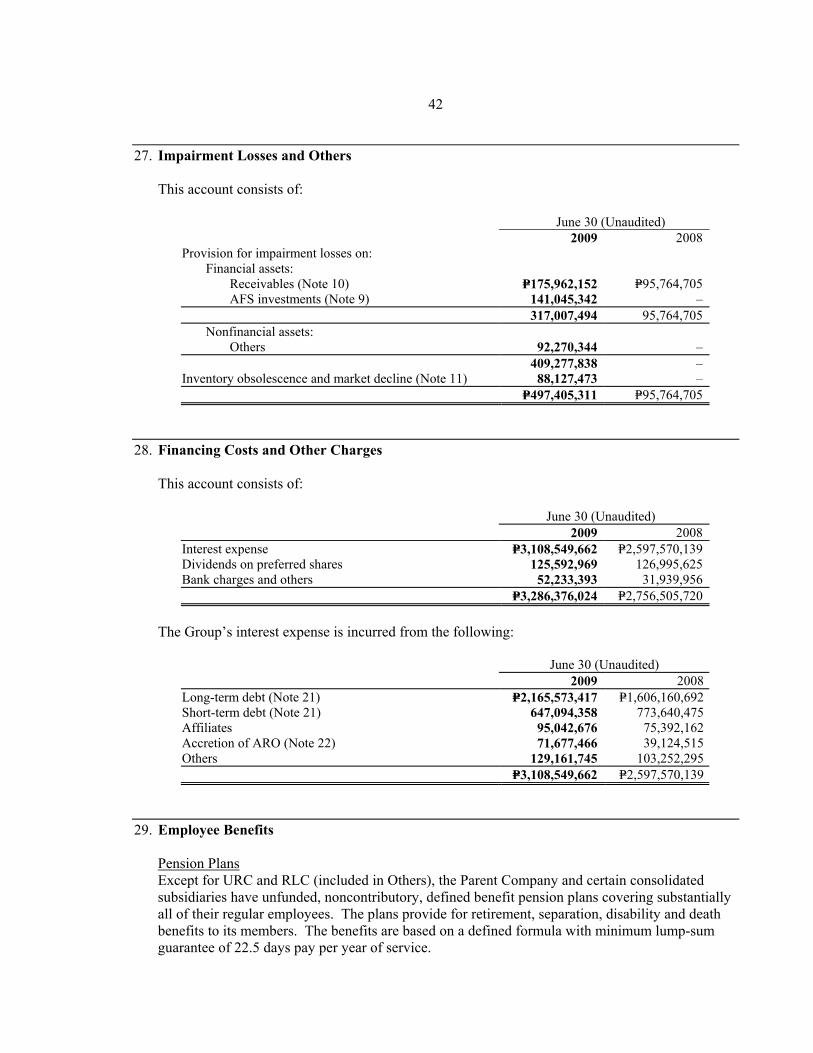
42
27. Impairment Losses and Others
This account consists of:
June 30 (Unaudited) 2009 2008 Provision for impairment losses on: Financial assets:
95,764,705
Receivables (Note 10) P=175,962,152 P=95,764,705 AFS investments (Note 9) 141,045,342 – 317,007,494 Nonfinancial assets: Others 92,270,344 – 409,277,838 – Inventory obsolescence and market decline (Note 11) 88,127,473 – P=497,405,311 P=95,764,705
28. Financing Costs and Other Charges
This account consists of:
June 30 (Unaudited) 2009 2008 Interest expense P=2,597,570,139 P=3,108,549,662 Dividends on preferred shares 125,592,969
P=3,286,376,024
126,995,625 Bank charges and others 52,233,393 31,939,956
P=2,756,505,720
The Group’s interest expense is incurred from the following:
June 30 (Unaudited) 2009 2008Long-term debt (Note 21) P=2,165,573,417 P=1,606,160,692Short-term debt (Note 21)
95,042,676 647,094,358 773,640,475
Affiliates 75,392,162Accretion of ARO (Note 22) 71,677,466 39,124,515Others 129,161,745 103,252,295 P=3,108,549,662 P=2,597,570,139
29. Employee Benefits
Pension Plans Except for URC and RLC (included in Others), the Parent Company and certain consolidated subsidiaries have unfunded, noncontributory, defined benefit pension plans covering substantially all of their regular employees. The plans provide for retirement, separation, disability and death benefits to its members. The benefits are based on a defined formula with minimum lump-sum guarantee of 22.5 days pay per year of service.

43
URC has a funded, noncontributory defined benefit pension plan covering all its regular
employees. The pension fund is being administered and managed by certain stockholders as trustees. URC, however, reserves the right to discontinue, suspend or change the rates and amounts of its contributions at any time on account of business necessity or adverse economic conditions.
Total pensions assets and liabilities recognized in the consolidated statement of financial position
follow:
June 30, 2009(Unaudited)
December 31, 2008(Audited)
Pension assets (Note 18) P=113,673,500 P=243,810,600 Pension liabilities (Note 22) 434,874,143 422,094,477
The amounts recognized as pension liabilities follow:
June 30, 2009
(Unaudited) December 31, 2008
(Audited) Present value of defined benefit obligation P=469,262,508 P=379,041,001 Fair value of plan assets (59,698,400) (57,568,490) Unfunded status 409,564,108 321,472,511 Unrecognized actuarial gain - net 25,310,035 100,621,966 Pension liabilities at end of the period P=434,874,143 P=422,094,477
URC’s pension assets for its pension plans follow:
June 30, 2009
(Unaudited) December 31, 2008
(Audited) Present value of funded obligation P=1,026,341,200 P=1,113,492,800 Fair value of plan assets 1,337,995,500 1,341,210,300 Funded status 311,654,300 227,717,500 Unrecognized actuarial losses - net (93,066,450) 16,093,100 Asset to be recognized in the consolidated
statement of financial position 218,587,850 243,810,600 Less asset not recognized due to limit 104,914,350 – Net plan assets P=113,673,500 P=243,810,600 Asset limit to be recognized in the
consolidated statement of financial position P=113,673,500 P=243,810,600 Net plan assets in excess of the asset
ceiling limit (not recognized in the consolidated statement of financial position) P=104,914,350 P=–
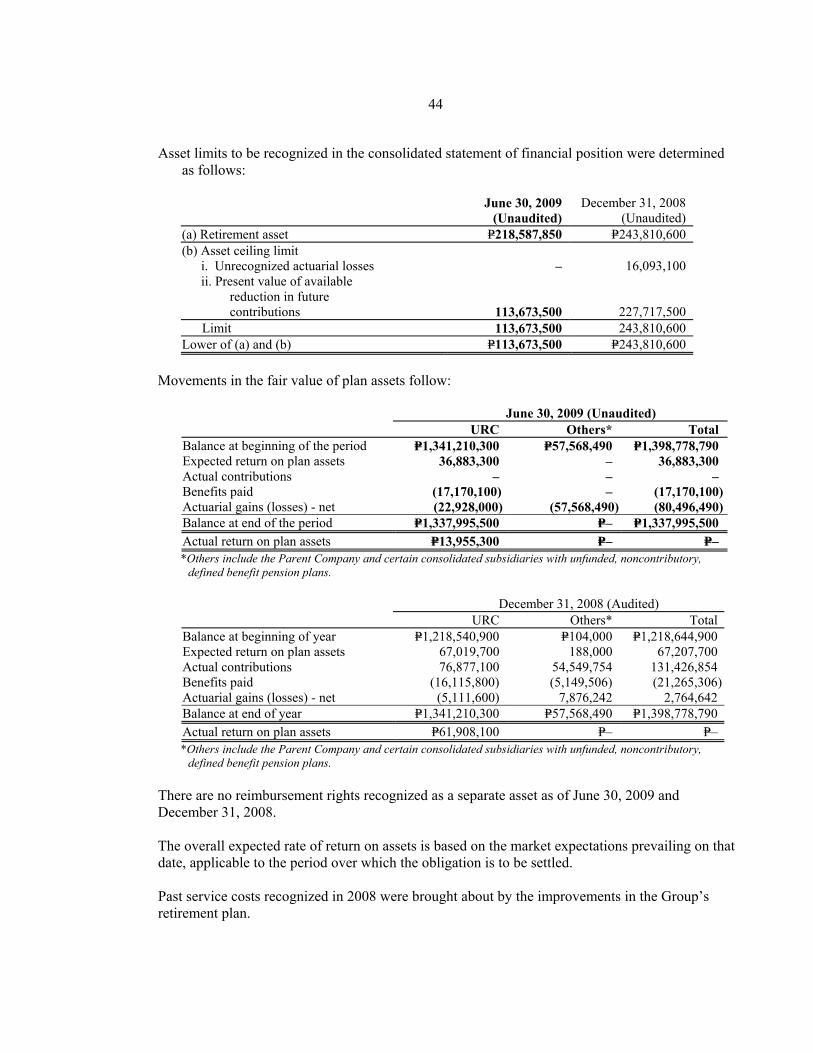
44
Asset limits to be recognized in the consolidated statement of financial position were determined
as follows:
June 30, 2009(Unaudited)
December 31, 2008(Unaudited)
(a) Retirement asset P=218,587,850 P=243,810,600 (b) Asset ceiling limit i. Unrecognized actuarial losses – 16,093,100 ii. Present value of available reduction in future contributions 113,673,500 227,717,500 Limit 113,673,500 243,810,600 Lower of (a) and (b) P=113,673,500 P=243,810,600
Movements in the fair value of plan assets follow:
URC Others* June 30, 2009 (Unaudited) Total Balance at beginning of the period P=1,341,210,300 P=57,568,490 P=1,398,778,790 Expected return on plan assets 36,883,300 – 36,883,300 Actual contributions – – –
P=1,337,995,500
Benefits paid (17,170,100) – (17,170,100)Actuarial gains (losses) - net (22,928,000) (57,568,490) (80,496,490)Balance at end of the period P=1,337,995,500 P=– Actual return on plan assets P=13,955,300 P=– P=– *Others include the Parent Company and certain consolidated subsidiaries with unfunded, noncontributory,
defined benefit pension plans.
Others*
December 31, 2008 (Audited) URC Total Balance at beginning of year P=1,218,540,900 P=104,000 P=1,218,644,900 Expected return on plan assets 67,019,700 188,000 67,207,700 Actual contributions 76,877,100 54,549,754 131,426,854
7,876,242 Balance at end of year P=57,568,490
Benefits paid (16,115,800) (5,149,506) (21,265,306)Actuarial gains (losses) - net (5,111,600) 2,764,642
P=1,341,210,300 P=1,398,778,790 Actual return on plan assets P=61,908,100 P=– P=– *Others include the Parent Company and certain consolidated subsidiaries with unfunded, noncontributory,
defined benefit pension plans.
There are no reimbursement rights recognized as a separate asset as of June 30, 2009 and December 31, 2008.
The overall expected rate of return on assets is based on the market expectations prevailing on that date, applicable to the period over which the obligation is to be settled.
Past service costs recognized in 2008 were brought about by the improvements in the Group’s retirement plan.
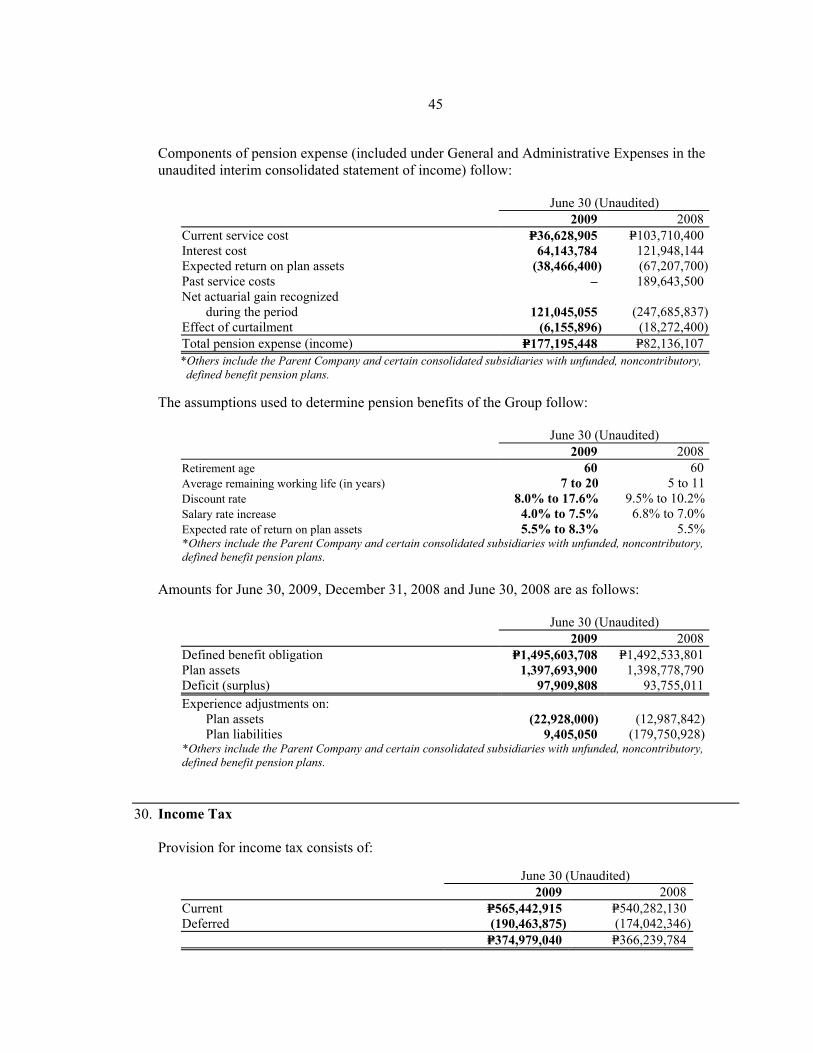
45
2009
Components of pension expense (included under General and Administrative Expenses in the unaudited interim consolidated statement of income) follow:
June 30 (Unaudited) 2008Current service cost P=36,628,905 P=103,710,400Interest cost 64,143,784
189,643,500
121,045,055
121,948,144Expected return on plan assets (38,466,400) (67,207,700)Past service costs – Net actuarial gain recognized
during the period (247,685,837)Effect of curtailment (6,155,896) (18,272,400)Total pension expense (income) P=177,195,448 P=82,136,107*Others include the Parent Company and certain consolidated subsidiaries with unfunded, noncontributory, defined benefit pension plans.
The assumptions used to determine pension benefits of the Group follow:
June 30 (Unaudited) 2009 2008Retirement age 60 60Average remaining working life (in years) Discount rate
Expected rate of return on plan assets
2009
7 to 20 5 to 118.0% to 17.6% 9.5% to 10.2%
Salary rate increase 4.0% to 7.5% 6.8% to 7.0%5.5% to 8.3% 5.5%
*Others include the Parent Company and certain consolidated subsidiaries with unfunded, noncontributory, defined benefit pension plans.
Amounts for June 30, 2009, December 31, 2008 and June 30, 2008 are as follows:
June 30 (Unaudited) 2008Defined benefit obligation P=1,495,603,708 P=1,492,533,801Plan assets 1,397,693,900 1,398,778,790Deficit (surplus) 97,909,808 93,755,011Experience adjustments on: Plan assets (22,928,000) (12,987,842) Plan liabilities 9,405,050 (179,750,928)
30. Income Tax
*Others include the Parent Company and certain consolidated subsidiaries with unfunded, noncontributory, defined benefit pension plans.
Provision for income tax consists of:
June 30 (Unaudited) 2009 2008 Current P=565,442,915 P=540,282,130 Deferred (190,463,875) (174,042,346) P=374,979,040 P=366,239,784
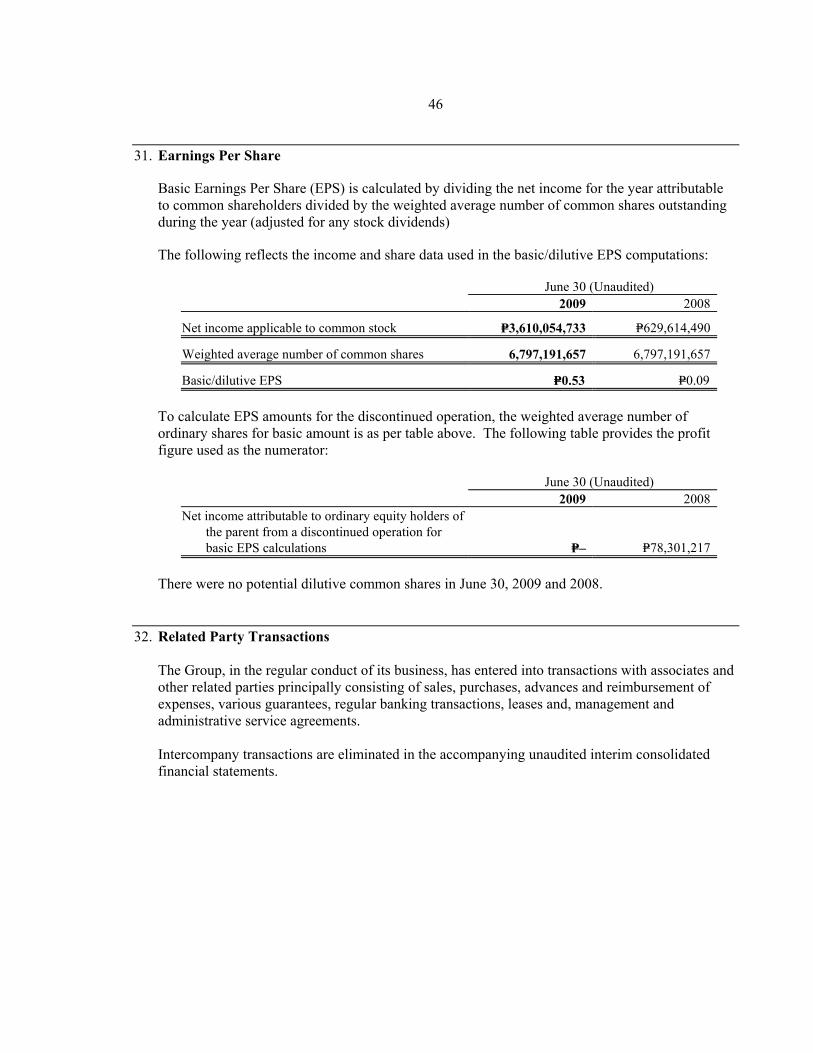
46
31. Earnings Per Share
Basic Earnings Per Share (EPS) is calculated by dividing the net income for the year attributable to common shareholders divided by the weighted average number of common shares outstanding during the year (adjusted for any stock dividends)
The following reflects the income and share data used in the basic/dilutive EPS computations:
June 30 (Unaudited) 2009 2008
Net income applicable to common stock P=3,610,054,733 P=629,614,490
Weighted average number of common shares 6,797,191,657 6,797,191,657
Basic/dilutive EPS P=0.53 P=0.09
To calculate EPS amounts for the discontinued operation, the weighted average number of ordinary shares for basic amount is as per table above. The following table provides the profit figure used as the numerator:
June 30 (Unaudited) 2009 2008 Net income attributable to ordinary equity holders of
the parent from a discontinued operation for basic EPS calculations P=– P=78,301,217
There were no potential dilutive common shares in June 30, 2009 and 2008.
32. Related Party Transactions
The Group, in the regular conduct of its business, has entered into transactions with associates and other related parties principally consisting of sales, purchases, advances and reimbursement of expenses, various guarantees, regular banking transactions, leases and, management and administrative service agreements.
Intercompany transactions are eliminated in the accompanying unaudited interim consolidated financial statements.

47
Related party transactions not eliminated are as follow:
June 30, 2009
(Unaudited) December 31, 2008
(Audited) Due from related parties - net (Note 10) P=2,076,551,434 P=2,077,687,618 Due to related parties (Notes 19 and 22) 2,447,401,332 2,034,858,283
The compensation of the Group’s key management personnel by benefit type follows:
June 30, 2009
(Unaudited) December 31, 2008
(Audited) Short-term employee benefits P=669,210,411 P=1,211,562,136 Post-employment benefits 34,263,573 71,912,721 P=703,473,984 P=1,283,474,857
There are no agreements between the Group and any of its directors and key officers providing for benefits upon termination of employment, except for such benefits to which they may be entitled under the Group’s pension plans.
33. Other Commitments and Contingent Liabilities
RLC Capital Commitments RLC has contractual commitments and obligations for the construction and development of investment properties and equipment items aggregating P=5.7 billion as of June 30, 2009 and P=6.1 billion as of September 30, 2008. Moreover, RLC has contractual obligations amounting to P=2.3 billion as of March 31, 2009 and September 30, 2008 for the completion and delivery of real estate units that have been presold.
CAI Aircraft Purchase Commitments As of December 31, 2007, CAI has existing commitments to purchase ten (10) additional new Airbus A320 aircraft, each amounting to P=3.0 billion (US$64.4 million). The ten (10) aircraft which the Company has placed firm orders for are scheduled to be delivered between 2010 and 2012.
Also in 2007, CAI has a commitment to purchase six ATR 72-500 turboprop aircraft and has exercised an option to purchase additional four ATR 72-500 turboprop aircraft. These turboprop aircraft will cater to destinations in the country's smaller airports. CAI has taken delivery of the initial six aircraft in 2008 and the remaining are scheduled to be delivered in 2009 of which two were received during the first quarter of 2009.

48
The above-indicated commitments principally relate to CAI’s re-fleeting and expansion programs.
JGSPC JGSPC has an existing technology and licensing agreement with a foreign company covering the construction, manufacture, use and sale of the PP and PE lines. In further consideration for the rights granted to JGSPC, pursuant to the licensing agreement, JGSPC shall pay the foreign company a running royalty fee equivalent to a certain sum for each metric ton of resin sold up to the end of the royalty term. The technology licenses of JGSPC have been fully impaired in 2006.
Digitel Digitel has existing agreements with various telecommunications carriers and operators, local exchange carriers, international exchange carriers, CMTS operators, paging and trunk radio operators, provincial operators and with the Philippine Government to cover the following services:
a. International telecommunications operation services between servicing points in another
country where the other party is domiciled and Digitel’s terminals servicing points in the Philippines.
b. National and international private leased circuit services on a reciprocal basis between the other party and Digitel in the timely support of services to their respective customers.
c. Internet transport and access services and other telecommunications services that may be introduced from time to time.
d. Interconnection of Digitel’s CMTS network with the CMTS, local exchange, inter-exchange and international gateway facilities with the telecommunications network of other domestic telecommunications carriers.
Digitel has a commitment to construct, install, operate and maintain a nationwide CMTS using GSM technology. Prior to the assignment of the PA to DMPI, Digitel entered into a supply agreement with foreign suppliers including their local affiliates for Phases 1 to 4 of the said project. Digitel and DMPI have incurred costs for said project totaling to P=19.6 billion in 2008 and 2007.
Off-Statement of financial position Items In the normal course of a RSBC’s operations, there are various outstanding contingent liabilities and bank guarantees which are not reflected in the accompanying unaudited interim consolidated financial statements. The subsidiary bank does not anticipate material unreserved losses as a result of these transactions.
Following is a summary of RSBC’s commitments and contingent liabilities at their equivalent peso contractual amounts:
June 30, 2009 December 31, 2008 (Unaudited) (Audited)Trust and Investment Group accounts P=1,385,098,748 P=969,707,440Late deposit/payment received 6,322,747 77,809,849Outward bills for collection 548,036 547,943Items held for safekeeping
38,390 32,662Other contingent accounts 25,958 20,000

49
Others The Group has various contingent liabilities arising in the ordinary conduct of business which are either pending decision by the courts, under arbitration or being contested, the outcome of which are not presently determinable. In the opinion of management and its legal counsel, the eventual liability under these lawsuits or claims, if any, will not have a material or adverse effect on the Group’s financial position and results of operations. The information usually required by PAS 37, Provisions, Contingent Liabilities and Contingent Assets, is not disclosed on the grounds that it can be expected to prejudice the outcome of these lawsuits, claims, arbitration and assessments.
34. Reportable Non-adjusting Subsequent Events
On June 30, 2009, RLC was granted by the SEC permit to sell bond securities worth P=5 billion. The bonds bear 8.5% fixed interest rate and will mature on July 14, 2014. Interest is payable semi-annually. Under the terms of the bond issue, RLC shall maintain a minimum net interest coverage ratio of 1:5:1 and a debt to equity ratio of not exceeding 1.5:1. The bonds were issued on July 13, 2009.
On August 11, 2009, the SEC granted RLC another permit to sell bond securities worth P=5 billion. The fixed interest rate bearing bonds will be issued on August 26, 2009 and will mature on August 27, 2014. Interest is payable semi-annually. Under the terms of the bond issue, RLC shall maintain a minimum net interest coverage ratio of 1.5:1 and a debt to equity ratio of not exceeding 1.5:1.
35. Reclassification
Certain accounts in the 2008 audited financial statements were reclassified to conform with the June 30, 2009 presentation which takes into account the fundamental nature and significance of the transactions as well as general financial statement presentation.
The table below shows the details of accounts reclassified:
From Reclassified 2008
P=491,109,936
to
Other current assets Property Plant and Equipment - Construction-in-progress
Other noncurrent assets Property Plant and Equipment - Construction-in-progress 2,362,249,705

JG SUMMIT HOLDINGS, INC. AND SUBSIDIARIESAGING OF RECEIVABLESJune 30, 2009
OVER SIXUP TO SIX MONTHS TO OVER ONE
TOTAL MONTHS ONE YEAR YEARTrade Receivables 13,099,010,744 9,620,297,015 2,850,106,427 628,607,301 Less: Allowance for
impairment loss (2,152,561,123) (1,523,953,822) (628,607,301) Net Trade Receivables 10,946,449,621 9,620,297,015 1,326,152,606 -
Non-trade ReceivablesFinance Receivables (including noncurrent portion) 7,690,041,539 6,524,182,602 1,165,858,937 Others 6,014,697,923 4,562,701,928 280,935,988 1,171,060,007
13,704,739,462 11,086,884,530 280,935,988 2,336,918,944 Less: Allowance for
impairment loss (1,340,964,437) (154,921,757) (14,982,673) (1,171,060,007) Net Non-trade Receivables 12,363,775,025 10,931,962,773 265,953,315 1,165,858,937
23,310,224,646 20,552,259,788 1,592,105,921 1,165,858,937