jesse dill ghg proof may28th
TRANSCRIPT

GHG MODELING TOOL: EVALUATION OF THE IMPACTS OF LAND USE
DECISIONS ON GHG EMISSIONS
Jesse Dill – Associate Member
Sustainability Solutions Group

land use-GHG connection
building form
energy supply
transportation behaviour
waste
local agriculture
land use changes24,711 tC02e
anti-idling campaign
30 hybrids for city staff
carbon offsets
energy-efficiency education
plant 5000trees
LED street lights
car poolingprogram

introducing GHGProof…
What is the purpose of the model?
what land use aspects are captured?
how can it be used?
What is the process?
what do the results look like?
a pioneering, innovative decision-making tool to enable planning processes to
include GHG emissions impacts
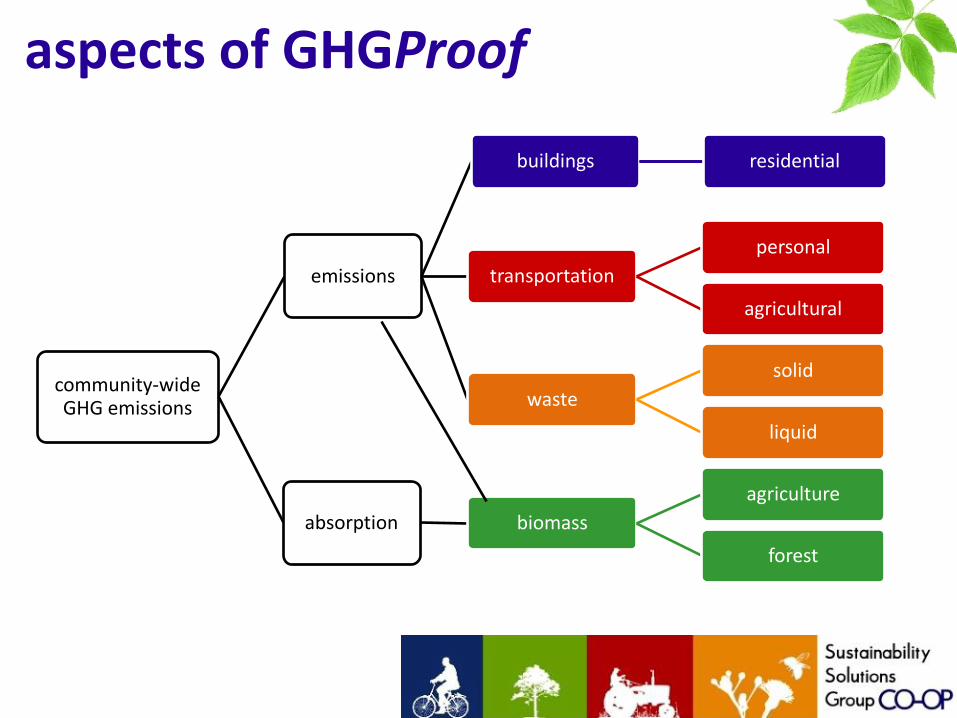
aspects of GHGProof
community-wide GHG emissions
emissions
buildings residentialresidential
transportation
personal
agricultural
waste
solid
liquid
absorption biomass
agriculture
forest

aspects not included
buildings
• industrial uses
• embodied energy
• micro energy generation
transportation
• modal shifts to cycling
• commercial transport
• transport of waste
• trips outside municipal boundary
• air and water travel
waste
• construction for sewer extensions

possible uses
assess community/regional plans
set a GHG reduction target
develop policy to achieve target
future proofing
evaluate development proposals

modeling processbuilding a scenario

GIS analysis to assess land use pattern
modeling process

GHGTRANSPORTATION = (average trip length)(total # of trips)(% of trips by vehicle)(emissions factor)
Longer VKTs in rural areas Shorter VKTs in urban areas
GIS analysis to assess VKT
modeling process

automatic calculations
real time changes
rapid generation of scenarios
modeling processexcel-based calculator
e.g. building form calculation
Buildings (tC02e)=
(# of buildings by type)*
(energy per area)*
(emissions factor )*
(average floor area)/
1000 kilograms

model results
GHG (tC02e)
tCO2
Transportation Trip length 0
Mode shift 0
Public transport 0
Sub-total 0
% of Total 0%
Road Road length, asphalt 0
Road length, gravel 0
Sub-total 0
% of Total 0%
Buildings Process energy 0
Community energy 0
Sub-total 0
% of Total 0
Waste Solid 0
Liquid 0
Sub-total 0
% of Total 0%
Biomass Agriculture- local food 0
detailed impacts of each variable on GHGs
total & per capita GHG emissions summary
chart generation
detailed and summarized results

accessing GHGProof
Jesse Dill, Associate MemberSustainability Solutions [email protected]
free for non-profit purposes;
users must share changes they make at:
http://www.sustainabilitysolutions.ca/landuse