jelbart dairy thursday may 10, 2018 - datagene.com.au · lyn parish winchelsea south, vic sam...
TRANSCRIPT

A gathering of the Australian dairy industry
for one special day in May
THE
Thursday
Jelbart Dairy
May 10, 2018
Program &Proceedings
Muster delivery partner

The ImProving Herds project would not have been possible without the collaboration of a team of dairy farmers from around Australia. We thank each and every one of the following people, their family and staff, for the contribution they have made.
Josh Balcombe Warrion, VIC
Guy & Leanne Gallatly Maffra, VIC
Brad & Meagan O’Shannessy Cooma, VIC
Brandan Martin Bamawm, VIC
Nathan Shannon Katunga, VIC
Jared & Courtney Ireland Lockington, VIC
Patrick Glass Gundowring, VIC
Sarah Chant Warrion, VIC
Mark Billing & Sam Simpson Larpent, VIC
Linda Whiting Simpson, VIC
Lyn Parish Winchelsea South, VIC
Sam McCluggage Allansford, VIC
Anthony Eccles Purnim, VIC
Paul & Adam Lenehan Crossley, VIC
Trevor Saunders & Anthea Day Shady Creek, VIC
Tim Missen Denison, VIC
Toby Leppin Bena, VIC
...continues inside back cover

This material is published for your information only. It is published with due care and attention to accuracy but DataGene and the ImProving Herds collaborators accept no liability if, for any reason, the information is inaccurate, incomplete or out of date, whether negligent or otherwise.
© 2018 Published by DataGene on behalf of the ImProving Herds project. All rights reserved. No part of this publication may be reproduced without prior written permission of DataGene Limited.
NorthernTerritory
Queensland
New South Wales
ACT
Tasmania
South Australia
Western Australia
Victoria
Location of Improving Herds Focus Farms


Page 1
Contents2 Foreword
3 Thank you
4 Program
6 Papers
6 Balanced Performance Index (BPI)
7 How genetics is changing our business
10 The ‘next gen’ Jelbarts and the practical impact of the ImProving Herds project
16 ImProving Herds results: comparing high and low BPI cows
18 Comparing historical performance in the Jelbart herd
20 Genetics Progress Report
22 Genomics at Jelbart Dairy
24 Getting started with genomic testing
25 Howgeneticscontributestoprofitonourfarm
28 Genetic Futures Report coming soon
29 Using Good Bulls on a budget
33 Using data to make better decisions and a stronger business
37 Glossary of Terms
38 The story of our Muster caterers
Page 2
Foreword I have had the honour of leading the ImProving Herds project on behalf of the Australian dairy industry supported by the Gardiner Dairy Foundation and Dairy Australia. The project brought together world-class experts in a collaboration of the dairy industry, with the aim of turning complex science into simple, data-driven decisionstodeliverprofitstofarmers.
We have shown that making decisions based on Australian Breeding Values (ABVs) and data pays. Over the course of the Muster you will see these resultsfirsthand,butI’lltaketheopportunitytosummarise some of the key insights here and you can read more in the reports that follow.
At the core of the ImProving Herds project were 34 inspiring focus farms. For the 27 ‘Genetics Focus Farms,’ the emphasis was on demonstratingthefinancialimpactoftheuseofhigher genetic merit bulls, and from genotyping heifers. For the seven ‘Herd Test Focus Farms,’ the emphasis was on the impact of herd testing on the farm business. We are immensely grateful to all the ImProving Herds focus farmers, but today our particular thanks go to the Jelbart family and staff for hosting the Muster.
The project has shown that compared to their herd contemporaries. Cows with a high Balanced Performance Index (BPI) have higher margins over feed and herd costs. On average the top 25% of cows (based on BPI) have a $300/cow/year greater margin over feed and herd costs than the bottom 25%. Using more than 10 years of financialandherddataon7,700lactationsfrom2,600 cows, the top 25% of cows produced 88kg more milk solids per cow per year and lasted on average 8 months longer. The additional feed demands of high BPI cows were easily recouped through additional milk income.
Genotyping of heifer calves is increasing in popularity in many countries as a tool to: 1) help choose replacements based on ABV(g)s; 2) improve mating decisions by using high value (sexed) semen for elite animals; 3) reduce errors in parentage assignment.
The ImProving Herds project evaluated the relationship between pre-calving ABV(g)s and firstlactationproductionrecordsintheGeneticFocus Farms. The results showed that there was a strong relationship between ABV(g)s and production records. In fact, the relationship is very similar to published national mean reliabilities for equivalent traits.
After accounting for the cost of genotyping, we havecalculatedthatthebenefitofpickingthetop 50% of replacements based on genomic BPI is typically worth about $40/head more than using parent average.
In addition to the Genetic Focus Farms, seven more went under the microscope for herd-testing and shared their experiences with the ImProving Herds team. Six out of seven decided to continue herd-testing after the project was complete. All used the herd-test information in decision making, with four saying that herd-test data was especially valuable to help them respond to high pressure events. After a short period of time, the seventh farm, who had discontinued herd-testing at the end of the project, started back up again because they found they missed the data and couldn’t make the management decisions they wanted to.
Assessing the impact of genetic improvement of dairy cattle on the environment was one of the activities of ImProving Herds. Selecting for high BPI leads to a reduction in greenhouse gas emissions because high BPI cows are more efficientproducersandlivelonger,whichleadsto lower greenhouse gas emissions per unit of product. Even though per cow greenhouse gas emissions are increasing (as milk volumes and feed intake increase), the rate of increase is slower for BPIthanitspredecessorAustralianProfitRanking(APR), which is partly attributable to having the Feed Saved ABV included in the BPI.
ImProving Herds has been an exciting journey. Although we have faced challenges on the way, wehavebenefitedenormouslyfromthereal-world insights provided by our focus farms. I’d like to personally thank you each for being involved. I’d also like the thank the many people who have contributed to the project. The ImProvingHerdsfindingsaresomuchricherforhaving such a diverse team involved: farmers, scientists, economists, breeding advisors, herd improvement specialists, vets, management consultants and communication specialists.
Finally, I do hope you enjoy your day at the Muster and take the opportunity to talk to the ImProving Herds team and of course use the information for your business.
Jennie PryceImProving Herds, Project leader Agriculture Victoria

Page 3
Thank you Thank you to the many organisations and people who have contributed to the ImProving Herds project over the past three years.
Our fundersThe Gardiner Dairy Foundation, Dairy Australia
Collaborating organisations Agriculture Victoria, Dairy Australia, DataGene, Holstein Australia, NHIA
Our Focus Farmers(See who they are on the inside covers of this booklet)andinparticularourfielddayhosts, the Jelbart Family.
Industry organisations who provided direct supportGippsDairy
Dairy Express
FarmWest
HICO
National Herd Development
Tas Herd
Zoetis
Project Steering Committee Craig Lister, Farmer Chair
Donagh Berry, Teagasc, Ireland
Alison van Eenennaam, University of California – Davis, USA
John Harlock, Farmer
Sophie Hester, Farmer
Mary Harney, The Gardiner Dairy Foundation
Ben Hayes, University of Queensland
Matt Shaffer, Dairy Australia/DataGene
Jennie Pryce, Agriculture Victoria
Project Management Committee Jennie Pryce, Project Lead, Agriculture Victoria
Michelle Axford, DataGene
Sarah Chaplin, Agriculture Victoria
Paul Douglas, Holstein Australia
Graeme Gillan, NHIA/Holstein Australia
Aaron Gosling, The Gardiner Dairy Foundation
Ben Hayes, University of Queensland
Jane McLennan, Dairy Australia
Carol Millar, NHIA
Jo Newton, Agriculture Victoria
Erika Oakes, DataGene
Beth Scott, Dairy Australia
Matt Shaffer, DataGene
Bill Wales, Agriculture Victoria
The extended project teamGlen Barrett, DataGene
Fiona Conroy, Nicon Rural Services
Phuong Ho Ngoc, Agriculture Victoria
Esther Jones, Bluesee
Lee-Ann Monks, DataGene
Richard Shephard, Herd Health
Lucy Webb-Wilson, DataGene
Peter Williams, DataGene
Specialist inputDan Armstrong, D-Arm
Gerard Brislin, Genetics Australia
Peter DeGaris, Tarwin Veterinary Group
Christie Ho, Agriculture Victoria
Jacqui Knee, RMCG
Paul Groves, Farm Management Consultancy
Bill Malcolm, University of Melbourne
John Mulvany, OMJ Consulting
Natalie Nelson, Agriculture Victoria
Ruth Nettle, University of Melbourne
Daryl Poole, RMCG
Ross Read, Murray Dairy
Helen Quinn, Dairy Australia
Claire Waterman, Agriculture Victoria

Page 4
Program 9.30 Arrival and morning tea
10.00 Welcome to the National Muster - MC Esther Jones
10.05 The next generation Jelbart StoryTim Jelbart is the youngest of the Jelbart sons and has taken on the job of general manager, Jelbart Dairy, since the passing of his late father and industry leader Max Jelbart. Tim has generously agreed to share his journey of the last two years, how the farm business has been restructured to cope with the rigours of co-ownership, reporting to a board, implementing management systems and how he is also using sciencetohelpmakeprofitabledecisions.
10.25 Making sense of science: Alison van Eenennaam interviews Jennie Pryce Alison van Eenennaam is a US-based, Melbourne born-and-bred scientist with a gift for making complex science easy. She has sat on the steering committee for the ImProving Herds project and is well placed to extract and discuss the keyImProvingHerdsfindingswithourprojectleadscientist,DrJenniePryce.Together, Alison and Jennie will provide the business case supporting the call to action for Australian dairy farmers to extract unbeatable dollar value out of using genetic tools and systems.
10.55 The independent financial analysis: Farm consultant John Mulvany sits on the Jelbart Dairy advisory committee and has a bird’s eye view of the approach Tim is now taking to using dairy science to make decisions. He provides the hard-hitting farm consultant’sviewastohowtousegeneticinformationtomakeprofitabledecisions.
11.15 Western Districts farm case study: This session looks at how Sam and Christine McCluggagefromAllansfordhavequantifiedtheprofitgainfrommakingbreedingdecisions that are based on the Balanced Performance Index.
11.35 The role of Gardiner Dairy Foundation: Gardiner’s Caitlin Scofield provides a timely reminder about the role the Foundation has played in making today happen.
11.40 The Genetic Futures Report: DataGene’s Erika Oakes provides industry with its look at the tool that enables dairy farmers to look into the future and quantify the impact thataselectedbullteamwillhaveontheirherd’sfutureprofitability.
11.50 Mini Break (20 mins) – Delegates break into 3 groups for sessions that run for 45 minutes, then lunch; and then repeat. This means delegates choose to attend 2 out of the 3 sessions that are on offer.

Page 5
12.10pm Delegates choose one of these sessions before lunch and one session after
Session 1: Meet the farmers
Session 2: Understanding the profit contribution from high vs low BPI cows
Session 3: The true value of genomic testing your calves
Hosted by DataGene’s Erika Oakes - in the marquee
Presented by 3 Focus Farmers
Hosted by DataGene’s Pete Williams in the cattle yards
Supported by Mike Kilkenny (Jelbart Dairy’s farm manager); Gerard Brislin (Genetics Australia) and Peter DeGaris (Jelbart Dairy’s vet), Jo Newton (AgVic)
Lead presenter DataGene’s Lucy Webb-Wilson in the calf shed
Supported by Libby and Kerrie - the Jelbart Dairy’s star calf-rearers and assistant farm manager Will Ryan and Beth Scott (Dairy Australia)
Tim Jelbart -Discussesthefinancialimplications of his approach to breeding decisions using the new tools available to him.
Jared Ireland - Draws the ‘strawman’ of how to pick a bull team that will improve your herd’s long-term profitabilityatanaverageof $16/straw.
Brad O’Shannessy - Shares with us his journey from tough times to better times, built on making astute business decisions through optimising herd test data.
A highly interactive session that looks at the rankings and actual performance of high and low BPI cows. We also consider:
• How vets ‘love’ low ranked BPI cows as they are the ones that keep the vets in business; and
• How simple corrective mating can take the bottom 25% of a herd according to BPI - and increase overall BPI within two generations.
A session that explains how the Jelbart Dairy business is using genomic tests on heifer calves to make decisions and the resulting financialbenefitthisisoffering.
We include a simple demonstration of how to take hair samples for genomic testing; and then hear from calf rearers Libby and Kerrie, who share their secrets to remarkable calf rearing.
1.00pm Lunch
1.30pm Delegates choose a second session to attend
2.30pm Closing message from GippsDairy Chair, Grant Williams

Page 6
Balanced Performance Index (BPI)
The Balanced Performance Index is one of three breeding indices used by the Australian dairy industry. The others are the Health Weighted Index (HWI) and the Type Weighted Index (TWI).
AllthreeindicesaccountforthetraitsthataffectprofitandlongevityinAustraliandairyherds.Thedifferenceisintheemphasisgiventospecifictraits.Eachindexreflectsadifferentbreedingobjective.
Balanced Performance Index (BPI).
An economic index that blends production, health and type traits for maximumprofit.Itreflectsmostfarmers’preferences.
Health Weighted Index
Allows farmers to fast track traits such as fertility, mastitis resistance and feedefficiency.
Type weighted Index
Allowsfarmerstofinetunetypetraitstomakeagoodherdevenbetter.
Good BullsTheeasiestwaytoimprovethegeneticmeritforprofitofyourherdistoalways use Good Bulls to breed replacements. Bulls that carry the Good Bulls icon meet DataGene’s minimum criteria for Balanced Performance Index (BPI), reliability and are available for purchase. There is a wide range ofGoodBulls,leavingplentyofroomforindividualprioritiesforspecifictraits, budget and company preferences.

Page 7
How genetics is changing our business
Genetic tools and diversification of the farm business have enabled Jelbart Dairy to create a diverse income stream, providing a valuable buffer against milk price variability.
Farm stats (April 2018)
Herd size: Approx. 1000 cows in a closed herd
Breed: Transitioning to pure Holstein
Farm size: 870ha of owned and leased land – milking off 360ha
Calving pattern: Approx. 60% autumn, 40% spring
Dairy: 60-unit rotary with milk meters & automatic cup removers
Staff: 13 full time labour units including family
Feeding system: Approx. 2.5 - 3.0t concentrate/cow/year to supplement dryland perennial ryegrass pastures. All silage and hay produced on site.
Our farmMy parents, Max and Barbe, started on the current farm in 1981 with 110ha and 127 cows after taking over from the sharefarmer on the property. In 1985, the old herringbone dairy was expanded from a 9 aside swing over to a 20 aside double up, milking around 230 cows. By 1993, they had expanded the farm to 165ha and were milking 400 cows in a newly built 60-unit rotary with a 25,000L vat. The herd gradually grew to 1,000 cows and the milking platform expanded to 360ha.
My two brothers - George and Will - and I grew up on the dairy, but Dad always encouraged us to get skills away from the farm. I went to RMIT University and completed a Bachelor of Applied Science (Property Valuation) and worked in Melbourne for 3 years before moving to Sydney with my wife, Trish.
In 2013 we began succession planning with a view to Max and Barbe stepping back from the business to pursue their lifestyle interests, but things changed very quickly. Mum passed away in February 2014 and 8 months later, Dad became sick and was diagnosed with cancer. My wife and I moved back to Inverloch in 2015, and I started as General Manager to operate the family business, which at the time included the 1000 cow farm at Leongatha South, and Caldermeade Farm & Cafe with 400 cows and a café.
By the time Dad passed away in May 2016, we had completed our succession planning and had management structures in place. We created a family board with myself and my two brothers as directors, along with two external advisors. The board meets quarterly for three to four hours to discuss budgets and planning, along with longer term objectives. It was an extremely challenging time with a lot happening and the dairy industry being on its knees after the milk price crash in April 2016. The great thing about having the board was that we were very objective about the decisions we made. In 2017, we made a conscious decision to consolidate the business and focus on the main farm at Leongatha South by selling Caldermeade Farm & Café.
Today, at Leongatha South we operate across 870ha of owned and leased land, milking 1000 predominantly Holstein cows, and 1000 followers made up of Holstein calves and young stock. The milking platform covers 360ha of perennial ryegrass pasture and the balance of 510ha is used for young stock and fodder production. We have a predominantly Holstein herd and split calving, with 60% calving in autumn and 40% in spring. We have some crossbred cows in the herd, but are gradually transitioning to a pure Holstein herd. Our farm business operates with a staff of 13 full time equivalent labour units which includes family members, and we do everything on farm except for chemical spraying.

Page 8
Our production target for the herd is to produce 8000-9000L/cow with 600-625kg milk solids/cow, with moderate to high supplementary feeding of 2.5 – 3.0 t/cow/year of concentrates.
Changes in farm managementOur farm business has undergone some major changes as part of the succession process. Dad had a passion for genetics and was always striving to achieve the best, using Genetics Australia to help guide his decision making. I grew up on the farm but I’ve had very little experience in breeding, feeding cows, growing grass or employing people, which made it tough when I returned home. Through my prior rural valuation work, I’ve had a lot of experience doing spreadsheets, budgets and cashflowsandIhaveaveryanalyticalmind.Whenthingsturnedtoughonthefarm,itwastheseskillsthat helped our business manage the downturn in the dairy industry because we could identify where we were making money, where we were losing money and where to invest - we could make informed decisions rather than emotional or uninformed ‘off the cuff’ decisions.
Dad had a fantastic ‘gut feel’ of what to do and a natural intuition and experience on how to farm. He made decisions on the run and got most of them right. With limited farming knowledge, I can’t do that so I use spreadsheets, rely on experts and have a great support network around me. When Dad died, we were very lucky to have the support of a lot of good people, including our farm manager Mike Kilkenny, who were prepared to mentor my brothers and I on running the business and the day to day operations. We have built a team of skilled staff that each have particular expertise so the business is never reliant on any one person to continue to operate.
My role involves making the big picture decisions and being the conduit between the farm and the board, whereas our farm manager Mike implements the day to day running of the farm, whilst also having input into the bigger picture planning. We recently employed Will Ryan as an assistant farm managertoMiketogiveusfurtherflexibilityinmanagementandassistwithherdhealth.
Our business is continuing to implement systems and structures so it can continue to run even if a key person is no longer around. As employers, we want our business to be a happy, sustainable, safe place to work where staff feel proud and want to work for us.
Our family board members have a range of experience of different work environments and understand our obligations to have good employment practices. My brother, George, works for Fairbanks Seeds and my brother, Will, has a farm maintenance and construction business. Having external advisors on the board has made us more objective about our farm decisions and ensured transparency in our communications between the board and management.
GenomicsGenetics has always been a big part of our business. Dad did the best he could with the technology at the time but there have been rapid developments in technology since I have become involved in the farm business.
InSpring2016,theboarddecidedtomakeathreetofive-yearcommitmenttoinvestingenomicsand evaluate the outcomes, particularly after our involvement in the ImProving Herds project. I had concerns about the costs of doing the whole herd at the same time, which would have been in the order of $50,000, so we decided to start with the 2016 spring heifer calves and then go on with subsequent heifers each year.
In February 2017, we tested the top 70% of our 2016 spring born heifers, based on parent averages. We don’t test heifers which are sired by mop-up bulls, or who have poor parent averages. Genomic testing helps us make informed decision as to which heifers to keep and which to sell. It also has the added advantage of verifying parentage. This will improve the accuracy of our records which are currently based on paddock observations at calving.

Page 9
We use a lot of sexed semen and aim to produce 400-500 heifer calves a year through the two joinings. We don’t keep all the heifers for replacements, but having large numbers of heifers means we can increase our farm income from livestock sales and increase our rate of genetic gain in the herd by selecting the best heifers for replacements.
Of the 400-500 heifers we have each year, we genomically test 300-400 of which 250-300 will go into the herd as replacements, depending on the season and livestock marketing options at the time.
Our marketing options for surplus females vary. These include export heifers at 9 months of age; heifers in calf to sexed semen at 16 months of age; and heifers and cows at the point of calving or freshly in milk. Our decisions vary depending on what prices are on offer at the time, current and forecast seasonal conditionsandwherewemakethebestprofitmargin.Thishelpstodiversifyourlivestockincome.
Generally, livestock sales account for 15-20% of our total income, while milk is 80-85%. Value adding to livestock sales is a key part of increasing our overall farm income and fully utilising the land resource we have available.
As part of the ImProving Herds project we received an analysis based on our cows that have milked in our herd. The analysis looked at how the top 25% of our herd based on BPI, performed against the bottom 25% of the herd based on BPI.
Based on BPI, the top 25% of the herd produced an extra 1656L/cow of milk, 66kg/cow of protein, and 67kg/cow of fat a year more than the cows in the bottom 25% of the herd. These top 25% of cows had a gross margin (income over feed) of $585/cow a year more than the bottom group of cows. They also lasted 11 months longer in the herd. Our top BPI cows aren’t our biggest producers, but they aremostlyincalfonthefirstround,haveveryfewhealthissuesandstayintheherdlonger.
With large numbers of heifer replacements to choose from it can be a challenge to identify which to cull. InowuseBPIrankingstoidentifypotentialsaleheifersandcows,particularlyasIgainmoreconfidencein the BPI and the ImProving Herds data. I’m looking forward to seeing the results play out in our herd.
The heifers we independently tested in 2017 will be coming into the herd in Spring 2018, so it will be interesting to see how their performance stacks up against their genomic predictions.
We haven’t used genomics to its full potential yet, but it has already helped us identify the top heifers earlier and will hopefully validate our ImProving Herds results. Genomic testing is another tool which doesn’t involve much intervention.
Genetic Progress for Balanced Performance Index
-20
0
20
40
60
80
100
120
140
160
BPI
($ P
rofit
)
2007 2008 2009 2010 2011 2012 2013 2014 2015 2016 2017
Year of Birth
Avg of top 10% of Holstein herds National Holstein Avg Your Holstein herd Your Holstein X herd
The Balanced Performance Index (BPI) reflects the economic drivers of net profitability for the range of dairy farming systems inAustralia. Traits include production, survival, type, mammary, milking speed, temperament, cell count, fertility and feed efficiency.

Page 10
The ‘next gen’ Jelbarts and the practical impact of the ImProving Herds project
Historical backgroundIhavebeenaskedtoreflectontheJelbartbusinessovertheyearsinwhichI’vehadaconnection;in particular why it provides a good venue for talking about ImProving Herds at The Muster. It’s obviously with a degree of sadness that this is written given the early departure of long term associates and friends, Max and Barbe, but there’s also a degree of excitement at watching the next generation, Will, George and Tim take the bull by the horns and steer the business into the future.
The Jelbart Dairy business has always been associated with innovation. The list is long: stocking rate, supplementary feeding regime, pasture renovation, milking technology, soil fertility, just to mention some areas where this has been evident. Innovation has and continues to be in the Jelbart blood!
Innovators are particularly brave in that the one who gains the most from innovation is often not themselves; they have to sort out the ‘bugs’ and the application issues. It’s the people behind the innovator, that is, the early adopters, who watch and then adopt if appropriate. The early adopter runs less risk and gains the most but it’s the innovator who sows the seeds of change.
The contribution to change by the Jelbart business can best be described by a program I was running 33 years ago with some of the now leading farmers of the district.
We had all heard about this Jelbart bloke. The rumours were that he fed over a tonne of concentrate, milked over a cow to the acre, and didn’t calve in July like everyone else. The question raised by those young future dairy owners and managers was of course, “Do you reckon they make any money?”
When put to Max and Barbe they answered the question openly and in detail, a classic example of the Jelbart innovative attitude (good and bad). They were open to sharing and discussion.
The fact that today’s activity is occurring is strong testament to the fact that tradition continues today, albeit with a different style.
Page 11
The changing of the guardIt should be emphasised that there was a very clear succession plan developed over several years with all the boys and Max and Barbe. At that stage no one thought that it would be triggered so soon but the existence of the succession plan meant that the mechanics of the plan immediately kicked in when needed and the next 5 years were in place.
Theconsequenceisasteadyshipthatcancontinueuntileveryonehasreflectedontheirlong-termpositions. The presence of farm manager Mike Kilkenny has been critical both in the last stages of life for Max and Barbe and the future with the next generation in control.
As with any other family business in succession there is a business to consider and there are family relationships to consider. The three boys are passionate about continuing and growing the business and asset base that they have inherited. But they are all individuals with different opinions that they can express strongly - a Jelbart trait!
To try and help differentiate between family issues and the business, there is a small group or Board that meets for a few hours quarterly to six monthly to review all aspects of the business, both short and long term, keeping the business the focus. At this stage it’s composed of the three boys, myself and Michael Dowling, an accountant and business person who is also a very long-term friend of the Jelbart family. It is envisaged that the external composition of the Board will change over time as the needs change.
With this support network of Mike and the Board, Tim has taken on the role of General Manager of the business. He oversees all the operational activities of the dairy and other areas of the Jelbart business. He presents to the Board simple but detailed budgets, both actual and forecast. He is as directly accountable as any other business manager for the implementation of the plan. After appropriate input and discussion this then becomes the game plan. Variations from budget are examined and discussed. The Board is fully aware of the volatility in the dairy industry - it is not the perfect world.
Initially I wondered if such a structure was required. The business is not that big. However, it has worked very well. It provides a formal and professional environment for the family to discuss and plan their business.
I have observed many other families who have lacked a thorough succession plan and any structure to the next generation of the business. The two steps of early planning for success and the existence of a simple board with external people has ensured a very steady transition to the next Jelbart generation.
An over view of the businessThe concept of the typical dairy farm that existed in the 1990s no longer applies. The myriad of production systemsandblendedenterprisesmeansthatattimesitisdifficulttocomparedairybusinessesandanycomparisonshouldbedonewithcaution.TheJelbartDairyhasitsownindividualprofile.
Milkproductionisjustpartofthebusiness.Livestockrearingandsalesarealsoverysignificant.For example, in the calendar year 2017 there were 525 heifer calves and 130 bull calves reared for various end markets and also for dairy replacements.
The milking area of 360 ha, which carries a stocking rate of 2.8 cows/ha or 1008 cows, is supported by 510 ha of turnout area. This is double the area solely required by the dairy enterprise; hence the need for the additional livestock enterprise.

Page 12
2016/2017 data is the only full year of data available since the new generation has taken control over the business. It was a turbulent, low milk price year but some key performance indicators of the business were:
• Pasture consumed on the milking area - 9.0 T/ha
• Imported feed - approximately 43% of total feed consumed. It is a high input dairy farm.
• Per cow production - 622 kg milk solids per cow
• Concentrate feeding - 2.9 T of concentrate equivalent per cow.
• Profit($EBIT)percow-$542fromayearwithamilkpriceof$5.09perkgMS,about$0.80/kgMS below the 5-year average for the farm.
• Total return on assets - 2.5%, which considering the milk price in that year was a good result.
• Livestock sales - $742,000. This is 4-5 times the normal livestock sales of a 1,000-cow dairy that only rears bare minimum replacement stock numbers and only sells cull cows. There was only a 5%decreaseinlivestockinventorytoachievethissalesfigure.Itwasnotachievedbyawholesaleselling down of the inventory.
• The cost of production - $5.65/kg MS which may appear high. However, when this adjusted to allow for the additional livestock reared and sold it decreases to $4.98/kg MS - a very acceptablefigure.
TheabovefiguresexcludeanyimpactoftheCalderMeadeFarmwhichwasoperatedasaseparateunit until sold.
One trait that has appeared quite clearly is that Tim is tight and understands marginal analysis very well - big or more is not necessarily better!
He also has an amazing ability of getting the right data to answer the question being asked. This is an essential attribute of any good manager in today’s dairy environment as it was 33 years ago on that early visit to see what Max was actually up to. The basic yet often forgotten skill of “Work out what is the question that needs to be asked, seek accurate information, then formulate and also test the answer” was pivotal in the training and development of those young individuals as well as me. It still holds true.
The business is in very good hands with Tim, George, and Will.
4. The impact of geneticsAs most people would be aware, my knowledge of dairy genetics is very limited. However, it’s clear that geneticimprovement,whilegradualandreasonablysubtle,isacontributortoprofitondairyfarms.
A good example of the impact of genetics came through some research results (Bill Fulkerson in the 90s) and some of my early discussion group activities. Bill Fulkerson found that when stocking rate was high and the concentrate level was 1-2 T/cow, the higher genetic merit herds produced 42 kilograms of milk solids more than the lower genetic merit herd on the same concentrate input.
This did not surprise the thinking dairy farmer. The discussion group in question had two members (Graeme Mabin and Ian Hitchings) both of whom had high genetic merit herds. These two embarked on higher feeding regimes to test the Fulkerson theory, a good example of the response regularly applied by good farmers to research, but still grazed pastures very well and did not change stocking rate.
The group members were surprised that both herds responded at a rate of 104 kg MS/cow per extra tonne of concentrate; the Fulkerson results would have predicted 111 kg MS per extra tonne. These levels of responses were well above the general AgVic guidelines of 80 kg MS/cow for an extra tonne.

Page 13
The table that was prepared and handed out to the discussion group following this activity is presented below.
RESPONSE TO CONCENTRATES
What are farms claiming vs what are researchers finding?
• Ellinbank “Rule of Thumb”
- One litre of milk is produced for each kilogram fed
- This equates to 45 kg butterfat /tonne (80 kg MS/T)
• Researchers - Fulkerson (3 cows/ha)
Genetic merit of cows
High conc.>2 T
Low conc.1 T
Average Litre/tonne
High 87 kg F & Pr 137 kg F & Pr 112 kg F & Pr 1550
Low 55 kg F & Pr 85 kg F & Pr 70 kg F & Pr 933
Average = 91 kg TS/tonne concentrates or 1,240 litres/tonne
• Ian – Extra grain (0.69 tonne)
- High genetic merit herd
- “Guesstimate” = Extra 42 kg BF and 74 kg F and Pr Move from 245 kg BF to 287 kg BF
- Using Fulkerson’s high genetic merit average- 112 x 0.69 tonne = 77 kg F and Pr extra predicted
-Using“guesstimate”figureof74kgF+Prextra=107kgFandPrpertonnewhichisconsistent.
• Graeme et al – Extra 0.45 T high quality hay plus 0.43T grain
- Extra is equivalent to 0.78 tonne grain
- Claim is an increase from 233 kg BF to 278 kg BF or 79 kg F and Pr/tonne
- Fulkerson would predict 87 kg F and Pr extra or 111 kg F and Pr/tonne
The learning from this was that higher genetic merit herds had the ability to respond better to a higher feeding regime; even at a lower feeding regime the higher genetic merit cows responded better. In addition, within herds individuals with higher genetic merit could respond better than lower genetic merit cows.
To many this would just seem like common sense - higher genetic merit cows should have the potentialtocontributetoprofitmorethanlowergeneticmeritcows!Butitdepends-it’snotjust about production. It will also depend on how long these cows are in the herd, how high their “maintenance” costs such as herd health are, and their ability to get in calf to calve at the same time eachyear.Thereisalsotheimpactofthemajordriverofprofit,themanager’sskillset.
It’s critical that genetic selection and evaluation programs takes all relevant traits into account and that’s where the industry seems to have turned the wrong corner at some stage - selection for production,specificallylitres,becamethedrivingfocusandsincethenreproductiveperformanceandlongevity have suffered, as always so well documented by renowned dairy farming vet Jakob Malmo from Maffra.
Even if the right things are targeted, genetic improvement requires selection pressure otherwise the former is wasted. Genetic improvement can only be exploited if in fact there is some voluntary culling pressure within a herd rather than mandatory culls. When the number of replacement heifers reared is close to 30% due either to good reproductive performance or the use of single sex semen and genomic testing then the opportunity exists to accelerate the implementation of the genetic progress.
It’s getting the direction right then going fast!

Page 14
ImProving Herds project and the BPIThere are a couple of steps for a farmer to go through before getting to the genetic improvement part. Firstly, they must identify the optimum stocking rate for their individual “risk versus return” system.Thenitiscriticalthatthetypeofcowforthatsystemisidentified.Gettingthisrightavoidstheposition of having to design a system to suit your cow! Logically it is then that genetic improvement is implementedtoensurethatthereisthebestchancepossibletomaximiseprofit.
What criteria? In terms of production the days of emphasis on litres are over - the younger generation recognise this better than then the oldies. 98% of milk payment is based on solids and the penalty of an over focus on litres is now apparent in the industry.
As discussed above, there is more to consider than just better production, size and fertility being some of the other factors.
I am not an expert in genetic indices but it would appear that both ABVs and BPI calculations now have weighting which is much more related to improving the chance of profitability than previously.
Analysis of the Jelbart Herd and high versus low BPI cows - does it pass the common sense test?
ThegrossmarginfigurecalculatedintheImProvingHerdsProjectfortheJelbartherdwas$1,256per cow which includes known feed costs and back calculated pasture intake at a set cost based on individual cow production. For 2016/2017 (a tight and low milk price year) OMJ Agricultural Consulting calculated that the Jelbart herd generated a gross margin (less livestock income) of $1,176 per cow, so consistent results.
The Jelbart herd analysis for ImProving Herds was based mainly on income less feed costs, that is, the margin between milk income and feed costs. If a herd can improve this margin then gross margin should increase. Gross margin is income less herd, shed and feed costs and is driven 80% by feed costs.
Partofthemarginbetweenmilkincomeandfeedcostsrelatestofeeduseefficiencyintermsofconversion to milk. The Fulkerson/discussion group work described earlier suggests that high genetic meritcowsaremorefeedefficient.
This more recent analysis of Jelbarts’ commercial herd found that the difference in income over feed costs between the cows rated high using the BPI and the low BPI cows in the Jelbart herd was $526 percow.ItreconfirmswhattheFulkersonresearchwouldexpectandinthiscaseitisnotsurprisingthat high BPI cows can have a 41% impact on the gross margin per cow (above the average and greater when cows are below average).
Also worth noting is that the analysis indicated that high BPI cows lasted 11 months longer in the herd than low BPI cows. This is a good result as long as it is not a systems effect where milking cows longer is easier on a farm which milks all year round.
So, what are the implications of the analysis?
The results are very positive but we cannot jump to the conclusion that if everyone lifts the genetic profileoftheirherdtoaJelbartleveltheywillautomaticallygenerateinthevicinityof$526percowextra. It’s also not as simple as “...cull the bottom 25% of your herd and the high BPI cows will make upforit-profitwillincrease!“Thelevelofimprovementmadecomesfromamyriadofareas,oneofwhich is the rate of conversion into milk from the same feed intake, but also things like extra cheap feed (pasture) being consumed by high BPI cows. It also depends exactly where a farm is currently on the marginal curve of stocking rate inputs, labour, and facilities.
Further, if the Jelbart herd tomorrow was composed completely of high BPI cows, with no change in cow number, effectively this would increase stocking rate due to higher feed demand and take a businesswhichalreadyimports43%offeedtoasignificantlyhigherlevel.Insomeyearsthatwouldbehighlyprofitableandinotheryearsitwouldbeapotentialdisaster.Ifsomeoneintheaudiencecantellme the number of years the milk price will be $6.00/kg MS, grain will be $300/T or less and seasons willbegoodthenperhapswecanestimatetheprobabilityofprofit.

Page 15
With those warnings the positive messages are:
• Thequantitativeanalysishasinsomeareasconfirmedtheobservationsofthinkingdairyfarmers.
• Therehavebeensomesurprisingfindingswhichhaveexplodedoftenacceptedanecdotalcomments regarding fertility and longevity of high BPI cows.
• Sincethegainsofgeneticimprovementhavebeenquantifiedthisreinforcestherequirementtorear maximum replacements and in particular high genetic merit cows and bulls.
• It completely supports the genomic testing to identify the actual performance of 2-year-old heifers. This is particularly true where post rearing costs are on an individual basis and high, such as in Tasmania.
High BPI cows create the potential for higher profit. It is deciding the big settings of the dairy business, and then getting every day correct that actually generates the majority of profit.

Page 16
ImProving Herds results: comparing high and low BPI cows
The ImProving Herds project looked at the actual performance of high and low genetic merit cows (basedonBalancedPerformanceIndex–BPI)inrealherds.Weidentifiedthetopandbottom25%ofcows in individual herds and looked at the difference in their contribution to the farm business. The measure we used was gross margin (income over feed and herd costs).
High BPI cows outperform their low BPI herd matesOur analysis showed that, on average, the top 25% of cows in a herd (based on BPI) produced a marginoverfeedandherdcostsof$300/cow/yearmorethanthebottom25%ofcows.Thisfindingheld across feeding systems and dairying regions.
The top 25% of cows had higher milk income and not unexpectedly, higher feed costs. Annually, high BPI cows also had a lower salvage/cull value and lower rearing costs. This is because cows in the high BPI group tend to last as long, if not longer in the herd than their low BPI herd mates. Other sources of herd income and costs were similar across the two groups of cows. As every farm has different management and feeding practices, the size of the difference in performance between high and low BPI cows differed, however the trends in performance were the same across herds.
Compared to their lower BPI herd mates, high BPI cows have
Income (per year)
• More income from milk production
• Similar value of calves born
• Less income when culled
Costs (per year)
• Greater feed costs
• Similar reproduction costs
• Lower rearing costs
• Similar clinical mastitis treatment costs
LongevityA concern expressed by some farmers is that high genetic merit cows that produce more milk are more prone to breaking down and do not last as long in the herd. On average, across the ImProving Herds Focus Farms, the top 25% of cows (ranked on BPI) lasted 8 months longer than the bottom 25%. This translates to savings in heifer rearing costs as fewer herd replacements are needed each year.
ProductionThe top 25% of cows ranked on BPI produced 88kg more milk solids per cow per year than the bottom 25% of cows, on average. They also produced 649 more Litres/cow of milk each year. The milk of high BPI cows also had a higher fat and protein percentages.

Page 17
Summary of extra milk production from the top 25% of cows
Compared to their lower BPI herd mates, high BPI cows produced
Milk (L) 649 more L/cow/year
Milk solids 88 more kg/cow/year
Fat (kg) 50 more kg /cow/year
Protein (kg) 38 kg more kg/cow/year
Fat (%) 0.29% higher fat content
Protein (%) 0.19% higher protein content
Longevity and lasted 8 months longer
Income over feed costsCows that produce more milk have higher energy demands. The value of extra milk produced by high BPI cows easily compensates for their higher feed costs.
We conducted a sensitivity analysis to see how the income over feed costs would be affected by changes in milk price and feed price.
The high BPI cows in ImProving Herds study still recouped their extra feed costs through additional milk income if:
• Milk price dropped by 50% and feed prices stayed the same.
• Feed price doubled and milk prices stayed the same.
Even if milk priced halved and feed price doubled at the same time, extra feed costs would still be recouped through extra milk production of high BPI cows!
What does this mean for my farm?High BPI cows outperformed their low BPI herd mates across different dairying regions and feeding systems. The daughters of high BPI bulls perform better under Australian conditions. When selecting bulls to breed replacements, choose bulls from the Good Bulls Guide.
The analysis explainedTheseresultsarefromanindependentanalysisthatdrewupon10yearsoffinancialandherddatafrom real Australian dairy farms. It included 7,700 lactations from 2,600 cows.
We combined cow records including herd test results, calving information and, where available, mating and health records. For each cow we then calculated lifetime:
• Milk production.
• Milk solids.
• Productive life.
• Feed requirements.
• Number of calves.
• Number of AI straws used.
• Number of cases of clinical mastitis.
As cows differ in the amount of time they spend in the milking herd, each cow’s lifetime performance was converted to average annual performance so cows could be fairly compared. To compare high and lowgeneticmeritcows,thetopandbottom25%ofcowswereidentifiedbasedoneachcow’srankingfor the Balanced Performance Index (BPI). Differences in Australian Breeding Values (ABVs), physical performanceandfinancialperformanceandwerethencomparedbetweenthesetwogroupsofcows.

Page 18
Comparing historical performance in the Jelbart herd
The ImProving Herds project looked at the actual performance of high and low genetic merit cows (basedonBalancedPerformanceIndex–BPI)inrealherds.Weidentifiedthetopandbottom25%ofcowsintheJelbartherdandlookedatdifferencesproductionandfinancialcontributiontothefarm business.
The differences in performance of the top and bottom 25% of cows (ranked on BPI) seen in the JelbartherdsupporttheoverallfindingsoftheImProvingHerdsproject.AstheJelbarts’managementand feeding practices are unique to their business, the size of the differences observed are unique to their farm.
The Jelbarts’ high BPI cows produce more The top 25% of cows ranked on BPI produced 1656 more litres of milk per cow per year as well as 67 more kilograms of fat and 66 more kilograms of protein compared to their low BPI herd mates.
Differences in production between the top and bottom 25% of cows (based on BPI) in the Jelbart herd
High BPI cows produce
Milk (L) 1656 more L/cow/year
Fat (kg) 67 more kg/cow/year
Protein (kg) 66 more kg/cow/year
Fat (%) 0.14% higher fat content in milk
Protein (%) 0.09% higher protein content in milk
Longevity And lasted 11 months longer
The extra milk production from the top 25% of cows translated to $737 higher milk income per cow per year. This is calculated using the Jelbarts’ own milk and feed prices. Producing extra milk requires more energy so these cows also had an additional feed cost of $151 per cow per year. Milk income over feed costs was $585 per cow per year.
Graph: Extra milk income and feed costs from the top 25% of cows (based on BPI) in the Jelbarts’ herd
$/c
ow
/ye
ar
Milk Income
0
100
200
300
400
500
600
700
800
Feed Cost

Page 19
High BPI cows last longer in the herdOn average, the top 25% of cows last in the Jelbart herd for 11 months longer than the bottom 25%.
Australian Breeding Values (ABVs)The average difference in BPI between the top and bottom 25% of cows is 171. The differences seen in the performance of the high genetic merit cows is strong evidence that the BPI is a good prediction of a cow’s performance under Australian conditions.
The fact that the high BPI cows last 11 months longer in the Jelbarts’ herd is also supported by the top 25% of cows having a Survival ABV 2 units higher than their low BPI herd mates. There was no difference in the number of calves born to the high and low genetic merit groups. This is not surprising in the Jelbart herd as there was a very small difference in the Fertility ABV between the top and bottom 25% of cows ranked on BPI.
Wrap-upTheJelbarts’resultssupporttheImProvingHerdsfindingthathighBPIcowsoutperformedtheirlowBPI herd mates across different dairying regions and feeding systems. This is a clear message that the daughters of high BPI bulls perform better under Australian conditions.

Page 20
GENETICPROGRESSREPORT
V 1.3
04/04/18Print date:
540364WANational herd ID:
956Cows currently in herd:
Breed code for this report is:Holstein and Holstein X
JELBART DAIRIES PTY LTD60 NICHOLAS ROAD LEONGATHA SOUTH, 3953
Your Herd's Genetic Snapshot
Rank 37 out of 1520 Holstein milk recording herds for BPI BPI 93 herd average Balanced Performance Index
The bulls you selected overthe last 10 years producedHolstein cows with genetictrends that have:
Profit
Production
Overall Type
Longevity
Fertility
Mastitis Resistance
Genetic Trend: Increased Decreased No clear trend
Genetic Progress for Balanced Performance Index
-20
0
20
40
60
80
100
120
140
160
BPI
($ P
rofit
)
2007 2008 2009 2010 2011 2012 2013 2014 2015 2016 2017
Year of Birth
Avg of top 10% of Holstein herds National Holstein Avg Your Holstein herd Your Holstein X herd
The Balanced Performance Index (BPI) reflects the economic drivers of net profitability for the range of dairy farming systems inAustralia. Traits include production, survival, type, mammary, milking speed, temperament, cell count, fertility and feed efficiency.
Do you want to improve your herd's genetic performance for one or more of these traits?Use the Good Bulls Guide to choose bulls that perform well in your highest breeding priority areas.
GBG 95% of the cows born in 2015 were bred from the Good Bulls Guide or by Progeny Test.
Number of Cows (current and sold/culled)
Year of Birth 2007 2008 2009 2010 2011 2012 2013 2014 2015 2016 2017 Total
Holstein 197 231 236 205 210 177 215 336 311 362 298 2778
Holstein X 106 85 42 52 83 68 89 134 115 120 109 1003
Calves and heifers can be included in this report if they are recorded at your herd test centre.
DataGene is an independent and industry-owned organisation responsible for driving genetic gain and herd improvement in the Australiandairy industry. DataGene is an initiative of Dairy Australia and industry.
Page 21
540364WANational herd ID:
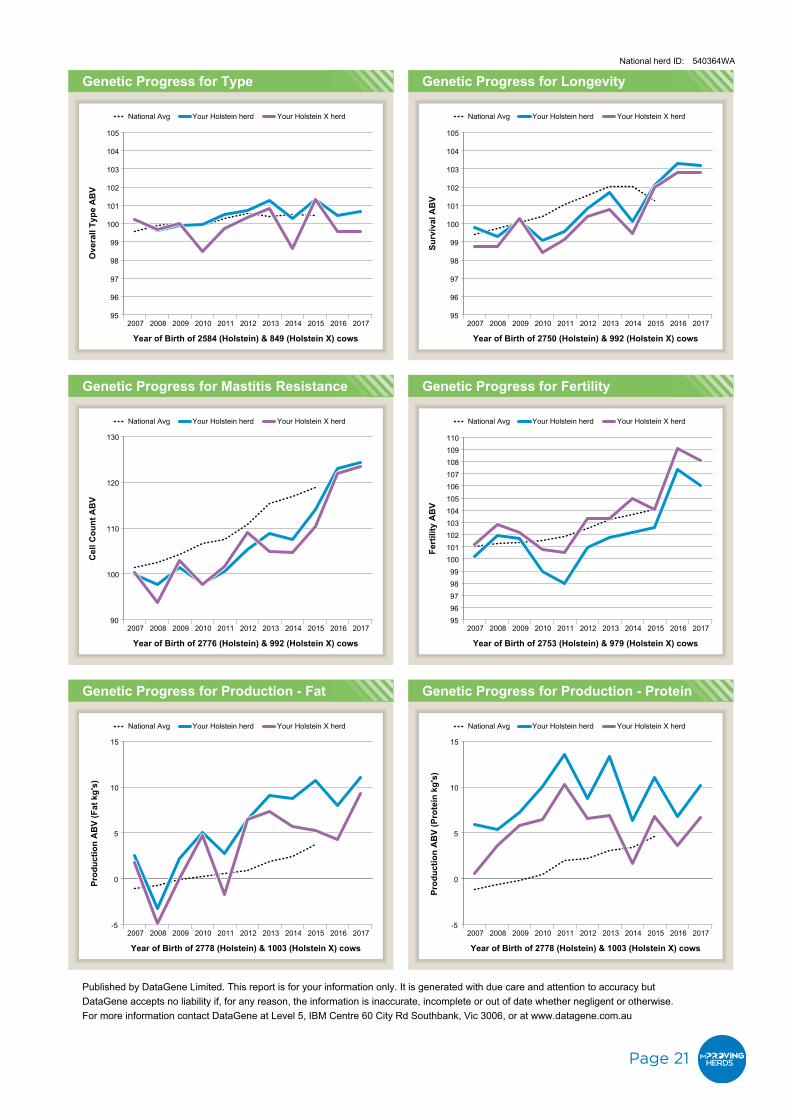
Genetic Progress for Type
95
96
97
98
99
100
101
102
103
104
105
Ove
rall
Type
AB
V
2007 2008 2009 2010 2011 2012 2013 2014 2015 2016 2017
Year of Birth of 2584 (Holstein) & 849 (Holstein X) cows
National Avg Your Holstein herd Your Holstein X herd
Genetic Progress for Longevity
95
96
97
98
99
100
101
102
103
104
105
Surv
ival
AB
V
2007 2008 2009 2010 2011 2012 2013 2014 2015 2016 2017
Year of Birth of 2750 (Holstein) & 992 (Holstein X) cows
National Avg Your Holstein herd Your Holstein X herd
Genetic Progress for Mastitis Resistance
90
100
110
120
130
Cel
l Cou
nt A
BV
2007 2008 2009 2010 2011 2012 2013 2014 2015 2016 2017
Year of Birth of 2776 (Holstein) & 992 (Holstein X) cows
National Avg Your Holstein herd Your Holstein X herd
Genetic Progress for Fertility
9596979899
100101102103104105106107108109110
Fert
ility
AB
V
2007 2008 2009 2010 2011 2012 2013 2014 2015 2016 2017
Year of Birth of 2753 (Holstein) & 979 (Holstein X) cows
National Avg Your Holstein herd Your Holstein X herd
Genetic Progress for Production - Fat
-5
0
5
10
15
Prod
uctio
n A
BV
(Fat
kg'
s)
2007 2008 2009 2010 2011 2012 2013 2014 2015 2016 2017
Year of Birth of 2778 (Holstein) & 1003 (Holstein X) cows
National Avg Your Holstein herd Your Holstein X herd
Genetic Progress for Production - Protein
-5
0
5
10
15
Prod
uctio
n A
BV
(Pro
tein
kg'
s)
2007 2008 2009 2010 2011 2012 2013 2014 2015 2016 2017
Year of Birth of 2778 (Holstein) & 1003 (Holstein X) cows
National Avg Your Holstein herd Your Holstein X herd
Published by DataGene Limited. This report is for your information only. It is generated with due care and attention to accuracy butDataGene accepts no liability if, for any reason, the information is inaccurate, incomplete or out of date whether negligent or otherwise.For more information contact DataGene at Level 5, IBM Centre 60 City Rd Southbank, Vic 3006, or at www.datagene.com.au

Page 22
Genomics at Jelbart Dairy
Genomics is an important tool in Jelbart Dairy’s breeding strategy and business plan. The Jelbarts aim tobuildasignificantincomestreamfromthesaleoflivestock.Thiscanhelpbuffertheimpactofmilkpricefluctuations.
The farm aims to breed 400-500 heifer calves each year, which is far more than the 200-300 needed for herd replacements. Genomic results help the Jelbarts identify which heifers to keep and which to sell.
The keys to breeding surplus heifers at Jelbart Dairy are using sexed semen and maximising calf survival rate.
Sexed semen is used predominantly over the maiden heifer group, and more recently they have trialled using sexed semen in high fertility cows. As well as providing more female calves, this approach means replacement heifers are bred from the best cows and heifers. Having a greater proportion of replacements from the best cows increases the rate of genetic gain in the herd.
The staff at Jelbart Dairy work incredibly hard to ensure that as many calves born survive as possible. Within the calf shed the golden rules are cleanliness, attention to detail, meticulous record keeping, early action, welfare and an attitude of passion and patience.
Who gets tested?Since 2016 Jelbart Dairy has tested about 60-70% of heifers at 4-6 months of age. To contain costs, not all heifer calves born each year get tested. Animals not tested include those sired by a mop up bull, those with a low parent average and those with an obvious undesirable physical trait.
What happens with the results?The Jelbart Dairy team uses genomic results for a variety of management decisions including confirmingparentagerecordsandidentifying:
• Which animals go to sexed semen.
• Whatsiresareusedoverspecificheifers.
• Which heifers do not enter the herd but are sold to other markets e.g. export or at the point of calving.

Page 23
ID: 1
3626
Bi
rth
Dat
e: 6
-Mar
-201
7Si
re: N
ARD
OO
BP
I: -1
0, M
ilk: 5
3, F
at: -
1, P
rot:
-4, F
ert:
10
3 Co
mm
ent:
Sol
d to
Exp
ort 2
0-04
-201
8
ID: 1
3630
Bi
rth
Date
: 8-M
ar-1
7 Si
re: D
IGGE
R BP
I: 20
0, M
ilk: -
653,
Fat:
25, P
rot:
-4, F
ert:
108
Com
men
t: Ke
ep b
ut w
atch
per
form
ance
& h
ealth
ID: 1
3653
Bi
rth
Date
: 20-
Mar
-17
Sire
: MOD
ESTO
BP
I: 90
, Milk
: -17
8, Fa
t: 2,
Pro
t: 1,
Fert
: 108
Co
mm
ent:
Will
be
sold
to e
xpor
t if n
o lo
wer
BPI
he
ifers
in g
roup
ID: 1
3639
Bi
rth
Date
: 12-
Mar
-17
Sire
: WRI
GHT
BPI:
212,
Milk
: -41
2, Fa
t: 11
, Pro
t: 7,
Fert
: 113
Co
mm
ent:
Keep
in h
erd,
low
er p
rodu
ctio
n bu
t goo
d fe
rtili
ty, s
olid
s and
hea
lth tr
aits
Wag
yu F1
Cro
ss
Je
lbart
Dair
y H
eif
ers
Page 24
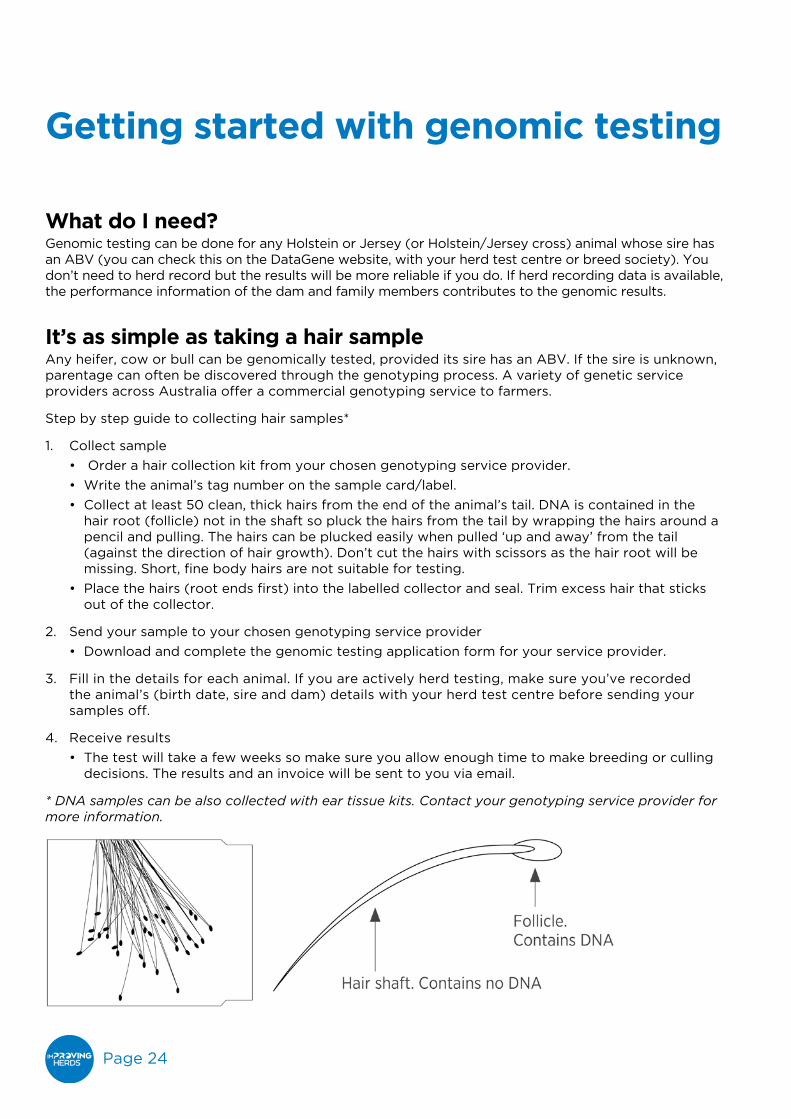
Getting started with genomic testing
What do I need? Genomic testing can be done for any Holstein or Jersey (or Holstein/Jersey cross) animal whose sire has an ABV (you can check this on the DataGene website, with your herd test centre or breed society). You don’t need to herd record but the results will be more reliable if you do. If herd recording data is available, the performance information of the dam and family members contributes to the genomic results.
It’s as simple as taking a hair sample Any heifer, cow or bull can be genomically tested, provided its sire has an ABV. If the sire is unknown, parentage can often be discovered through the genotyping process. A variety of genetic service providers across Australia offer a commercial genotyping service to farmers.
Step by step guide to collecting hair samples*
1. Collect sample
• Order a hair collection kit from your chosen genotyping service provider.
• Write the animal’s tag number on the sample card/label.
• Collect at least 50 clean, thick hairs from the end of the animal’s tail. DNA is contained in the hair root (follicle) not in the shaft so pluck the hairs from the tail by wrapping the hairs around a pencil and pulling. The hairs can be plucked easily when pulled ‘up and away’ from the tail (against the direction of hair growth). Don’t cut the hairs with scissors as the hair root will be missing.Short,finebodyhairsarenotsuitablefortesting.
• Placethehairs(rootendsfirst)intothelabelledcollectorandseal.Trimexcesshairthatsticks out of the collector.
2. Send your sample to your chosen genotyping service provider
• Download and complete the genomic testing application form for your service provider.
3. Fill in the details for each animal. If you are actively herd testing, make sure you’ve recorded the animal’s (birth date, sire and dam) details with your herd test centre before sending your samples off.
4. Receive results
• The test will take a few weeks so make sure you allow enough time to make breeding or culling decisions. The results and an invoice will be sent to you via email.
* DNA samples can be also collected with ear tissue kits. Contact your genotyping service provider for more information.

Page 25
How genetics contributes to profit on our farm
Sam and Christine McCluggage farm at Allansford, Western Victoria. Their 700-cow seasonal calving herd has only used Holstein genetics for the past 18 years. The McCluggages have invested heavily in artificial insemination (AI) and sexed semen. Their efforts have dramatically increased the value of stock sales and lifted the performance of the milking herd. In 2016-17 Sam and Christine participated in the ImProving Herds project as a Genetics Focus Farm.
Farm stats (April 2018)
Herd size: 700 cows in a closed herd
Breed: Holstein
Farm size: Home block Ballyvernstown 319ha plus two run off blocks: Clonleigh 210ha and Rosyth Park 100ha
Calving pattern: Seasonal with calving in March, April and May
Dairy: 40-unit swingover
Staff: 5 full time, 2 part time and I casual labour units
Feeding system: Average grain feeding at 2.4t/cow/year to supplement dryland perennial ryegrass and clover pastures. Cut own silage and hay and buy in hay when needed
Our farmWe farm at Allansford in Western Victoria and milk 700 Holstein cows. Our home farm, Ballyvernstown, is 319ha. We also have two run off blocks – one is Clonleigh at 210ha and the other is Rosyth Park at 100ha – which are used to grow out young stock.
I’ve been dairy farming for 20 years and started with 180 Holstein, Jersey and crossbred cows on 100ha.We’veslowlygrownourherdover15yearsandkeptthenumberstableforthepastfiveyears.We’ve chosen to have a closed herd so we rely on breeding our own replacements. Keeping a closed herd has been an important biosecurity tool and also means we have full histories on all our cows.
We run our milkers as one herd and have a seasonal calving pattern because we are totally dependent on rainfall. Last season our herd averaged 8100L/cow and 590kg of milk solids.
Our herd has only used Holstein genetics for the past 18 years. We are big users of AI and sexed semen.Wehaveused100%AIonthecowsforthepastfiveyears.Idon’tlikehavingbullswiththemilking herd for OH&S reasons and as the herd has grown we had to run more bulls.
BPI and profitOur ImProving Herds results have clearly shown that high genetic cows – based on Balanced PerformanceIndex(BPI)–aremoreprofitablethanthecowswiththelowerBPIfiguresinourherd.
The top 25% of our herd, based on BPI, are producing an extra 377 litres/cow/year of milks, 31kg/cow/year of protein and 46kg/cow/year of fat more than the 25% of cows with the lowest BPI figures.Thetop25%ofcowshaveagrossmargin(incomeoverfeedcosts)of$356moreayearandalso last three months longer in the herd, which is equivalent to a third of a lactation more.

Page 26
Whenyouconsiderthosedifferencesacrossaherdof700cows,itaddsuptoasignificantbenefitinhaving cows with high BPI and selecting high BPI bulls to breed replacements.
OurhigherBPIcowshaveproventheyaremoreprofitable.WeneedtobebreedingandkeepingheiferswithhigherBPIfigures.
Our breeding programOur key criteria when selecting bulls is production. We want bulls to be positive for fat and protein percentages and have good daughter fertility. I look at the all the key traits but we particularly want good udders and type.
We use the Good Bulls App to get a short list of the bulls I will consider for using over the cows and over the heifers. Once I have a list of suitable bulls, I will talk to both Tim Sedgely and Graeme Heaver as these semen reps have been working with our herd for a number of years.
Our cow breeding program uses 600 doses of sexed semen and 800 doses of conventional semen with a synchronisation program using prostaglandin (PG).
We put our heifers through a Fixed Time AI (FTAI) program on the run off blocks, but we don’t do them all at the same time; instead we run them through in small mobs.
Most of the fresh sexed semen is used in our heifer AI program. We get the best conception rate with fresh sexed semen, but the number of bulls available for sexed semen can limit bull choices and the selection pressure for traits such as BPI.
We weigh and monitor our heifers regularly once they get to around 200kg and we grow them out on the run off blocks in groups of 60-75. We have found the heifers do better in smaller groups and are easier to monitor. We keep the heifers in these mobs for synchronising and joining because one mob is a comfortable day’s work between milkings and we want to make sure we minimise stress.
WithaFTAIprogram,theheiferswillgothroughtheyardsfourtofivetimessoIwantthemtoberelaxed. By handling the heifers in batches, we end up joining 250-300 heifers in the different mobs over four separate days.
We then use Jersey bulls as mop up bulls for the heifers.
Sexed semen is expensive so if I am using it in the main herd I:
• Onlyusesexedsemenforthefirsttworoundsofjoining,i.e.thecowhastohavecalvedinthefirstmonth of calving.
• Only use sexed semen on younger cows, i.e. 2nd and 3rd calvers.
• Only use it on cows which have no history of calving issues before or after calving.
• Only use it in cows that will be in the herd for the next 12 months.
We metricheck all cows soon after calving to make sure they have cleaned up. We don’t want to waste sexed semen on a cow if she has a reduced chance of conception. We don’t have the option of carrying a cow over because we are a seasonal herd.
Last season we joined 280 heifers. We sold 60 and calved down 220 of which there were 140 heifer calves born. In the mature cows we calved down 460 cows and had 310 heifer calves. All up we had 450 heifer calves from 680 calvings.
Of 450 heifer calves born last year, we will sell the late calves which are sired by conventional semen (in the cows) or sired by mop up bulls (in the heifers) which will leave about 300 heifer calves which we then genomically tested as part of ImProving Herds last year. We have recently been accepted as a Ginfo project herd and will be testing every heifer every year from now on. We use genomic testing as a tool to help make culling decisions earlier on which heifers to sell, which can be invaluable if we have a dry season or there are strong export prices if we have surplus heifers.

Page 27
This season we started calving on March 2 and by April 18 we had calved down 510 cows for a total of 375 heifer calves. That included 160 maiden heifers joined to sexed semen, which had 140 heifer calves, 10 bull calves and 10 losses. At the time of writing these notes we still have 220 to calve.
Genomic testing gives us a prediction on a number of key traits even before the heifer milks. If we have a surplus we can sort out who to keep at a younger age.
Genomic testing has also proven to have real value in verifying the parentage of calves. We can all make mistakes when cows are joined in big numbers and then there is always a degree of mismothering when cows calve down in big numbers. Genomic testing gets rid of these errors.
Our herd size can vary from 630 to 730 cows depending on the season. We drop herd numbers back in a dry season which then gives us an opportunity to put a lot more selection pressure on the herd. Having a large number of heifer calves also means we can ramp up cow numbers very quickly if we need to.
Ideally, we want 220-230 heifers going into the herd each year to keep the age of the herd down and genetic progress heading in the right direction.
Financial gains with sexed semenHaving 150 surplus heifer calves to sell has made a big difference to our income streams in the business with stock sales now making up 25% of the farm income, while milk accounts for 75%. It’s been a big change – we traditionally relied on 90% of our income from milk sales and 10% from livestock sales based on cull cows and low value bobby calves.
Making stock sales a growing part of the business has also been a valuable tool to manage income risk which has been particularly important given the recent falls in the milk price.
We are now rearing our bull calves for the past six years which we sell to local farmers for use as commercial bulls. There is also scope for us to identify some genetically superior bulls as potential mop up bulls for use in our heifer joinings, which in turn could generate more heifer calves.
Increasing our income from the sale of surplus heifers and improving the value of our bobby calves has helped pay to run our heifer blocks and cover the cost of genomic testing.

Page 28
Genetic Futures Report coming soon
For more information contact:
Erika OakesProject Liaison ManagerDataGene LimitedE: [email protected]
Sample
Sample

Page 29
Using Good Bulls on a budget
Jared and Courtney Ireland share farm at Lockington in Northern Victoria. They see their herd of 420 cows as their biggest asset and have used genetics to add value to their cows and their income. Over a relatively short period of time the Irelands have built the genetic capacity of their herd by selecting for Balanced Performance Index (BPI) and using genetically superior bulls. Jared and Courtney are strong believers that high genetic merit bulls don’t have to be expensive and there a number of tactics they use to buy Good Bulls on a budget.
Farm stats (April 2018)
Herd size: 420 cows of their own in a share farming arrangement
Breed: Holstein
Farm size: 250ha
Calving pattern: three times a year. Mar/early Apr. Aug/Sep. Nov.
Dairy: 44-unit rotary
Staff: 2 full time and 2 part time labour units
Feeding system: average 6kg of grain, equivalent to 2.2t/cow/year and grazing lucerne and ryegrass
Where we wereI grew up on a dairy farm in Tasmania. I started full-time work in 2000 as a 16-year-old and started buying cows. In 2002 I started working for George Wagner (I eventually married his daughter Courtney) and by 2006 had 25-30 cows of my own. In 2006, when I was 21, I moved to Victoria to start share farming, however we put it off a couple years due to the drought. We moved into our current share farming partnership with Paul Weller in 2008 and started increasing our herd size. In 2011 Paul let us buy the rest of herd which increased our share in the farming business. We don’t have a conventional share-farming arrangement but it works very well and we have been with the same property owner now for 12 seasons. We moved to our current farm in 2013 and now have our own herd of 420 cows.
Why genetics are importantWe intend to be career share farmers so we see our herd as our biggest asset. Realistically, if we were to buy our own farm - it would be a minimum investment of $2 million which is a big commitment. Sharefarminggivesusflexibilitytoinvestofffarm.
When I started share farming in 2007, the herd I was milking was averaging 6000L/cow/year and only averaged 3.1% protein. I knew it could be better because I had seen what Courtney’s dad, George Wagner, was doing in his herd and what he had achieved through breeding. We had bought in a lot of cows to get a foot in the door but the cows we had lacked the genetics we needed to achieve the production we wanted. It was a wakeup call that we needed to breed better cows.
We started looking at using better bulls. High BPI, protein and fat became our selection priorities but we had a to keep costs down and be clever about our bull selection. We started off by picking 1-2 proven bulls then used progeny test sires to keep our costs down with a budget of $16/straw.
It’s been a strategy that paid off. Our herd now averages 3.45% protein with 8000-8500 litres/cow.

Page 30
Genetic Progress for Balanced Performance Index
-200
20406080
100120140160180
BPI
($ P
rofit
)
2006 2007 2008 2009 2010 2011 2012 2013 2014 2015 2016 2017
Year of Birth
Avg of top 10% of Holstein herds National Holstein Avg Your Holstein herd Your Holstein X herd
The Balanced Performance Index (BPI) reflects the economic drivers of net profitability for the range of dairy farming systems inAustralia. Traits include production, survival, type, mammary, milking speed, temperament, cell count, fertility and feed efficiency.
Breeding objectivesOur current breeding objectives are very focussed on BPI with main criterion on type, cell count and fertility. Our aim is to breed good replacement heifers which are better than the cows they replace.
We look closely at the performance within our herd and there is a substantial difference between the performance of the top 25% of the herd and bottom 25%. The difference between the top and bottom 25% based on BPI is an additional gross margin (income over feed cost) of $585/cow with the top 25% of cows producing an extra 1338L/year and lasting an extra 9 months longer in the herd.
When you look at the bottom 25% there are always some cows which we can clear out.
We keep a spreadsheet on our cows so we can monitor our genetic improvement. We think in the next couple of years it is possible to have an average herd BPI of 135, certainly a target to aim for anyway.
We use the Good Bulls phone app to get a short list of the bulls based on our criteria for BPI, and then filterfortraitssuchasmilkingspeedandtemperament;thenlookatpricesandpedigreesbygoingthrough semen catalogues.
We synchronise all our heifers and they are joined to fresh sexed semen. We’ve been getting conceptionratesof55-62%ateachjoining.Afterthefirstjoiningwerepeattheprogrambutusefrozen sexed semen on the higher genetic merit heifers. Lower genetic merit BPI heifers get calving ease conventional semen. After two rounds all heifers are then put out with home bred bulls which have been genomically tested.
We use natural heat detection in the cow herd. We used some sexed semen in the cows but mainly stick with conventional semen because of extra stress put on milking cows we don’t see the same conception rates as heifers. We don’t run any bulls in the milking cows only using AI three times a year.
We genomically test every calf and have done so for the past four years. Half our milking herd is now genomically tested, having come through our breeding program.
Having access to the genomic results on heifer calves means we can look at traits such as BPI, milking speedandfertilityandsellsurplusheifersintotheexportmarkets.Sellingfiveorsixheifersforexportcovers the costs of the genomic testing for the year.

Page 31
Using sexed semen gives us a high proportion of heifer calves and in 2018 we will have 145 2-year olds enter the herd of 420 head. It means we have a young herd and can put more selection pressure on the herd for things like cell count and fertility.
While we use a lot of sexed semen in the heifers, which costs $50-$70/straw, our budget for the milking herd averages $20/straw. We might use a couple of expensive bulls now and then, but we don’t have to pay big prices to get excellent bulls for the rest of the herd.
Bulls which are $100/straw aren’t necessarily better than cheaper bulls. The high price is often driven by breeding fashions, high demand and low availability. Wait six months and the same bulls will be cheaper.
We’ve got to where we are by breeding on a budget and choosing good, affordable bulls. It’s achievable.
Putting it into practiceThe following examples are all based on buying 200 straws and follow the approach we use to keep bulls costs down, while getting bulls which will make genetic progress in our herd.
Using the Good Bulls App, I select the minimum criteria for the bulls I want which are:
• BPI of 300
• Milking speed for 100
• Temperament of 100
• Cell count of 100
• Fertility of 100
• Type & Mammary of 100
The app then gave me a short list of 50 bulls to choose from.
About10bullsweresexedsemenat$50+/strawsotheyautomaticallydroppedofftheshortlistbecause they would blow the budget limit of an average price of $16/straw.
After going through the semen catalogues, I found a group of genomically tested bulls on the list were available at $16/straw on special at some stage during the year. I then went through and looked at the pedigree of the bulls to make sure they offered something which suited our herd and came up with a list which has six bulls sired by six different bulls at an average BPI of 323, ASI of 194 and Daughter Fertility of 109, at the average price of $16.
I then tried another approach which we had used to keep costs down which involved using a mix of proven bulls with progeny test sires for a total of 200 straws to still keep my average at $16/straw or less.
This involved using:
• 100strawsoffiveprogenytestssireswithlet’ssayanaverageBPIof280at$12/straw.
• 50 straws of MAEBULL with a BPI of 309 which was available for $22 a straw when it was on special.
• 50 straws of a genomic bull SILVERLINE with a BPI of 352 which was on sale for $16/straw.
All up this approach gave me an average BPI of 314 for the bulls with an average cost of $15.50 a straw. There is some risk using cheaper progeny test bulls, but they are genomically tested.

Page 32
A third approach which I believe could be used for someone not needing a heap of replacements or in conjunction with a sexed semen program in heifers is to use some beef semen in the bottom quarter of the herd. This lets you just keep calves from the better females and will increase genetic gain faster again.
• 50 straws of MVP at $24 when on special.
• 50 each of Vador and Silverline at $16 when on special.
• 50 straws of dairy beef at $8.
This gives you a BPI average of 329, ASI of 216, Daughter Fertility of 105 at an average price of $16/straw.
Plan ahead when buying semen One of the traps I believe people fall into is that they don’t think about which bulls to use or buying semen until a couple of weeks before joining.
We buy semen all year round and store in our own tank on farm. We have our list of bulls we are interested in each proof run and read the semen catalogues when they come in rather than throwing them out so we can watch the market. If a bull off my list is in a promotional pack then I grab it when it’s on special. For example, this year I bought semen when it was on special during International Dairy Week; it wasn’t a time of the year when we were joining but the semen price dropped and was within our budget.
It also important to talk with semen retailers when you are buying bulls - don’t be afraid to negotiate on their advertised prices.
Page 33
Using data to make better decisions and a stronger business
Brad and Meagan O’Shannessy dairy at Cooma, Northern Victoria. Their 200-cow herd calves in Autumn and Spring and their farm is totally reliant on bought in irrigation water. In 2015 they participated in the ImProving Herds project as Herd Test Focus Farmers. As they weren’t herd testing, the project provided them with a year’s free herd testing and support in getting set up and using the reports. The following year they switched to an A2 herd.
Farm stats (April 2018)
Herd size: 200
Breed: Mixed
Farm size: 97ha
Calving pattern: Split
Dairy: 20-unit swing over
Staff: Brad and Meagan plus a part time relief milker
Feeding system: 7-8kg of pellets year-round, 100% reliant on bought in irrigation water so home-grown feed base will vary from year to year
Herd testing history: Originally spot tested occasionally to deal with cell count issues. Now committed to bi-monthly herd testing
Where we wereMeagan and I have been farming for 10 years and started with help of our parents. My parents put 80 cows into the herd while we bought in another 50-60 head and have been slowly building up ever since. When you buy in cows you don’t have a lot of records.
My approach to dairy farming was based on what I had grown up with – but dairy farming has changedsignificantly.Whenmyparentswerefarming,theyhadlowtonodebtandcouldrelyonasecure allocation of irrigation water and sales. There were less variables in the business and people could farm based on experience and their gut.
WhenIstarteddairyfarmingIinitiallyadoptedthesameapproachandforthefirstfewyearsfarmedbased on my gut feelings on how to feed the cows, which cows to cull, how much to pay for irrigation wateretc.Wedidn’thavefiguresforourdecisions.Itwaseasytogetdistractedbecausetherewasnoclear plan. We thought the only way to get ahead was to borrow money; in hindsight what we were doingwasn’tsmartfinanciallybecausewehadamassivedebt.
While we came from a dairy farm, we were still learning. The big turning point for us was joining a DairyBusinessNetwork(DBN)discussiongroupfiveyearsagoafterafriendsuggestedit.
Thegroupwasgreat;itmadeussetoutourfullfinancialrecordsandphysicalfarmnumbersatthe end of the season. We then had to make a plan for the next 12 months and stick to it. It meant we couldn’t get distracted in the business. It gave us a real appreciation of the power of data and information in giving you control over your business. At the same time as joining the discussion group we also started using a nutritionist.
Page 34
When it came to 2014/15 when we had a couple of dry years. Water prices were going through the roof, but we were able to build a budget and a feed plan with the help of our nutritionist. We shut down our plan to grow a lot of millet and used bought in water to just grow corn and lucerne and also bought in chopped silage from our cropping neighbours. We didn’t want to increase our short-term debt. I hate to think how things might have gone if we hadn’t had a clear plan and a budget to stick to. Itcouldhavebeenafinancialdisaster.
Since that tough season we’ve made it a priority to have a budget for our business. Once you have figuresandabudget,youhavecontrol.Thereisalotlessstressinthebusinessbecauseyoucanmakeinformed decisions. The whole experience has made us realise how important it was to have data to make good business decisions.
It was through the DBN discussion group that we had the opportunity to get involved in the ImProving Herds project and start looking at data on our herd and to use that data in making better decisions.
Wefindhavingaccesstodatareallymotivatesusbecausewehavecontrolandcanmakechangesinour business and see the results.
You can’t keep doing the same thing over and over again and expect to get a different result.
Our herd testing experienceBefore ImProving Herds, we had only done the occasional spot test. We would use spot testing to solveproblemwhencellcountsflaredup.Apartfromfertilityandstructureissueswewouldcullcowsif we could see a visual mastitis problem, or if we put a cow on a test bucket and could identify that her production was dropping off. We always got an extra helper in the shed if we were spot testing. One of the main reasons we hadn’t regularly herd tested was the cost, which was an issue because of our debt levels and seasonal conditions at the time; it made herd testing seem like a luxury.
In 2015 ImProving Herds gave us the opportunity for free bi-monthly herd tests for 12 months. It was a veryattractiveoffer.TheImProvingHerdsprojectalsogaveushelpintheshedforthefirstyearandhelp in interpreting the herd test results we received.
After our experience with regular herd testing we are committed to it now.
Oneofthechallengeswhenyoustartherdtestingisgettingyourmindaroundit.Itisstressfulthefirsttimeyoudoit.Youhavetogeteverythingsetupwiththeequipment,flasksandmilklinesandthenthe cows can baulk going into the dairy because it looks different.
If I am doing it on my own, I generally allow 1/2 - 1 hour at the most to set everything up.
WenowpayAdamfromNorthernHerdDevelopmenttohelpusatherdtestingbecauseitsimplifieseverything.Heisveryefficient,goodwiththecowsanduseshistimeeffectively.Ittakesthepressureoff me and as a result there is no stress during herd testing.
All up the extra labour involved with herd testing involved approximately 2 hours per milking. Adam will often have everything set up by the time I’ve fetched the cows and set the paddocks up so when I get back to the shed we are ready to go.
Milking can take a bit longer until we get into a routine by the third row of cows. The only extra job I haveduringmilkingiswritingnumbersonflaskswhichdoesn’treallydisruptmilkingatall.
All up the cost for bi-monthly herd testing is $15/cow/year, plus Adam’s labour which works out at $240 for two milkings on the same day or $1400-1500 a year.
In total, herd testing costs us $4500 a year. It’s a cost which is recouped by making better decisions. If herd testing shows me that the bottom 10% of my herd were doing 10 litres or that those bad subclinical cows that could potentially take you out of premium, it would recover that cost in just one month.

Page 35
Where we are now Fast forward to April 2018 and we herd test every second month because the information it generates is so useful, not just for herd management but also for business management.
We now base our decisions on hard data about our cows’ production, performance and pregnancy status.Wecan’thidefromthosefigures,andtheinformationissimplynotdetectablebyjustlookingat the animal. Even if you think you know your herd really well, there will be some surprises.
We’ve had some cows that looked like they were producing really well, but their herd test results showed they clearly weren’t. In contrast there were some quiet achievers that looked quite ordinary but produced 50 litres a day at peak. Seeing what the top cows can do is inspiring but gets you asking why the whole herd can’t be like that.
It’s the same with milk quality. There are some high cell count cows that you can’t pick because there are no clots or signs of mastitis when they are milked. While we’ve always had premium quality milk, sometimes we can get close to the cut off so it’s always good to identify the cows that could push us over. Herd testing enables us to pick up cows that need to be treated or those with recurring subclinical mastitis and need to be culled.
Data-driven decisions
Herd test data underpins our decisions about culling, drying off/mastitis management, pregnancy testing and more. Although these are day-to-day logistical decisions, having hard data turns them into important business decisions.
There are two main things I look at whenever we get herd test results back: the cows in the lowest 10% of the herd for production, and the cows in the top 10% in the herd for cell count because these cows are the ones we need to make decisions about.
Our aim is to take the bottom 10% out of the herd for production and quality and keep replacing those cows with better young stock every year. We want to cull on cell count and production.
We keep a close eye on production of each cow that has been in milk for 300 days and dry them off as soon as their production falls below feed costs. This ensures feed resources are directed to the mostprofitablecows.
This is particularly important in our system which is totally reliant on purchased irrigation water and with cows fed 7-8kg pellets all year round. When water prices are high, we really need to make sure we are running cows which are producing well and herd test results let us identify those cows.
Inthefuturewe’dliketobeabletouseourherdtestresultstogeneratefiguresongrossmargin(income over feed costs) per cow.
Preg testing from milk samples
Last October we also used herd testing as a way of pregnancy testing cows via milk samples. The cost is comparable to traditional pregnancy testing with a vet but the milk sample eliminates the hassle and lost production involved in holding cows in the yards until the vet arrives.
Using the herd test results for preg testing reduces extra handling and is a lot less stressful on the cows.
Data going forwardWe haven’t been able to track our genetic progress to date because we have recently changed the herd over to A2 production. The changeover has also meant we haven’t been able to expand the herd as quickly as we would have liked and had to be somewhat lenient on our targets when it comes to culling cows.

Page 36
At the end of this year we are aiming at having 210 A2 cows and our goal is to have the herd reach 240 milkers by the end of 2019.
Once we can stabilise the herd numbers we will be looking at tracking our genetic progress for Balanced Performance Index (BPI) and will start genomic testing our heifers. We can then consolidate the herd, start putting greater selection pressure on production and make earlier culling decisions.
So far, our progress has been:
• 2010: a blank – as position unknown!
• 2013–2015: 6500L/cow/yr with 4-5kg/cow/day
• 2016: 7000L/cow/yr with 6kg/cow/day
• 2017: 8000L/cow/yr with 8kg/cow/day
I’d love to think in the future we can get to 9000L/cow.
Switching to A2We became interested in producing A2 milk after we received an offer from the Mulcahy Brothers.
We had been long time suppliers to Tatura Milk Industries but when we looked at the A2 offer and did thebudgets,itwasveryattractivefinancially.
We spent time with the Mulcahy Brothers and looked at their business which was integrated from supply through to marketing. It was more personalised, innovative and had good forecast prospects. We talked to other A2 suppliers and they were very happy with the company.
You can’t dabble in A2 – you have to fully commit; so we DNA tested all the cows in the herd for the A2 gene. The cost of testing was covered by the A2 milk company. It turned out 40% of the herd were homozygous for the A2 genes which is much higher than average of 25%.
We sold all the cows which weren’t A2/A2 and we bought in replacements which were pure A2 from the Mulcahy Brothers.
All over the changeover has costs us $70,000 in replacing 60% of the herd and in the lost production associated with changing over, but we believe this in an investment in our businesses.
Ittookthefirstyeartorecoupthecostsofthechangebutwehaven’tlookedback.Weare$100,000better off this season alone.

Page 37
Glossary of Terms
Term Definition
ArtificialInsemination(AI)straw The single insemination concentrated dose of semen from a bull (frozen or fresh).
Australian Breeding Value (ABV) An estimate of a dairy cow or bull’s genetic merit, for a given trait.
Balanced Performance Index (BPI) An economic index that blends production, type and health traitsformaximumprofit.Itreflectsmostfarmers’preferences.
Genetic Futures Report A soon-to-be released tool to look at the potential impact of breeding choices on a herd’s future genetic merit.
Genetic Progress Report A 2-page report that allows users to track the effect of breeding decisions and to monitor trends in a herd’s genetic merit.
Genomic ABV An Australian Breeding Value that has been evaluated using genomic (DNA) and pedigree information.
Genomics The large-scale use of DNA information to predict the potential performance of bulls and cows.
Genotyping The process of analysing a DNA sample from an individual animal to predict potential performance
Good Bulls App An interactive app for mobile devices that provides detailed ABVsonmorethan20,000bulls.Userscansort,filter,shortlist and export bulls to match their breeding objectives.
Good Bulls Guide A list published by DataGene of leading available bulls ranked by common breeding objectives. Bulls that carry the Good Bulls logo meet, DataGene’s minimum criteria for Balanced Performance Index, reliability and are available for purchase.
HerdData App An app for mobile devices that makes it quick and easy to enter or access herd records while you are in the paddock or dairy.
Herd Recording The recording and use of herd information in making management decisions.
Herd Testing The analysis of milk samples from a herd including volume, fat and protein percentage and individual cow cell counts.
Health Weighted Index (HWI) An index which allows farmers to fast track traits such as fertility,mastitisresistanceandfeedefficiency.
Index Indices take the hard work out of breeding for more than one trait at once by combining them.
Type Weighted Index (TWI) Anindexwhichallowsfarmerstofinetunetypetraitstomakea good herd even better.

Page 38
The story of our Muster caterers
The Tarwin Valley Campdraft ClubAll proceeds of today’s catering, which is provided by the Tarwin Valley Campdraft Club, goes towards the purchase of a Rifton TRAM, a transfer and mobility device designed to assist disabled people with comfort and ease.
When the funding target is reached, the Rifton TRAM will be provided to Aylah Hengstberger - a beautiful nine-year-old girl from Gippsland, whose doctors cannot give her family a diagnosis for her cerebral palsy-like symptoms.
Doctors do not know of another child in the world who has the same condition as Aylah.
Shestartedlifeasahealthybabyandreachedallherfirst-yearmilestones.Butaroundthetimesheshould have started to walk, her progress stalled.
The entire team at The Muster wish Aylah all the very best - and we hope that the contributions from the catering proceeds help bring the TRAM to Aylah as soon as possible. Delegates are encouraged to add to the donation tin at the catering tent.

The ImProving Herds project would not have been possible without the collaboration of a team of dairy farmers from around Australia. We thank each and every one of the following people, their family and staff, for the contribution they have made.
Tim Jelbart Leongatha South, VIC
Terry & Janine Clark Nerrena, VIC
Paul & Lisa Mumford, & their advisors Won Wron, VIC
Michael Axford and family Korumburra, VIC
David Owen Finley, NSW
Fleur, Elizabeth & Sam Tonge Dobbies Bight, NSW
Darren & Sharon Parrish Bodalla, NSW
Mark Fraser Aberdeen, NSW
Rodney Teese Veresdale, QLD
Geoff & Ruth Chalk Boonah, QLD
Graeme & Michele Hamilton Mt Gambier, SA
Gary Zweck Blyth, SA
Ian & Ruth McGregor Busselton, WA
Peter Harris Dardanup, WA
Garry & Bev Carpenter South Riana, TAS
Cheryl McCartie & Theo van Brecht Ringarooma ,TAS
Marian McDonald Jack River, VIC
Lisa Broad Lockington, VIC

ImProving Herds | A dairy industry initiativec/- DataGene AgriBio Agribio, 5 Ring Road (La Trobe University) Bundoora VIC 3083
P: 03 9032 7191 | E: [email protected]
per cow per year
ImProving Herds found that, on average,
the top 25% of cows in a herd (based on BPI) produce a margin over feed and herd
costs of $300 more than the bottom 25%.
Analysis drew on
and herd data from real Australian dairy farms and included 7,700 lactations
from 2,600 cows.
across dairying regions and feeding
systems.
The message is clear:
The daughters of high BPI bulls
perform better under Australian
conditions.