jeff hopkins hopkins phoenix observatory (counting photons) spectroscopy for pre-schoolers member of...
TRANSCRIPT

Jeff HopkinsHopkins Phoenix Observatory
(Counting Photons)
Spectroscopyfor
Pre-Schoolers
Member of SAC
2 October 2008

What is Light?

And There Was Light!
Where:The divergence of E (electric field) = 0The divergence of B (magnetic field)= 0The curl of E = -partial derivative of B with respect to time The curl of B = 0 x 0 x partial derivative of E with respect to time
In 1865James Clerk Maxwell Said
These equations quite elegantly describe the relationship between electric and magnetic fields and thus electromagnetic radiation.
What these equations describe is the unit of electromagnetic radiation called a photon.
Maxwell’s Equations

PhotonsLight consists of small packets of energy called photons. Photons have no rest mass and always travel at the speed of light, since they are light.
Depending on how a photon is measured it will manifest itself as a particle or wave.
The frequency or wavelength of photon is a function of it’s energy. The higher the energy, the higher the frequency (shorter the wavelength).

Wavelength (
For Light
= c / f
Where: is the wavelength in meters c is the velocity of light, 299,792,458 meters/secondandf is the frequency in Hertz (Hz)
For light frequencies, wavelengths are given in nanometers (nm) or Angstroms (Å). 1 nm = 10 Å

Energy verse Intensity
To keep things straight, the intensity of light is related to the number of photons and the energy of light is related to the frequency or wavelength of the photons.
The brighter a color, the more photons involved. The higher the energy, the more toward the blue end of the spectrum the photon is (higher frequency, shorter wavelength).

Photon EnergyWhere do photons come from?
Atoms consist of a nucleus surrounded by electrons. The electrons are in specific energy states or levels.
If an electron is raised to a higher energy state it will soon fall back to its lower state and emit a photon of energy equal to the difference in the two energy states.
E = h * c / Where:E = Photon Energyh = Planck’s ConstantC = Speed of Light = Wavelengthh = 6.62606896 x 10⁻³⁴ J.s

Absorbing Energy
A photoninteracts with
an orbital electron and raises it to a
higher energy state. The
electron absorbsthe photon.

Emitting Energy
After a short time the electron falls back to its lower
energy state emittinga photon with the
energy of the difference between
the two energystates

Electromagnetic Spectrum
The sensitivity of the human eye determines the visible spectrum and is typically 380 nm to 750 nm

What is Color?

Newton’s Experiment (1670)White light breaks up into colors
Light colors combine to white light
Single color does not change

RGB Photons
Red, Green and Blue photons produce White for us to see.
There are no White Photons

Our Eye
Our eye has sets of light cones that are sensitive to red, green and blue photons.

Color
Color is an illusion!
Different intensities of different energy photons striking our eye produce all the
colors we see.
Sometimes our eyes fools us greatly.

Our ExperimentEach of you will have your own spectroscope so you can examine light.This is yours to keep. It is a scientific instrument so treat it well!
Do Not take it apart!
Diffraction Grating Slit
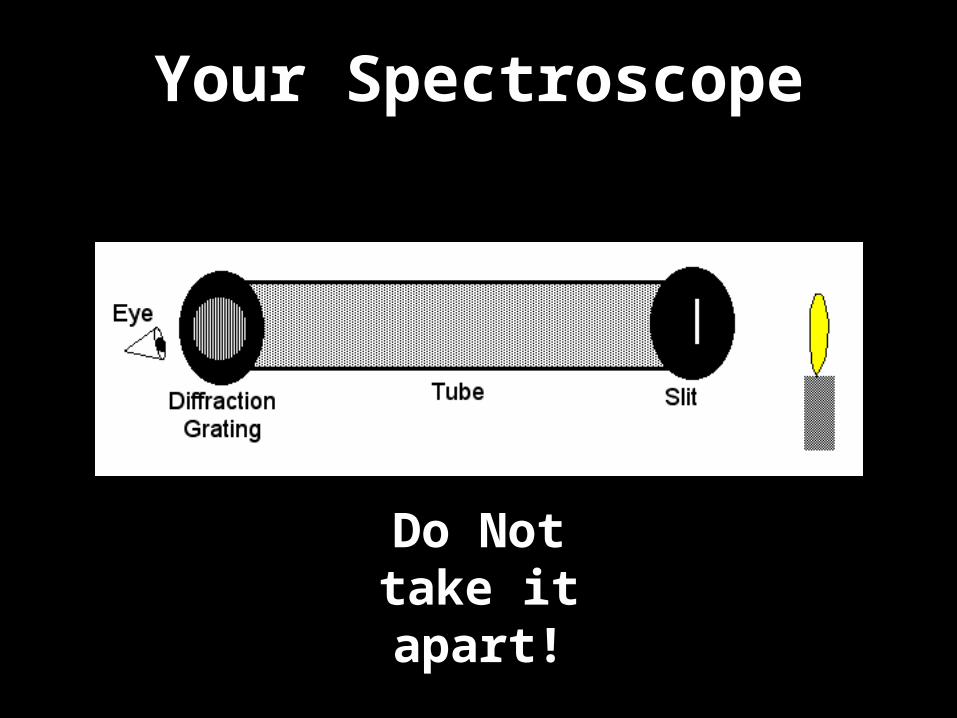
Your Spectroscope
Do Not take it apart!

What You See
AdjustingIf needed, hold the slit end with the slit vertical
and rotate the tube to see the above. The spectral lines should be on the right and left.

White Light
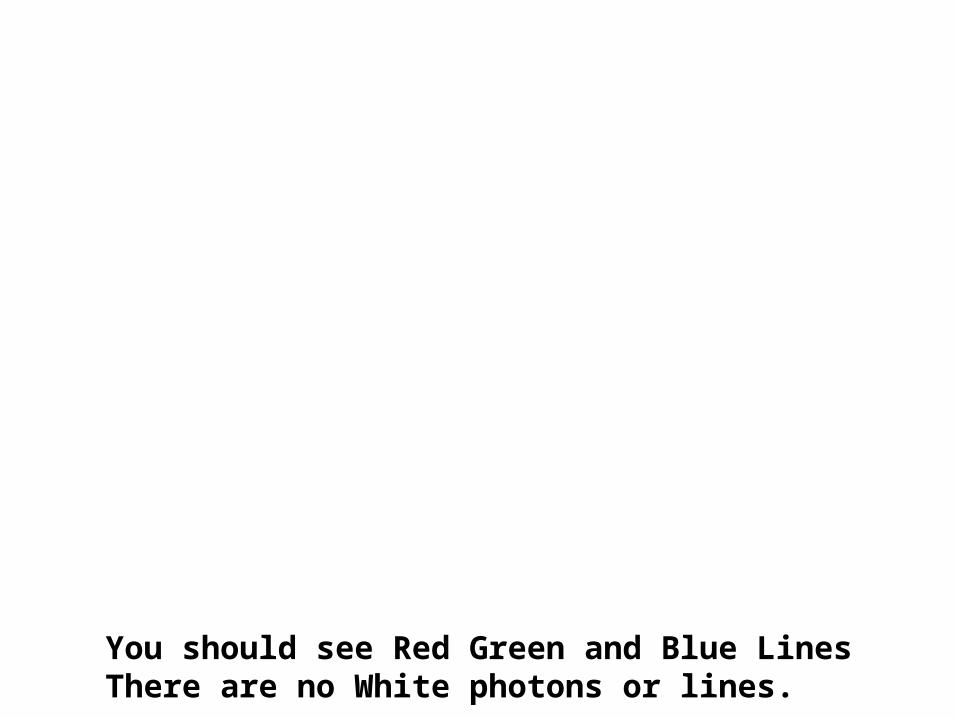
White
You should see Red Green and Blue LinesThere are no White photons or lines.

Red Photons

Red Light

Red
You should see a Red Line

Green Photons
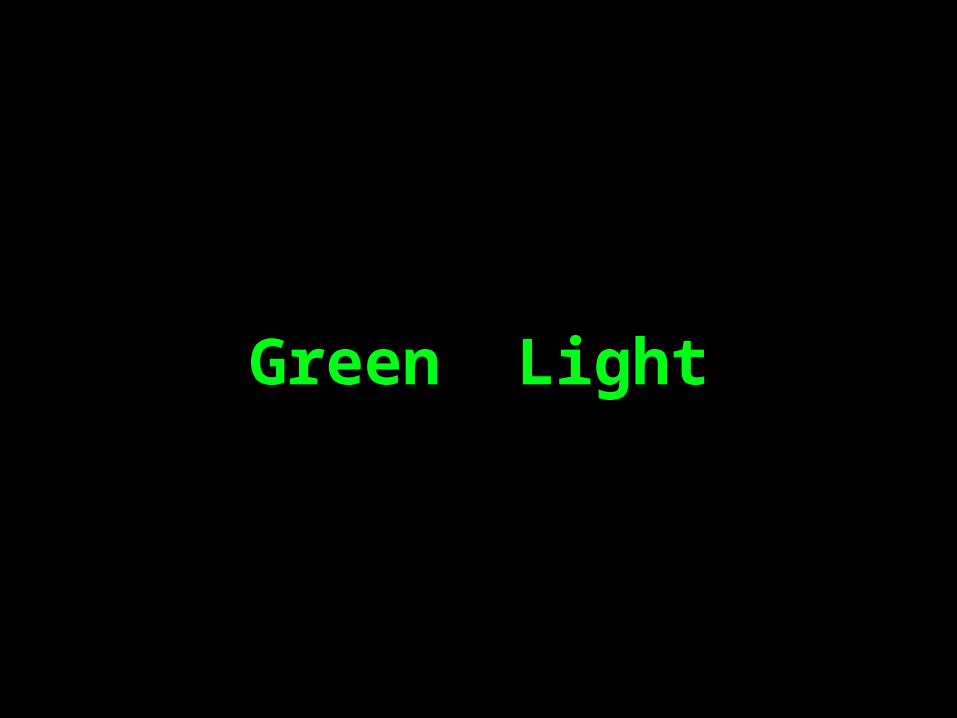
Green Light

Green
You should see a Green Line

Blue Photons

Blue Light
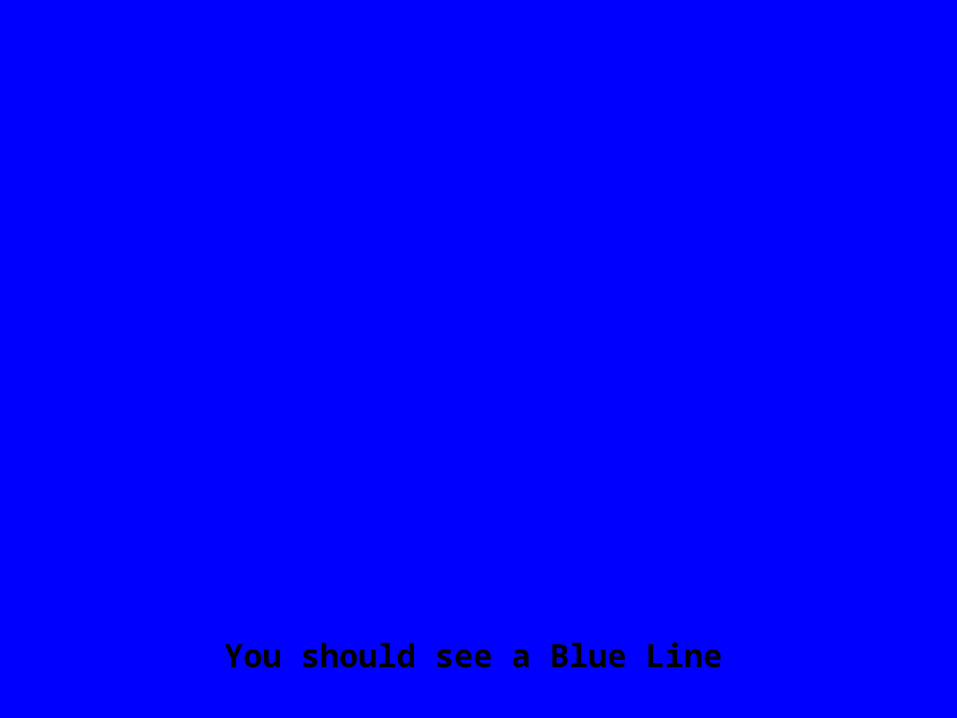
Blue Light
You should see a Blue Line

Yellow Light
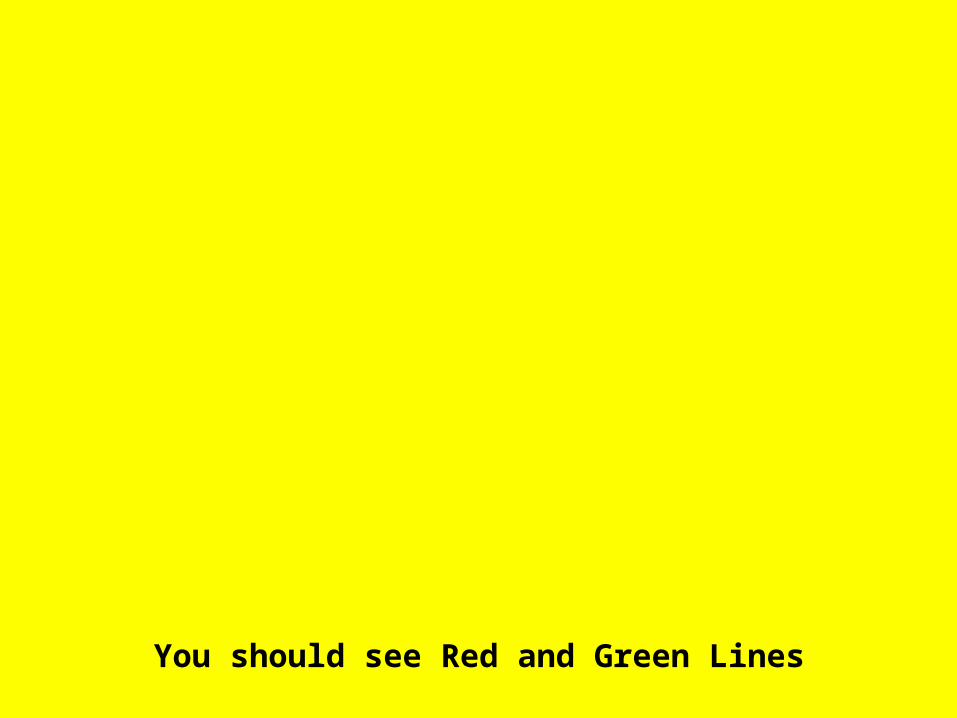
Yellow
You should see Red and Green Lines

COLOR IS AN
ILLUSION

Red & Green Photons
Red and Green photons produce Yellow for us to see.

Yellow Photons
There are also Yellow photons as well as
photons of every color.

Demonstration

Pickle Light
A normal Pickle
A normal Picklewith power applied.intense yellowsodium D lineslight are emitted

Incandescent Light
A continuous Spectrum

Fluorescent Light
A Emission Spectrum

Pickle Light Spectrum
You should see a Yellow Line

RGB
Three basic colors of visible light are RGB.
RGB stands for Red, Green and Blue
Combinations of these colors with different intensities (number of photons) can produce all the colors we can see. RGB is an emission color set meaning color of the emitted light as opposed to reflected light.
TV sets and computer monitors use emitted RGB light at different intensities to produce desired colors.

Why RGB
While photons of the desired color could be used it would mean we would need to be able to generate millions of different colored photons for all the colors.
Because our eye responds to RGB photons with the effect of letting us see any color by just varying the RGB intensities, we can generate all the colors with just the three RGB colored photons.
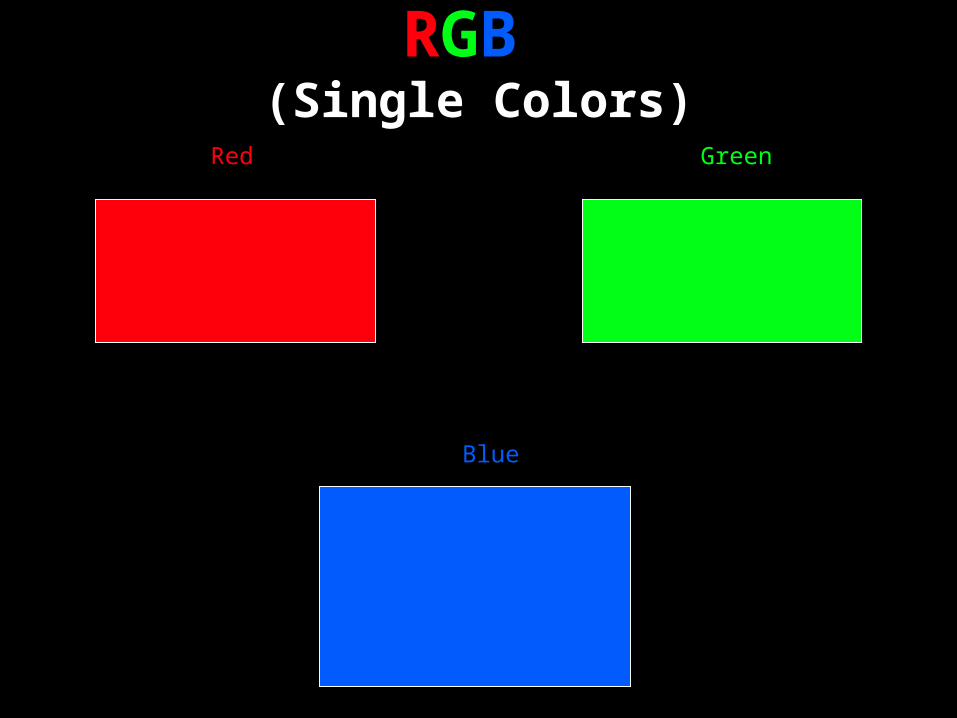
RGB (Single Colors)
Red Green
Blue

RGB (Combinations)
100% Green + 100% Blue = Cyan 100% Red + 100% Blue = Magenta
100% Red + 100% Green = Yellow

RGB (Extremes)
100% Red + 100% Green + 100% Blue = White
0% Red + 0% Green + 0% Blue = Black

Technicolor
Colors seen on a movie screen, TV screen or computer monitor are the results of a combination of three basic colors, red, green and blue.
Color film is a combination of three layers (RGB) combined to produce a full color image.
We can produce a full color image by take monochrome pictures through a red, green and blue filter and then shinning white light through each and overlapping them.

Taking Monochrome Images

Three Monochrome Images
Scene through Red Filter Scene through Green Filter
Scene through Blue Filter

Red Filter Image
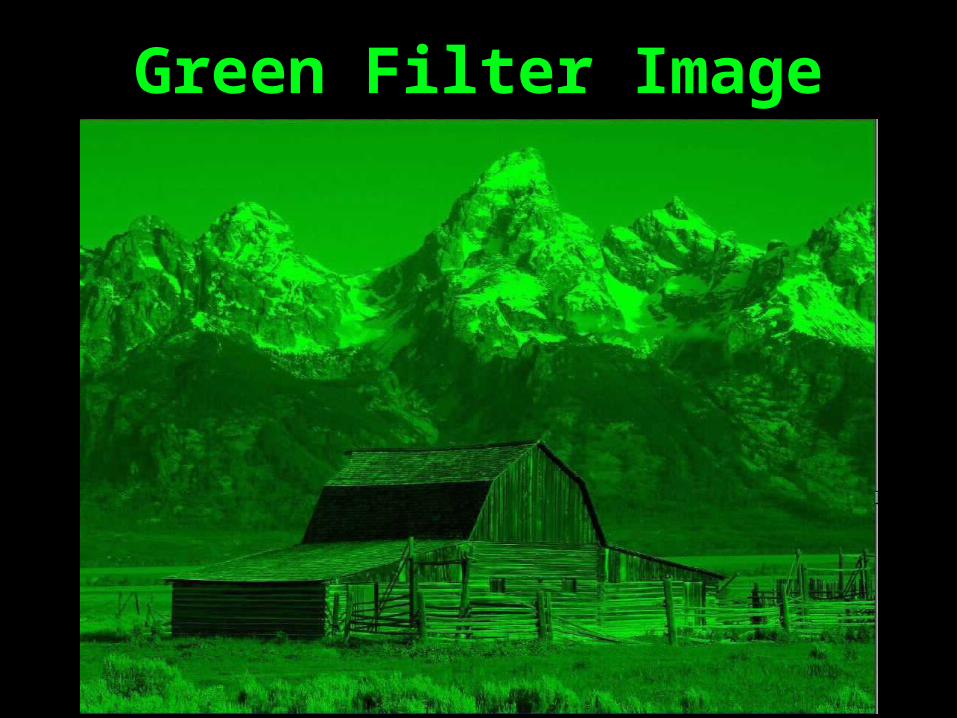
Green Filter Image

Blue Filter Image

Composite

CYMK
When an object is illuminated with white light, it will reflect colors. The basic colors of reflection are CYMK. CYMK stands for Cyan, Yellow, Magenta and Black. The characteristic of the material determines what colors are reflected.
CYMK is used to create color with ink and paints. It is a reflective color creating set of basic colors. Color pictures in magazines, and books use this. It is known as a four-color process.
White light reflected from the paint or ink produces the colors we see.

CYMK Reflection
White light reflected from the paint or ink produces the colors we see.

CYMK Colors
Magenta
YellowCyan
100% Cyan + 100% Magenta + 100% Yellow = Black

CYMK (Combinations)
0%Cyan+0%Magenta+0%Yellow+0%Black=White
100% Magenta + 100% Yellow =Red100% Cyan + 100% Yellow =Green
100% Cyan + 100% Magenta =Blue

Types of Spectra
Continuous Spectra
Emission Spectra
Absorption Spectra

Continuous Spectrum
Continuous spectra are produced from a high temperature source such as inside the Sun or an incandescent light bulb

Emission Spectrum
Emission spectra are produced from a source with excited atoms of an element, e.g., an LED, or fluorescent light bulb or the Pickle Light
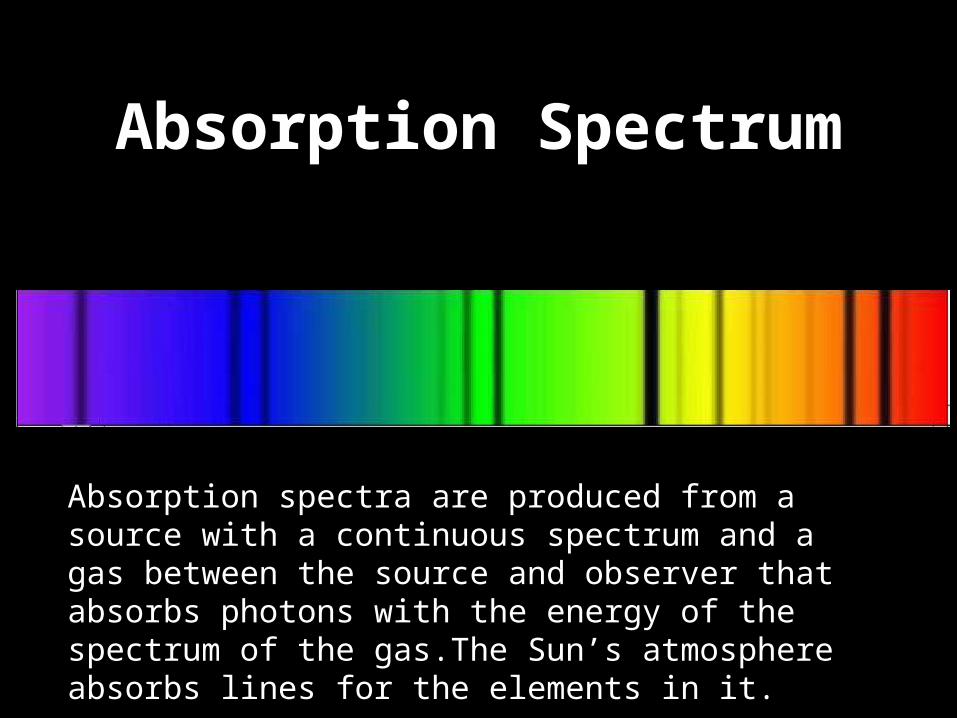
Absorption Spectrum
Absorption spectra are produced from a source with a continuous spectrum and a gas between the source and observer that absorbs photons with the energy of the spectrum of the gas.The Sun’s atmosphere absorbs lines for the elements in it.

Solar Spectrum
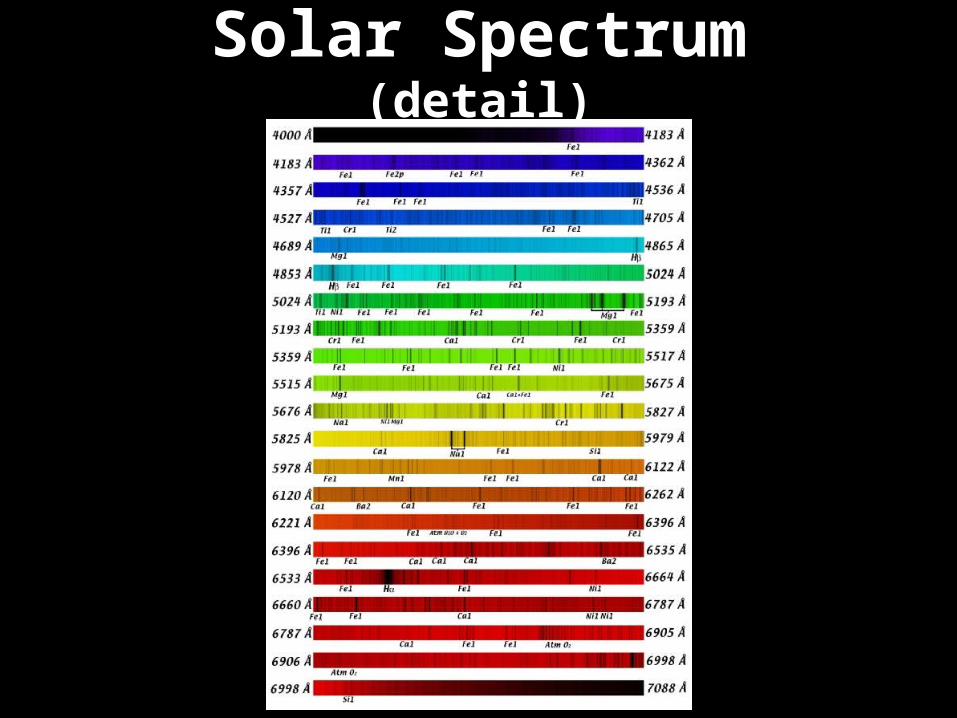
Solar Spectrum (detail)

Sun Spectrum
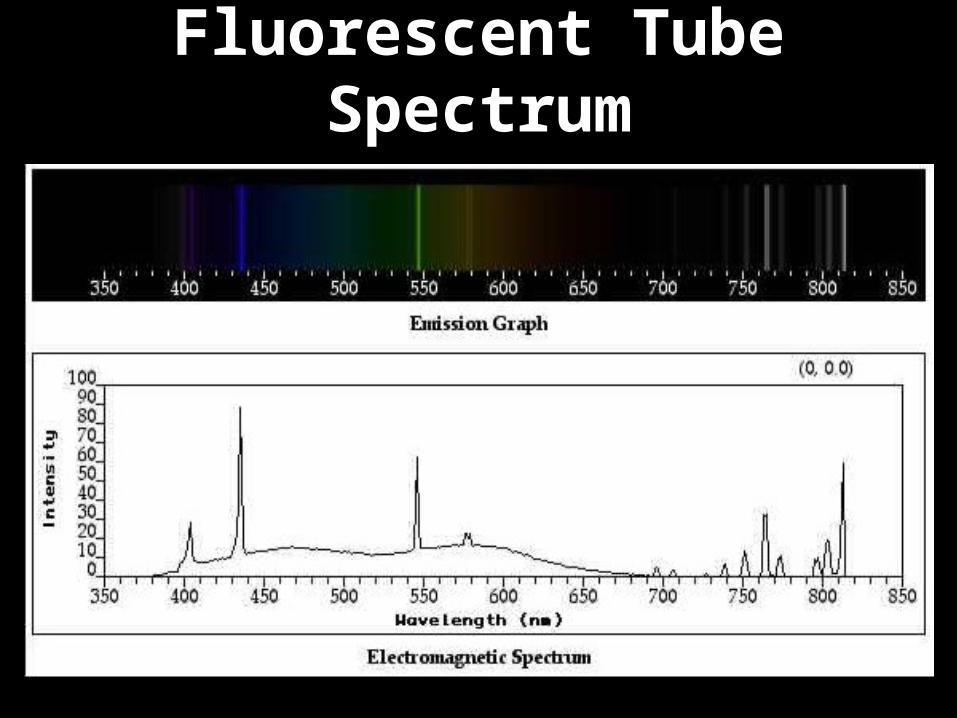
Fluorescent Tube Spectrum
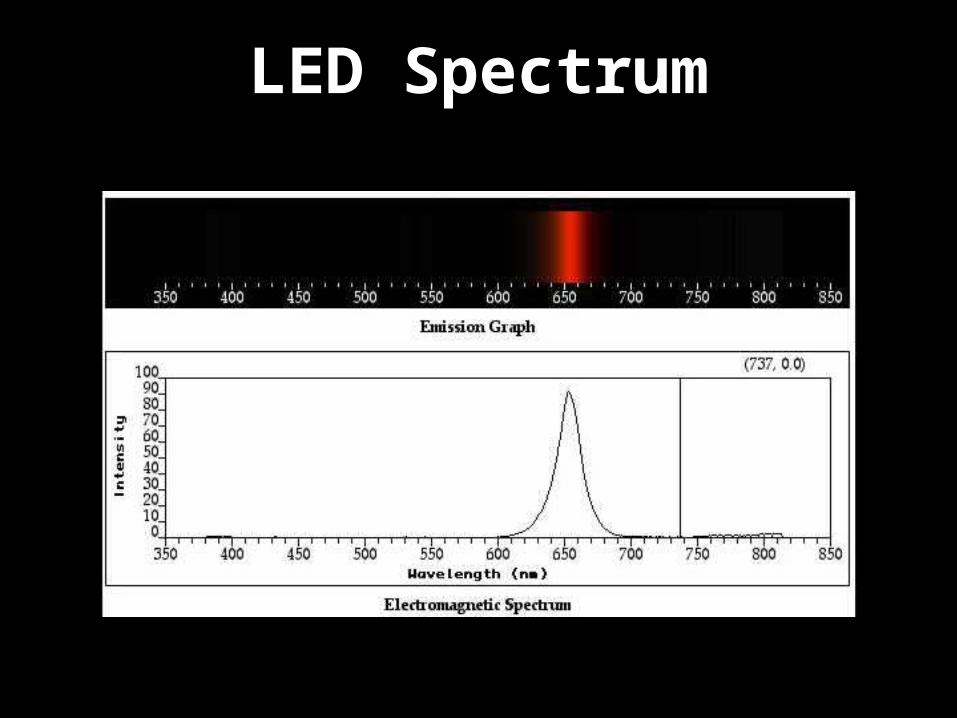
LED Spectrum

Hydrogen Spectrum
H line 656.28 nm

Sodium D Lines
The sodium D lines are at 588.9950 and 589.5924 nm
Absorption Lines
Emission Lines
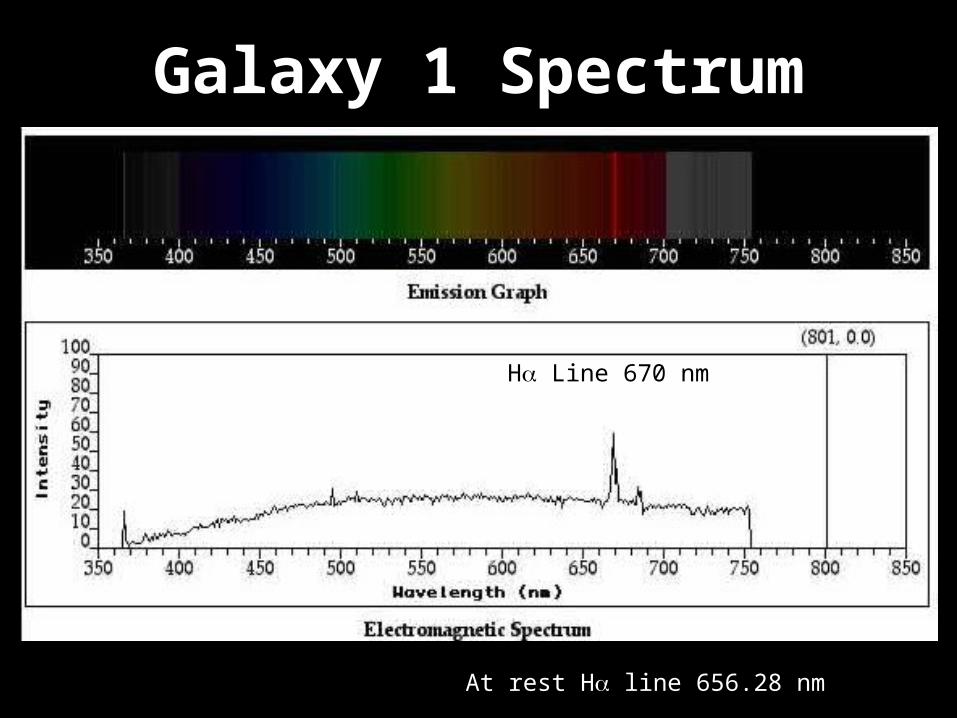
Galaxy 1 Spectrum
H Line 670 nm
At rest H line 656.28 nm

Galaxy 2 Spectrum
H Line 675 nm
At rest H line 656.28 nm

Galaxy 3 Spectrum
H Line 690 nm
At rest H line 656.28 nm

Galaxy SpectrumsGalaxy 1 H Line 670 nm
Galaxy 2 H Line 675 nm
Galaxy 3 H Line 690 nm

Doppler Shift
v = x c / is the change in wavelength due to motion
is the stationary wavelength
v is the relative velocity
c is the velocity in the medium (speed of light in a vacuum is 3 X 10⁸ m/s)
To get just a 1% change in the frequency of light, a star has to be moving 1,864 miles per second. For a blue light bulb to look red, it would have to be flying away from you at 3/4 of the speed of light.

Galaxy Doppler Shift
v = x c /
Thus for the galaxies
Galaxy 1: = 670 nm - 656 nm = 14 nmGalaxy 2: = 675 nm - 656 nm = 19 nmGalaxy 3: = 690 nm - 656 nm = 34 nm
Galaxy 1: v = 6.4 x 10⁶ meter/sec or 3,974 miles per secondGalaxy 2: v = 8.7 x 10⁶ meter/sec or 5,403 miles per secondGalaxy 3: v = 15.5 x 10⁶ meter/sec or 9,656 miles per second

Spectroscopy
Spectroscopy is the detailed measure of an electromagnetic spectrum.
A device used to display and measure an astronomical optical spectrum is known as a spectrograph.
This device may also go by the name of spectrometer, spectroscope and spectrum analyzer.
These terms are sometimes interchanged.

Spectroscope
A spectroscope may use either a prism or grating, but is used visually.

Spectrometer
A spectrometer usually uses a prism or diffraction grating with an electronic or photographic detector.

Spectrograph
A spectrograph uses a diffraction grating with an electronic or photographic detector.

Lhires III Spectrograph

Lhires Diagram

HPO Spectroscopy

Raw Spectrum
No pretty rainbow because a monochrome camera was used. If the spectrum was in colorit would be all red. The dark line near the middle is a hydrogen alpha absorption line.

Spectrum Profile
By summing the ADU values of pixel columns a spectrum profile can be generated.

H Line
When a gas discharge tube containing hydrogen gas is excited by passing a current through it, the gas glows red. There are several spectral lines produced, but the most prominent is the hydrogen alpha (H) line at 6,562.8 Å.
Most stars are made of mainly hydrogen so the H line provides an excellent reference line with which to explore details about a star’s spectrum.
Why the interest in the H Line?

Star H LinesStars burn hydrogen and produce a continuous spectrum.
Some stars produce a large H emission line superimposed on the continuum. This is seen as a bright line in the continuum.
Some stars have an atmosphere of hydrogen gas that absorbs the H radiation and thus produces a hole or dark line in the continuum.

H Line Detail
Shifted toward the blue Shifted toward the red

Be StarsBe stars are non-supergiant B-type stars whose spectra have, or had at some time, one or more Balmer lines in emission. The mystery of the "Be phenomenon" is that the emission, which is well understood to originate from a flattened circumstellar envelope or disk, can come and go episodically on time scales of days to decades.

Be Stars (continued)
This has yet to be explained as a predictable consequence of stellar evolution theory, although many contributing factors have been discussed, including:
* rapid rotation * radiation-driven winds * nonradial pulsation * flarelike magnetic activity * binary interaction
Observations indicate that all Be stars are rotating rapidly, at up to 90% of the velocity at which gravitational force is balanced by centrifugal force at the star's equator (~400 km/s). In effect, material at the surface of the star is almost in orbit, so that only a slight additional force is necessary to move it into the circumstellar disk.

Be Stars H Line
Near 100% H Ring Emission
Some Absorption ofStar H Emission
Lower H EmissionGreater H Absorption

AMysteriousStar System

Auriga
N

Epsilon AurigaeWhile Epsilon Aurigae is not a Be star it is a most interesting star system.
It is an eclipsing binary system and has the longest known period of 27.1 years.
It also has the longest known eclipse of nearly 2 years.
The main star is an F supergiant with a diameter of 200 timesthat of the Sun, one of the largest stars known.
The unknown companion has a diameter of 2,000 times that of the Sun. The companion has been likened to around paving brick with a hole in it.
The next eclipse starts next summer.

Epsilon Aurigae System
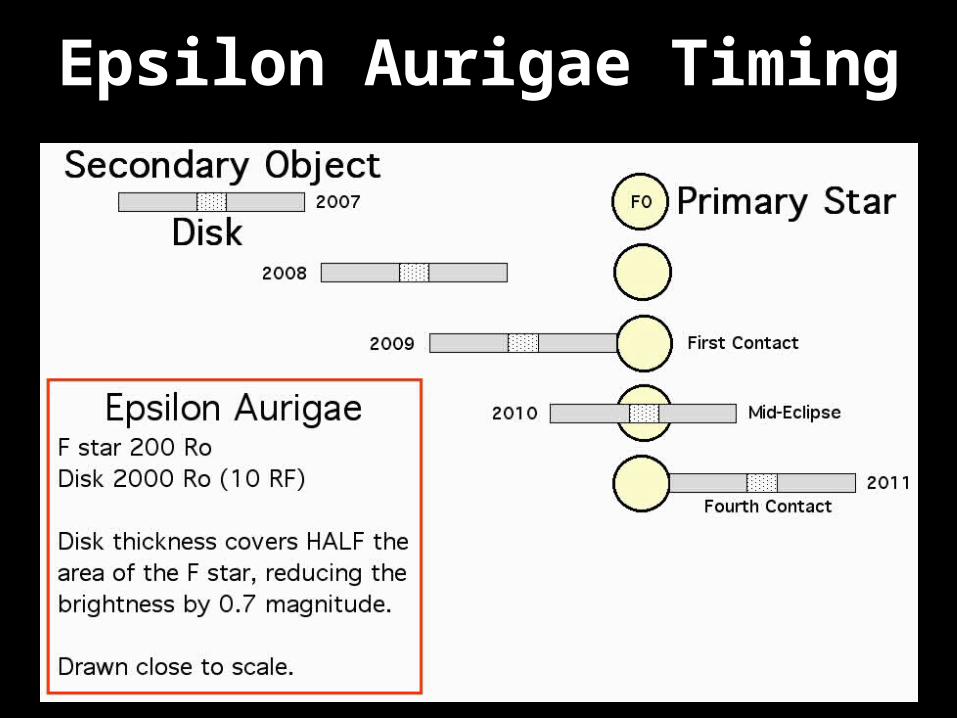
Epsilon Aurigae Timing

Epsilon Aurigae H
Out-of eclipse H is most interesting

Things To DoUse your spectroscope to look at:
Stars at night
Street lights
Different kinds of light in your home
Fires
Anything that glows
Have Fun and Learn!

Advertisement
New Book
Epsilon AurigaeA Mysterious Star System
Special!Normally $29.95 + S&H
Tonight $25.00

The End