jcy international berhad - riding the technology wave - 25/6/2010
TRANSCRIPT

8/9/2019 JCY International Berhad - Riding The Technology Wave - 25/6/2010
http://slidepdf.com/reader/full/jcy-international-berhad-riding-the-technology-wave-2562010 1/7
Table 1: Inve stment Statistics Bloomberg: JCYH MK
Core Net EPS
FYE Turnover Profit Core EPS Growth PER C.EPS* P/ NTA ROE Gearing GDY
Sep (RMm) (RMm) (sen) (%) (x) (x) (x) (%) (x) (%)
2009 1,758.0 207.3 10.1 2.2 15.0 - 3.9 25.8 Cash 3.4
2010f 2,187.0 301.5 14.7 45.5 10.3 15.0 3.2 31.1 0.1 4.6
2011f 2,666.1 368.5 18.0 22.2 8.4 18.0 2.7 32.3 Cash 5.9
2012f 3,068.7 437.4 21.4 18.7 7.1 19.0 2.3 31.8 Cash 6.6
Main Market Listing / Non-Trustee Stock / Syariah-Approved Stock By The SC * Consensus Based On IBES Estimates
♦ One of the largest HDD component manufacturers. JCY International
(JCY) is principally involved in precision engineering for hard disk drive
(HDD) mechanical components, with plants in Malaysia, Thailand and China.
The company is one of the largest HDD component manufacturers in the
world with an estimated monthly capacity of 32m pieces.
♦ Bright outlook for HDD. Trendfocus expects FY09-12 HDD shipments to
grow at a 3-year CAGR of 11.6%. We believe the demand for HDDs will be
mainly fuelled by: 1) new IT server purchases and replacement to 2.5’’ HDDs
(from 3.5’’); 2) IT replacement cycle; 3) growing demand for data storage
used in gaming and multimedia applications i.e. digital media box; and 4)
consumer boom in emerging markets i.e. the BRIC’s 08-13 CAGR of the
consumer electronics market is expected to grow 7.8%. ♦ Main supplier to top HDD vendors. JCY’s main customers are the world’s
top HDD vendors i.e. Western Digital (WD) and Seagate. Together, they
combine a market share of 59%. We highlight that the company supplies
60% of base plates, 50% of top covers, and 35% of actuator pivot flex-
circuit assembly (APFA) for WD’s requirements. Similarly, the company is a
key producer for Seagate, supplying 50% of anti-disk and 10% of base plate
requirements. Therefore, JCY is estimated to command a global market
share of 25% for the base plate, 16% of the top cover, and 12% of the
APFA.
♦ Risks. The company faces a number of risks, including: 1) price fluctuations
of raw materials that may impair margins; 2) dependence of revenue on
major customers; and 3) foreign exchange fluctuations.♦ Our investment case. We like JCY given: 1) its proven track record of
manufacturing capability; 2) it is a leading HDD component manufacturer;
and 3) its ability to diversify into various HDD components.
♦ Fair value of RM2.16. We estimate FY09-12 EPS CAGR of 28.4% on good
earnings visibility given the strong demand outlook for HDD. We have
assumed a target PER of 12x for JCY after imputing a discount to the peers’
weighted average FY11 PER of 13.6x to reflect its mid-range market cap
although this is still higher than the 10x target PER that we have assumed
for Notion Vtec. Our indicative fair value of RM2.16 is based on 12x FY11
EPS, which implies a 42.1% upside to the share price, plus gross yields of 5-
6% p.a.. We thus initiate coverage on JCY with an Outperform
recommendation.
Corporate H igh l ights
New Coverage
JCY International Berhad
Riding The Technology Wave
M
a l a y s i a
M A R K E T D
A T E L I N E
P P
7 7 6 7 / 0 9 / 2 0 1 0 ( 0 2 5 3 5 4 )
25 June 2010
RHB ResearchInstitute Sdn BhdA member of theRHB Banking GroupCompany No: 233327 -M
Share Price : RM1.52Fair Value : RM2.16
Recom : Outperform (Initiate Coverage)
Please read important disclosures at the end of this report.
Issued Capital (m shares) 2044.9
Market Cap (RMm) 3,108.2
Daily Trading Vol (m shs) 1.5
52wk Price Range (RM) 1.46-1.56
Major Shareholder: (% )
YKY Investments 74.1
FYE Sep FY10 FY11 FY12
EPS chg (%) - - -
Var to Cons (%) -2.0 - +12.6
PE Band Chart
Relative Performance To FBM KLCI
Yap Huey Chiang(603) 92802166
JYL International
FBM KLCI
PER = 15x
PER = 13x
PER = 11x
Page 1 of 7A comprehensive range of market research reports by award-winning economists and analysts are exclusivelyavailable for download from w w w . r h b i n v e s t . c o m
8/9/2019 JCY International Berhad - Riding The Technology Wave - 25/6/2010
http://slidepdf.com/reader/full/jcy-international-berhad-riding-the-technology-wave-2562010 2/7
25 June 2010
Page 2 of 7
Business Background
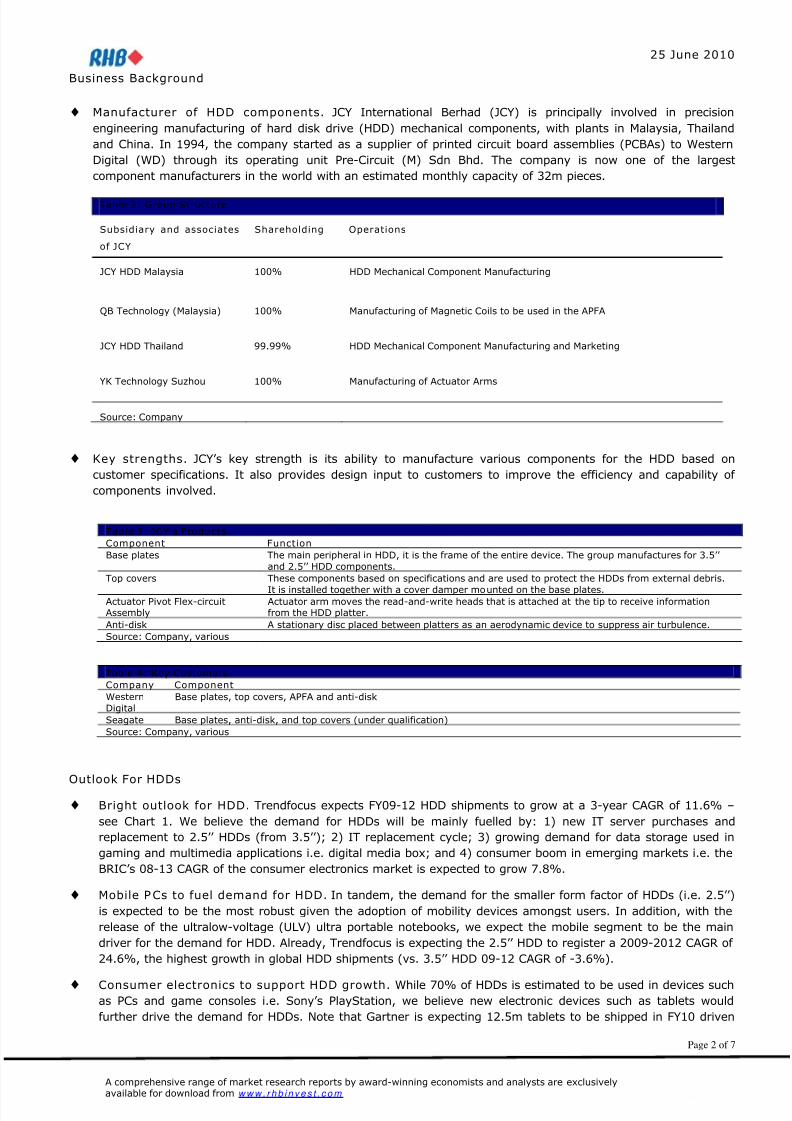
♦ Manufacturer of HDD components. JCY International Berhad (JCY) is principally involved in precision
engineering manufacturing of hard disk drive (HDD) mechanical components, with plants in Malaysia, Thailand
and China. In 1994, the company started as a supplier of printed circuit board assemblies (PCBAs) to Western
Digital (WD) through its operating unit Pre-Circuit (M) Sdn Bhd. The company is now one of the largest
component manufacturers in the world with an estimated monthly capacity of 32m pieces.
Table 2: Group Structure
Subsidiary and associates
of JCY
Shareholding Operations
JCY HDD Malaysia 100% HDD Mechanical Component Manufacturing
QB Technology (Malaysia) 100% Manufacturing of Magnetic Coils to be used in the APFA
JCY HDD Thailand 99.99% HDD Mechanical Component Manufacturing and Marketing
YK Technology Suzhou 100% Manufacturing of Actuator Arms
Source: Company
♦ Key strengths. JCY’s key strength is its ability to manufacture various components for the HDD based on
customer specifications. It also provides design input to customers to improve the efficiency and capability of
components involved.
Table 4: Key Customers
Company Component
Western
Digital
Base plates, top covers, APFA and anti-disk
Seagate Base plates, anti-disk, and top covers (under qualification)
Source: Company, various
Outlook For HDDs
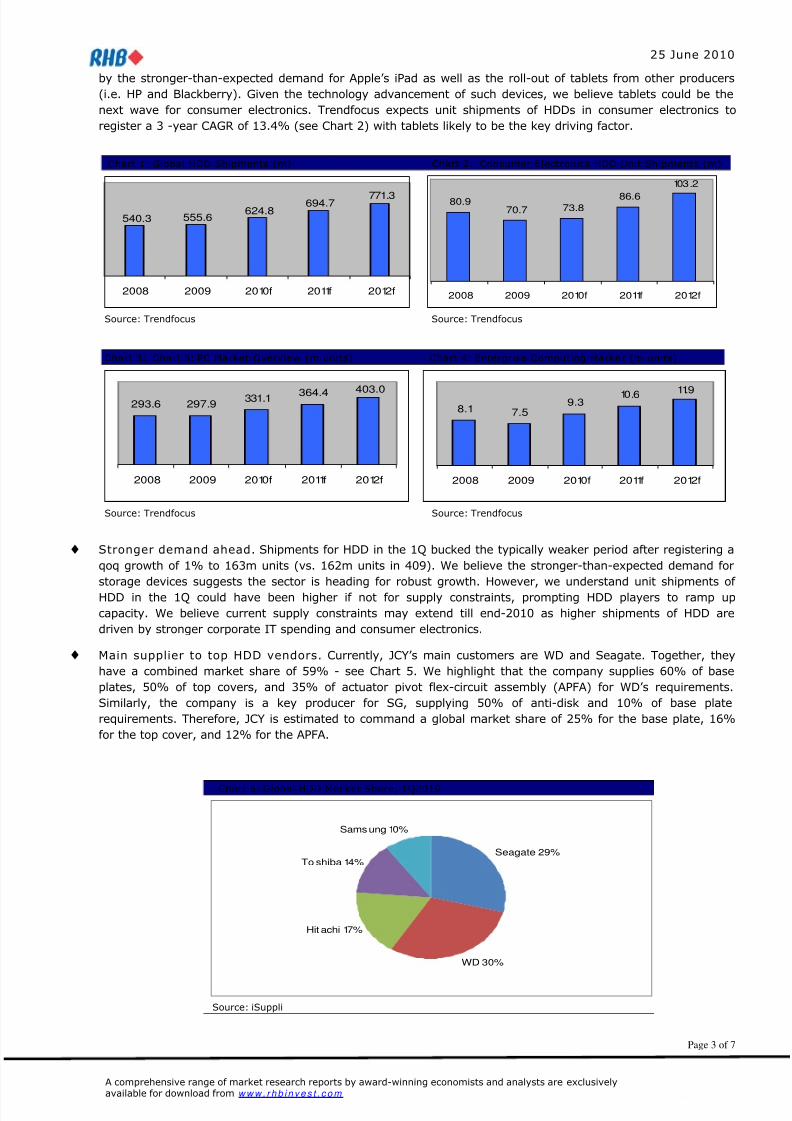
♦ Bright outlook for HDD. Trendfocus expects FY09-12 HDD shipments to grow at a 3-year CAGR of 11.6% –
see Chart 1. We believe the demand for HDDs will be mainly fuelled by: 1) new IT server purchases and
replacement to 2.5’’ HDDs (from 3.5’’); 2) IT replacement cycle; 3) growing demand for data storage used in
gaming and multimedia applications i.e. digital media box; and 4) consumer boom in emerging markets i.e. the
BRIC’s 08-13 CAGR of the consumer electronics market is expected to grow 7.8%.
♦ Mobile PCs to fuel demand for HDD. In tandem, the demand for the smaller form factor of HDDs (i.e. 2.5’’)
is expected to be the most robust given the adoption of mobility devices amongst users. In addition, with the
release of the ultralow-voltage (ULV) ultra portable notebooks, we expect the mobile segment to be the main
driver for the demand for HDD. Already, Trendfocus is expecting the 2.5’’ HDD to register a 2009-2012 CAGR of
24.6%, the highest growth in global HDD shipments (vs. 3.5’’ HDD 09-12 CAGR of -3.6%).
♦ Consumer electronics to support HDD growth. While 70% of HDDs is estimated to be used in devices suchas PCs and game consoles i.e. Sony’s PlayStation, we believe new electronic devices such as tablets would
further drive the demand for HDDs. Note that Gartner is expecting 12.5m tablets to be shipped in FY10 driven
Table 3: JCY’s Products
Component Function
Base plates The main peripheral in HDD, it is the frame of the entire device. The group manufactures for 3.5’’
and 2.5’’ HDD components.
Top covers These components based on specifications and are used to protect the HDDs from external debris.
It is installed together with a cover damper mounted on the base plates.Actuator Pivot Flex-circuitAssembly
Actuator arm moves the read-and-write heads that is attached at the tip to receive informationfrom the HDD platter.
Anti-disk A stationary disc placed between platters as an aerodynamic device to suppress air turbulence.
Source: Company, various
A comprehensive range of market research reports by award-winning economists and analysts are exclusivelyavailable for download from w w w . r h b i n v e s t . c o m
8/9/2019 JCY International Berhad - Riding The Technology Wave - 25/6/2010
http://slidepdf.com/reader/full/jcy-international-berhad-riding-the-technology-wave-2562010 3/7
25 June 2010
Page 3 of 7
by the stronger-than-expected demand for Apple’s iPad as well as the roll-out of tablets from other producers
(i.e. HP and Blackberry). Given the technology advancement of such devices, we believe tablets could be the
next wave for consumer electronics. Trendfocus expects unit shipments of HDDs in consumer electronics to
register a 3 -year CAGR of 13.4% (see Chart 2) with tablets likely to be the key driving factor.
Chart 1: Global HDD Shipments (m) Chart 2: Consumer Electronics HDD Unit Shipments (m)
540.3 555.6624.8
694.7 771.3
2008 2009 2010f 2011f 2012f
80.970.7 73.8
86.6
103.2
2008 2009 2010f 2011f 2012f
Source: Trendfocus Source: Trendfocus
Chart 3: Chart 5: PC Market Overview (m units) Chart 4: Enterprise Computing Marke t (m units)
293.6 297.9331.1 364.4 403.0
2008 2009 2010f 2011f 2012f
8.1 7.59.3
10.6 11.9
2008 2009 2010f 2011f 2012f
Source: Trendfocus Source: Trendfocus
♦ Stronger demand ahead. Shipments for HDD in the 1Q bucked the typically weaker period after registering a
qoq growth of 1% to 163m units (vs. 162m units in 409). We believe the stronger-than-expected demand for
storage devices suggests the sector is heading for robust growth. However, we understand unit shipments of
HDD in the 1Q could have been higher if not for supply constraints, prompting HDD players to ramp up
capacity. We believe current supply constraints may extend till end-2010 as higher shipments of HDD are
driven by stronger corporate IT spending and consumer electronics.
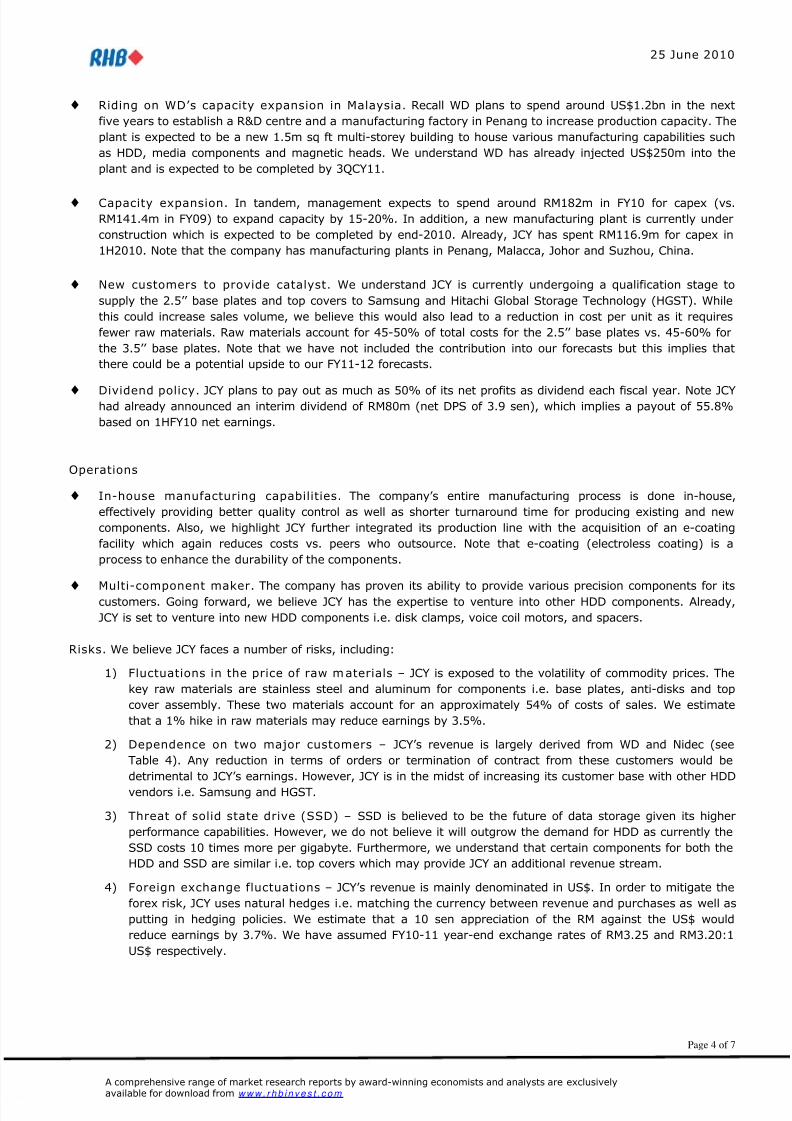
♦ Main supplier to top HDD vendors. Currently, JCY’s main customers are WD and Seagate. Together, they
have a combined market share of 59% - see Chart 5. We highlight that the company supplies 60% of base
plates, 50% of top covers, and 35% of actuator pivot flex-circuit assembly (APFA) for WD’s requirements.
Similarly, the company is a key producer for SG, supplying 50% of anti-disk and 10% of base plate
requirements. Therefore, JCY is estimated to command a global market share of 25% for the base plate, 16%
for the top cover, and 12% for the APFA.
Chart 5: Global HDD Mar ket Share, 1Q2010
Seagate 29%
Hitachi 17%
Samsung 10%
To shiba 14%
WD 30%
Source: iSuppli
A comprehensive range of market research reports by award-winning economists and analysts are exclusivelyavailable for download from w w w . r h b i n v e s t . c o m
8/9/2019 JCY International Berhad - Riding The Technology Wave - 25/6/2010
http://slidepdf.com/reader/full/jcy-international-berhad-riding-the-technology-wave-2562010 4/7
25 June 2010
Page 4 of 7
♦ Riding on WD’s capacity expansion in Malaysia. Recall WD plans to spend around US$1.2bn in the next
five years to establish a R&D centre and a manufacturing factory in Penang to increase production capacity. The
plant is expected to be a new 1.5m sq ft multi-storey building to house various manufacturing capabilities such
as HDD, media components and magnetic heads. We understand WD has already injected US$250m into the
plant and is expected to be completed by 3QCY11.
♦ Capacity expansion. In tandem, management expects to spend around RM182m in FY10 for capex (vs.
RM141.4m in FY09) to expand capacity by 15-20%. In addition, a new manufacturing plant is currently under
construction which is expected to be completed by end-2010. Already, JCY has spent RM116.9m for capex in
1H2010. Note that the company has manufacturing plants in Penang, Malacca, Johor and Suzhou, China.
♦ New customers to provide catalyst. We understand JCY is currently undergoing a qualification stage to
supply the 2.5’’ base plates and top covers to Samsung and Hitachi Global Storage Technology (HGST). While
this could increase sales volume, we believe this would also lead to a reduction in cost per unit as it requires
fewer raw materials. Raw materials account for 45-50% of total costs for the 2.5’’ base plates vs. 45-60% for
the 3.5’’ base plates. Note that we have not included the contribution into our forecasts but this implies that
there could be a potential upside to our FY11-12 forecasts.
♦ Dividend policy. JCY plans to pay out as much as 50% of its net profits as dividend each fiscal year. Note JCYhad already announced an interim dividend of RM80m (net DPS of 3.9 sen), which implies a payout of 55.8%
based on 1HFY10 net earnings.
Operations
♦ In-house manufacturing capabilities. The company’s entire manufacturing process is done in-house,
effectively providing better quality control as well as shorter turnaround time for producing existing and new
components. Also, we highlight JCY further integrated its production line with the acquisition of an e-coating
facility which again reduces costs vs. peers who outsource. Note that e-coating (electroless coating) is a
process to enhance the durability of the components.
♦ Multi-component maker. The company has proven its ability to provide various precision components for itscustomers. Going forward, we believe JCY has the expertise to venture into other HDD components. Already,
JCY is set to venture into new HDD components i.e. disk clamps, voice coil motors, and spacers.
Risks. We believe JCY faces a number of risks, including:
1) Fluctuations in the price of raw materials – JCY is exposed to the volatility of commodity prices. The
key raw materials are stainless steel and aluminum for components i.e. base plates, anti-disks and top
cover assembly. These two materials account for an approximately 54% of costs of sales. We estimate
that a 1% hike in raw materials may reduce earnings by 3.5%.
2) Dependence on two major customers – JCY’s revenue is largely derived from WD and Nidec (see
Table 4). Any reduction in terms of orders or termination of contract from these customers would be
detrimental to JCY’s earnings. However, JCY is in the midst of increasing its customer base with other HDD
vendors i.e. Samsung and HGST.
3) Threat of solid state drive (SSD) – SSD is believed to be the future of data storage given its higher
performance capabilities. However, we do not believe it will outgrow the demand for HDD as currently the
SSD costs 10 times more per gigabyte. Furthermore, we understand that certain components for both the
HDD and SSD are similar i.e. top covers which may provide JCY an additional revenue stream.
4) Foreign exchange fluctuations – JCY’s revenue is mainly denominated in US$. In order to mitigate the
forex risk, JCY uses natural hedges i.e. matching the currency between revenue and purchases as well as
putting in hedging policies. We estimate that a 10 sen appreciation of the RM against the US$ would
reduce earnings by 3.7%. We have assumed FY10-11 year-end exchange rates of RM3.25 and RM3.20:1
US$ respectively.
A comprehensive range of market research reports by award-winning economists and analysts are exclusivelyavailable for download from w w w . r h b i n v e s t . c o m
8/9/2019 JCY International Berhad - Riding The Technology Wave - 25/6/2010
http://slidepdf.com/reader/full/jcy-international-berhad-riding-the-technology-wave-2562010 5/7
25 June 2010
Page 5 of 7
Table 5. Major Customers For FY09% of Total Revenue
FY09
Western Digital 64.9
Nidec 21.5
Source: Company
♦ Eyeing further acquisitions? Given the capacity ramp-up of key HDD vendors, we reckon this gives rise to
the possibility of M&A for JCY as it seeks to quickly expand its capacity. JCY may seek to acquire businesses
with technical abilities in order to improve its expertise as well as to diversify its earnings base. Note that the
company acquired e-coating and APFA facilities in 1998 and 2000 respectively.
FORECASTS AND VALUATI ONS
♦ Forecasts. Our FY10-12 forecasts for net profit growth of 45.5%, 22.2%, and 18.7% respectively are mainly
driven by: 1) strong demand for the 2.5’’ HDD fuelled by stronger-than-expected demand for mobile PCs and
consumer electronics; 2) resilient demand for the 3.5’’ HDD stemming from resilient demand for desktops and
gaming consoles; and 3) improving corporate and consumer IT spending in the adoption of Windows 7. We
expect margins to remain stable on the back of: 1) stronger contribution from higher-margin components
(APFA); 2) higher utilisation rate; 3) greater economies of scale (after the expansion in China); and 4) stable
HDD average selling price (ASP). We expect gross margins to rise from 13.9% in FY09 to 16.0-16.5% in FY10-
12 respectively. Furthermore, there could be potential upside to our FY11-12 earnings forecasts driven mainly
by: 1) contribution from potential new customers i.e. Samsung and HGST; 2) stronger-than-expected sales
from its capacity expansion exercise in China; and 3) higher volume loading stemming from the expansion of
WD in Malaysia.
♦ Fair value of RM2.16. We have estimate FY09-12 EPS CAGR of 28.4% on good earnings visibility given the
strong demand outlook for HDD. We have derived a target PER of 12x for JCY after imputing a slight discount
to the peers’ weighted average FY11 PER of 13.6x due to its mid-range market capitalisation. Nevertheless our
target PER for JCY is still higher compared to the 10x that we have assumed for Notion Vtec, which is a strong,
but much smaller player. Therefore, we estimate a fair value of RM2.16 which is based on 12x FY11 EPS. We
thus initiate coverage on JCY with an Outperform recommendation.
Table 6: Peers Comparison
Company Bloomberg tickerMarket Cap
(US$)FY11 PER
(x )
Adampak Ltd AMPK SP 53.6 5.2
Broadway Industrial BWAY SP 170.1 4.9
CalComp Electronics CCET TB 432.8 7.8
Cheung Who Tech CWM SP 77.7 6.4
ENG Teknologi ENG MK 94.3 4.1
Hoya Corp 7741 JP 9,758.4 14.3
Minebea Co 6479 JP 2,336.1 15.3
Notion VTEC NVB MK 146.6 7.0
Showa Denko 4004 JP 2,975.3 12.3
Market cap-weighted average 13.6
Source: RHBRI, Bloomberg
A comprehensive range of market research reports by award-winning economists and analysts are exclusivelyavailable for download from w w w . r h b i n v e s t . c o m

8/9/2019 JCY International Berhad - Riding The Technology Wave - 25/6/2010
http://slidepdf.com/reader/full/jcy-international-berhad-riding-the-technology-wave-2562010 6/7
25 June 2010
Page 6 of 7
Table 7. Earnings Forecasts Table 8. Forecast Assumptions
FYE Sep (RMm) FY09 FY10F FY11F FY12F FYE Sep FY10F FY11F FY12FBP, AD, CM & Tooling 677.2 846.5 1,015.8 1,117.4 R ev e n u e g r o w t h ( % ) 2 4 . 9 2 0 . 2 1 5 . 4
Top Cover Assembly 210.6 252.7 290.6 319.7 BP, AD, CM & Tooling 25.0 20.0 10.0APFA 870.2 1,087.8 1,359.7 1,631.6 Top Cover Assembly 20.0 15.0 10.0
Turnover 1,758.0 2,187.0 2,666.1 3,068.7 APFA 25.0 25.0 20.0
EBITDA 295.7 402.4 485.5 560.3 RM:US$ exchange rate 3.25 3.20 3.20EBITDA margin (%) 16.8 18.4 18.2 18.3
Depreciation and
amortisation(82.4) (89.6) (102.4) (104.8)
EBIT 213.3 312.8 383.1 455.4
EBIT margin (%) 12.1 14.3 14.4 14.8
Pretax profit 205.9 299.1 370.0 439.1Taxation 1.4 (1.2) (1.5) (1.8)
Net profit 207.3 297.9 368.5 437.4
Core net profit 207.3 301.5 368.5 437.4
Source: Company data, RHBRI estimates
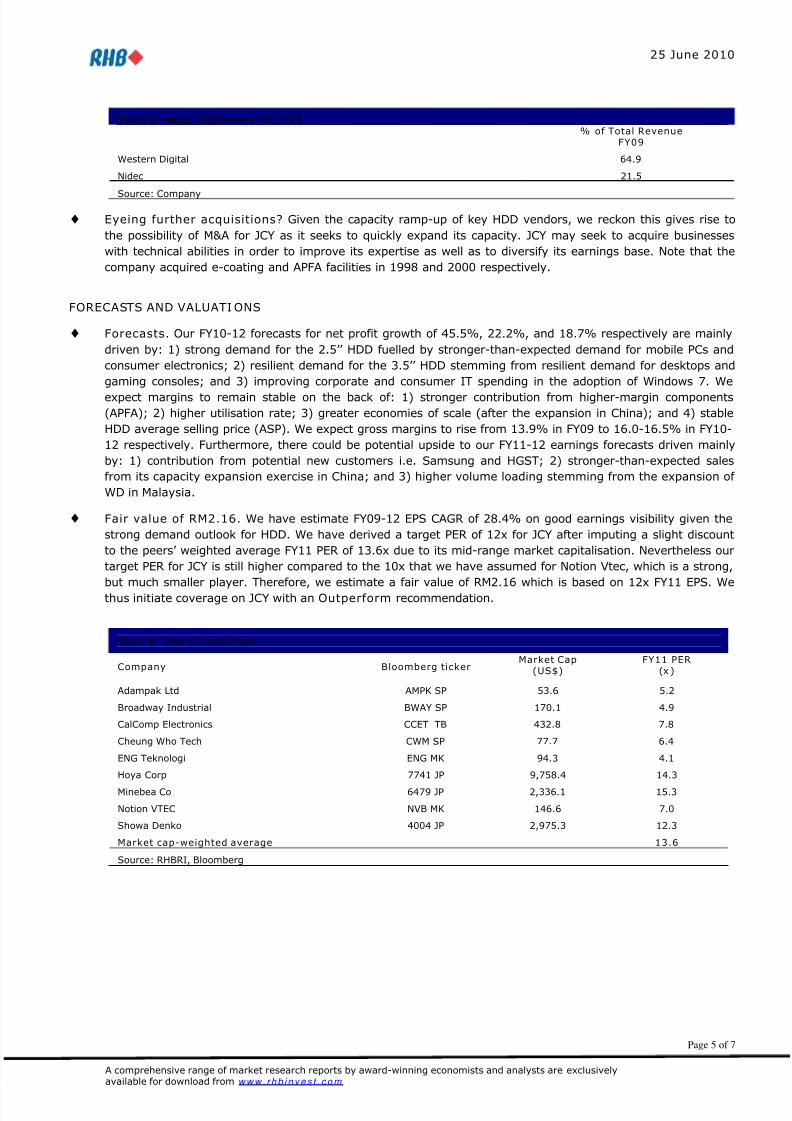
Appendix
Figure 1 : Main component s o f HDD
Source: Company
A comprehensive range of market research reports by award-winning economists and analysts are exclusivelyavailable for download from w w w . r h b i n v e s t . c o m
8/9/2019 JCY International Berhad - Riding The Technology Wave - 25/6/2010
http://slidepdf.com/reader/full/jcy-international-berhad-riding-the-technology-wave-2562010 7/7
25 June 2010
Page 7 of 7
IMP ORTANT DISCLOSURES
This report has been prepared by RHB Research Institute Sdn Bhd (RHBRI) and is for private circulation only to clients of RHBRI and RHB Investment BankBerhad (previously known as RHB Sakura Merchant Bankers Berhad). It is for distribution only under such circumstances as may be permitted by applicablelaw. The opinions and information contained herein are based on generally available data believed to be reliable and are subject to change without notice, andmay differ or be contrary to opinions expressed by other business units within the RHB Group as a result of using different assumptions and criteria. Thisreport is not to be construed as an offer, invitation or solicitation to buy or sell the securities covered herein. RHBRI does not warrant the accuracy of anythingstated herein in any manner whatsoever and no reliance upon such statement by anyone shall give rise to any claim whatsoever against RHBRI. RHBRI and/orits associated persons may from time to time have an interest in the securities mentioned by this report.
This report does not provide individually tailored investment advice. It has been prepared without regard to the individual financial circumstances andobjectives of persons who receive it. The securities discussed in this report may not be suitable for all investors. RHBRI recommends that investorsindependently evaluate particular investments and strategies, and encourages investors to seek the advice of a financial adviser. The appropriateness of aparticular investment or strategy will depend on an investor’s individual circumstances and objectives. Neither RHBRI, RHB Group nor any of its affiliates,employees or agents accepts any liability for any loss or damage arising out of the use of all or any part of this report.
RHBRI and the Connected Persons (the “RHB Group”) are engaged in securities trading, securities brokerage, banking and financing activities as well asproviding investment banking and financial advisory services. In the ordinary course of its trading, brokerage, banking and financing activities, any member of the RHB Group may at any time hold positions, and may trade or otherwise effect transactions, for its own account or the accounts of customers, in debt orequity securities or loans of any company that may be involved in this transaction.
“Connected Persons” means any holding company of RHBRI, the subsidiaries and subsidiary undertaking of such a holding company and the respectivedirectors, officers, employees and agents of each of them. Investors should assume that the “Connected Persons” are seeking or will seek investment bankingor other services from the companies in which the securities have been discussed/covered by RHBRI in this report or in RHBRI’s previous reports.
This report has been prepared by the research personnel of RHBRI. Facts and views presented in this report have not been reviewed by, and may not reflect
information known to, professionals in other business areas of the “Connected Persons,” including investment banking personnel.
The research analysts, economists or research associates principally responsible for the preparation of this research report have received compensation basedupon various factors, including quality of research, investor client feedback, stock picking, competitive factors and firm revenues.
The recommendation framework for stocks and sectors are as follows : -
Stock Ratings
Outperform = The stock return is expected to exceed the FBM KLCI benchmark by greater than five percentage points over the next 6-12 months.
Trading Buy = Short-term positive development on the stock that could lead to a re-rating in the share price and translate into an absolute return of 15% ormore over a period of three months, but fundamentals are not strong enough to warrant an Outperform call. It is generally for investors who are willing totake on higher risks.
Market Perform = The stock return is expected to be in line with the FBM KLCI benchmark (+/- five percentage points) over the next 6-12 months.
Underperform = The stock return is expected to underperform the FBM KLCI benchmark by more than five percentage points over the next 6-12 months.
Industry/Sector Ratings
Overweight = Industry expected to outperform the FBM KLCI benchmark, weighted by market capitalisation, over the next 6-12 months.
Neutral = Industry expected to perform in line with the FBM KLCI benchmark, weighted by market capitalisation, over the next 6-12 months.
Underweight = Industry expected to underperform the FBM KLCI benchmark, weighted by market capitalisation, over the next 6-12 months.
RHBRI is a participant of the CMDF-Bursa Research Scheme and will receive compensation for the participation. Additional information on recommendedsecurities, subject to the duties of confidentiality, will be made available upon request.
This report may not be reproduced or redistributed, in whole or in part, without the written permission of RHBRI and RHBRI accepts no liability whatsoever forthe actions of third parties in this respect.
A comprehensive range of market research reports by award-winning economists and analysts are exclusivelyavailable for download from w w w r h b i n v e s t c o m