jc - personal care industry - amazon web services€¦ · · 2017-09-09consumer and through third...
TRANSCRIPT

Consumer SectorPersonal Care IndustrySenior Analyst: Joyce ChanJunior Analysts: Brandon Neimark, Carlota De Villa, Olivia Roman and Adam Martinez
1
2
Agenda§ Industry Definition§ Industry Information§ Revenue Generation§ Industry Revenue § Porter’s Five Forces§ Trend 1: Consumer Willingness to Pay§ Trend 2: Demand for Men’s Grooming§ Trend 3: R&D Tax Credit§ Risks and Sensitivities§ Comparable Companies§ Conclusion

3
Industry Definition
§ The personal care industry prepares, blends, compounds and packages beauty products and cosmetics. Most firms in the industry conduct their own research and development for new products and manufacture them as well. Firms in this industry develop and sell personal care products through retailers, directly to the consumer and through third party distributors. Personal care products include: skin care, make up, hair care, oral care, and fragrances.
§ The largest player in this industry is an international company, L’Oréal, with 13.6% market share in North America.
L’OrealTicker: Or
Market Cap: 92.28 Bn
Revlon IncTicker: Rev
Market Cap: 1.87 Bn
Avon Products, Inc. Ticker: AVP
Market Cap: 2.98 Bn
Estee Lauder Companies Inc.Ticker: EL
Market Cap: 31.33 Bn
Coty, Inc.Ticker: COTY
Market Cap: 13.99 Bn

4
Industry Information
*Percentages based on total personal care industry revenue: $56.63bn
Sources: Statista; S&P Net Advantage; IBIS World
Industry breakdown by Market Cap
Consumer StaplesMarket Cap: $3.6 T
Household & Personal Care Products
Market Cap: $844.4bn
Personal Care
Market Cap: $458.9bn
36.10%
22.90%
17.30%
12.20%
1.10%
2015 Personal Care Product Segmentation
Skincare
Haircare
Make-up
Perfumes
Oral Cosmetics
§ Companies within the personal care industry do not focus on one product, but a mix.
5
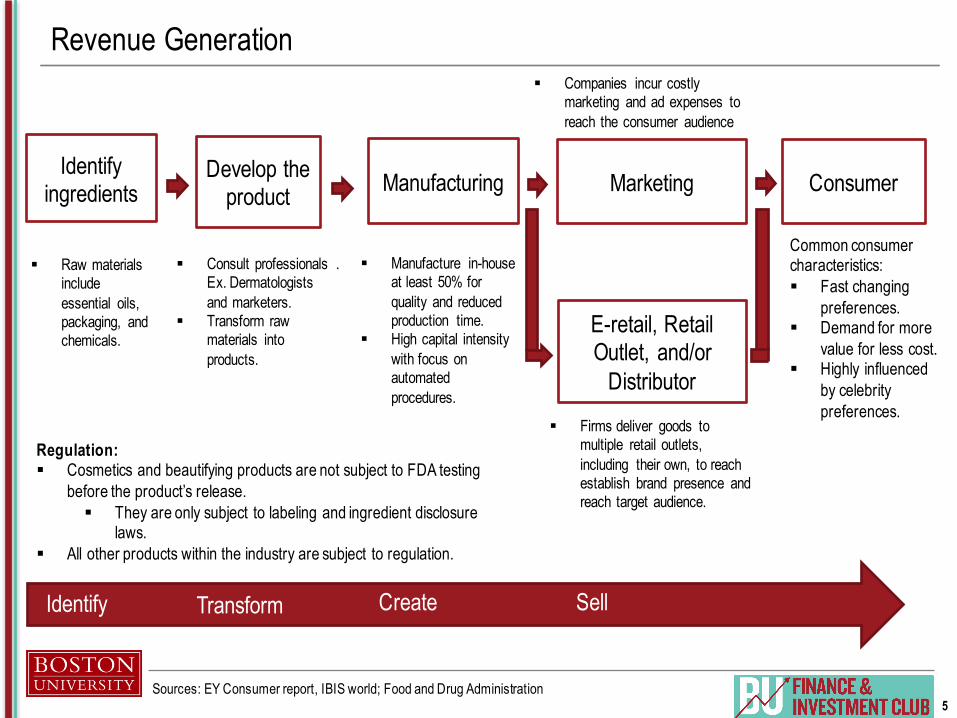
Revenue Generation
Identify ingredients
Develop the product Marketing Consumer
E-retail, Retail Outlet, and/or
Distributor
§ Consult professionals . Ex. Dermatologists and marketers.
§ Transform raw materials into products.
§ Manufacture in-house at least 50% for quality and reduced production time.
§ High capital intensity with focus on automated procedures.
§ Firms deliver goods to multiple retail outlets, including their own, to reach establish brand presence and reach target audience.
Sources: EY Consumer report, IBIS world; Food and Drug Administration
Identify Transform Create Sell
Manufacturing
§ Raw materials include essential oils, packaging, and chemicals.
§ Companies incur costly marketing and ad expenses to reach the consumer audience
Common consumer characteristics:§ Fast changing
preferences.§ Demand for more
value for less cost.§ Highly influenced
by celebrity preferences.
Regulation: § Cosmetics and beautifying products are not subject to FDA testing
before the product’s release.§ They are only subject to labeling and ingredient disclosure
laws. § All other products within the industry are subject to regulation.

6
Industry Revenue
§ Revenue grew at a CAGR of 4.36% between 2007 and 2015.
§ Revenue projected to grow at a CAGR of 5.17% between 2016 and 2021.
§ The Great Recession in 2008 did not have adverse effects on the Personal Care industry. – Largely due to a firm’s diverse brand
lines that include luxury and low-end goods.
– Consumers continue purchasing cosmetics despite reducing budgets.
§ Despite changes in the CCI, the industry revenue has increased steadily.
The revenue earned within this industry has low level of volatility due to diverse
brand lines.
Sources: IBIS World; OECD Data
0
5,000
10,000
15,000
20,000
25,000
30,000
2007 2008 2009 2010 2011 2012 2013 2014 2015 2016 2017 2018 2019 2020 2021
$ in
Milli
ons
Industry Revenue ‘07 – ‘21
CAGR 4.36%
CAGR 5.17%
95
96
97
98
99
100
101
102
0
5,000
10,000
15,000
20,000
25,000
2007 2008 2009 2010 2011 2012 2013 2014 2015 2016
CCI
Indu
stry R
even
ue in
$ M
illion
s
Industry Revenue vs. Consumer Confidence Index ‘07-‘16
Revenue CCI

7
Porter’s Five Forces Analysis
Sources: UK Essay; IBIS World
High
Medium
High
HighLowIndustry Rivalry Customers
New Entrants
Substitutes
Suppliers
§ Competition build brand reputation to stand out from other similar products.
Barriers to Entry§ Established manufacturers
have considerable economies of scale and initial costly investments pose a barrier to entrants.
Barriers to Exit§ No considerable barriers.
§ Suppliers include:§ Inorganic chemicals§ Organic chemicals§ Soap & Cleaning
Compounds
§ Highly swayed by fashion trends, affected by consumer confidence and income.
§ Consumers can easily change from product to product if dissatisfied
§ Many competitors in the cosmetic industry exist to capture one consumer
Firms in the industry are challenged by retaining and attracting consumers who
have fast changing tastes.

8
Trend 1 – Increased Willingness to Pay for Sustainable Goods
R&D Tax Credit
Demand for Men’s
Grooming Products
Consumer Willingness
to Pay

9
Leveraging marketing campaigns to promote sustainability has contributed to a CAGR of 9.8% in the organic personal care industry.
Increased Willingness to Pay for Sustainable Goods§ Consumers are willing to pay 40.29% more for responsible products in 2009.
The willingness to pay has continued to rise.
§ 84% seek responsible products whenever possible.§ 57% of the global population who are willing to pay more for sustainable
products are willing to pay for fresh, natural and organic ingredients.§ Organic personal care market expected to reach $15.98b in 2020.§ Average gross margin: 32.65%
Sources: Nielsen; In-cosmetics Latin America; MITSloan “Does It Pay to be Good?”; Cone Communications Insight Report; Marketing Charts; McKinsey & Co.
62%
59%
57%
45%
43%
41%
41%
31%
0% 10% 20% 30% 40% 50% 60% 70%
Brand I trust
Known for health/wellness beneifts
Fresh, natural, organic ingredients
Environmentally friendly
Known for its social value
Environmentally friendly package
Community commitment
TV ad about social/environmental good
Top Sustainability Purchasing Drivers ‘15
36%
Average % Marketing Expenses of Sales ’10-’15
Marketing Expenses
50%55%
66%
0%
10%
20%
30%
40%
50%
60%
70%
2013 2014 2015
Willingness to Pay a Premium for Sustainable Products

10
Trend 2 – Demand for Men’s Grooming Products
Cosmeceutical Product Growth
Demand for Men’s
Grooming Products
R&D Tax Credit

11
258.94 263.88 267.88 267.91 272.14 273.15 274.62 274.72 275.32
17.318.3 19.3 20.3 21.4 22.6 23.9 25.2 26.6
200
220
240
260
280
300
320
2012 2013 2014 2015 2016 2017 2018 2019 2020
$ in
Billi
ons
Global Share of Men's Grooming in Industry Revenue
Global Industry Men's Grooming
Demand for Men’s Grooming Products
§ Men’s product outlook is positive especially products such as: serum, tinted moisturizers with UV protection, deodorants, and hair molding products
§ Per capita spending is a significant contributor to industry revenue because it is highly correlated.
§ Men’s grooming makes up an average 8.01% of the global personal care industry.
§ Global men’s grooming segment grew at a historical CAGR of 5.52% between 2012 -2016.
§ It will grow at a future CAGR of 5.58% from 2017-2020.
Sources: Bloomberg; R&D Taxsavers; IBIS World; Statista
Men’s grooming products are growing at a historical CAGR of 5.52% indicating a
strong revenue stream for the next 5 years.
52
53
54
55
56
57
58
59
60
61
29 30 31 32 33 34
Indu
stry R
even
ue in
($B)
Spending per Capita on Men's Grooming
U.S. Industry Revenue vs. Men's Grooming ‘11- ‘15
R^2 = 0.8593Y = 1.6593x + 3.6504
6.68% 6.94% 7.20% 7.58% 7.86% 8.27% 8.70% 9.17% 9.66%

12
Trend 3 – R&D Tax Credit
R&D Tax Credit
Demand for Men’s
Grooming Products
Consumer Willingness
to Pay

13
R&D Tax Credit
0
1000
2000
3000
4000
5000
6000
2012 2013 2014 2015 2016 2017 2018 2019 2020
Reve
nue
($ M
illion
)
North American Organic Personal Care Revenue Product
Skin Care Hair Care Oral Care Cosmedic OthersCosmetics
Sources: GMR Insights Report; EY consumer report; R&D Tax savers; Moss Adams LLP; Physicians Committee for Responsible Medicine; Global Market Research
§ President Obama signed a permanent extension to the PATH Act of 2015 allowing businesses to credit $250 000 per year in taxes.
§ Tax credit can be applied if four criteria are met:§ Technical uncertainty, process of experimentation,
technological in nature and qualified process.§ Despite an increase in nonfinancial services profits by a
CAGR of 5.06%, R&D expenditure grows at a CAGR of 1.4%.
§ Areas of research:§ Cosmeceuticals: products that have both functional
and beautifying aspects.§ Nanotechnology embedded cosmetics.§ Organic plant-based cosmetics.
§ A possible alternative to paraben, a commonly found cosmetic product preservative that has links to cancer.
§ Organic personal care products are growing at a CAGR of 9.8%.
§ Corporate non-financial profit increased 18.12% from 2011-2015 and R&D expenditure increased 0.36%.
311.71 319.28 334.72 345.87 345.33
1115.6 1167.9 1235.21358.2 1317.8
0
200
400
600
800
1,000
1,200
1,400
1,600
2011 2012 2013 2014 2015
$ in Billions
R&D Expenditure vs. Nonfinancial Services Corporation Profits
R&D Expenditure Coporate Nonfinancial Profits
Tax credit will help alleviate a personal care company’s pressure to constantly innovate and can offer a
reasonable alternative to paraben.

14
Risks and Sensitivities
Four main risks are evident in the personal care industry:
§ 1) Fast-changing consumer purchasing behavior– Consumers are quick to change their preferences and demands to follow the new trend.– Firms struggle to keep up with their unique demands.
§ 2) Steadily increasing pressure to demonstrate greater value to consumers– 17% of consumer product companies identify bringing innovations as one of the most challenging barriers to executing
strategy.– Branding through advertising social media platforms is vital for consumer engagement and presence.
§ 3) Tailoring products to local markets is costly– Firms remain competitive by interacting with the consumers in order to gain brand loyalty.– Marketing and ad campaigns are significant costs to retain one customer.
§ 4) Limited volume growth– Companies are looking at developing markets to grow since developed markets are maturing.– However, each region is unique and has its own tailored demands making it more difficult and expensive for companies
to expand.
Sources: EY Consumer Insight Report

15
Key Financials
§ Comparable Companies
High 4.70 N/A 5925 78.24 16.75 14.35 7.58 8.50 48.15 294.62 8.53 13.58 309.7 47.84 3.92 197.80Median 2.50 4556 60.30 14.06 10.90 2.09 -3.76 17.79 9.69 1.97 5.11 27.06 15.43 3.63 100.69Low 1.40 1531 49.11 4.37 2.68 -18.65 -15.20 13.00 -10.81 -24.51 1.00 -2.18 12.30 1.85 93.12Mean 2.61 4070 61.03 12.95 10.24 -0.20 -3.55 26.81 60.44 -1.85 7.36 18.45* 21.87 3.24 121.96
Ticker
EquityValue(b)
(11.25)Closing Price EV
(%) Gross Profit Margin
(%) EBITDA Margin
(%) EBIT Margin
Net Income Margin
(%)Revenue CAGR '10-'15
(%) ROIC
(%) ROE
(%) ROA
(%) Leverage P/E
EV/ EBITDA
Inventory Turnover
Days in Inventory
AVP 2.50 5.68 5,203 60.30 4.37 2.68 -18.65 -14.06 14.25 294.62 -24.51 12.59 -2.18 19.34 3.92 93.12
REV 1.52 28.95 3,136 65.15 13.32 9.67 2.04 8.50 13.00 -6.33 1.97 13.58 27.06 12.30 3.63 100.69
NUS 2.94 53.93 4,556 78.24 14.06 10.90 5.92 6.54 40.87 15.05 8.53 1.00 21.83 14.42 1.85 197.80
EPC 4.70 80.93 5,925 49.11 16.26 14.35 7.58 -15.20 17.79 9.69 3.67 5.11 27.07 15.43 3.89 93.83
ELF 1.40 30.97 1,531 52.36 16.75 13.61 2.09 n/a 48.15 -10.81 1.12 4.53 309.7 47.84 2.94 124.34

16
Summary Industry Rating§ Personal care products industry rating:
The industry has a neutral outlook because the personal care industry is mature with possible growth opportunities.
§ 1) Industry Recap– R&D tax credits will help companies reduce the costs they incur when they are pressured to produce more innovative and
useful products.– Men’s grooming is expected to continue growing consistently.– Consumer willingness to pay for premium and ethically sourced products is key to reaping higher margins.
§ 2) Industry Outlook– Opportunities in the men’s grooming segment and producing innovative products offers strong revenue growth.
§ 3) Risk factors– Significant marketing costs caused by rapidly changing consumer preferences will force firms to spend more on marketing
and reducing product cycle time.
Neutral/Overweight

17
Q & A

18
§ Industry Definition§ Industry Information§ Revenue Generation§ Industry Revenue § Porter’s Five Forces§ Trend 1: Consumer Willingness to Pay§ Trend 2: Demand for Men’s Grooming§ Trend 3: R&D Tax Credit§ Risks and Sensitivities§ Comparable Companies§ Conclusion
Appendix
19
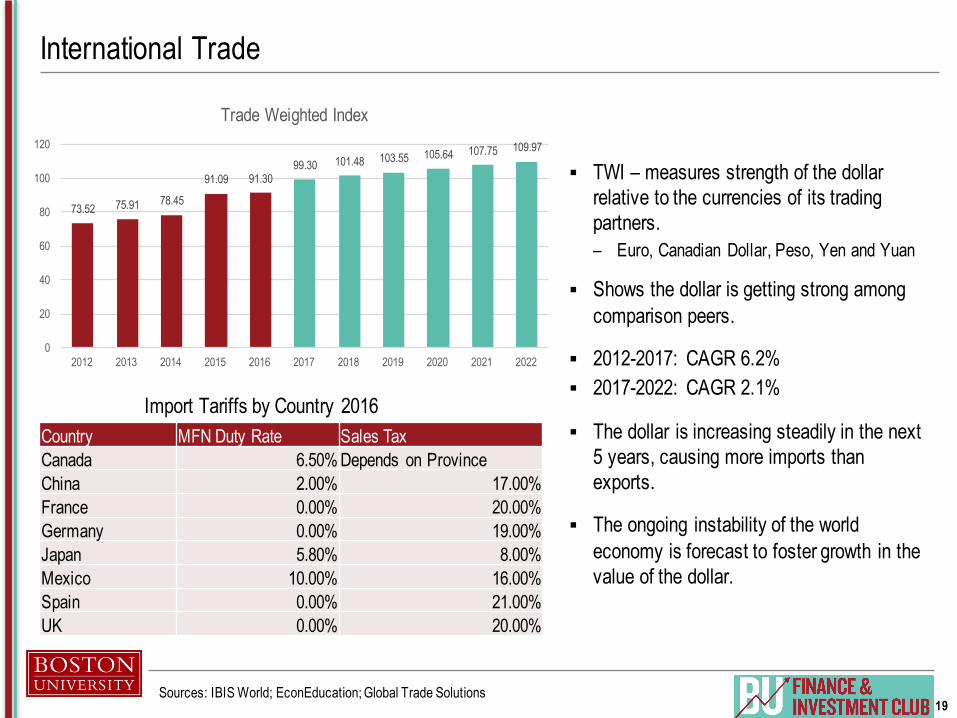
International Trade
§ TWI – measures strength of the dollar relative to the currencies of its trading partners.– Euro, Canadian Dollar, Peso, Yen and Yuan
§ Shows the dollar is getting strong among comparison peers.
§ 2012-2017: CAGR 6.2%§ 2017-2022: CAGR 2.1%
§ The dollar is increasing steadily in the next 5 years, causing more imports than exports.
§ The ongoing instability of the world economy is forecast to foster growth in the value of the dollar.
73.52 75.91 78.45
91.09 91.3099.30 101.48 103.55 105.64 107.75 109.97
0
20
40
60
80
100
120
2012 2013 2014 2015 2016 2017 2018 2019 2020 2021 2022
Trade Weighted Index
Sources: IBIS World; EconEducation; Global Trade Solutions
Country MFN Duty Rate Sales TaxCanada 6.50% Depends on ProvinceChina 2.00% 17.00%France 0.00% 20.00%Germany 0.00% 19.00%Japan 5.80% 8.00%Mexico 10.00% 16.00%Spain 0.00% 21.00%UK 0.00% 20.00%
Import Tariffs by Country 2016

20
World Price of Crude Oil
§ Petroleum and mineral oil are basic ingredients in many cosmetic products.– Ex. Foundation, cleanser, moisturizer etc.
§ More specifically propylene glycol is used in shampoo and isopropyl alcohol is disinfectant used in cleansers derived from oil.
§ Parabens – cosmetic preserver allowing a minimum 3 year shelf life contained in lotions, deodorants, and ointments.
§ Less expensive oil means more profits for the cosmetic industry because– Less transportation costs for deliveries.– Lower cost of basic ingredient.
Sources: IBIS World; EconEducation; Organic Make Up; Entrepreneur; IBIS World; Breast Cancer Fund
105.01 104.0796.25
50.7942.47
51.76 54.26 55.64 57.53 58.92 61.05
0
20
40
60
80
100
120
2012 2013 2014 2015 2016 2017 2018 2019 2020 2021 2022
$ pe
r Bar
rel
World Price of Crude Oil