jay jin woo lee
TRANSCRIPT

Jay Jin Woo Lee

Which organizations within the planning agency have the greatest changes between 2015 and 2018?

Which organizations within the planning agency have the greatest changes between 2015 and 2018?

• Transportation had the biggest difference between 2015 and 2018 expenditure…
But Why?


• From 2001 to 2011, ridership increased a little less than 5 million.

• Madison Transit Corridor Study investigating bus rapid transit in Madison Area proposed in May 2013

• Total Capital cost over $276.03Million

• Ridership has increased by 5 million during 2001-2011• Transportation organization within planning agency expenditure has risen by 171% over the
last 4 years• Currently spending $0.366 million • Projected capital cost of rapid bus systems is over $276.03Million
Questions
• Is the rapid bus system going to be effective investment?o How many people will use the rapid busses?
HTTP://DATA-CITYOFMADISON.OPENDATA.ARCGIS.COM/DATASETS/2BFD47ADA14542C5969A6EB7E6F274DD_31?GEOMETRY=-89.925%2C42.981%2C-88.621%2C43.157HTTPS://CTPP.TRANSPORTATION.ORG/CTPP-DATA-SET-INFORMATION/5-YEAR-DATA/
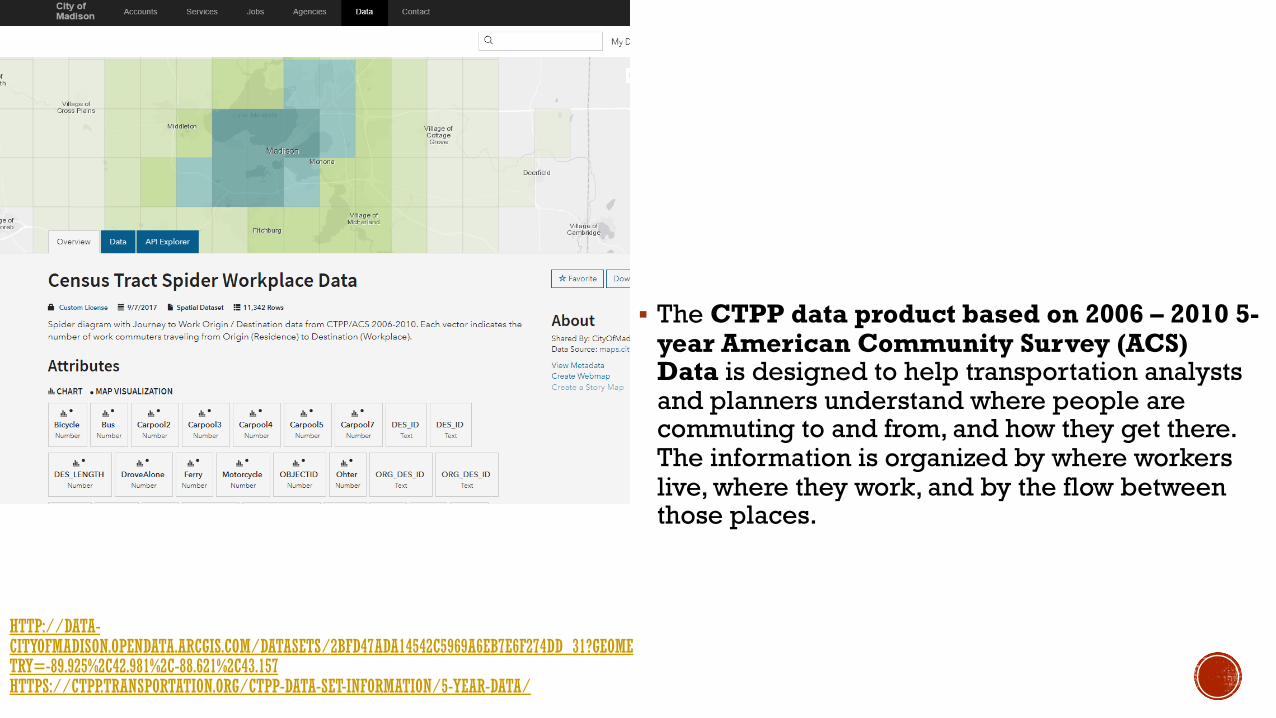
§ The CTPP data product based on 2006 – 2010 5-year American Community Survey (ACS) Data is designed to help transportation analysts and planners understand where people are commuting to and from, and how they get there. The information is organized by where workers live, where they work, and by the flow between those places.


• How do they get to work?
o Many different ways: Walk, Drive, Carpool, Bus and Bike
o 67.5% of the people drive to work
o 9.4% of the people take the bus to work
o 7.4% of the people walk to work
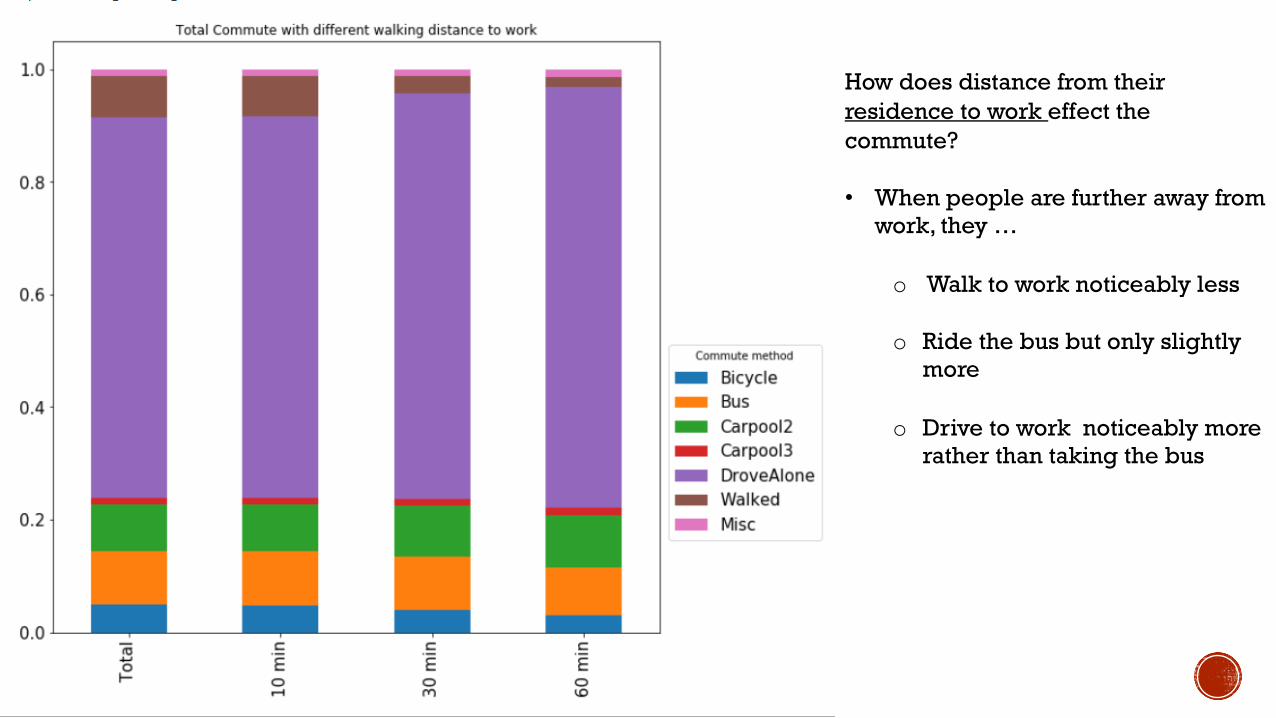
How does distance from their residence to work effect the commute?
• When people are further away from work, they …
o Walk to work noticeably less
o Ride the bus but only slightly more
o Drive to work noticeably more rather than taking the bus

How does the distance from the residence to bus stops effect the ridership?
o Bus Ridership percentage increased slightly
o Walking to work percentage decreased drastically
o Driving alone percentage increased drastically
o The data becomes inaccurate because in campus, many people live close to bus stops but walk to work since they live close to work anyway

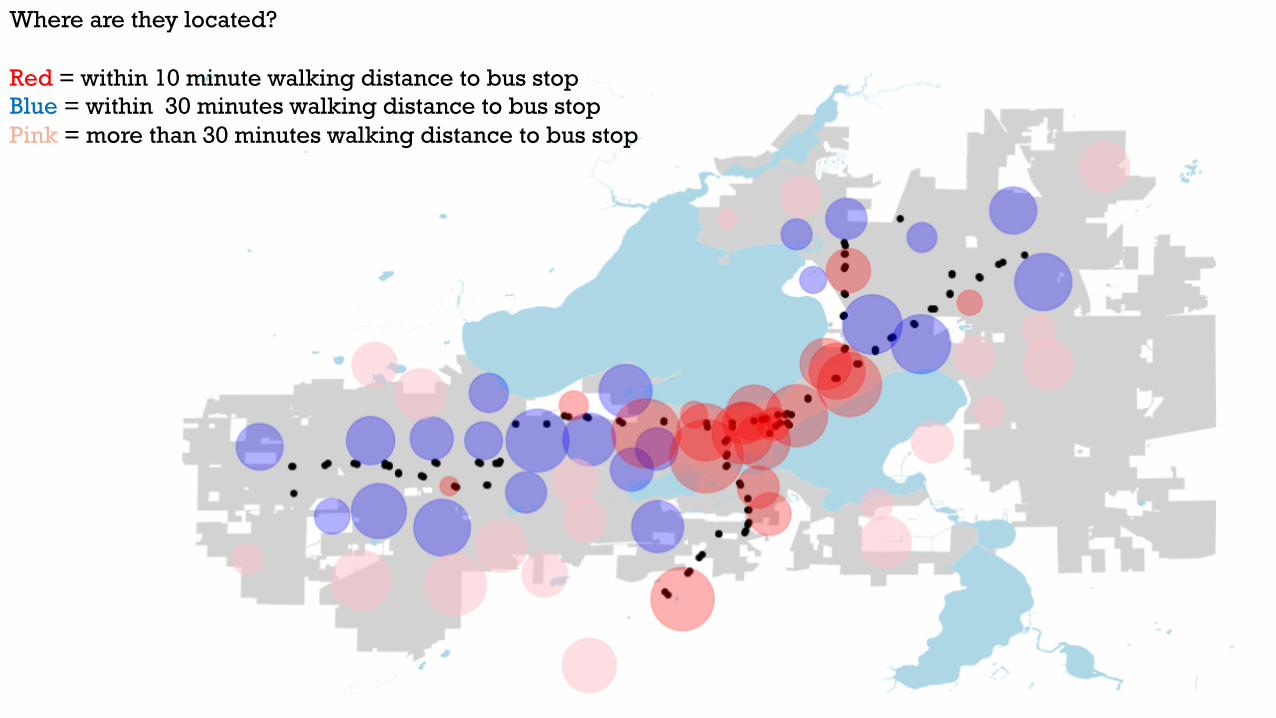
Where are they located?
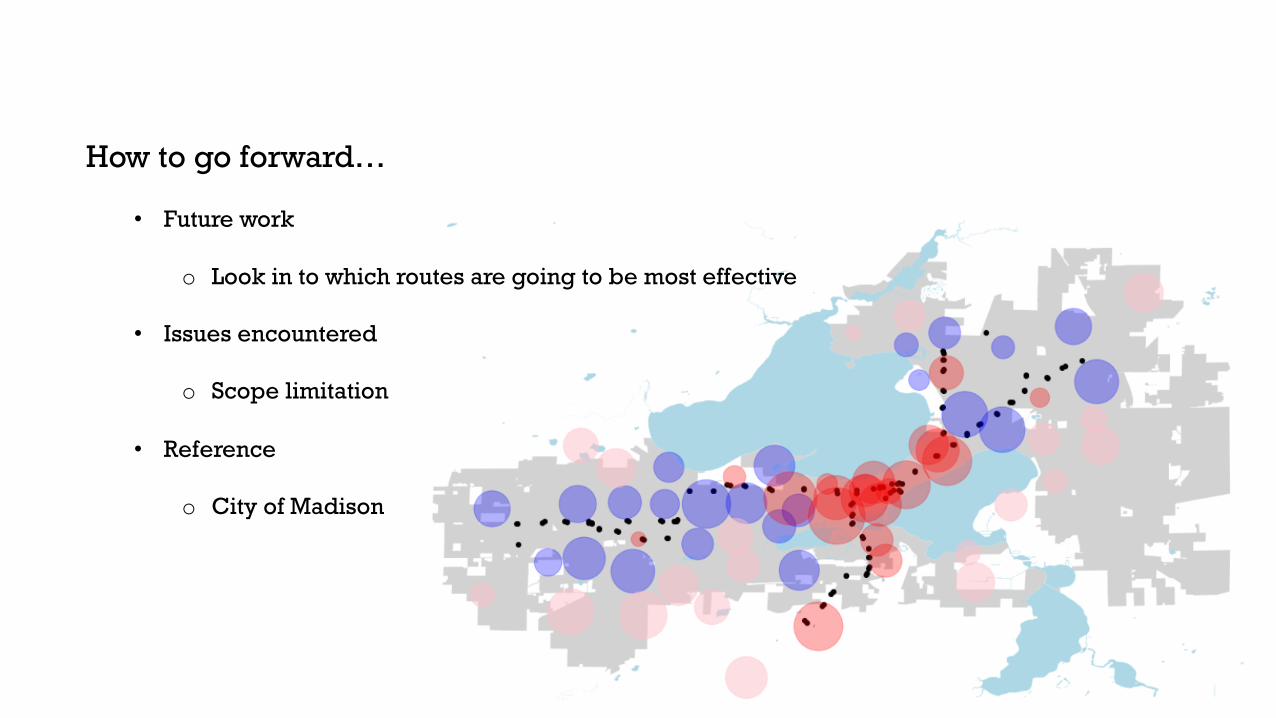
Red = within 10 minute walking distance to bus stopBlue = within 30 minutes walking distance to bus stopPink = more than 30 minutes walking distance to bus stop
• Most people who are living in a 10 minute walking distance to bus stops are located near the capital

How does the different zones differ in ridership?
• Red Zoneso Most of the people walk due to them
living on campus

How does the different zones differ in ridership?
• The blue zoneso Not many people walk to work
anymoreo More people are taking the bus to
work o Most people choose to drive rather
than taking the bus or walk

• How does the different zones differ in ridership?
The Pink zoneso People do not walk to worko Most people drive to work rather than
talk the bus
Where are they located?
Red = within 10 minute walking distance to bus stopBlue = within 30 minutes walking distance to bus stopPink = more than 30 minutes walking distance to bus stop

Which rapid bus stops are getting most ridership?
• Focus only on the four most corners of the commute areas near the bus stops
o North and Fitchburg has most ridership
o North has most number of the ridership compared to others
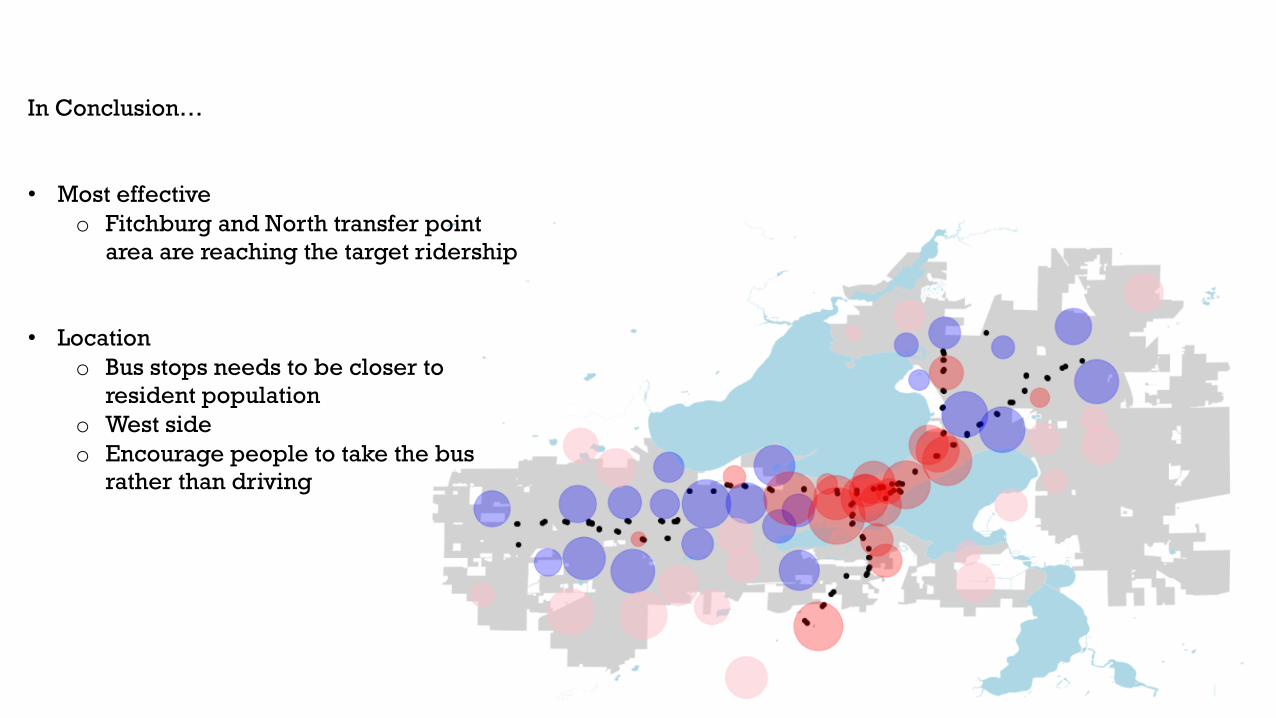
In Conclusion…
• Most effective o Fitchburg and North transfer point
area are reaching the target ridership
• Location o Bus stops needs to be closer to
resident populationo West sideo Encourage people to take the bus
rather than driving
How to go forward…
• Future work
o Look in to which routes are going to be most effective
• Issues encountered
o Scope limitation
• Reference
o City of Madison

Jay Jin Woo Lee