jardine cycle & carriage limited 2016 first quarter ... · astra honda motor’s domestic sales...
TRANSCRIPT
To: Business Editor 28th April 2016
For immediate release
Jardine Cycle & Carriage Limited
2016 First Quarter Financial Statements and Dividend Announcement
The following announcement was issued today by the Company’s 75%-owned subsidiary,
Jardine Cycle & Carriage Limited.
For further information, please contact: Jardine Matheson Limited Neil M McNamara (852) 2843 8227 Brunswick Group Limited Karin Wong (852) 3512 5077
- more -
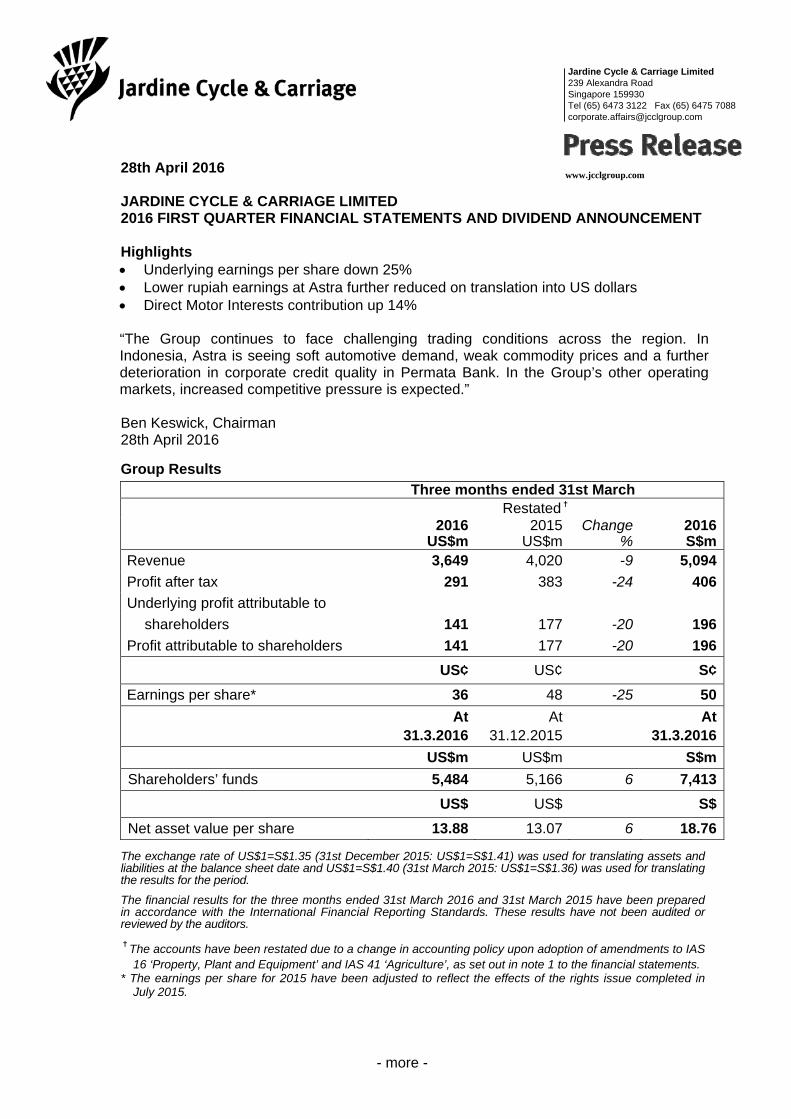
28th April 2016 JARDINE CYCLE & CARRIAGE LIMITED 2016 FIRST QUARTER FINANCIAL STATEMENTS AND DIVIDEND ANNOUNCEMENT Highlights Underlying earnings per share down 25% Lower rupiah earnings at Astra further reduced on translation into US dollars Direct Motor Interests contribution up 14% “The Group continues to face challenging trading conditions across the region. In Indonesia, Astra is seeing soft automotive demand, weak commodity prices and a further deterioration in corporate credit quality in Permata Bank. In the Group’s other operating markets, increased competitive pressure is expected.” Ben Keswick, Chairman 28th April 2016 Group Results
Three months ended 31st March Restated✝
2016US$m
2015 US$m
Change %
2016S$m
Revenue 3,649 4,020 -9 5,094
Profit after tax 291 383 -24 406
Underlying profit attributable to
shareholders 141 177 -20 196
Profit attributable to shareholders 141 177 -20 196
US¢ US¢ S¢
Earnings per share* 36 48 -25 50
At31.3.2016
At 31.12.2015
At31.3.2016
US$m US$m S$m
Shareholders’ funds 5,484 5,166 6 7,413
US$ US$ S$
Net asset value per share 13.88 13.07 6 18.76 The exchange rate of US$1=S$1.35 (31st December 2015: US$1=S$1.41) was used for translating assets and liabilities at the balance sheet date and US$1=S$1.40 (31st March 2015: US$1=S$1.36) was used for translating the results for the period. The financial results for the three months ended 31st March 2016 and 31st March 2015 have been prepared in accordance with the International Financial Reporting Standards. These results have not been audited or reviewed by the auditors. ✝The accounts have been restated due to a change in accounting policy upon adoption of amendments to IAS
16 ‘Property, Plant and Equipment’ and IAS 41 ‘Agriculture’, as set out in note 1 to the financial statements. * The earnings per share for 2015 have been adjusted to reflect the effects of the rights issue completed in
July 2015.
Jardine Cycle & Carriage Limited 239 Alexandra Road Singapore 159930 Tel (65) 6473 3122 Fax (65) 6475 7088 [email protected]
www.jcclgroup.com

- more -
Page 2 CHAIRMAN’S STATEMENT Overview The Group’s underlying profit in the first quarter declined primarily due to reduced earnings from Astra which faced challenging market conditions in Indonesia. Astra’s contribution was impacted further on translation of its rupiah profit into US dollars. There were, however, improved results from the Group’s Direct Motor Interests as Truong Hai Auto Corporation in Vietnam, in particular, recorded a strong performance. Performance The Group’s revenue in the first quarter declined by 9% to US$3.6 billion. Lower revenue was recorded within Astra’s heavy equipment and mining businesses and agribusiness, and in addition, following the implementation of the restructuring to a two-tiered distribution model, there was reduced revenue from Astra’s Toyota sales operations. Profit attributable to shareholders was 20% lower at US$141 million. Earnings per share were 25% lower at US¢36, the greater decline reflecting the effects of the rights issue undertaken in 2015. Astra contributed US$111 million to the Group’s underlying profit, with a 22% decline in its results in rupiah translated into a 27% fall in US dollars. The rupiah was on average 5% weaker than in the first quarter of the previous year. The Group’s Direct Motor Interests contributed an underlying profit of US$35 million, 14% up on the previous year. No contribution was recognised from the Group’s Other Interests as both Siam City Cement and Refrigeration Electrical Engineering have yet to announce their first quarter results. The Group had consolidated net cash, excluding borrowings within Astra’s financial services subsidiaries, of US$424 million. The improvement over the net cash at the end of December 2015 of US$255 million was due largely to strong operating cash flows together with lower capital expenditure. Net debt within Astra’s financial services subsidiaries of US$3.2 billion at the end of March was similar to the position at the end of last year. JC&C parent company’s net cash was US$129 million, slightly down from the US$136 million at the end of 2015. The Board has not declared a dividend for the first quarter ended 31st March 2016 (31st March 2015: Nil). Group Review Astra Astra reported a net profit equivalent to US$230 million under Indonesian accounting standards, 22% down in its reporting currency with declines mainly in the heavy equipment and mining, financial services and automotive businesses. Automotive Overall automotive demand softened slightly during the period, although a general reduction in discounts has seen some margin improvement. The wholesale market for cars fell by 5% to 267,000 units. Astra’s car sales were 7% lower at 127,000 units, with its market share decreasing from 49% to 48%. The group launched two new models and five revamped models during the period.
- more -
Page 3 The wholesale market for motorcycles decreased by 6% to 1.5 million units. Astra Honda Motor’s domestic sales were slightly reduced to 1.1 million units, resulting in its market share increasing from 68% to 72%. Astra Honda Motor launched two new models and seven revamped models during the period. Astra Otoparts, the group’s automotive component business, saw net income fall by 8% to US$6 million, due to a lower contribution from its OEM manufacturing business on higher operating costs. Financial Services Net income from the group’s financial services businesses decreased 46% to US$47 million. Increased earnings at Federal International Finance and Toyota Astra Financial Services were more than offset by a decline in the contributions from its other financial services interests, in particular Permata Bank. The consumer finance businesses saw an increase in the amount financed by 4% to US$1.2 billion, including balances financed through joint bank financing without recourse. Net income at motorcycle-focused Federal International Finance was up 23% at US$29 million, benefiting from improved market share and product diversification. Car-focused Astra Sedaya Finance reported net income 27% lower at US$16 million, whereas Toyota Astra Financial Services recorded net income 10% higher at US$6 million. The amount financed through the group’s heavy equipment-focused finance operations increased by 16% to US$75 million. Surya Artha Nusantara Finance which is focused on small-medium heavy equipment financing, reported net income 47% lower at US$1 million. Astra’s 45%-held joint venture, Permata Bank, reported a net loss of US$28 million (2015: net income US$44 million) due to an increase in loan loss provisions as non-performing loans rose to 3.5% from 2.7% at the prior year end, despite a 3% increase in net interest income. The group’s general insurance company, Asuransi Astra Buana, recorded net income 31% lower at US$15 million, primarily due to lower investment earnings. The group’s life insurance joint venture with Aviva plc, which markets its products and services as “Astra Life powered by Aviva”, acquired more than 19,000 individual life customers (full year 2015: 28,500) and more than 64,000 participants of its corporate employee benefits programmes in the first quarter of 2016 (full year 2015: 186,000). Heavy Equipment and Mining United Tractors, which is 60%-owned, reported net income of US$54 million, a 55% decrease due to lower revenue on lower business volumes. In the construction machinery business, revenue declined 13% as Komatsu heavy equipment sales fell by 35% to 499 units. The contract mining operations of subsidiary, Pamapersada Nusantara, reported a 20% decrease in revenue as contract coal production declined 4% to 24 million tonnes, with contract overburden removal down 7% at 163 million bank cubic metres. United Tractors’ mining subsidiaries reported 2% higher coal sales at 2 million tonnes, with revenue decreasing by 11% due to lower coal prices. General contractor Acset Indonusa, 50%-held by United Tractors, reported net income of US$1 million, 59% up on the previous year, with US$176 million of new contracts secured for the quarter, compared to US$228 million for the whole of 2015.
- more -
Page 4 Agribusiness Astra Agro Lestari, which is 80%-held, reported net income of US$31 million, an increase of 168%. Although crude palm oil sales were 5% higher at 271,000 tonnes and olein sales increased by 78% to 106,000 tonnes, average crude palm oil prices achieved were 16% lower at Rp6,593/kg. During the first quarter, the benefit of a stronger rupiah as at the end of March 2016 compared to December 2015 led to a translation gain on its US dollar monetary liabilities, which more than offset the impact on its US dollar denominated and linked income. Infrastructure, Logistics and Others Net income from infrastructure, logistics and others increased by 128% to US$6 million, mainly due to higher toll road earnings. The 72.5 km Tangerang-Merak toll road, operated by 79%-owned Marga Mandalasakti, reported a 6% increase in traffic volumes to 11 million vehicles. Construction continues at the wholly-owned 40.5 km Kertosono-Mojokerto toll road near Surabaya. Section 1, which is 14.7 km long, began operations in October 2014 and further stages are expected to be operational during 2016 and 2017, subject to the timely completion of land acquisitions. In July 2015, Astratel acquired a 25% interest in the 72.6 km Semarang-Solo toll road, of which sections 1 and 2, being 22.8 km long, are operational. Taken together with Astratel’s 40% interest in the greenfield 11.2 km Kunciran-Serpong toll road on Jakarta’s outer ring road, the group has an interest in 196.8 km of toll roads. PAM Lyonnaise Jaya, which operates the western Jakarta water utility system, experienced an increase in sales volume of 3% to 38 million cubic metres. Serasi Autoraya’s revenue increased by 1% and net income increased by 29% to US$2 million, with an 11% decline in the number of vehicles under contract at its car leasing and rental business to 24,000 units more than offset by higher gains on used vehicle sales and logistic volumes. Anandamaya Residences, the group’s 60%-held luxury residential development project located in Jakarta’s Central Business District is 91% sold. Completion of Anandamaya Residences and the group’s adjacent grade A office tower, Menara Astra, is expected in 2018, as planned. Information Technology Astra Graphia, 77%-owned, which is active in the area of document information and communication technology solutions and is the sole distributor of Fuji Xerox office equipment in Indonesia, reported net income of US$3 million, down 8%. Direct Motor Interests The Group’s Direct Motor Interests contributed an underlying profit of US$35 million, a 14% increase over the previous year. The improvement was due mainly to the strong performance of Truong Hai Auto Corporation in Vietnam, which benefited from significantly higher sales, partly offset by lower margins. There was an improved performance from Singapore motor operations due to an increase in sales of passenger cars and parts. In Malaysia, Cycle & Carriage Bintang’s contribution was higher due largely to the increase in sales. In Indonesia, Tunas Ridean’s contribution increased due mainly to higher motor vehicle sales and improved results from Mandiri Tunas Finance, partly offset by lower motorcycle sales.
- more -
Page 5 Other Interests The Group did not recognise any contribution from its Other Interests in the first quarter of 2016 as its listed associates, 24.9%-held Siam City Cement Public Company Limited in Thailand and 23%-held Refrigeration Electrical Engineering Corporation in Vietnam, have yet to announce their first quarter results. These results are not expected to have a material impact to the Group and will be accounted for in the second quarter. Outlook The Group continues to face challenging trading conditions across the region. In Indonesia, Astra is seeing soft automotive demand, weak commodity prices and a further deterioration in corporate credit quality in Permata Bank. In the Group’s other operating markets, increased competitive pressure is expected. Ben Keswick Chairman 28th April 2016

- more -
Page 6 Statement pursuant to Rule 705(5) of the Listing Manual The directors confirm that, to the best of their knowledge, nothing has come to the attention of the Board of Directors which may render the accompanying unaudited interim financial results for the three months ended 31st March 2016 to be false or misleading in any material respect. On behalf of the Directors Ben Keswick Director Hassan Abas Director 28th April 2016
- more -
Page 7
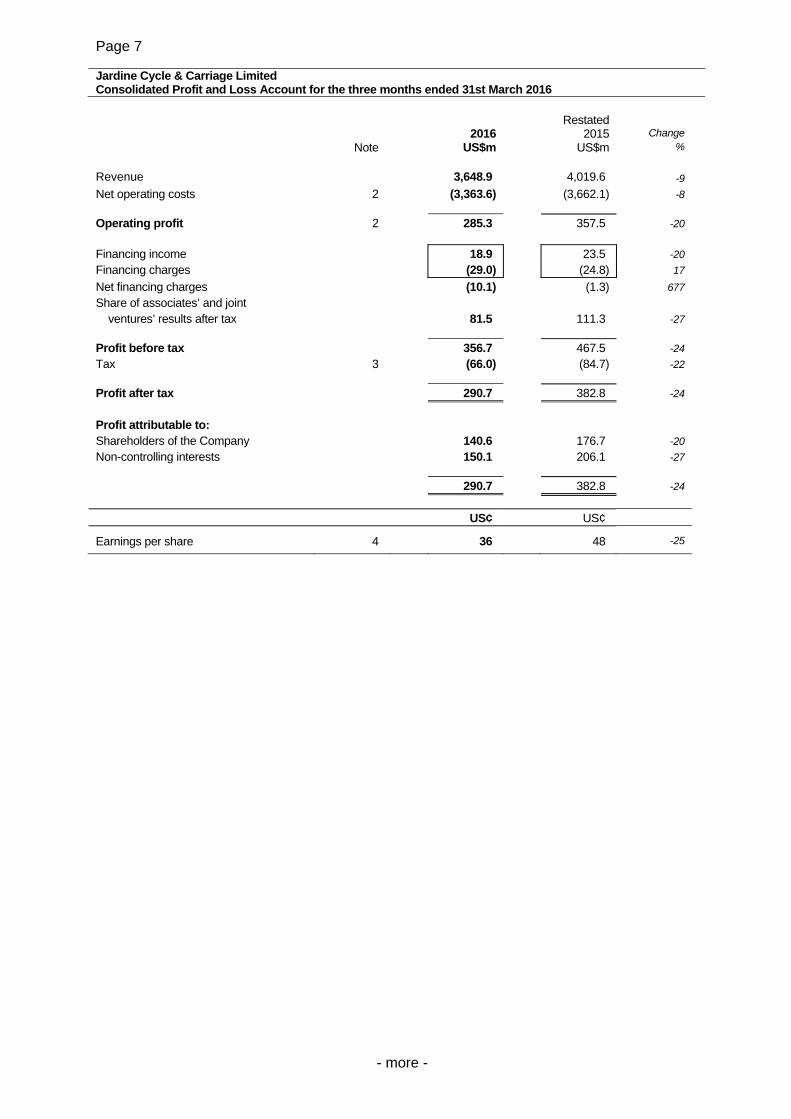
Jardine Cycle & Carriage Limited Consolidated Profit and Loss Account for the three months ended 31st March 2016 Restated
2016 2015 Change
Note US$m US$m %
Revenue 3,648.9 4,019.6 -9
Net operating costs 2 (3,363.6) (3,662.1) -8
Operating profit 2 285.3 357.5 -20
Financing income 18.9 23.5 -20
Financing charges (29.0) (24.8) 17
Net financing charges (10.1) (1.3) 677
Share of associates’ and joint
ventures’ results after tax 81.5 111.3 -27
Profit before tax 356.7 467.5 -24
Tax 3 (66.0) (84.7) -22
Profit after tax 290.7 382.8 -24
Profit attributable to:
Shareholders of the Company 140.6 176.7 -20
Non-controlling interests 150.1 206.1 -27
290.7 382.8 -24
US¢ US¢
Earnings per share 4 36 48 -25

- more -
Page 8 Jardine Cycle & Carriage Limited Consolidated Statement of Comprehensive Income for the three months ended 31st March 2016 Restated 2016 2015 US$m US$m Profit for the period 290.7 382.8 Items that will not be reclassified to profit or loss: Remeasurements of defined benefit pension plans 1.1 2.7 Tax on items that will not be reclassified (0.3) (0.7) Share of other comprehensive expense of associates
and joint ventures, net of tax (0.8) (1.8) - 0.2 Items that may be reclassified subsequently to profit or loss: Translation difference - gain/(loss) arising during the period 396.5 (487.0) Available-for-sale investments - gain/(loss) arising during the period 13.0 (16.6) - transfer to profit and loss 0.1 (8.6) Cash flow hedges - loss arising during the period (49.4) (7.5) - transfer to profit and loss 8.6 24.6 Tax relating to items that may be reclassified 10.2 (4.2) Share of other comprehensive income/(expense) of
associates and joint ventures, net of tax (2.4) 5.4 376.6 (493.9) Other comprehensive income/(expense) for the period 376.6 (493.7) Total comprehensive income/(expense) for the period 667.3 (110.9) Attributable to: Shareholders of the Company 317.5 (41.5) Non-controlling interests 349.8 (69.4) 667.3 (110.9)

- more -
Page 9 Jardine Cycle & Carriage Limited Consolidated Balance Sheet at 31st March 2016 Restated Restated At At At Note 31.3.2016 31.12.2015 1.1.2015 US$m US$m US$m
Non-current assets Intangible assets 937.2 894.2 922.3 Leasehold land use rights 588.6 569.1 618.3 Property, plant and equipment 2,944.7 2,878.4 3,548.1 Investment properties 273.3 253.2 203.7 Bearer plants 512.2 484.7 482.9 Interests in associates and joint ventures 3,396.1 3,261.7 2,624.4 Non-current investments 443.9 404.3 525.0 Non-current debtors 2,603.4 2,639.4 2,898.6 Deferred tax assets 241.1 220.0 231.6 11,940.5 11,605.0 12,054.9 Current assets Current investments 23.6 31.7 17.8 Stocks 1,488.9 1,531.7 1,538.1 Current debtors 4,558.9 4,231.6 4,704.9 Current tax assets 194.0 158.3 109.7 Bank balances and other liquid funds - non-financial services companies 1,990.2 1,927.6 1,389.9 - financial services companies 284.2 247.5 382.1
2,274.4 2,175.1 1,772.0 8,539.8 8,128.4 8,142.5
Total assets 20,480.3 19,733.4 20,197.4
Non-current liabilities Non-current creditors 182.2 164.4 280.0 Provisions 93.5 94.4 89.2 Long-term borrowings 5 - non-financial services companies 674.2 701.1 448.3 - financial services companies 1,542.7 1,796.0 2,176.3 2,216.9 2,497.1 2,624.6 Deferred tax liabilities 202.2 201.2 296.6 Pension liabilities 233.2 219.6 210.1 2,928.0 3,176.7 3,500.5 Current liabilities Current creditors 3,167.4 3,006.8 2,983.9 Provisions 74.3 60.6 55.7 Current borrowings 5 - non-financial services companies 892.0 971.6 1,180.7 - financial services companies 1,902.5 1,683.2 1,891.8 2,794.5 2,654.8 3,072.5 Current tax liabilities 121.8 107.5 105.8 6,158.0 5,829.7 6,217.9 Total liabilities 9,086.0 9,006.4 9,718.4 Net assets 11,394.3 10,727.0 10,479.0
Equity Share capital 6 1,381.0 1,381.0 632.6 Revenue reserve 7 5,206.2 5,065.3 4,654.9 Other reserves 8 (1,103.5) (1,280.2) (779.0) Shareholders' funds 5,483.7 5,166.1 4,508.5 Non-controlling interests 9 5,910.6 5,560.9 5,970.5 Total equity 11,394.3 10,727.0 10,479.0
- more -
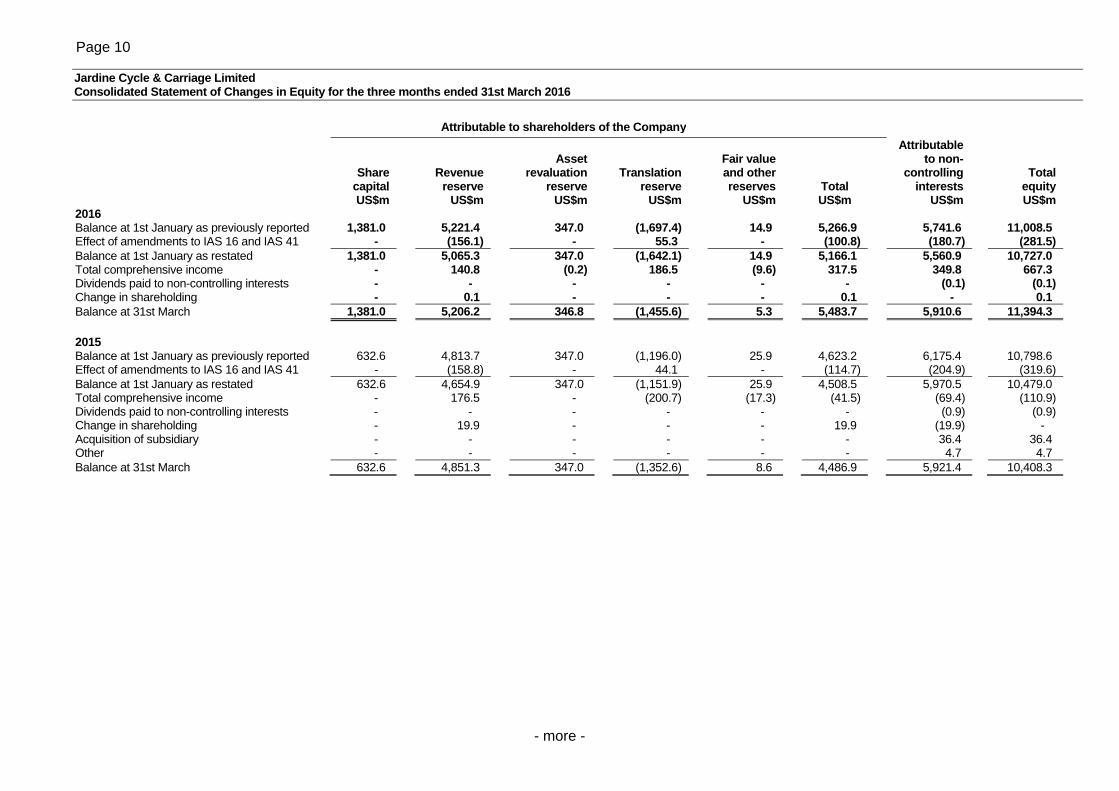
Page 10 Jardine Cycle & Carriage Limited Consolidated Statement of Changes in Equity for the three months ended 31st March 2016
Attributable to shareholders of the Company
Attributable Asset Fair value to non- Share Revenue revaluation Translation and other controlling Total capital reserve reserve reserve reserves Total interests equity US$m US$m US$m US$m US$m US$m US$m US$m 2016 Balance at 1st January as previously reported 1,381.0 5,221.4 347.0 (1,697.4) 14.9 5,266.9 5,741.6 11,008.5 Effect of amendments to IAS 16 and IAS 41 - (156.1) - 55.3 - (100.8) (180.7) (281.5) Balance at 1st January as restated 1,381.0 5,065.3 347.0 (1,642.1) 14.9 5,166.1 5,560.9 10,727.0 Total comprehensive income - 140.8 (0.2) 186.5 (9.6) 317.5 349.8 667.3 Dividends paid to non-controlling interests - - - - - - (0.1) (0.1) Change in shareholding - 0.1 - - - 0.1 - 0.1 Balance at 31st March 1,381.0 5,206.2 346.8 (1,455.6) 5.3 5,483.7 5,910.6 11,394.3
2015 Balance at 1st January as previously reported 632.6 4,813.7 347.0 (1,196.0) 25.9 4,623.2 6,175.4 10,798.6 Effect of amendments to IAS 16 and IAS 41 - (158.8) - 44.1 - (114.7) (204.9) (319.6) Balance at 1st January as restated 632.6 4,654.9 347.0 (1,151.9) 25.9 4,508.5 5,970.5 10,479.0 Total comprehensive income - 176.5 - (200.7) (17.3) (41.5) (69.4) (110.9) Dividends paid to non-controlling interests - - - - - - (0.9) (0.9) Change in shareholding - 19.9 - - - 19.9 (19.9) - Acquisition of subsidiary - - - - - - 36.4 36.4 Other - - - - - - 4.7 4.7 Balance at 31st March 632.6 4,851.3 347.0 (1,352.6) 8.6 4,486.9 5,921.4 10,408.3
- more -
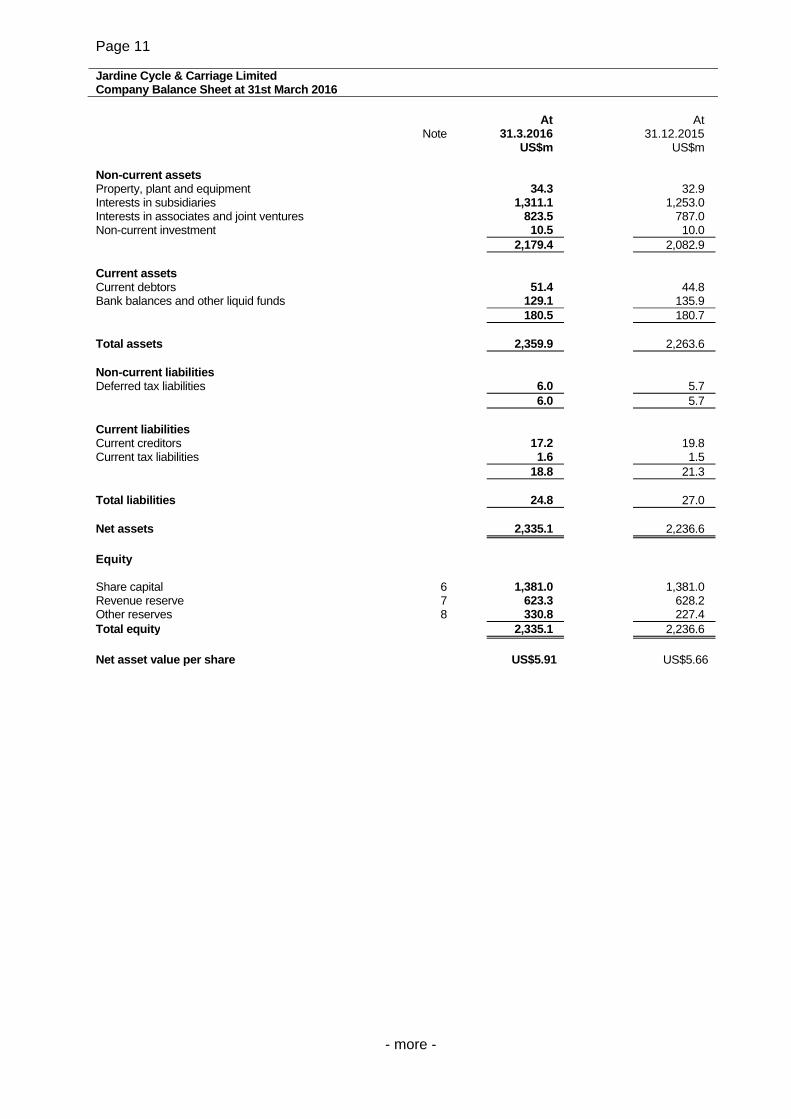
Page 11 Jardine Cycle & Carriage Limited Company Balance Sheet at 31st March 2016 At At Note 31.3.2016 31.12.2015 US$m US$m Non-current assets Property, plant and equipment 34.3 32.9 Interests in subsidiaries 1,311.1 1,253.0 Interests in associates and joint ventures 823.5 787.0 Non-current investment 10.5 10.0 2,179.4 2,082.9 Current assets Current debtors 51.4 44.8 Bank balances and other liquid funds 129.1 135.9 180.5 180.7 Total assets 2,359.9 2,263.6 Non-current liabilities Deferred tax liabilities 6.0 5.7 6.0 5.7 Current liabilities Current creditors 17.2 19.8 Current tax liabilities 1.6 1.5 18.8 21.3 Total liabilities 24.8 27.0 Net assets 2,335.1 2,236.6 Equity Share capital 6 1,381.0 1,381.0 Revenue reserve 7 623.3 628.2 Other reserves 8 330.8 227.4 Total equity 2,335.1 2,236.6 Net asset value per share US$5.91 US$5.66
- more -
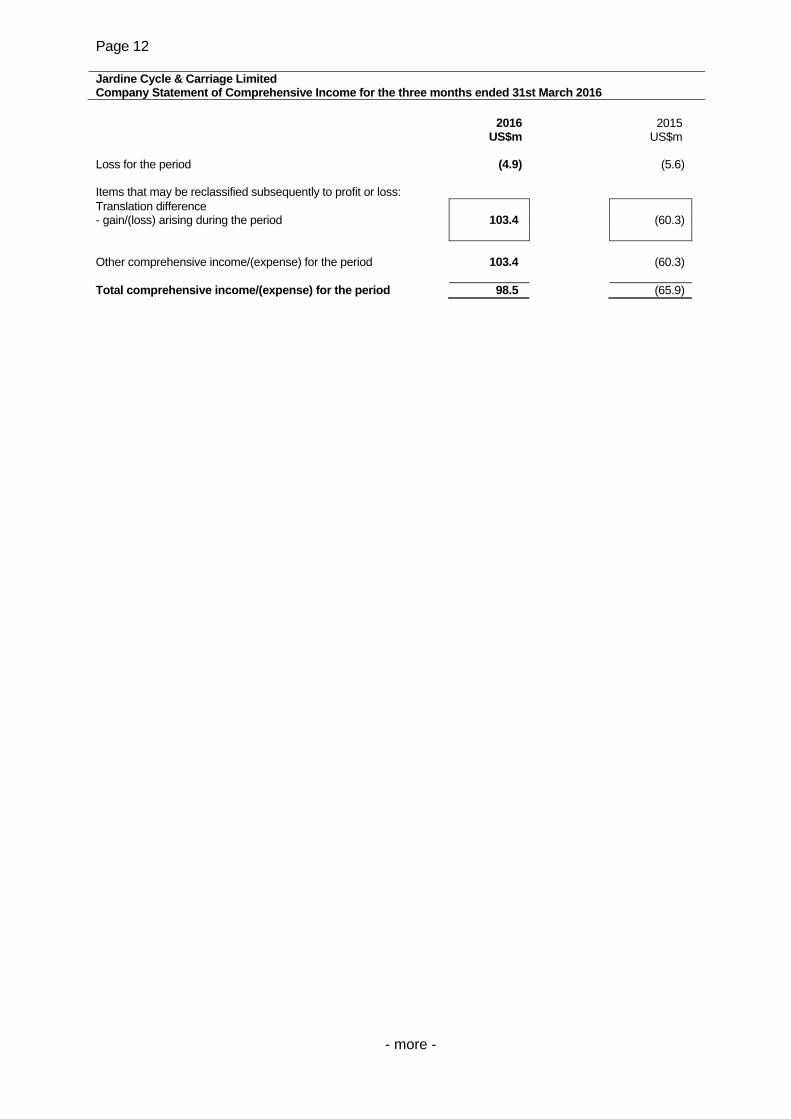
Page 12 Jardine Cycle & Carriage Limited Company Statement of Comprehensive Income for the three months ended 31st March 2016 2016 2015 US$m US$m Loss for the period (4.9) (5.6) Items that may be reclassified subsequently to profit or loss: Translation difference - gain/(loss) arising during the period 103.4 (60.3) Other comprehensive income/(expense) for the period 103.4 (60.3) Total comprehensive income/(expense) for the period 98.5 (65.9)
- more -
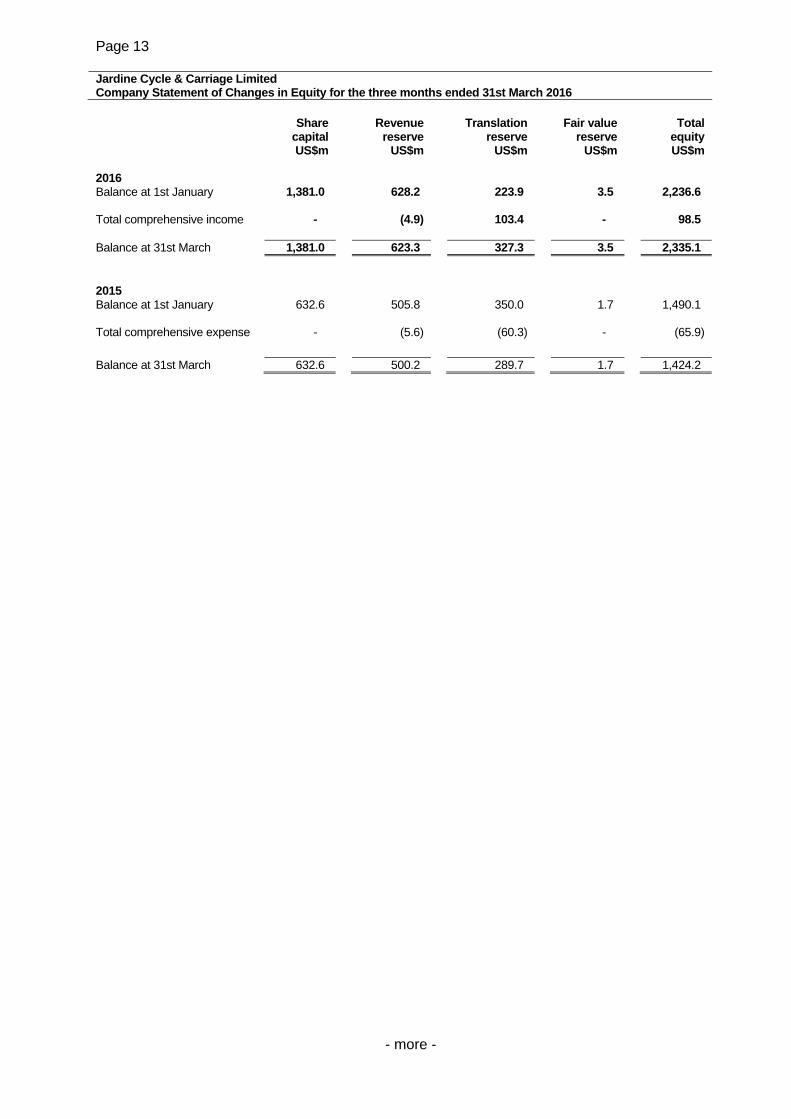
Page 13 Jardine Cycle & Carriage Limited Company Statement of Changes in Equity for the three months ended 31st March 2016 Share
capital Revenue
reserve Translation
reserve Fair value
reserve Total
equity US$m US$m US$m US$m US$m 2016 Balance at 1st January 1,381.0 628.2 223.9 3.5 2,236.6 Total comprehensive income - (4.9) 103.4 - 98.5 Balance at 31st March 1,381.0 623.3 327.3 3.5 2,335.1 2015 Balance at 1st January 632.6 505.8 350.0 1.7 1,490.1 Total comprehensive expense - (5.6) (60.3) - (65.9)
Balance at 31st March 632.6 500.2 289.7 1.7 1,424.2
- more -
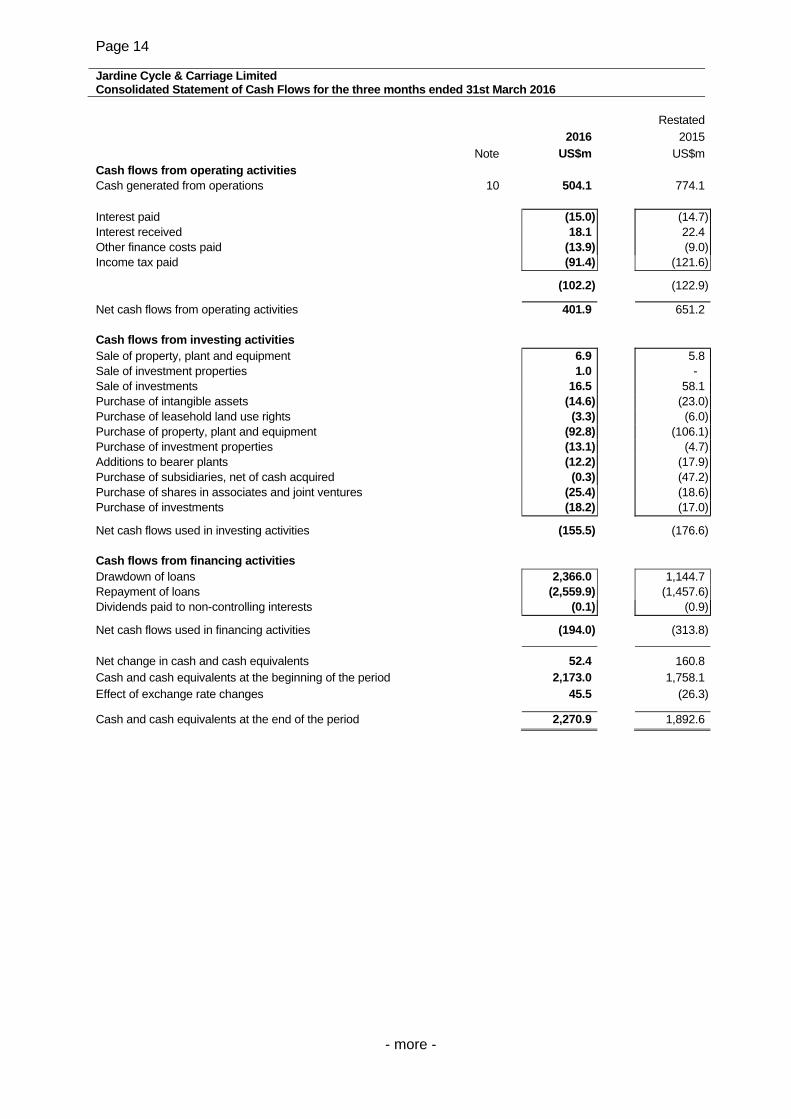
Page 14 Jardine Cycle & Carriage Limited Consolidated Statement of Cash Flows for the three months ended 31st March 2016 Restated
2016 2015
Note US$m US$mCash flows from operating activities Cash generated from operations 10 504.1 774.1 Interest paid (15.0) (14.7)Interest received 18.1 22.4Other finance costs paid (13.9) (9.0)Income tax paid (91.4) (121.6)
(102.2) (122.9)
Net cash flows from operating activities 401.9 651.2 Cash flows from investing activities Sale of property, plant and equipment 6.9 5.8Sale of investment properties 1.0 - Sale of investments 16.5 58.1Purchase of intangible assets (14.6) (23.0)Purchase of leasehold land use rights (3.3) (6.0)Purchase of property, plant and equipment (92.8) (106.1)Purchase of investment properties (13.1) (4.7)Additions to bearer plants (12.2) (17.9)Purchase of subsidiaries, net of cash acquired (0.3) (47.2)Purchase of shares in associates and joint ventures (25.4) (18.6)Purchase of investments (18.2) (17.0)
Net cash flows used in investing activities (155.5) (176.6) Cash flows from financing activities Drawdown of loans 2,366.0 1,144.7Repayment of loans (2,559.9) (1,457.6)Dividends paid to non-controlling interests (0.1) (0.9)
Net cash flows used in financing activities (194.0) (313.8)
Net change in cash and cash equivalents 52.4 160.8Cash and cash equivalents at the beginning of the period 2,173.0 1,758.1Effect of exchange rate changes 45.5 (26.3) Cash and cash equivalents at the end of the period 2,270.9 1,892.6
- more -
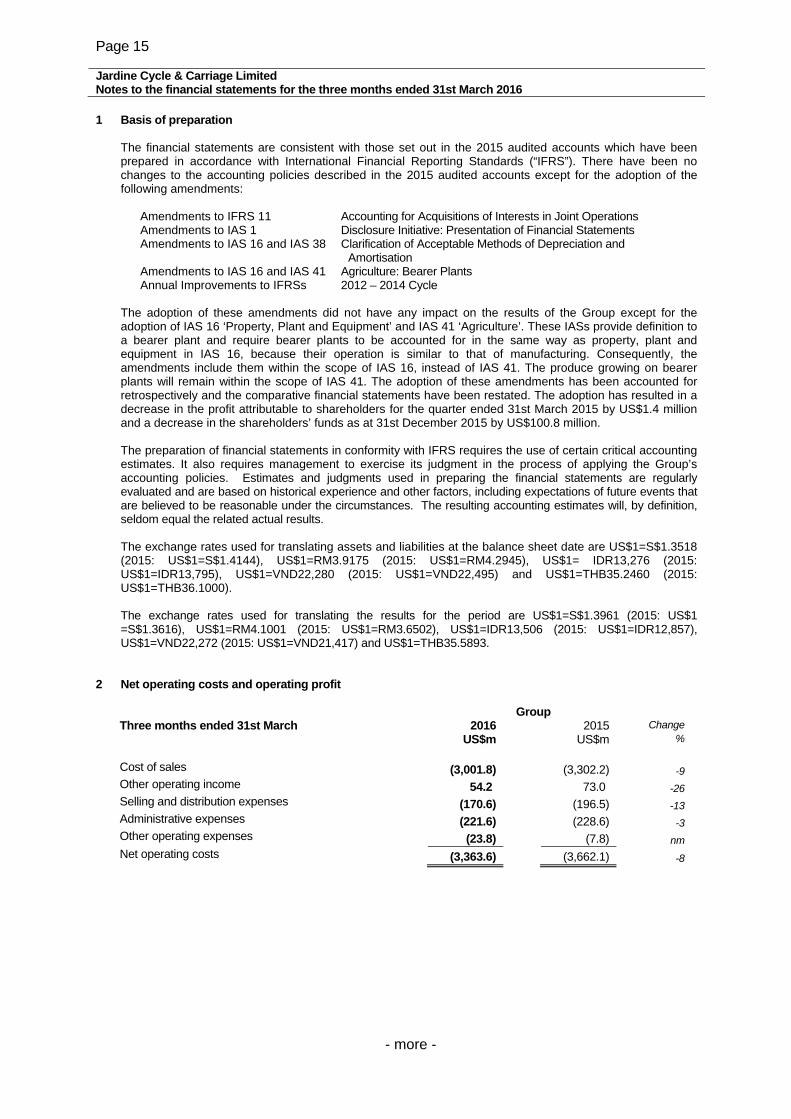
Page 15 Jardine Cycle & Carriage Limited Notes to the financial statements for the three months ended 31st March 2016 1 Basis of preparation
The financial statements are consistent with those set out in the 2015 audited accounts which have been prepared in accordance with International Financial Reporting Standards (“IFRS”). There have been no changes to the accounting policies described in the 2015 audited accounts except for the adoption of the following amendments:
Amendments to IFRS 11 Accounting for Acquisitions of Interests in Joint Operations Amendments to IAS 1 Disclosure Initiative: Presentation of Financial Statements Amendments to IAS 16 and IAS 38 Clarification of Acceptable Methods of Depreciation and
Amortisation Amendments to IAS 16 and IAS 41 Agriculture: Bearer Plants Annual Improvements to IFRSs 2012 – 2014 Cycle
The adoption of these amendments did not have any impact on the results of the Group except for the adoption of IAS 16 ‘Property, Plant and Equipment’ and IAS 41 ‘Agriculture’. These IASs provide definition to a bearer plant and require bearer plants to be accounted for in the same way as property, plant and equipment in IAS 16, because their operation is similar to that of manufacturing. Consequently, the amendments include them within the scope of IAS 16, instead of IAS 41. The produce growing on bearer plants will remain within the scope of IAS 41. The adoption of these amendments has been accounted for retrospectively and the comparative financial statements have been restated. The adoption has resulted in a decrease in the profit attributable to shareholders for the quarter ended 31st March 2015 by US$1.4 million and a decrease in the shareholders’ funds as at 31st December 2015 by US$100.8 million. The preparation of financial statements in conformity with IFRS requires the use of certain critical accounting estimates. It also requires management to exercise its judgment in the process of applying the Group’s accounting policies. Estimates and judgments used in preparing the financial statements are regularly evaluated and are based on historical experience and other factors, including expectations of future events that are believed to be reasonable under the circumstances. The resulting accounting estimates will, by definition, seldom equal the related actual results. The exchange rates used for translating assets and liabilities at the balance sheet date are US$1=S$1.3518 (2015: US$1=S$1.4144), US$1=RM3.9175 (2015: US$1=RM4.2945), US$1= IDR13,276 (2015: US$1=IDR13,795), US$1=VND22,280 (2015: US$1=VND22,495) and US$1=THB35.2460 (2015: US$1=THB36.1000). The exchange rates used for translating the results for the period are US$1=S$1.3961 (2015: US$1 =S$1.3616), US$1=RM4.1001 (2015: US$1=RM3.6502), US$1=IDR13,506 (2015: US$1=IDR12,857), US$1=VND22,272 (2015: US$1=VND21,417) and US$1=THB35.5893.
2 Net operating costs and operating profit
Group
Three months ended 31st March 2016 2015 Change
US$m US$m %
Cost of sales (3,001.8) (3,302.2) -9 Other operating income 54.2 73.0 -26 Selling and distribution expenses (170.6) (196.5) -13 Administrative expenses (221.6) (228.6) -3 Other operating expenses (23.8) (7.8) nm Net operating costs (3,363.6) (3,662.1) -8
- more -
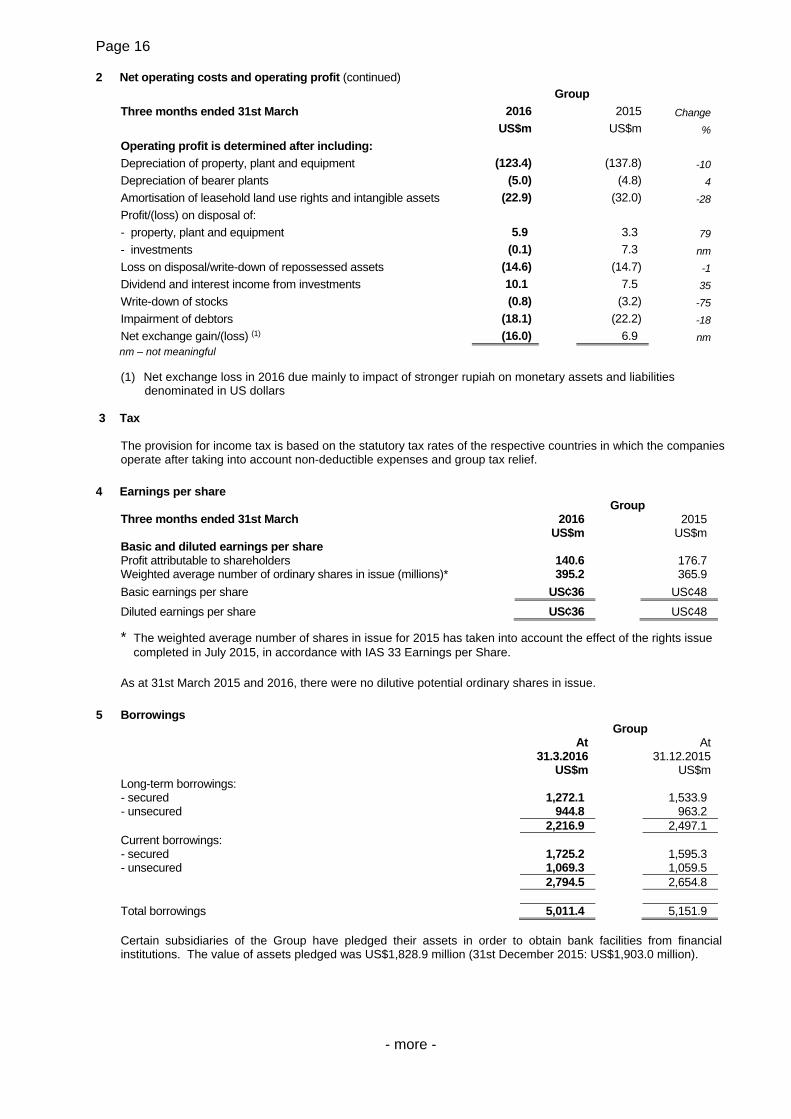
Page 16 2 Net operating costs and operating profit (continued)
Group
Three months ended 31st March 2016 2015 Change
US$m US$m %
Operating profit is determined after including:
Depreciation of property, plant and equipment (123.4) (137.8) -10
Depreciation of bearer plants (5.0) (4.8) 4
Amortisation of leasehold land use rights and intangible assets (22.9) (32.0) -28
Profit/(loss) on disposal of:
- property, plant and equipment 5.9 3.3 79
- investments (0.1) 7.3 nm
Loss on disposal/write-down of repossessed assets (14.6) (14.7) -1
Dividend and interest income from investments 10.1 7.5 35
Write-down of stocks (0.8) (3.2) -75
Impairment of debtors (18.1) (22.2) -18
Net exchange gain/(loss) (1) (16.0) 6.9 nm nm – not meaningful
(1) Net exchange loss in 2016 due mainly to impact of stronger rupiah on monetary assets and liabilities
denominated in US dollars
3 Tax The provision for income tax is based on the statutory tax rates of the respective countries in which the companies operate after taking into account non-deductible expenses and group tax relief.
4 Earnings per share Group
Three months ended 31st March 2016 2015 US$m US$m Basic and diluted earnings per share Profit attributable to shareholders 140.6 176.7 Weighted average number of ordinary shares in issue (millions)* 395.2 365.9
Basic earnings per share US¢36 US¢48
Diluted earnings per share US¢36 US¢48 * The weighted average number of shares in issue for 2015 has taken into account the effect of the rights issue
completed in July 2015, in accordance with IAS 33 Earnings per Share. As at 31st March 2015 and 2016, there were no dilutive potential ordinary shares in issue.
5 Borrowings
Group At At 31.3.2016 31.12.2015
US$m US$m Long-term borrowings: - secured 1,272.1 1,533.9 - unsecured 944.8 963.2 2,216.9 2,497.1 Current borrowings: - secured 1,725.2 1,595.3 - unsecured 1,069.3 1,059.5 2,794.5 2,654.8 Total borrowings 5,011.4 5,151.9 Certain subsidiaries of the Group have pledged their assets in order to obtain bank facilities from financial institutions. The value of assets pledged was US$1,828.9 million (31st December 2015: US$1,903.0 million).
- more -
Page 17
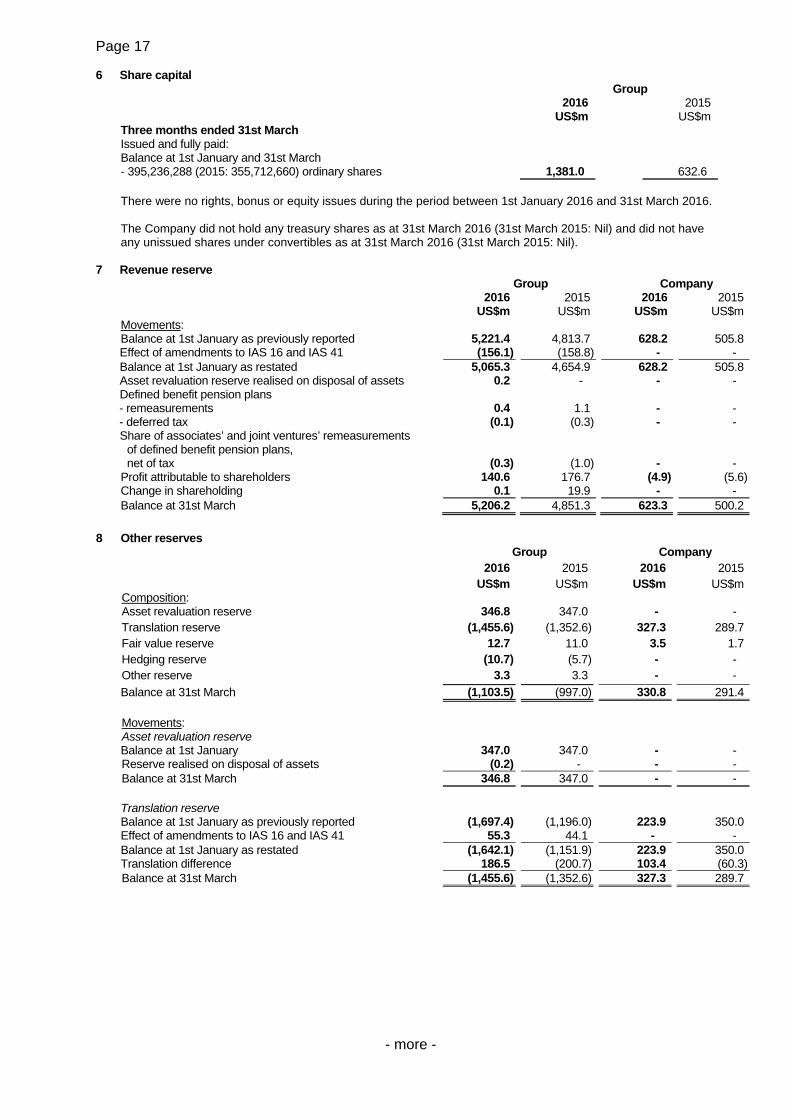
6 Share capital Group 2016 2015
US$m US$m Three months ended 31st March Issued and fully paid: Balance at 1st January and 31st March - 395,236,288 (2015: 355,712,660) ordinary shares 1,381.0 632.6 There were no rights, bonus or equity issues during the period between 1st January 2016 and 31st March 2016. The Company did not hold any treasury shares as at 31st March 2016 (31st March 2015: Nil) and did not have any unissued shares under convertibles as at 31st March 2016 (31st March 2015: Nil).
7 Revenue reserve Group Company 2016 2015 2016 2015 US$m US$m US$m US$mMovements: Balance at 1st January as previously reported 5,221.4 4,813.7 628.2 505.8Effect of amendments to IAS 16 and IAS 41 (156.1) (158.8) - - Balance at 1st January as restated 5,065.3 4,654.9 628.2 505.8Asset revaluation reserve realised on disposal of assets 0.2 - - - Defined benefit pension plans - remeasurements 0.4 1.1 - - - deferred tax (0.1) (0.3) - - Share of associates’ and joint ventures’ remeasurements
of defined benefit pension plans, net of tax (0.3) (1.0) - -
Profit attributable to shareholders 140.6 176.7 (4.9) (5.6)Change in shareholding 0.1 19.9 - - Balance at 31st March 5,206.2 4,851.3 623.3 500.2
8 Other reserves
Group Company 2016 2015 2016 2015
US$m US$m US$m US$mComposition: Asset revaluation reserve 346.8 347.0 - - Translation reserve (1,455.6) (1,352.6) 327.3 289.7Fair value reserve 12.7 11.0 3.5 1.7Hedging reserve (10.7) (5.7) - - Other reserve 3.3 3.3 - -
Balance at 31st March (1,103.5) (997.0) 330.8 291.4
Movements: Asset revaluation reserve Balance at 1st January 347.0 347.0 - - Reserve realised on disposal of assets (0.2) - - - Balance at 31st March 346.8 347.0 - - Translation reserve Balance at 1st January as previously reported (1,697.4) (1,196.0) 223.9 350.0Effect of amendments to IAS 16 and IAS 41 55.3 44.1 - - Balance at 1st January as restated (1,642.1) (1,151.9) 223.9 350.0Translation difference 186.5 (200.7) 103.4 (60.3)Balance at 31st March (1,455.6) (1,352.6) 327.3 289.7

- more -
Page 18 8 Other reserves (continued)
Group Company 2016 2015 2016 2015
US$m US$m US$m US$m Fair value reserve Balance at 1st January 5.2 36.1 3.5 1.7Available-for-sale investments - fair value changes 6.0 (20.8) - - - deferred tax (0.1) 0.1 - - - transfer to profit and loss 0.1 (4.1) - - Share of associates’ and joint ventures’ fair
value changes of available-for-sale investments, net of tax 1.5 (0.3) - -
Balance at 31st March 12.7 11.0 3.5 1.7 Hedging reserve Balance at 1st January 6.4 (13.5) - - Cash flow hedges - fair value changes (23.5) (5.7) - - - deferred tax 4.9 (1.8) - - - transfer to profit and loss 4.3 12.3 - - Share of associates’ and joint ventures’ fair
value changes of cash flow hedges, net of tax (2.8) 3.0 - - Balance at 31st March (10.7) (5.7) - - Other reserve Balance at 1st January and 31st March 3.3 3.3 - -
9 Non-controlling interests Group 2016 2015 US$m US$m Balance at 1st January as previously reported 5,741.6 6,175.4Effect of amendments to IAS 16 and IAS 41 (180.7) (204.9)Balance at 1st January as restated 5,560.9 5,970.5Available-for-sale investments - fair value changes 7.0 4.2- deferred tax (0.1) 0.1- transfer to profit and loss - (4.5)Share of associates’ and joint ventures’ fair value changes of
available-for-sale investments, net of tax 1.6 (0.3)Cash flow hedges - fair value changes (25.9) (1.8)- deferred tax 5.5 (2.6)- transfer to profit and loss 4.3 12.3Share of associates’ and joint ventures’ fair value changes of cash
flow hedges, net of tax (2.7) 3.0Defined benefit pension plans - remeasurements 0.7 1.6- deferred tax (0.2) (0.4)Share of associates’ and joint ventures’ remeasurements
of defined benefit pension plans, net of tax (0.5) (0.8)Translation difference 210.0 (286.3)Profit for the period 150.1 206.1Dividends paid (0.1) (0.9)Change in shareholding - (19.9)Acquisition of subsidiary - 36.4Other - 4.7Balance at 31st March 5,910.6 5,921.4
- more -
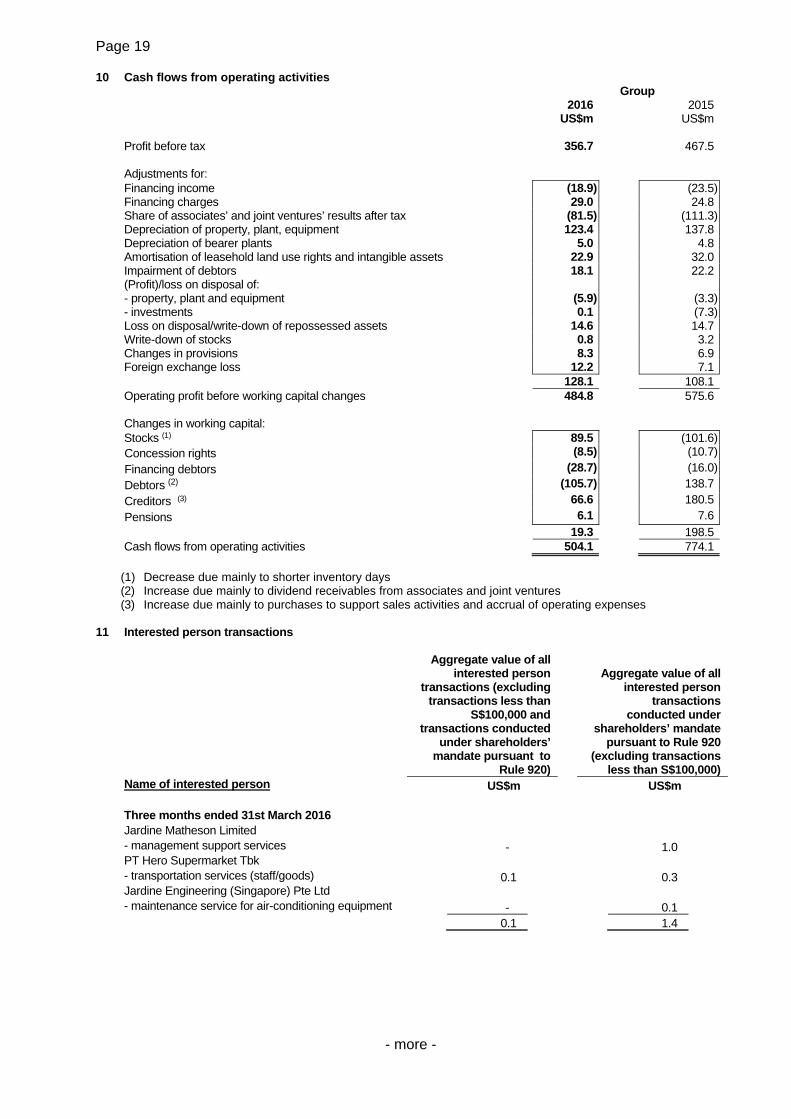
Page 19 10 Cash flows from operating activities
Group 2016 2015 US$m US$m
Profit before tax 356.7 467.5
Adjustments for: Financing income (18.9) (23.5)Financing charges 29.0 24.8Share of associates’ and joint ventures’ results after tax (81.5) (111.3)Depreciation of property, plant, equipment 123.4 137.8Depreciation of bearer plants 5.0 4.8Amortisation of leasehold land use rights and intangible assets 22.9 32.0Impairment of debtors 18.1 22.2(Profit)/loss on disposal of: - property, plant and equipment (5.9) (3.3)- investments 0.1 (7.3)Loss on disposal/write-down of repossessed assets 14.6 14.7Write-down of stocks 0.8 3.2Changes in provisions 8.3 6.9Foreign exchange loss 12.2 7.1
128.1 108.1Operating profit before working capital changes 484.8 575.6
Changes in working capital: Stocks (1) 89.5 (101.6)Concession rights (8.5) (10.7)
Financing debtors (28.7) (16.0)
Debtors (2) (105.7) 138.7
Creditors (3) 66.6 180.5
Pensions 6.1 7.6 19.3 198.5
Cash flows from operating activities 504.1 774.1
(1) Decrease due mainly to shorter inventory days (2) Increase due mainly to dividend receivables from associates and joint ventures (3) Increase due mainly to purchases to support sales activities and accrual of operating expenses
11 Interested person transactions
Aggregate value of all interested person
transactions (excluding transactions less than
S$100,000 and transactions conducted
under shareholders’ mandate pursuant to
Rule 920)
Aggregate value of all
interested person transactions
conducted under shareholders’ mandate
pursuant to Rule 920 (excluding transactions
less than S$100,000) Name of interested person US$m US$m
Three months ended 31st March 2016 Jardine Matheson Limited - management support services - 1.0 PT Hero Supermarket Tbk - transportation services (staff/goods) 0.1 0.3 Jardine Engineering (Singapore) Pte Ltd - maintenance service for air-conditioning equipment - 0.1
0.1 1.4

Page 20 12 Additional information
Group
Three months ended 31st March 2016 2015 Change
US$m US$m %
Astra International
Automotive 54.0 58.7 -8 Financial services 23.8 46.4 -49 Heavy equipment and mining 16.4 38.3 -57 Agribusiness 12.4 4.8 158 Infrastructure, logistics and other 2.6 1.4 86 Information technology 1.3 1.4 -7 110.5 151.0 -27 Direct Motor Interests Vietnam 20.5 18.7 10 Singapore 9.9 8.4 18 Malaysia 1.4 1.1 27 Indonesia (Tunas Ridean) 3.4 2.7 26 Myanmar - 0.1 -100 35.2 31.0 14 Corporate costs (5.1) (5.3) -4
Underlying profit attributable to shareholders 140.6 176.7 -20
13 Others
The results do not include any pre-acquisition profits and have not been affected by any item, transaction or event of a material or unusual nature.
No significant event or transaction other than as contained in this report has occurred between 1st April 2016 and the date of this report. The Company confirms that it has procured undertakings from all its directors and executive officers under Rule 720(1) of the Listing Manual.
- end -
For further information, please contact: Jardine Cycle & Carriage Limited Ho Yeng Tat Tel: 65 64708108 The full text of the Financial Statements and Dividend Announcement for the first quarter ended 31st March 2016 can be accessed through the internet at ‘www.jcclgroup.com’. Corporate Profile Jardine Cycle & Carriage (“JC&C”) is a leading Singapore-listed company and a member of the Jardine Matheson Group. It has an interest of just over 50% in Astra International (“Astra”), a premier listed Indonesian conglomerate, as well as Direct Motor Interests and Other Interests in Southeast Asia. Together with its subsidiaries and associates, JC&C employs some 245,000 people across Indonesia, Vietnam, Singapore, Thailand, Malaysia and Myanmar. Astra is the largest independent automotive group in Southeast Asia, with further interests in financial services, heavy equipment and mining, agribusiness, infrastructure, logistics and others, and information technology. JC&C's Direct Motor Interests operate in Singapore, Malaysia and Myanmar under the Cycle & Carriage banner, and through Tunas Ridean in Indonesia and Truong Hai Auto Corporation in Vietnam. JC&C's Other Interests comprise interests in market leading businesses in the region through which JC&C gains exposure to key economies by supporting such businesses in their long term development. Jardine Matheson is a diversified business group focused principally on Asia. Its businesses comprise a combination of cash generating activities and long-term property assets. In addition to its 75% shareholding in the Company, the Jardine Matheson Group’s interests include Jardine Pacific, Jardine Motors, Jardine Lloyd Thompson, Hongkong Land, Dairy Farm and Mandarin Oriental. These companies are leaders in the fields of engineering and construction, transport services, motor vehicles, insurance broking, property investment and development, retailing, restaurants and luxury hotels.