japan s energy and environmental policies with its industries
TRANSCRIPT

Morihiro KURUSHIMAProfessor
Toyo Univ. / NEDO
Japan’s Energy and Environmental Policies with its industries
15 May 2007

1
In UK, Japan and all over the world “Making Business Sense of Climate Change”

Part I Overview of the Global Energy Situation and Recent ChangesPart II Importance of Energy Conservation and New Energy
Part III A Way to the World Tech. Bank for Energy & Environment
UK Ambassador, Sir Graham atToyo Univ. in 2006
Contents

3
Fragile Energy Supply Structure
- Scarce domestic energy resources- Low ratio of self-supply of energy compared
to other major countries- High dependency on oil from the Middle East
CharacteristicsCharacteristics
Energy in Japan in Comparison to the WorldEnergy in Japan in Comparison to the World
(%)
19.7
70.5
44.636.5
75.3
0
20
40
60
80
100
Japan U.S.A . Fance Germany Eng land
Ratio of the Self-supply of Energy in Major Countries (2000)
Source: IEA “Energy Balances of OECD Countries 2002”
86%
26%
37%
13%5%
48%40% 37% 39%
34%
0%
10%
20%
30%
40%
50%
60%
70%
80%
90%
100%
Japan U.S.A. France Germany England
Dependency on theMiddle EastDependency on oil
Dependency on the Middle East for Oil and Dependency on Oil in the World (2000-2001)
Source: BP Statistics 2002 and IEA, Oil and Gas Information (2002)
(%)
Source: IEA “Energy Balances of OECD Countries 2002”
Primary Energy Supply and Its Ratio in Major Countries (2000)
Japan U.S.A. France Germany UKPrimary energy supply(oil conversion: mtoe ) 525 2300 257 340 233
Coal 18 24 6 24 16Oil 51 39 34 39 36
Natural gas 12 24 14 21 38Nuclear power 16 9 42 13 10Hydropower 1.4 0.9 2.2 0.6 0.2
Recyclable energy, etc. 2 4 2 3 2

4
LetLet’’s go with Industriess go with Industries
1. Feasibility Study / Basic Survey
in Mexico in Thailand
Entrust NEDO Private
Sector FS

5
2. Project Formulation In Mexico In Thailand
Mitsubishi Electric Corp.
Japan AMA
Japan EXIMBank Finance
Thai AIA/ OCMRT, MOSTE Consultation
Mexico BANOBRAS
Priv. Bank

6
3. Project Implement.
In Mexico & Thailand
Japan AMA
Export (200 vehicles)
Monitoring, Construct. etc. Traffic Improvement Project in Bangkok
Mexico STE
Mitsubishi Electric Corp.

7
Part I
Overview of the Global Energy Situation and Recent Changes

8
0
2000
4000
6000
8000
10000
12000
14000
16000
18000
2004 2015 2030
Other renewables
Biomass and waste
Hydro
Nuclear
Gas
Oil
Coal
1. Medium Energy Demand and Supply ForecastI – 1 – a: Worldwide Primary Energy Supplies
・Worldwide primary energy supply will increase at an annual rate of 1.6% from 2004-2030 ・Dependence on fossil fuels will remain high: approximately 80% through 2030 ・Nuclear power and renewable energy still have potential for growth
10%
33%
26%
2%2%
23%
5%
Share in 2030

9
0
2000
4000
6000
8000
10000
12000
14000
2004 2015 2030
World
Asia + Australia & NZ
China
India
Japan
・ Asia’s share will be increase from 40% in 2004 to 50% in 2030
・ China’s share of Asian energy demand will reach 40%, while India will constitute 13% of
demand
Source:IEA World Energy Outlook 2006
Japan China India Other developing Asia
Forecast DemandProportional Structure of
Demand
12% 9% 7%
37% 39% 40%
14% 13% 13%
37% 39% 40%
0%
25%
50%
75%
100%
2004 2015 2030
I – 1 – b: Forecast of Energy Demand in the world & Asia
40%50%
Asia’s Share

10
I – 2 – a: Worldwide Oil Demand
Source:BP Statistical Review of World Energy June 2006
・United States consumes a stunning 25% of oil production ・China accounts for 1/3 of worldwide increase in oil demand over the last 5 year period.
2. Demand, Supply, and Price of Oil
US 25%
India 3.0%
Japan 6.4%China 8.5%
EU18%
Shift in Oil Demand Increment of Oil Demand in 2000-2005(World total demand in 2005: 3.9 billion tons)
US China India Japan EU World-50
0
50
100
150
200
250
300
350In million ton
0
200
400
600
800
1,000
1965
1970
1975
1980
1985
1990
1995
2000
2005 Year
Million tons Million tons Incremental Oil Demand, 2000-2005

11
0
10
20
30
40
50
60
70
80
1990
1991
1992
1993
1994
1995
1996
1997
1998
1999
2000
2001
2002
2003
2004
2005
2006
2007
I – 2 – b: Shifts in Oil Prices
Oil prices (WTI*) of about $20/barrel in the 1990s increased to $68/barrel in 2007 and $63/barrel now.
*WTI: West Texas Intermediate
*Source: US Department of Energy
$63
(US$)

12
I – 2 – c: Impact of Previous Oil Crises on Japanese Economy
Japan has experienced two oil crises in the past: ・First oil crisis led to drastic consumer price increases (~24%) and economic contraction ・Second oil crisis again resulted in consumer prices (~8%) and economic slowdown ・Both crises resulted in major social and economic disruptions
1st Oil Crisis
2nd Oil Crisis
Source: System of National Accounts, Cabinet Office/ Consumer Price Index, Ministry of Public Management
(%)
-5
0
5
10
15
20
25
30
1970
1971
1972
1973
1974
1975
1976
1977
1978
1979
1980
1981
1982
1983
1984
1985
Consumer Price IndexActual GDP Growth

13
3. “Oil Peak” is real? North Sea Oil & Gas Production at the DTI’s Report
Gas
Oil
0.0
0.5
1.0
1.5
2.0
2.5
3.0
3.5
4.0
4.5
5.0
1967 1970 1973 1976 1979 1982 1985 1988 1991 1994 1997 2000 2003 2006 2009 2012 2015 2018
Oil
Equiva
lent
(m
mbo
e/da
y)
Gas - Possible
Oil - PossibleGas - 2P
Oil - 2P
Already produced Future production

14
Key to reducing CO2 emissions is development and dissemination of technology
○ Development and dissemination of technology is key to sustainable economic development and reducing CO2 emissions
○ Specifically, key technologies to be developed and disseminated are related to: ・ energy conservation ・ new energy resources ・ nuclear power
○ Despite ample reserves, development of technology to cleanly and efficiently use coal is required due to coal’s environmental impact
○ International collaboration, such as Asia-Pacific Partnership for Clean Development and Climate (APP), is required for technology development, dissemination, and transfer ・ Countries responsible for CO2 emission reductions under Kyoto Protocol emit only about 30% of total emissions; CO2 emission reductions by United States and developing countries are also essential
4. Importance of Technology to Reduce CO2 Emissions

15
5. Energy Strategies of Major CountriesI – 5 – a: United States of America
・Promoting development of new oil exploration to avoid crisis atmosphere arising from dependency on foreign oil. ・In addition to various measures, including oil alternative energy development already being implemented, greater enthusiasm and determination at federal government level may be required. ・Different views between federal and state governments, concerned officials, and sectors.
○ Domestic oil development is being promoted in Gulf of Mexico and Alaska to reduce dependence on imported oil, especially from Middle East. Development is encountering opposition due to environmental concerns.
○ To reduce dependency on oil, United States has a plan to promote variety of energy sources, including coal, photovoltaic, and wind, to achieve objective of diversifying energy supplies. However, few specific policies exist to support this.
○ Bioethanol production is being promoted as a measure for transportation sector, which is responsible for about 40% of US energy consumption. Half of all vehicles sold get unfavorable gas mileage, such as SUVs. However, no regulations have been implemented to address this situation.
○ Discord between federal and state governments regarding approaches to global warming have become prominent. - Twelve state governments, including California, have established targets for greenhouse gas emission reductions. However, the federal government opposes such measures at a national level.
References: The White House, The Economist, Financial Times, the State of California, Pew Center on Global Climate Change

16
I – 5 – b: Potential Impact of Improving Gas Mileage in the United States
・ Half of vehicles sold in US in last five years are “gas guzzlers,” getting just 3-4 km/L. ・ Raising fuel efficiency of US motor vehicles to European levels would save 4 million barrels of oil per day. ・ Savings would be equivalent to daily production volume of Iran, third largest producer in the world.
Daily production volume of Iran, third largest oil producer in the world
Expected energy conservation effect:
4 million barrels per day
What if the average gas mileage of US vehicles (7 km/L) were improvedto match those of European vehicles (13 km/L)?
Reference:Financial Times

17
I – 5 – c: EU
References: The Economist, the British Government
・Introduction of non-fossil fuels has progressed significantly. ・Anxious about being heavily dependent on gas imports from Russia. ・Trend of mergers and acquisition among energy companies amid integration and expansion of markets is meeting with objections from member states
○ Introduction of fossil fuel alternatives has progressed significantly. - Photovoltaic power and wind power are being actively introduced in Germany. ・Cumulative photovoltaic power generation installed capacity increased by a factor of 12.5 in the period 2000 – 2005 (114MW to 1429MW) ・Wind power produces 26.5 billion kWh (2005) or 4.3% of total national electricity generation - UK is revaluating nuclear power. There was a proposal to install a nuclear power plant in 2005 for first time in 17 years.
○ Anxious about dependency on Russian gas imports - Production levels of Russian gas, on which EU is heavily dependent, have been problematic. Level of dependency on Russia is 100% in Finland, 43% in Germany, 30% in Italy, 26% in France. - In addition, recent increase in price of gas sold to Ukraine and Belarus has intensified concerns.
○ Energy companies intend to unite in attempt to deregulate energy markets in July 2007. - Germany’s E.ON’s action to acquire Spanish electric company Endesa Spanish government, considering necessity of large nationwide company, opposed merger plan and submitted 19 conditions. - French government initiated merger of its electric company, Suez, and gas company, GDF. Concern over possible takeover by an Italian company in the offing.

18
Part II Importance of Energy Conservation and New Energy

19
II – 1 – a: Projects in Japan1. Significance of Energy Conservation in Japan
○ Since oil crises, Japan has responded with regulatory measures and technological developments and has made some significant achievements.
○ From regulatory perspective, Japan implemented mandatory periodic reports of energy consumption by factories and mandatory oil stockpiling (Current oil reserves – government: 91 days/private sector: 83 days)
○ Below projects were implemented through industry-academic-government collaboration under governmental direction, within well established structure ・ Sunshine Project (as of 1974) R&D of oil alternative technology, including new energy ・ Moonlight Project (as of 1978) R&D of energy conservation technology
○ These projects resulted in drastic reduction of dependency on oil and progress in energy conservation, especially the industrial sector, which has achieved the world’s highest energy efficiency levels.
○ Projects are still underway that focus especially on consumer and transportation sectors, where potential for reduction is even greater than industrial sector.

20
II – 2 – a: Shifts in Energy Consumption by Sector
Source: Energy Whitepaper 2006, Agency for Resources and Energy
・ Oil crises spurred industrial sector towards major progress in energy conservation ・Consumer and transportation sectors have not kept up with industrial sector
16
2. Energy Conservation
0
2
4
6
8
10
12
14
16
18
1965 1970 1975 1980 1985 1990 1995 2000
0
100
200
300
400
500
(Actual GDP:in trillion JPY)(Final Energy Consumption:10 J)
Year
Transportation~ 24%
Consumer~ 31%
Industrial~ 45%
Actual GDP 526 trillion JPY
1stOil Crisis
2ndOil Crisis
Gulf Crisis
~ 24%
~ 22%
~ 26%
~ 50%
~ 21%
~ 57%
~ 16%
~ 67%
~ 17%
21
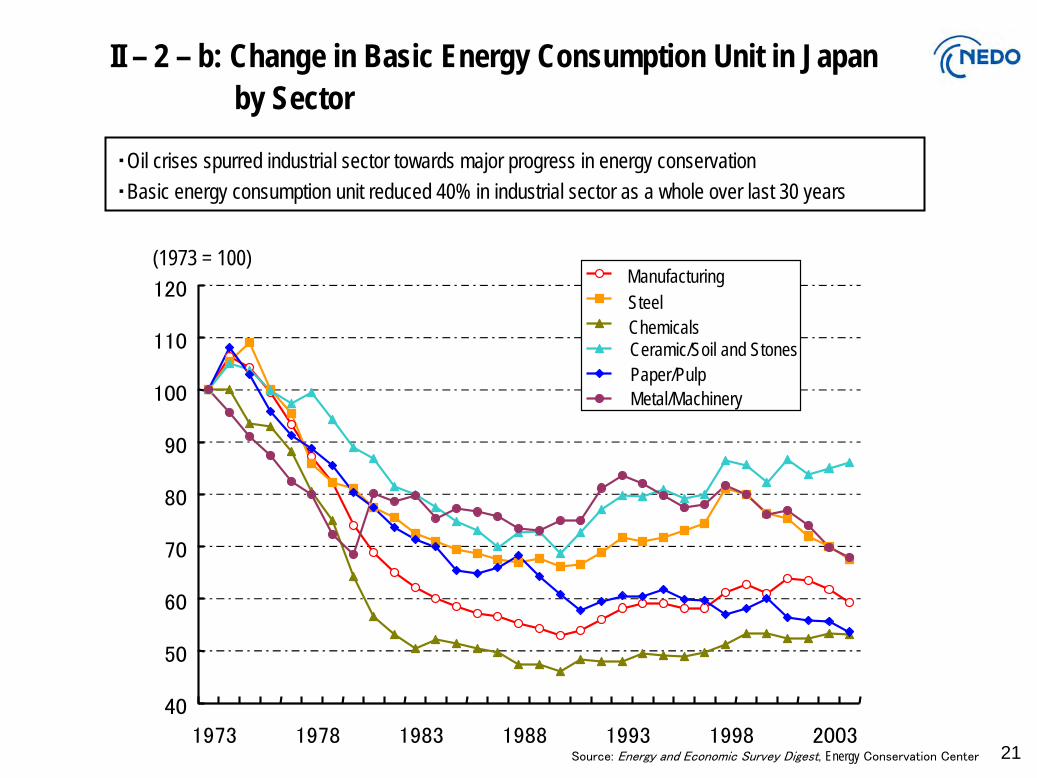
II – 2 – b: Change in Basic Energy Consumption Unit in Japan by Sector
Source: Energy and Economic Survey Digest, Energy Conservation Center
・Oil crises spurred industrial sector towards major progress in energy conservation ・Basic energy consumption unit reduced 40% in industrial sector as a whole over last 30 years
40
50
60
70
80
90
100
110
120
1973 1978 1983 1988 1993 1998 2003
ManufacturingSteelChemicalsCeramic/Soil and StonesPaper/PulpMetal/Machinery
(1973 = 100)

22
II – 2 – c: Examples of Energy Conservation by Technology
・In cement industry, technology was developed to produce a chemical reaction of raw materials before injecting them into cement kiln, resulting in major energy savings (60% reduction in basic energy consumption unit over 20 years)
・Automotive sector improved gas mileage by 20% over seven years through improved engine technology, light-weighting of chassis, and other improvements.
Change in Fuel Basic unit for Industrial Cement Change in Average Gas Mileage of Passenger Vehicles
Source: Japan Cement Association/ Japan Automobile Manufacturers Association, Inc.
0
1,000
2,000
3,000
4,000
5,000
6,000
7,000
8,000
9,000
1950
1955
1960
1965
1970
1975
1980
1985
1990
1995
2000
(MJ/t)
10
11
12
13
14
15
16
1993
1994
1995
1996
1997
1998
1999
2000
2001
2002
2003
2004
(km/L)
Target value for 2010: 15.1km/L
Change in Basic Energy Consumption Unit for Cement Industry

23
II – 2 – d: Impact of Energy Conservation Efforts
Japan created and is currently implementing energy conservation programs that will save the equivalent of 56 million kilolitres of oil in the industrial, civilian, and transportation sectors, pursuant to the Kyoto Protocol.
Reference: Energy Conservation Center, Energy and Economic Survey Digest, IEE
Sector Energy Conservation (Crude Oil
Equivalent: in million kL)
Oil Tanker Equivalent(260,000 ton class)
Standard Nuclear Power Plant Equivalent
Relative to Amount of Imported Crude Oil in
2004
Industrial 21 74.7 29.3 8.6%
Consumer 17.4 61.9 24.3 7.2%
Transportation 17.3 61.5 24.1 7.2%
Total 56 198.1 77.7 23.0%
Impact of Energy Conservation by 2010 (compared to 1996)
Note: For the purposes of this calculation, a standard nuclear power plant is estimated to produce 1.1 million kW of output, and to be online 80% of the time.

24
① NEDO developed LED lighting devices that consume one-eighth the electricity of incandescent lighting devices, and half the electricity fluorescent lighting devices do. They are now in use in traffic signals nationwide.
② A cooling system made with a thermoelectric element called a “Peltier Device” was developed and used as a cooling system in personal computers and wine cellars because of its quiet operation and energy saving characteristics.
③ About 320 out of 8000 existing industrial furnaces are high performance industrial furnaces with an energy conservation effect exceeding 30%.
II – 2 – e: Economic and Environmental Benefits○ Energy conservation projects are advantageous in economically and environmentally, including
the conservation of energy resources, the stabilization of energy prices, the reduction of environmental burdens (CO2, etc.), and the offsetting of climate change effects.
○ Furthermore, even though capital investments, which do not directly improve productivity in the short-term, are necessary to implement energy conservation projects, these investments do improve productivity, enhanced competitive strength, and create new technology and new businesses in the longer term.
Examples of New Technologies and Business Creation
25
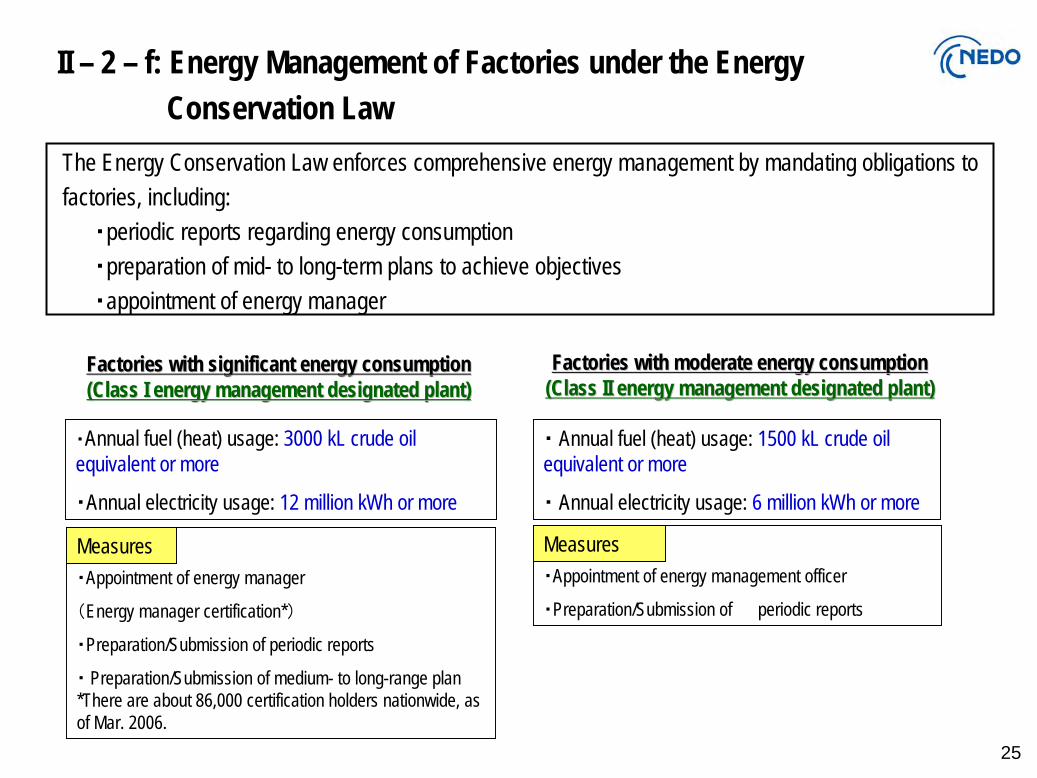
II – 2 – f: Energy Management of Factories under the Energy Conservation Law
The Energy Conservation Law enforces comprehensive energy management by mandating obligations to factories, including: ・periodic reports regarding energy consumption ・preparation of mid- to long-term plans to achieve objectives ・appointment of energy manager
・Appointment of energy management officer
・Preparation/Submission of periodic reports・Appointment of energy manager
(Energy manager certification*)
・Preparation/Submission of periodic reports
・ Preparation/Submission of medium- to long-range plan *There are about 86,000 certification holders nationwide, as of Mar. 2006.
Factories with significant energy consumptionFactories with significant energy consumption(Class I energy management designated plant)(Class I energy management designated plant)
・Annual fuel (heat) usage: 3000 kL crude oil equivalent or more
・Annual electricity usage: 12 million kWh or more
・ Annual fuel (heat) usage: 1500 kL crude oil equivalent or more
・ Annual electricity usage: 6 million kWh or more
Factories with moderate energy consumptionFactories with moderate energy consumption(Class II energy management designated plant)(Class II energy management designated plant)
MeasuresMeasures

26
II – 2 – g: Improvement in Efficiency of Products under Energy Conservation Law (1)
- The top runner program* was introduced in 1998 for energy conservation standards for home/office appliances and fuel economy standard for automotives.
Energy-Conservation Target for Specific Equipment
Energy conservation effects in comparison with FY2000(against FY1999 figures for transformers)
* * Top Runner Program:Top Runner Program:The program seeks continuous improvement in The program seeks continuous improvement in energy conservation standard/performance energy conservation standard/performance among the latest products. E.g. Fuel economy among the latest products. E.g. Fuel economy standard of automobile, energy conservation standard of automobile, energy conservation standard for electric equipment etc.standard for electric equipment etc.
Example of Top Runner ProgramTarget Year Energy conservation effects
Passenger vehicles (diesel) 2005 15%
Freight vehicles (gasoline) 2010 13%
Freight vehicles (diesel) 2005 7%
Air conditioners (cooling & heating) 2004 (Partly 2007) 63%
Air conditioners (cooling only) 2007 14%
TV sets 2003 16%
Video cassette recorders 2003 59%
Fluorescent lights 2005 17%
Copying machines 2006 30%
Computers 2005 83%
Magnetic disc units 2005 78%
Electric refrigerators / freezers 2004 30%
2010Passenger vehicles(Gasoline and LP gas)
Gasoline 23%LP gas 11.4%
Space heaters 2006 (Gas)1%/(Oil)4%Gas cooking appliances 2006 14%Gas water heaters 2006 4%Oil water heaters 2006 4%Electric toilet seats 2006 10%Vending machines 2005 34%Transformers 2006 (Partly 2007) 30%

27
II – 2 – h: Improvement in Efficiency of Products under Energy Conservation Law (2)
Labeling of energy conserving products
・Product’s Top Runner Standard achievement is displayed with labels.・Consumer-oriented labels indicate energy conservation performance of products to assist them in selecting products.
Reference: Energy Conservation Center, Japan
Products subject to this program include air conditioners, refrigerators, deep freezers, fluorescent lighting equipment, televisions, heaters, gas cooking appliances, and water heaters.
←Green mark for products fulfilling
Top Runner Standard
← Orange mark for products not fulfilling Top Runner Standard

28
II – 2 – i: Examples of Successful Technology Development and Introduction by NEDO (1)
・High Performance Industrial Furnace refers to a type of industrial furnace with an energy conservation effect exceeding 30%. ・Among 8000 existing installed furnaces, 320 High Performance Industrial Furnaces have already been installed. ・NEDO supported the introduction of 224, or 70%, of the 320 High Performance Industrial Furnaces installed. ・The installed High Performance Industrial Furnaces have resulted in a cumulative energy conservation effect of 188,000 kL.
Development of High Performance Industrial Furnace
1993-1997
Field Test for High Performance Industrial Furnace Introduction
1998-2000
R&D Field TestIntroduction/Promotion
Support Project for Industries for Increasing the Efficient Use of
Energy 2001-
International Energy Conservation Model Project
R&D of High Temperature Air Combustion Control Technology
1999-2003
Collaboration R&D, field testing, introduction and promotion
R&D
Source: NEDO
NEDO’s High Performance Industrial Furnace Project

29
II – 2 – j: Examples of Successful Technology Development and Introduction by NEDO (2)
Project Term
Subsidy Rate
Subsidy history and energy conservation volume
Subsidizing 1/3 of construction costs (or costs for additions or renovations)
1999-ongoing
Residential homes FY2005 Cumulative
Number of subsidized structures 901 4833
Energy conservation effect(Based on declared information (oil
equivalent)601 2740
Photovoltaic Power GenerationOr Solar Thermal Utilization
High-Efficiency Air-Conditioning System
or
Central Air-Conditioning System
Well-sealed/wellinsulated specifications
Hot Water Supply for Bathroom
Radiant Floor Heating
High Efficiency Hot Water Supply
Source: NEDO
Promotion of energy efficiency in residential buildings, which can reduce consumption about 15% for new homes and 25% for existing structures compared to energy consumed by conventional houses, by combining enhancements such as photovoltaic power generation, high-efficiency insulation, high- efficiency air-conditioners, high-efficiency water heaters, etc.
High-Efficiency Air-conditionerOr Central Air-Conditioning System

30
II – 2 – k: Examples of Successful Technology Development and Introduction by NEDO (3)
- Use IT technology to promote and facilitate a system that supports the energy demand management for commercial buildings (e.g., a system that ensures recognizing a real-time room conditions in buildings by temperature sensors and/or the optimal operation of lighting and air-conditioning responding to the room condition).
Human Detective Sensor
Detects human presence/absence in each floor/room and send the information data to the central monitoring & controlling unit.
Humidity & Temperature Sensor
Based on the data from the humidity & temperature sensor and human detective sensor, adequately controls air conditioning and lighting.
Aggregates and analyzes the energy use data and estimates the future energy demand to reflect for the air-conditioning control.
Measures humidity & temperature in each floor/room and send the information data to the central monitoring & controlling unit.
BEMS Image
Equipment Control
Central Monitoring & Controlling Unit
Controls the blowing volume of air-conditioners upon direction received from the central monitoring and controlling unit.
Thorough Energy Management Utilizing IT Thorough Energy Management Utilizing IT Promotion of Commercial Building Energy Management System (BEMS)Promotion of Commercial Building Energy Management System (BEMS)

31
II – 3 – a: Impact of New Energy
Reference: Energy Economy August 2006, IEE
Type of New EnergyNew Energy Volume (Oil Equivalent: in
million kL)
Oil Tanker Equivalent (260,000 ton class)
Standard Nuclear Power Unit Equivalent
Relative to Amount of Imported Crude
Oil in 2004
Photovoltaic Power Generation 3.6 13 5.0 1.5%
Wind Power Generation 2.3 8.1 3.2 1.0%
Industrial Waste Power Generation 3 10.9 4.2 1.2%
Biomass Power Generation 0.5 1.7 0.7 0.2%
Solar Thermal Utilization 0.3 1 0.4 0.1%
Industrial Waste Thermal Utilization 1.7 6 2.4 0.7%
Biomass Thermal Utilization 0.9 3.1 1.3 0.4%
Untapped Energy 0.2 0.6 0.3 0.1%
Total 12.5 44.5 17.4 5.2%
New Energy Generation in 2030
New energy volume in 2030 will be equivalent to power output of 17 standard nuclear power plants
Note: For the purposes of this calculation, a standard nuclear power plant is estimated to produce 1.1 million kW of output, and to be online 80% of the time.
3. New Energy

32
II – 3 – b: Photovoltaic Power Generation Cost in Japan
12090 80 70 65 65 63 59 52 48 45 44
367
200
143117 103 102 96 87 79 73 68 65
0
100
200
300
400
500
600
1974 1992 1993 1994 1995 1996 1997 1998 1999 2000 2001 2002 2003 2004
太陽光発電システム価格[万円/kW]
0
500
1000
1500
2000
2500
3000
その他
米国
ドイツ
日本
システム価格
モジュール価格
日本1,132MW
(44%)
ドイツ794MW(31%)
米国365MW(14%)
太陽
光発
電シ
ステ
ム累
積設
置容
量[MW]
2,000
Other countries
U.S.A.
Germany
Japan
System Price
Module Price
Pho
tovo
ltaic
Pow
er G
ener
atio
n Sy
stem
Pric
e [T
en T
hous
and
Yen
/kW
]
Cum
ulat
ive
Inst
alle
d P
V S
yste
m C
apac
ity [M
W]
U.S.A.
Germany
Japan

33
II – 3 – c: Micro Grid Demonstration Project with PV in Japan
Ota City
substation
(4kW×510 houses) (Dec. 2003- )

34
II – 3 – d: New Energy: Biomass
Representative Example
Budget (FY2006) Approx. 4.0 billion yen Project Period 2005 to 2009
Operational Entity: Yamaguchi Prefecture, Energy Supplied: 3,300kl/Year Crude Oil EquivalentObjective: A social system in which energy will be locally produced and consumed by developing and introducing three complex energy utilization systems: gasification cogeneration, heat (cold) generation from wood pellets and boilers, and coal and biomass co-firing in an existing coal-fired plant, as well as a low-cost collection and transportation system for forest biomass.
Number of Projects Executed
Food Waste Collection System
Used Cooking Oil Collection System
Led by Municipalities
Collection/ Transportation
・Woody Biomass・Used Cooking Oil ・Food Waste and Livestock Waste
・Heat Production・Liquid, Gaseous Fuels (Thermal Decomposition Gasification, Fermentation)
・ Gas Cogeneration・ Used in Public Fleets・ Heat Use, Electric Facilities
Companies/Municipalities
Energy Conversion
Fermentation
Linkage
Consumed Mainly within Municipalities
Energy Utilization
Electricity Used at Public Facilities
Linkage
Gasification plus Composition
Gasification Reactor
Com
posing R
eactor

35
II – 3 – e: Distributed Systems Including Solar and Biomass
Combine multiple new energy technologies with Japan’s own excellent systematic and integrated technology to establish a distributed energy supply system. Demonstrative experiment was conducted at Aichi EXPO and it stably supplied power to Japanese Government Pavilion and other buildings. (About 5% of all power supplied at the EXPO.)
NEDO Pavilion
High temperature gasification system (Capacity: 20kg/hr)
Photovoltaic system
(330kW in total)
Methane fermentation system(Capacity: 4.8 tons/day)
NaS battery(500kW: I/O capacity)
Fuel cell (MCFC)(270kW×1 unit, 300kW×1 unit)
Fuel cell (SOFC)(25kW×1 unit)
Fuel cell (PAFC)(200kW×4 units)
Total supply capacity2,225kW
Control room (energy control
system)
Source: NEDO

36
混合槽 (アルカリ処理)
破砕 ポンプ
反応槽 (バイオガス化)
精製 MCFC
排水処理
水: 7.2 m 3 / 日 NaOH : 20kg/ 日
破砕・分別
生ごみ等 4800 kg/ 日
バイオガス 1015 Nm 3 / 日
水: 76 m 3 / 日 脱水ケーキ 2100 kg/ 日
放流水 91 m 3 / 日
Planned SpecificationsCapacity 4.8t/day
Gas Production Rate Approx. 40m3N/hMethane Concentration of
Produced Gas Approx. 60%
Fuel cell (MCFC)(270kW×1 , 300kW×1) 87 tons of food waste (57.5% of total food waste, equivalent to the amount for 12.67 million visitors) was used as biomass resources.
Garbage, etc.800 kg/day
(Alkaline Treatment)
Dewatering Cake2100 kg/day
Separation, Crushing
Mixing Barrel Reaction Barrel(Biomass Gasification)
Crushing Pump
Refining
Wastewater Treatment
Water: 7.2 m3/dayNAOH: 20 kg/day
Water: 76 m3/day
Discharged Water 91 m3/day
Biogas1015 Nm3/day

37
Part III
Way to the World Tech. Bank for Energy and Environment

38
0
2
4
6
8
10
28
??? ?? ?? ???? ??? ?? ??
III – 1 – a: Comparison of Primary Energy Supply per GDP
Source: IEA “Key World Energy Statistics 2006”
Since Ukraine uses 28 times more energy per GDP dollar than Japan, there is a significant opportunity for energy conservation technology.
(石
油換
算ト
ン/
千ド
ル)
Primary energy supply per GDP in different countries
Ukraine China U.S.A France Germany UK Japan
Tons
of o
il eq
uiva
lent
/ 1,
000
dolla
rs =
1. Possibility in the world

39
III – 1 – b: Potential for Energy Conservation: Industrial Sector
For Ex, It is expected that crude steel production in India will reach 100 million tons by 2020. If all 25 coke ovens* required for that production were outfitted with energy-efficient Coke Dry Quenching (CDQ) technology, annual energy savings would total 1.35 million tons of oil equivalent per year.
CDQ
×25 units=Expected energy savings:
About 1.35 million tons, oil equivalent(7.29 million barrels of oil)
*1.20 million tons of coke/year

40
III – 1 – c: Changes in CO2 Emissions in G7
80
85
90
95
100
105
110
115
120
1990 1995 1997 1998 1999 2010
Rat
io(%
)
JapanUSA
CanadaUK
GermanyFranceItaly

41
III – 1 – d: Japan’s Strategies for the Kyoto Target:6% GHG Reduction!
2000
+10%
CO2 from non-energy,
methane, N2 O
- 0.5%
HFCs, PFCs,
SF6
Technology R&D, lifestyle change
Sinks-3.9%
Commitment - 6%
CO2 from energy use
Kyoto Mechanisms
last resort
BAU 2010
+ 2%- 2%
- 1.6%
1990 level 1990 level

42
2. Framework for CooperationIII – 2 – a: Potential means of cooperation between Japan and Ukraine
○ As shown below, fossil fuel import and production will decrease in the future.
Ukraine: 6.92kgCO2/2000$, Japan: 0.25 doUkraine: 6.92kgCO2/2000$, Japan: 0.25 do○ Given this, the development and introduction of energy conservation and new
energy technologies should be viewed as an opportunity for cooperation, not competition, and as the common responsibility of all nations.
○ JI with Japanese industries may increase the possibility.
○ Japan has led the world in this field for more than 30 years and has confidence based on that experience. Japan would like to actively cooperate.
○ Japan co-organized the “Japan-India Energy Forum” with India in December 2006. In addition, a cabinet-level Japan-India energy policy dialogue will start in the future.
○ The importance of the partnership between Ukraine and Japan will continue to grow. It is important to establish a win-win relationship.

43
Results of “India Japan Energy Forum” “India Japan Energy Forum” Agenda
“India Japan Energy Forum,” the first public-private forum between India and Japan, and co-organized by The Energy Resources Institute (TERI) and NEDO, was a success. Date and location:
Date: December 6-7, 2006 Location: New Delhi
Participants: more than 300 Indian side: relevant ministries (Planning Commission, Ministry of Power, Ministry of New and Renewable Energy, Ministry of Petroleum and Natural Gas and others), relevant organizations/companies, etc. Japanese side: METI, Embassy of Japan, NEDO, energy related organizations/companies, etc.
Inaugural session
Session 1: Overview of energy policies in India and Japan; Experience sharing
Session 2: Policy on energy efficiency and cross cutting approach for energy efficiency in industries
Session 3: Energy efficiency efforts in industry
Session 4: Technology status and development trends in renewable energy sector
Session 5: Introduction of activities for coal and petroleum/natural gas sectors
Session 6: Introduction of activities for the electric power sector
Closing Session: The way forward; cooperation opportunities
- Japan Energy Forum in India -

44
Fuel (Natural
Gas)
Fuel (Natural
Gas) SteamturbinesSteamturbines
Power generation
boilers
Power generation
boilers
Hot water boilers
Hot water boilers
Thermal Thermal
Power Power
1 2 2 .
Heat Recovery Steam Generation
Heat Recovery Steam Generation
Gas TurbineGas Turbine
Current condition
Model Project
Annual CO2 emissions in baseline case 192,000 t-CO2 /yAnnual CO2 emissions in project case 130,000 t-CO2 /y
Annual Emissions Reduction 62,000t-CO2 /y
Fuel flowHeat Power
III – 2 – b: The Model Project with Industries
Co-Generation Project in KazakhstanKazakhstan with NEDO & Tohoku Electric Power Co.

45
CDQ Project in China and India with NEDO & Nippon Steel Co.
Cooling chamber
Generator
Heat recovery boiler
Conveyor
Fan
Dust collectorSteam produced
Cokes basket
Steam turbine
HP LP
Extracted steam
Cokes
Heated cokes
Copy Rights; Nippon SteelCopy Rights; Nippon Steel

46
PV Power Supply Project in Mongolia with NEDO & Sharp Co.
Power plant : 100kW
Hospital : 40kWVillage office : 10kW
Communication center : 10kW
School : 40kW
Noyon Soum, Mongolia
PV: 200kWPower Distribution:
Hospital / Communication Center:24hrs/day 128 Households:16 hrs/day

47
PV panels
Electricity
Electricity
Electricity
Electricity
Micro-hydro power generator
BatteriesMicro-hydro power generator
Micro-hydro: 41.2kWPV1 : 30kWPV2-6 : 7.5kW
Power distribution:200 households, 6 hrs/day21
PV Power Supply Project with Micro-hidro in Cambodia
PV Power Supply Project with Micro-hidro in Cambodia

48
Latin America 13
Middle East Africa 23
(9%)
Mongolia 1
South West Asia 14
Tonga 1
Eastern & Central Europe 55(21%)
China 47(18%)
ASEAN 59(23%)
260 F/S47 Countries
Central Asia17
Russia 30(12%)
III – 2 – c : Implementing F/S on CDM/JI1998-2005 : 260 F/S in 47 countries

49
*CDM/JIProject Activity
Japanese Private Sector Firms
NEDO
(Necessary cost A )・Equipment introduction・Validation
・Certification・Verification
Etc.
Subsidy: maximum ½ or all of necessary cost
*Eligibility: Non- AnnexⅠ& AnnexⅠ Countries
Ministry of Economy, Trade and Industry (METI)
III – 2 – d: Subsidy for CDM/JI by NEDOFeasibility Studies:10/10, Project:5/10

50
Outline of the CTIOutline of the CTIAustria, Canada, Finland, Germany,Austria, Canada, Finland, Germany,
Norway, UK, USA, Japan and KoreaNorway, UK, USA, Japan and Korea
Chair : Mr.Holts/US.DOEVice Chair : Mr.Masunaga/METI,JAPAN,
Ms.Amin/UK.DEFRA P.Manager : Prof.Kurushima
Seminars and Symposia Technology Needs AssessmentsTraining CoursesInformation DisseminationWorking with UNFCCC/EGTT, UNIDO, UNDP etc.

51
CTI
Mauritius Gov.
SADAC S.African D. Bank
Preliminary Study
Basic Survey FS/Project Formation
Industry
Project Implementation
NRELUS-DOE
NEDOJapan
With Gov, International Org, Bank and Industry With Gov, International Org, Bank and Industry for Energy & Environmentfor Energy & Environment””

52
NEDO
Gov. /Gov.Org.
Bank
Coordination
Basic SurveyFS/Project Formation
Industry
Project Implementation
Academia/Univ.
NEDO is considering to establishNEDO is considering to establish““Coordinator for Energy & EnvironmentCoordinator for Energy & Environment””

53
PV R&D Scenario for 2010For Our Common FutureFor Our Common FutureFor Our Common Future
Gov. Initiative with 3Players for 3E
Sustainable Sustainable SocietySociety
Energy
Environment Economy
Industry
Academia
Financial

NEDO Offices and I should be waiting for you.
HeadquartersHeadquarters
WashingtonWashington
ParisParis
BangkokBangkok
BeijingBeijing
JakartaJakarta
New Energy and Industrial Technology Development Organization (NEDO) TEL:+81-44-520-5190, FAX:+81-44-520-5193