japan pharmaceutical market outlook sample 1-3,6 … · japan pharmaceutical market outlook ... the...
TRANSCRIPT

Japan Pharmaceutical Market Outlook Deregulation and More Efficient New Drug Approval Process Attract Foreign Investment and Improve the Competitiveness of Japanese Players

GBI Research Report Guidance
© GBI Research. This is a licensed product and is not to be photocopied GBIHC289MR / Published APR 2013 Page 2
GBI Research Report Guidance
The second chapter provides a brief introduction to the Japan’s economy and healthcare industry.
The third chapter gives an overview of the economic, demographic and healthcare landscape. Current trends in the generic and OTC market are also discussed.
The fourth chapter focuses on pharmaceutical industry characteristics, illustrating the new drug approval process, pricing policy, supply chain and other regulatory issues.
The report then analyzes the competitive landscape in Japan, including the major domestic companies and M&A.
The report concludes by providing an overview of the drivers and barriers currently facing the Japanese pharmaceutical industry.
© GBI Research. This is a licensed product and is not to be photocopied GBIHC289MR / Published APR 2013
Page 3
Executive Summary
Executive Summary
The Declining and Rapidly Aging Population Presents Significant Challenges to the Healthcare System and Economy as a Whole
Japan had a population of XX,XX,XX in 2011, making it the XXth most populated country in the world (The World Bank, 2012). However, since 2005, as the number of deaths exceeded that of births, the population has declined. Without significant government intervention, the depopulation process is expected to continue.
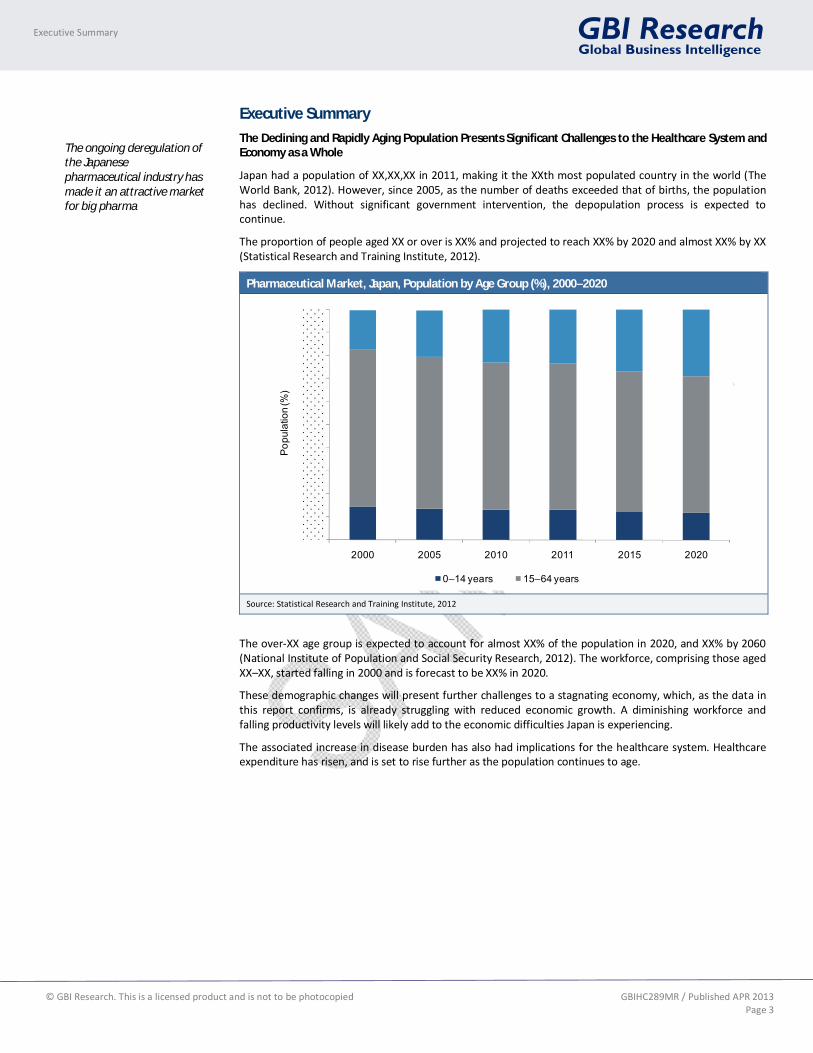
The proportion of people aged XX or over is XX% and projected to reach XX% by 2020 and almost XX% by XX (Statistical Research and Training Institute, 2012).
Pharmaceutical Market, Japan, Population by Age Group (%), 2000–2020
2000 2005 2010 2011 2015 2020
Pop
ulat
ion
(%)
0–14 years 15–64 years
Source: Statistical Research and Training Institute, 2012
The over-XX age group is expected to account for almost XX% of the population in 2020, and XX% by 2060 (National Institute of Population and Social Security Research, 2012). The workforce, comprising those aged XX–XX, started falling in 2000 and is forecast to be XX% in 2020.
These demographic changes will present further challenges to a stagnating economy, which, as the data in this report confirms, is already struggling with reduced economic growth. A diminishing workforce and falling productivity levels will likely add to the economic difficulties Japan is experiencing.
The associated increase in disease burden has also had implications for the healthcare system. Healthcare expenditure has risen, and is set to rise further as the population continues to age.
The ongoing deregulation of the Japanese pharmaceutical industry has made it an attractive market for big pharma

© GBI Research. This is a licensed product and is not to be photocopied GBIHC289MR / Published APR 2013
Page 6
Table of Contents
1 Table of Contents
1 Table of Contents ................................................................................................................................. 6 1.1 List of Tables ............................................................................................................................. 8 1.2 List of Figures............................................................................................................................ 9
2 Introduction........................................................................................................................................11 3 Market Overview ................................................................................................................................12
3.1 Introduction ............................................................................................................................12 3.2 Economic Landscape ................................................................................................................12 3.3 Economic Indicators .................................................................................................................13
3.3.1 Gross Domestic Product....................................................................................................14 3.3.2 GDP Composition by Sector ..............................................................................................17 3.3.3 Consumer Price Index .......................................................................................................18 3.3.4 Unemployment ................................................................................................................20 3.3.5 Exchange Rate .................................................................................................................22 3.3.6 Foreign Direct Investment ................................................................................................23 3.3.7 Trade Balance ..................................................................................................................25 3.3.8 Value of Exports/Imports ..................................................................................................26 3.3.9 Exports and Imports Forecast ...........................................................................................27 3.3.10 Trading Partners ..............................................................................................................28 3.3.11 Government Debt .............................................................................................................29 3.3.12 Gross National Income .....................................................................................................30 3.3.13 Gross National Savings .....................................................................................................33 3.3.14 Labor Force ......................................................................................................................34 3.3.15 Employment.....................................................................................................................36 3.3.16 Current Account Balance ..................................................................................................38 3.3.17 Foreign Exchange Reserves ...............................................................................................39
3.4 Demographic Analysis ..............................................................................................................40 3.4.1 Population .......................................................................................................................40 3.4.2 Population Distribution ....................................................................................................41 3.4.3 Urban-Rural Share............................................................................................................42
3.5 Healthcare ...............................................................................................................................43 3.5.1 Healthcare Expenditure ....................................................................................................43 3.5.2 Public and Private Expenditure .........................................................................................45 3.5.3 Healthcare Infrastructure .................................................................................................48 3.5.4 Alcohol Consumption........................................................................................................51 3.5.5 Tobacco Consumption ......................................................................................................52 3.5.6 Obesity ............................................................................................................................54 3.5.7 Life Expectancy ................................................................................................................55 3.5.8 Leading Causes of Death ..................................................................................................56 3.5.9 Pharmaceutical Expenditure .............................................................................................57 3.5.10 Insurance and Reimbursement .........................................................................................57 3.5.11 Reimbursement Process ...................................................................................................59
3.6 Market Segments.....................................................................................................................60 3.6.1 Generics ...........................................................................................................................60 3.6.2 Over-the-Counter Drugs ...................................................................................................61
4 Industry Characteristics .......................................................................................................................62 4.1 Introduction ............................................................................................................................62 4.2 Pricing Policy ...........................................................................................................................62
4.2.1 Reimbursement Prices for New Drugs ...............................................................................62 4.3 Regulatory Landscape ..............................................................................................................64
4.3.1 Pharmaceutical and Food Safety Bureau ...........................................................................66

© GBI Research. This is a licensed product and is not to be photocopied GBIHC289MR / Published APR 2013
Page 7
Table of Contents
4.3.2 Pharmaceutical and Medical Devices Agency ....................................................................67 4.3.3 New Drug Approval Process ..............................................................................................68 4.3.4 Drug Manufacture ...........................................................................................................70 4.3.5 Clinical Trials – Basic Requirements ..................................................................................70 4.3.6 Advertising.......................................................................................................................70 4.3.7 Licensing ..........................................................................................................................71 4.3.8 Orphan Drugs ..................................................................................................................71
4.4 Pharmaceutical Supply Chain ...................................................................................................72 4.4.1 Leading Companies ..........................................................................................................73
5 Competitive Landscape .......................................................................................................................74 5.1 Introduction ............................................................................................................................74 5.2 Major Domestic Companies .....................................................................................................74
5.2.1 Major Players by Revenue ................................................................................................74 5.2.2 Company Overview ..........................................................................................................75 5.2.3 Takeda.............................................................................................................................75 5.2.4 Product Portfolio ..............................................................................................................75 5.2.5 Research and Development ..............................................................................................76 5.2.6 Otsuka .............................................................................................................................78 5.2.7 Product Portfolio ..............................................................................................................78 5.2.8 Research and Development ..............................................................................................79 5.2.9 Astellas ............................................................................................................................80 5.2.10 Product Portfolio ..............................................................................................................81 5.2.11 Research and Development ..............................................................................................82 5.2.12 Daiichi Sankyo ..................................................................................................................83 5.2.13 Product Portfolio ..............................................................................................................83 5.2.14 Research and Development ..............................................................................................84 5.2.15 Eisai .................................................................................................................................85 5.2.16 Research and Development ..............................................................................................86
5.3 Major Foreign Players ..............................................................................................................87 5.4 Acquisitions and Collaboration .................................................................................................88
5.4.1 M&A ................................................................................................................................88 5.4.2 Licensing Agreements and Co-development Deals .............................................................91
6 Drivers and Barriers ............................................................................................................................94 6.1 Drivers .....................................................................................................................................94
6.1.1 World-Leading Life Expectancy – Increased Disease Burden ...............................................94 6.1.2 Deregulation – Easing of Regulatory Guidelines ................................................................94 6.1.3 Government Initiatives to Prevent Lifestyle Diseases .........................................................94 6.1.4 Continued Growth of the Generics Market ........................................................................94
6.2 Barriers....................................................................................................................................95 6.2.1 Time Lag in Drug Approval Process ...................................................................................95 6.2.2 Political Instability ............................................................................................................95 6.2.3 High Cost of Clinical Trials.................................................................................................95 6.2.4 High Value of the Yen .......................................................................................................95
7 Japan Pharmaceutical Market Outlook – Appendix ..............................................................................96 7.1 Market Definitions ...................................................................................................................96 7.2 Abbreviations ..........................................................................................................................96 7.3 Bibliography ............................................................................................................................97 7.4 Research Methodology ............................................................................................................98 7.5 Coverage .................................................................................................................................98 7.6 Secondary Research .................................................................................................................99 7.7 Competitive Landscape ............................................................................................................99
7.7.1 Expert Panel Validation ....................................................................................................99

© GBI Research. This is a licensed product and is not to be photocopied GBIHC289MR / Published APR 2013
Page 8
Table of Contents
7.8 Contact Us ...............................................................................................................................99 7.9 Disclaimer................................................................................................................................99
1.1 List of Tables
Table 1: Pharmaceutical Market, Japan, Health Insurance, 1922–2008 ..................................................57 Table 2: Pharmaceutical Market, Japan, Insurance and Reimbursement, 2009.......................................58 Table 3: Pharmaceutical Market, Japan, Premium Rates and Requirements, 2012 .................................63 Table 4: Pharmaceutical Market, Japan, Pharmaceutical Supply Chain, Leading Companies, Revenue
($bn), 2012 .............................................................................................................................73 Table 5: Takeda, Japan, Major Product Portfolio, Revenue ($bn), 2011 ..................................................75 Table 6: Takeda, Japan, Product Pipeline, 2012 .....................................................................................76 Table 7: Otsuka, Japan, Major Product Portfolio, Revenue ($m), 2010 ...................................................78 Table 8: Otsuka, Japan, Product Pipeline, 2012 .....................................................................................79 Table 9: Astellas, Japan, Major Product Portfolio, Revenue ($m), 2011 ..................................................81 Table 10: Astellas, Japan, Product Pipeline, 2011 ....................................................................................82 Table 11: Daiichi Sankyo, Japan, R&D Pipeline, Revenue ($bn), 2012 .......................................................83 Table 12: Daiichi Sankyo, Japan, R&D Pipeline, 2012 ...............................................................................84 Table 13: Eisai, Japan, Major Product Portfolio, Revenue ($bn), 2011 ......................................................85 Table 14: Eisai, Japan, Product Pipeline, 2012 .........................................................................................86 Table 15: Pharmaceutical Market, Japan, Licensing Agreements by Company, 2005–2012 .......................92

© GBI Research. This is a licensed product and is not to be photocopied GBIHC289MR / Published APR 2013
Page 9
Table of Contents
1.2 List of Figures
Figure 1: Pharmaceutical Market, Japan, Gross Domestic Product ($tn), 2005–2017 ...............................14 Figure 2: Pharmaceutical Market, Japan, Gross Domestic Product Growth (%), 2005–2017 .....................15 Figure 3: Pharmaceutical Market, Japan, Gross Domestic Product Per Capita ($), 2005–2017 ..................16 Figure 4: Pharmaceutical Market, Japan, Gross Domestic Product by Sector (%), 2011 ............................17 Figure 5: Pharmaceutical Market, Japan, Annual Consumer Price Index, 2005–2017 ...............................18 Figure 6: Pharmaceutical Market, Japan, Average Consumer Price Change (%), 2005–2017.....................19 Figure 7: Pharmaceutical Market, Japan, Unemployment (%), 2005–2017 ..............................................20 Figure 8: Pharmaceutical Market, Japan, Youth Unemployment (%), 2005–2010 ....................................21 Figure 9: Pharmaceutical Market, Japan, Currency Exchange Rate (JPY/$), 2005–2011 ............................22 Figure 10: Pharmaceutical Market, Japan, Foreign Direct Investment Outflows ($bn), 2005–2011.............23 Figure 11: Pharmaceutical Market, Japan, Foreign Direct Investment Inflows ($bn), 2005–2011 ...............24 Figure 12: Pharmaceutical Market, Japan, Trade Balance ($bn), 2005–2011 .............................................25 Figure 13: Pharmaceutical Market, Japan, Exports and Imports ($bn), 2005–2010 ....................................26 Figure 14: Pharmaceutical Market, Japan, Exports and Imports Forecast (%), 2010–2017 .........................27 Figure 15: Pharmaceutical Market, Japan, Exports by Trading Partner (%), 2011 .......................................28 Figure 16: Pharmaceutical Market, Japan, General Government Gross Debt (% of GDP), 2005–2017 .........29 Figure 17: Pharmaceutical Market, Japan, Gross National Income (PPP $tn), 2005–2011 ..........................30 Figure 18: Pharmaceutical Market, Japan, Gross National Income Growth (%), 2005–2010 .......................31 Figure 19: Pharmaceutical Market, Japan, Gross National Income Per Capita (PPP $), 2005–2011 .............32 Figure 20: Pharmaceutical Market, Japan, Gross National Savings (% of GDP), 2005–2017 ........................33 Figure 21: Pharmaceutical Market, Japan, Labor Force (Millions), 2005–2011 ...........................................34 Figure 22: Pharmaceutical Market, Japan, Labor Force by Occupation (%), 2010 .......................................35 Figure 23: Pharmaceutical Market, Japan, Employment to Population Ratio, Age 15+ (%), 2005–2010 ......36 Figure 24: Pharmaceutical Market, Japan, Employment to Population Ratio by Gender, Age 15+ (%), 2005–
2010 .......................................................................................................................................37 Figure 25: Pharmaceutical Market, Japan, Current Account Balance ($bn), 2005–2011 .............................38 Figure 26: Pharmaceutical Market, Japan, Foreign Exchange Reserves ($bn), 2005–2011 ..........................39 Figure 27: Pharmaceutical Market, Japan, Crude Birth and Death Rate (Per 1,000 Population), 2005–2010
...............................................................................................................................................40 Figure 28: Pharmaceutical Market, Japan, Population by Age Group (%), 2000–2020 ................................41 Figure 29: Pharmaceutical Market, Japan, Urban-Rural Share (%), 2005–2010 ..........................................42 Figure 30: Pharmaceutical Market, Japan, Healthcare Expenditure, Percentage of GDP (%), 2005–2010 ....43 Figure 31: Pharmaceutical Market, Japan, Healthcare Expenditure Per Capita ($), 2005–2010 ..................44 Figure 32: Pharmaceutical Market, Japan, Public and Private Expenditure (%), 2005–2010 .......................45 Figure 33: Pharmaceutical Market, Japan, Expenditure as Percentage of Government Expenditure (%),
2005–2010 .............................................................................................................................46 Figure 34: Pharmaceutical Market, Japan, Out-of-Pocket Expenditure (%), 2005–2010 .............................47 Figure 35: Pharmaceutical Market, Japan, Hospital Beds (Per 1,000 Population), 2005–2010 ....................48 Figure 36: Pharmaceutical Market, Japan, Physicians (Per 1,000 Population), 2002–2010 .........................49 Figure 37: Pharmaceutical Market, Japan, Average Hospital Stay (Days), 2005–2010 ................................50 Figure 38: Pharmaceutical Market, Japan, Alcohol Consumption (Liters Per Capita), 2005–2010 ...............51 Figure 39: Pharmaceutical Market, Japan, Tobacco Consumption (%), 2005–2010 ....................................52 Figure 40: Pharmaceutical Market, Japan, Tobacco Consumption by Gender (%), 2005–2010 ...................53 Figure 41: Pharmaceutical Market, Japan, Obesity (%), 2005–2010 ..........................................................54 Figure 42: Pharmaceutical Market, Japan, Life Expectancy at Birth (Years), 2005–2010 .............................55 Figure 43: Pharmaceutical Market, Japan, Death Rate by Leading Causes (Per 100,000 Population), 2011 .56 Figure 44: Pharmaceutical Market, Japan, Financial Source of Healthcare Insurance (%), 2008 ..................59 Figure 45: Pharmaceutical Market, Japan, Generic Market, Volume and Value (%), 2005–2011 .................60 Figure 46: Pharmaceutical Market, Japan, Over-the-Counter Drugs, Revenue Forecast ($bn), 2008–2016 .61 Figure 47: Pharmaceutical Market, Japan, Ministry of Health, Labor and Welfare, Structure, 2012 ............65 Figure 48: Pharmaceutical Market, Japan, Pharmaceutical and Food Safety Bureau, Structure, 2012.........66 Figure 49: Pharmaceutical Market, Japan, Pharmaceutical and Medical Devices Agency, Structure, 2012 ..67 Figure 50: Pharmaceutical Market, Japan, New Drug Approval Process, 2012 ...........................................69 Figure 51: Pharmaceutical Market, Japan, Pharmaceutical Supply Chain. 2012 .........................................72 Figure 52: Pharmaceutical Market, Japan, Major Domestic Companies, Revenue ($bn), 2012 ...................74 Figure 53: Pharmaceutical Market, Japan, M&A, 2005–2012 ....................................................................88 Figure 54: Pharmaceutical Market, Japan, M&A Deals by Country, 2005–2012 .........................................89

© GBI Research. This is a licensed product and is not to be photocopied GBIHC289MR / Published APR 2013
Page 10
Table of Contents
Figure 55: Pharmaceutical Market, Japan, M&A, Aggregate Deal Value ($bn), 2005–2012 ........................90 Figure 56: Pharmaceutical Market, Japan, Licensing Agreements and Co-development Deals, 2005–2012.91 Figure 57: Pharmaceutical Market, Japan, Licensing Agreements and Co-development Deals, 2005–2012.92

© GBI Research. This is a licensed product and is not to be photocopied GBIHC289MR / Published APR 2013
Page 11
Introduction
2 Introduction
The Japanese economy has faced a number of difficulties since the recession in the early 1990s, the most troubling of which include periods of deflation, a high level of public debt, a strong yen and reduced demand for its exports. The earthquake, tsunami and subsequent nuclear crisis have added to Japan’s economic woes.
Japan’s pharmaceutical industry is the second largest in the world, worth $XX billion in 2011 or XX% of the world market. The industry grew from $XX billion in 2005 to its current value at a Compound Annual Growth Rate (CAGR) of XX%.
Growth of the domestic pharmaceutical industry has recently been hampered by biennial drug price reductions, which are expected to continue as the government attempts to cut healthcare expenditure. Price reviews are also constrained by a national health budget, which limits the increase of drug prices. In addition, the gradual increase in market share and competition from generics has depressed market value and will continue to do so as government policy promotes their use.
However, easing of regulatory guidelines, an aging population and a strong product pipeline will provide a strong impetus for growth in the pharmaceutical industry. Although the increasing market share of generics may dampen market value, this represents a great deal of opportunity for generic manufacturers. Indeed, multinational generic producers have invested significantly in the Japanese generic market. Teva, for example, bought out its Japanese joint venture partner in 2011, as it sees potential for growth in Japan.
Historically, the Japanese pharmaceutical market has favored domestic companies. However, since the 1990s, deregulation has promoted investment from abroad and increased the presence of foreign firms. An overview of the regulatory landscape, including some of the changes recently applied, is included in this report.
The industry consists of some highly competitive Japanese companies, such as Takeda, Daiichi Sankyo and Eisai, who produce market-leading products. Like the entire pharmaceutical industry, Japanese companies are contending with patent expirations. In response, many companies have completed M&A and licensing agreements in order to enhance product pipelines and maintain growth.
Japan’s pharmaceutical industry is the second largest in the world, worth $XX billion in 2011 and accounts for about XX% of the world market

© GBI Research. This is a licensed product and is not to be photocopied GBIHC289MR / Published APR 2013
Page 14
Market Overview
3.3 Economic Indicators
3.3.1 Gross Domestic Product
Japan’s GDP in 2011 was $XX trillion, placing it third in the world behind the US and China. In nominal GDP terms, Japan was overtaken by China in 2011 as the second biggest economy.
Measured using the Purchasing Power Parity (PPP) basis, which adjusts for price differences and inflation rates, Japan’s economy was worth $XX trillion in 2011, when it was overtaken by India and slipped down to fourth in the world.
The following figure gives Japan’s GDP figures from 2005–2012, as well as forecast data to 2017.
Figure 1: Pharmaceutical Market, Japan, Gross Domestic Product ($tn), 2005–2017
2005 2006 2007 2008 2009 2010 2011 2012 2013 2014 2015 2016 2017
GD
P ($
tn)
Source: The World Bank, 2012; IMF, 2012

© GBI Research. This is a licensed product and is not to be photocopied GBIHC289MR / Published APR 2013
Page 17
Market Overview
3.3.2 GDP Composition by Sector
Figure 4 gives the percentage contribution of industry, services and agriculture to GDP. Services, which include finance and other economic activities that do not produce goods, contributed the most (XX%), followed by industry (XX%) and agriculture (XX%).
Figure 4: Pharmaceutical Market, Japan, Gross Domestic Product by Sector (%), 2011
Services
Industry
Agriculture
Source: The World Bank, 2012
Japan’s major industries include the car industry, electronics, machine tools, and metal production. The car and electronic industries in particular include some of the best-known brands in the world.
Japan’s agriculture sector is small in comparison to industry and services. However, the relatively small amount of resources available are well-utilized, meaning Japan is self-sufficient in the production of fish and rice, but relies on imports of other food products such as wheat.

© GBI Research. This is a licensed product and is not to be photocopied GBIHC289MR / Published APR 2013
Page 96
Japan Pharmaceutical Market Outlook – Appendix
7 Japan Pharmaceutical Market Outlook – Appendix
7.1 Market Definitions
7.2 Abbreviations
ADR Adverse Drug Reaction
BOJ Bank of Japan
CAGR Compound Annual Growth Rate
CPI Consumer Price Index
FDI Foreign Direct Investment
GCP Good Clinical Practice
GDP Gross Domestic Product
GLP Good Laboratory Practice
GMP Good Manufacturing Practice
GNI Gross National Income
HI Health Insurance
IMF International Monetary Fund
JPMA Japan Pharmaceutical Manufacturers Association
JPWA Japan Pharmaceutical Wholesalers Association
JSMI Japan Self-Medication Industry
MHLW Ministry of Health, Labor and Welfare
NHI National Health Insurance
OECD Organization for Economic Co-operation and Development
PAL Pharmaceutical Affairs Law
PFSB Pharmaceutical Food and Safety Bureau
PMDA Pharmaceuticals and Medical Devices Agency
PMS Post-Marketing Surveillance
PPP Purchasing Power Parity
© GBI Research. This is a licensed product and is not to be photocopied GBIHC289MR / Published APR 2013
Page 97
Japan Pharmaceutical Market Outlook – Appendix
7.3 Bibliography
Central Intelligence Agency (2012). The World Factbook. Japan. Available from: https://www.cia.gov/library/publications/the-world-factbook/geos/ja.html. [Accessed October 12, 2012].
Fujioka T (2012). “BOJ Follows Fed to Bolster Stimulus as Growth Falters”, Bloomberg, September 19, 2012. Available from: http://www.bloomberg.com/news/2012-09-19/boj-follows-fed-to-bolster-stimulus-as-economic-recovery-falters.html. [Accessed September 24, 2012].
Higuchi S, et al. (2006). Drinking practices, alcohol policy and prevention programs in Japan. International Journal of Drug Policy; 17(4): 358–366.
Hirai Y, et al. (2012). Delays in New Drug Applications in Japan and Industrial R&D Strategies. Clinical Pharmacology & Therapeutics; 87(2): 212–8.
IMF (2012). World Economic Outlook Database [database]. Available from: http://www.imf.org/external/pubs/ft/weo/2012/01/weodata/index.aspx. [Accessed October 3, 2012].
JSMI (2011). Country Profile of Japan. Available from: http://www.jsmi.jp/english/profile/index.html. [Accessed November 19, 2012].
JPMA (2012). Pharmaceutical Administration and Regulations in Japan, 2012. Available from: http://www.jpma.or.jp/english/parj/pdf/2012.pdf.
JETRO (2009). JETRO Seminar in India: Investment Opportunities – Japanese Pharmaceutical Market "Case Studies of Alliances and M&As between India and Japan”. Available from: http://www.jetro.go.jp/en/news/announcement/20091106617-news. [Accessed November 2, 2012].
Kobayashi Y (2009). Five Decades of Universal Health Insurance Coverage in Japan: Lessons and future challenges. Japanese Association of Medical Sciences; 52(4): 263–268.
Matsuo D (2009). Effect of Amendment to Japan’s Pharmaceutical Affairs Law. NRI Papers; 149.
MHLW (2012a). Pamphlet About MHLW, 2011. Available from: http://www.mhlw.go.jp/english/org/pamphlet/dl/pamphlet-about_mhlw.pdf.
MHLW (2012b). Promotion of the Use of Generic Drugs. Available from: http://www.mhlw.go.jp/english/policy_report/2012/09/120921.html. [Accessed November 19, 2012].
MHLW (2012c). Summary of Vital Statistics, 2011. Available from: http://www.mhlw.go.jp/english/database/db-hw/populate/index.html. [Accessed October 14, 2012].
Statistical Research and Training Institute (ed) (2012). Statistical Handbook of Japan. Statistics Bureau, Ministry of Internal Affairs and Communications. Available from: http://www.stat.go.jp/english/data/handbook/index.htm. [Accessed October 1, 2012].
Mizuho Central Bank Research Division (2012). Japan Industry Outlook (Pharmaceuticals), 2012. Available from: http://www.mizuhocbk.com/fin_info/industry/pdf/1038_07.pdf.
National Institute of Population and Social Security Research (2012). Summary of the Japanese Population Projection. Available from: http://www.ipss.go.jp/pp-newest/e/ppfj02/suikei_g_e.html. [Accessed October 12, 2012].
Obe M (2013). “Japan’s Exports Set to Recover, Forecast Says”, The Wall Street Journal, February 19, 2013. Available from: http://online.wsj.com/article/SB10001424127887323495104578313732001550060.html. [Accessed March 21, 2013].
OECD (2011). Health at a Glance 2011: OECD Indicators. OECD Publishing. Available from: http://www.oecd.org/health/healthpoliciesanddata/49105858.pdf. [Accessed October 10, 2012].
OECD (2012a). OECD iLibrary. Stat Extracts [database]. Available from: http://www.oecd-ilibrary.org/statistics. [Accessed October 19, 2012].
OECD (2012b). FDI Statistics [database]. Available from: http://www.oecd.org/investment/statistics.htm. [Accessed October 19, 2012].

© GBI Research. This is a licensed product and is not to be photocopied GBIHC289MR / Published APR 2013
Page 98
Japan Pharmaceutical Market Outlook – Appendix
Shimazawa R and Ikeda M (2011). Japan Lags Behind the UK in Neurological Drug Approvals. British Journal of Clinical Pharmacology; 71(3): 473–475.
Takahashi K, et al. (2007). Analysis on Productivity of Clinical Studies Across Asian Countries – a Case Comparison. Drug Discoveries & Therapeutics; 1(1): 4–8.
Thomson Reuters (2009). The Japanese Generic Drug Market: Opportunities and Strategies for Success. Available from: http://thomsonreuters.com/content/science/pdf/ls/newport-japanese-generics.pdf.
The Economist (2012). “The dearth of births”, The Economist, November 18, 2010. Available from: http://www.economist.com/node/17492838. [Accessed September 28, 2012].
Federation of Japan Pharmaceutical Wholesalers Association (2012). JPWA Guidebook, 2010-2011. Available from: http://www.jpwa.or.jp/jpwa/index-e.html. [Accessed October 15, 2012].
The World Bank (2012). Japan. Available from: http://data.worldbank.org/country/japan. [Accessed September 29th, 2012].
UN Statistics Division (2012). Demographic and Social Statistics [database]. Available from: http://unstats.un.org/unsd/demographic/default.htm. [Accessed October 1, 2012].
United Nations Conference on Trade and Development. World Investment Report, 2007. Available from: http://unctad.org/en/Docs/wir2007_en.pdf.
Yonemori K, et al. (2011). The Notorious “Drug Lag” For Oncology Drugs in Japan. Investigational New Drugs; 29(4): 706–12.
7.4 Research Methodology
GBI Research’s dedicated research and analysis teams consist of experienced professionals with marketing, market research and consulting backgrounds in the pharmaceutical industry as well as advanced statistical expertise.
GBI Research adheres to the codes of practice of the Market Research Society (www.mrs.org.uk) and the Strategic and Competitive Intelligence Professionals (www.scip.org).
All GBI Research databases are continuously updated and revised.
7.5 Coverage
The objective of updating GBI Research coverage is to ensure that it represents the most up to date vision of the industry possible.
Changes to the industry taxonomy are built on the basis of extensive research of company, association and competitor sources.
Company coverage is based on three key factors: market capitalization, revenues and media attention/innovation/market potential.
An exhaustive search of 56 member exchanges is conducted and companies are prioritized on the basis of their market capitalization.
The estimated revenues of all major companies, including private and governmental, are gathered and used to prioritize coverage.
Companies which are making the news, or which are of particular interest due to their innovative approach, are prioritized.
GBI Research aims to cover all major news events and deals in the pharmaceutical industry, updated on a daily basis.
The coverage is further streamlined and strengthened with additional inputs from GBI Research’s expert panel (see below).

© GBI Research. This is a licensed product and is not to be photocopied GBIHC289MR / Published APR 2013
Page 99
Japan Pharmaceutical Market Outlook – Appendix
7.6 Secondary Research
The research process begins with exhaustive secondary research on internal and external sources being carried out to source qualitative and quantitative information relating to each market.
The secondary research sources that are typically referred to include, but are not limited to:
Company websites, annual reports, financial reports, broker reports, investor presentations and SEC Filings
Industry trade journals, scientific journals and other technical literature
Internal and external proprietary databases
Relevant patent and regulatory databases
National government documents, statistical databases and market reports;
Procedure registries
News articles, press releases and web-casts specific to the companies operating in the market
7.7 Competitive Landscape
Profiles of leading players are provided. An analysis of strengths, weaknesses, opportunities and threats of each company with is also listed.
GBI Research aims to cover all major M&A, licensing deals and co-development deals related to the market. This section is sourced from the companies’ websites, company annual reports and internal databases.
7.7.1 Expert Panel Validation
GBI Research uses a panel of experts to cross verify its databases and forecasts.
GBI Research expert panel comprises marketing managers, product specialists, international sales managers from pharmaceutical companies, academics from research universities and key opinion leaders from hospitals.
Historic data and forecasts are relayed to GBI Research’s expert panel for feedback and are adjusted in accordance with their feedback.
7.9 Disclaimer
All Rights Reserved.
No part of this publication may be reproduced, stored in a retrieval system or transmitted in any form by any means, electronic, mechanical, photocopying, recording or otherwise, without the prior permission of the publisher, GBI Research.