january-september 2016 results€¦ · · 2016-10-25results 3q 2016 2 table of contents 1.-...
TRANSCRIPT
January-September 2016 Results
25 October 2016

RESULTS 3Q 2016
2
TABLE OF CONTENTS
1.- Summary 2.- Financial Highlights 3.- Operational Highlights 4.- Consolidated Income Statement 5.- Consolidated Balance Sheet 6.- Financial Structure 7.- Commercial Property 8.- Land and Homebuilding (Residential) 9.- Stock Data
RESULTS 3Q 2016
3
1.- SUMMARY
REVENUE AND RESULTS
Total revenue in 3Q 2016 was €71,7m, 1% lower than in 3Q 2015. Even though income in the Residential business has reached €+2,1m, income in the Commercial Property business has gone down (€-1,1m) due to the office building “Los Cubos” being vacant.
EBITDA has reached €30,2m vs €30,5m in 3Q 2015.
As of 30 September 2016, Earnings before taxes reached €97,1m and Net result (Group share) was €89,2m. This result reflects the following extraordinary impacts:
1. As of 30 September 2016, an independent asset valuation of the Residential business concluded with its lesser value, €61,4m. Provisions for an amount of €1,1m were made against Finished residential product and an amount of €44,6m against the land value (land bank and land with residential developments under construction).
2. Variation on the fair value of property investments reached €9,3m.
3. A positive result of €113m is due to haircuts on the Residential debt (€72m) and on the Equity loan acquired by Inversora Carso from Sareb (€41m).
4. The impossibility of recovering a debt related to a land sale has been recognized (the debtor is insolvent). Provisions for an amount of €5,5m were made.
Recurrent Net Result (Group share) reaches €17,6m vs €8,8m in 3Q 2015.
INDEBTNESS
Realia has reduced its gross financial debt by €812m, reaching €941m, 46% lower than in 3Q 2015 (Equity loan for an amount of 60 million Euros acquired to Sareb plus bank interests for 1 million Euros, to make data comparable, were included in 2015)
Haircuts have favoured a positive net financial result of €107,5m. If haircuts wouldn’t apply, financial cost would reach €-5,5m vs €-15,2m in 3Q 2015.
As of 30 September 2016, Realia has a net financial debt of €900m, 20% lower than in September 2015 and €41m in cash and equivalents.
COMMERCIAL PROPERTY
Gross rental income (rents, expenses, fixed assets sale and others) amounted €55,9m, 6% lower than the previous year. It is mainly due to the office building “Los Cubos” being vacant, under refurbishment at present. This situation has reduced rents by 4,1 million euros a year (1 million Euros a trimester).
In homogeneous terms, overall occupancy levels reached 92,3% vs 90,8% in 2015.
LAND AND HOMEBUILDING
Realia has delivered 69 units for a total amount of €13,4m, 19% higher than in 2015 (€11,3m).
As of 30 September, there is a stock of 515 units (homes, small retail and offices) finished non-delivered (12 pre-sold). There are also 57 land plots for single-family housing for sale in a development.
Realia land bank has a buildable area of 1.850.914 sqm.

RESULTS 3Q 2016
4
2.- FINANCIAL HIGHLIGHTS
(€mm) 3Q 2016 3Q 2015 Var. (%)
Total Revenue 71,7 72,2 -1
Rental Income 43,6 47,5 -8
EBITDA 30,2 30,5 -1
Net Result (Group share) 89,2 18,4 384
Net Financial Debt 900 1.130 -20
Nº Shares (mm) 460,8 307,4 50
Earnings per Share (€) 0,194 0,060 223
3.- OPERATIONAL HIGHLIGHTS
3Q 2016 3Q 2015 Var. (%)
Commercial Property
GLA (sqm) 404.807 418.856 -3
Occupancy rate (%) 92,3 90,8 2
Land & Homebuilding
Pre-sales
Total value of contracts (€mm) 13,4 11,3 19
Units 69 60 15
Land Bank Consolidated (sqm) 1.850.914 1.870.289 -1
Nº Employees 94 100 -6
Number of Employees 30/09/2016 30/09/2015 Var. (%)
Total (*) 94 100 -6
Realia Business 42 48 -13
Realia Patrimonio 4 4 0
Hermanos Revilla (*) 47 47 0
Realia Polska 1 1 0
(*) It includes 36 people working on reception and concierge service in buildings
RESULTS 3Q 2016
5
4.- CONSOLIDATED INCOME STATEMENT
(€mm) 3Q 2016 3Q 2015 Var. (%)
Total Revenue 71,7 72,2 -1
Rents 43,6 47,5 -8
Expenses provision 11,7 11,7 -1
Sale of assets 0,4 0,1 340
Homebuilding 13,4 11,3 19
Land sales 0,9 0,0
Other 1,6 1,6 6
Total Gross Margin 36,2 38,2 -5
Rents 37,8 41,1 -8
Homebuilding -1,6 -2,9 44
Overheads -5,9 -7,0 15
Other costs -0,1 -0,7 86
EBITDA 30,2 30,5 -1
Amortization -0,3 -0,4 17
Depreciation -48,5 4,3 -1.223
EBIT -18,6 34,4 -154
Fair value appraisal result 9,3 13,4 -31
Financial result 107,5 -15,2 809
Equity method -1,0 2,1 -150
Earnings before taxes 97,1 34,7 180
Taxes -3,7 -9,1 59
Results after taxes 93,4 25,6 264
Minority Interests 4,2 7,2 -41
Net Results (Group share) 89,2 18,4 384
Recurrent Net Results (Group share) 17,6 8,8 100
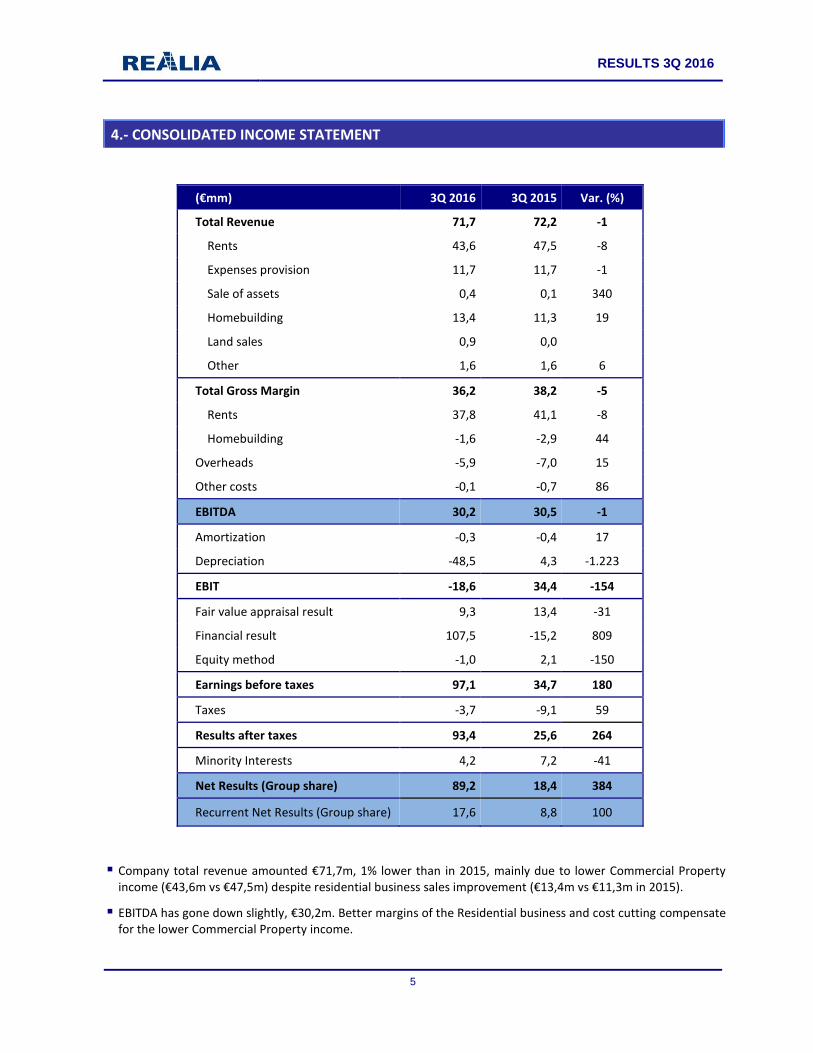
Company total revenue amounted €71,7m, 1% lower than in 2015, mainly due to lower Commercial Property income (€43,6m vs €47,5m) despite residential business sales improvement (€13,4m vs €11,3m in 2015).
EBITDA has gone down slightly, €30,2m. Better margins of the Residential business and cost cutting compensate for the lower Commercial Property income.
RESULTS 3Q 2016
6
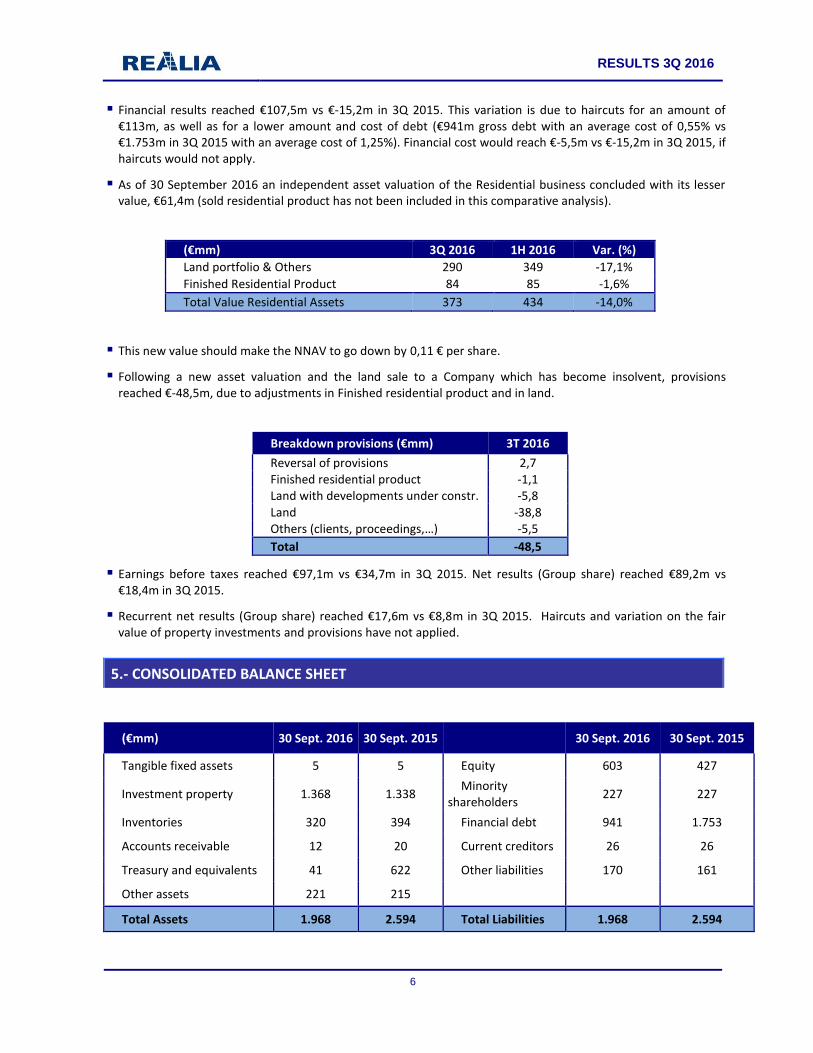
Financial results reached €107,5m vs €-15,2m in 3Q 2015. This variation is due to haircuts for an amount of €113m, as well as for a lower amount and cost of debt (€941m gross debt with an average cost of 0,55% vs €1.753m in 3Q 2015 with an average cost of 1,25%). Financial cost would reach €-5,5m vs €-15,2m in 3Q 2015, if haircuts would not apply.
As of 30 September 2016 an independent asset valuation of the Residential business concluded with its lesser value, €61,4m (sold residential product has not been included in this comparative analysis).
(€mm) 3Q 2016 1H 2016 Var. (%)
Land portfolio & Others 290 349 -17,1%
Finished Residential Product 84 85 -1,6%
Total Value Residential Assets 373 434 -14,0%
This new value should make the NNAV to go down by 0,11 € per share.
Following a new asset valuation and the land sale to a Company which has become insolvent, provisions reached €-48,5m, due to adjustments in Finished residential product and in land.
Breakdown provisions (€mm) 3T 2016
Reversal of provisions 2,7 Finished residential product -1,1 Land with developments under constr. -5,8
Land -38,8 Others (clients, proceedings,…) -5,5
Total -48,5
Earnings before taxes reached €97,1m vs €34,7m in 3Q 2015. Net results (Group share) reached €89,2m vs €18,4m in 3Q 2015.
Recurrent net results (Group share) reached €17,6m vs €8,8m in 3Q 2015. Haircuts and variation on the fair value of property investments and provisions have not applied.
5.- CONSOLIDATED BALANCE SHEET
(€mm) 30 Sept. 2016 30 Sept. 2015 30 Sept. 2016 30 Sept. 2015
Tangible fixed assets 5 5 Equity 603 427
Investment property 1.368 1.338 Minority
shareholders 227 227
Inventories 320 394 Financial debt 941 1.753
Accounts receivable 12 20 Current creditors 26 26
Treasury and equivalents 41 622 Other liabilities 170 161
Other assets 221 215
Total Assets 1.968 2.594 Total Liabilities 1.968 2.594
RESULTS 3Q 2016
7
6.- FINANCIAL STRUCTURE
REALIA Patrimonio
REALIA Business 3Q 2016
3Q 2015
Var. (%)
Commercial Property
Land & Homebuilding
Syndicated loans 678
678
1.682
-60
Other loans 54
210
264
72
268
Interests 0
0
1
1
-62
Debt formalisation expenses -1
-0
-1
-3
44
Total Gross Financial Debt 731
210
941
1.753
-46
Cash and equivalents 31
10
41
622
-93
Total Net Financial Debt 700
200
900
1.130
-20
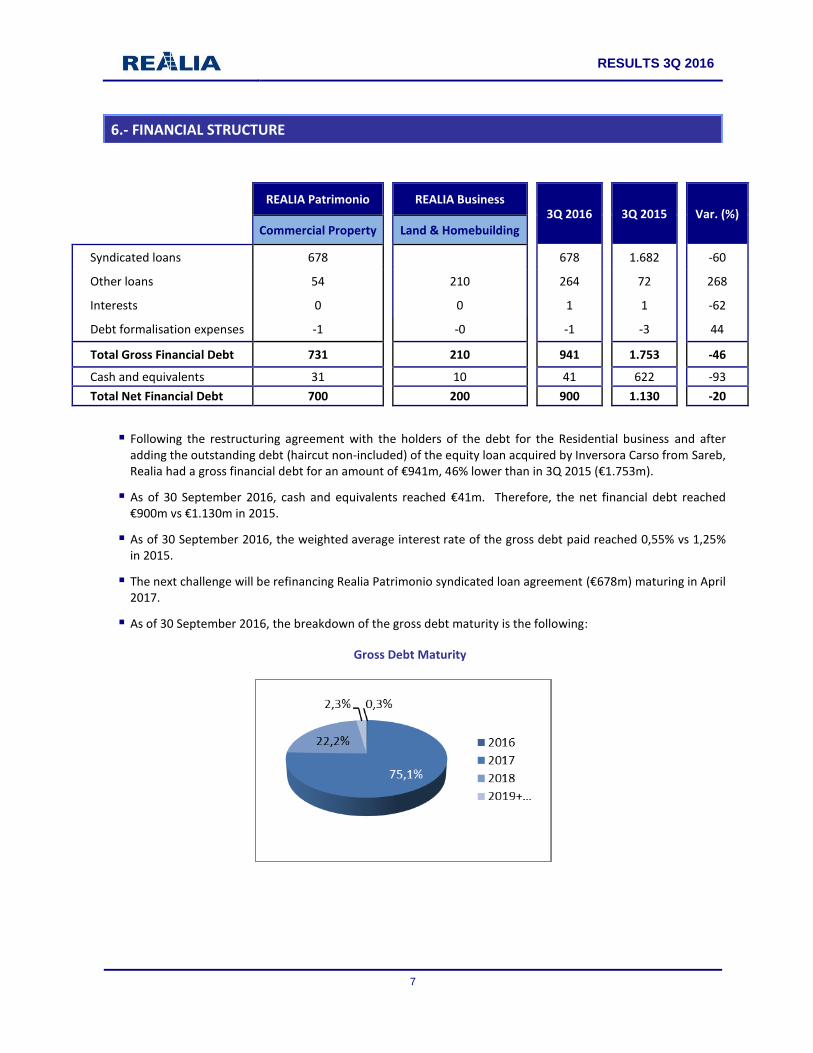
Following the restructuring agreement with the holders of the debt for the Residential business and after adding the outstanding debt (haircut non-included) of the equity loan acquired by Inversora Carso from Sareb, Realia had a gross financial debt for an amount of €941m, 46% lower than in 3Q 2015 (€1.753m).
As of 30 September 2016, cash and equivalents reached €41m. Therefore, the net financial debt reached €900m vs €1.130m in 2015.
As of 30 September 2016, the weighted average interest rate of the gross debt paid reached 0,55% vs 1,25% in 2015.
The next challenge will be refinancing Realia Patrimonio syndicated loan agreement (€678m) maturing in April 2017.
As of 30 September 2016, the breakdown of the gross debt maturity is the following:
Gross Debt Maturity

RESULTS 3Q 2016
8
7.- COMMERCIAL PROPERTY
Rents (1)
(Thousands of Euros) 3Q 2016 3Q 2015 Var. (%)
Rental income 47.143 50.863 -7,3%
Expenses 13.045 13.047 0,0%
Total Revenue 60.187 63.909 -5,8%
As Cancelas (50%) + self-consumption 4.917 4.709 4,4%
IAS revenue 55.270 59.200 -6,6%
Expenses incurred -16.999 -16.954 -0,3%
% Expenses incurred -77% -77% 0,3%
Other Expenses -3.227 -3.658 11,8%
Gross Margin 39.962 43.297 -7,7%
Margin As Cancelas (50%) + self-consumption 2.172 2.217 -2,0%
IAS Margin 37.790 41.080 -8,0%
Margin (%) 84,8% 85,1% -0,4%
(1) These figures are operating data of the business. The data of As Cancelas appear proportionally (50%)
Total IAS Rental income (including expenses charged to tenants) reached €55,3m. It has decreased by 6,6% due to a loss of income for the office building “Los Cubos” being vacant (one million Euros a trimester).
Commercial Property Gross IAS margin reached €37,8m, which means a margin on rents of 84,8%.
In homogeneous terms, rental income remains virtually unchanged. Office building “Los Cubos” non-included (as the following charts show).
Rental income (LfL)(2)
Breakdown of rents by sector (homogeneous surfaces)
(Thousands of Euros) 3Q 2016 3Q 2015 Var. (%) GLA (sqm) Ocup. 3Q 2016
(%) Ocup. 3Q 2015 (%)
Offices 31.830 31.805 0,1% 226.184 93,5% 90,0%
CBD 15.715 15.822 -0,7% 84.409 95,5% 90,2%
BD 5.715 6.232 -8,3% 42.123 95,1% 95,1%
Periphery 10.400 9.751 6,7% 99.652 91,2% 86,8%
Retails & Leisure 12.830 12.594 1,9% 135.366 88,0% 89,4%
Other 2.483 2.398 3,6% 43.257 99,8% 100,0%
Total Revenue 47.142 46.796 0,7% 404.807 92,3% 90,8% (2) Homogeneous surfaces (the office building “Los Cubos” being vacant and under refurbishment is not included in this chart

RESULTS 3Q 2016
9
Breakdown of rents by geographical area (homogeneous surfaces)
(Thousands of Euros) 3Q 2016 3Q 2015 Var. (%) GLA (sqm) Ocup. 3Q 2016
(%) Ocup. 3Q 2015 (%)
Madrid 34.038 34.594 -1,6% 249.285 93,8% 92,4%
CBD 16.209 16.334 -0,8% 79.553 96,7% 91,0%
BD 7.052 7.569 -6,8% 49.365 95,8% 95,6%
Periferia 10.777 10.691 0,8% 120.367 91,0% 91,5%
Barcelona 3.452 3.048 13,2% 32.321 92,9% 83,5%
Other 9.653 9.154 5,5% 123.201 89,3% 89,1%
Total Revenue 47.142 46.796 0,7% 404.807 92,3% 90,8%
(2) Homogeneous surfaces (the office building “Los Cubos” being vacant and in refurbishment is not included in this chart
In homogeneous terms, office rental income stays stable. Occupancy reaches 93,5% vs 90% in 3Q 2015.
Office rental has improved in Barcelona, due to an increase in rents and occupancy of Torre Realia BCN (92,9% vs 83,5% in 3Q 2015). This improvement is due to commercial efforts and, mainly, to the arrival of a new tenant in July (3.059 sqm).
Office occupancy has gone up in Madrid CBD reaching 96,7% and it has stayed stable in the remaining offices. As a whole, office rents have gone down by 1,6%. The arrival of new tenants and contracts renegotiations in the following locations: Alfonso XII, Salvador de Madariaga, Acanto 22, Goya 6, Goya 8 and Torre Realia have caused rents to go down in Madrid CBD and mainly in BD.
Retail & Leisure rental income has gone up by 1,9% even though occupation has gone down by 1,4%. It is mainly due to contract renegotiations in Ferial Plaza and As Cancelas shopping centres.
RESULTS 3Q 2016
10
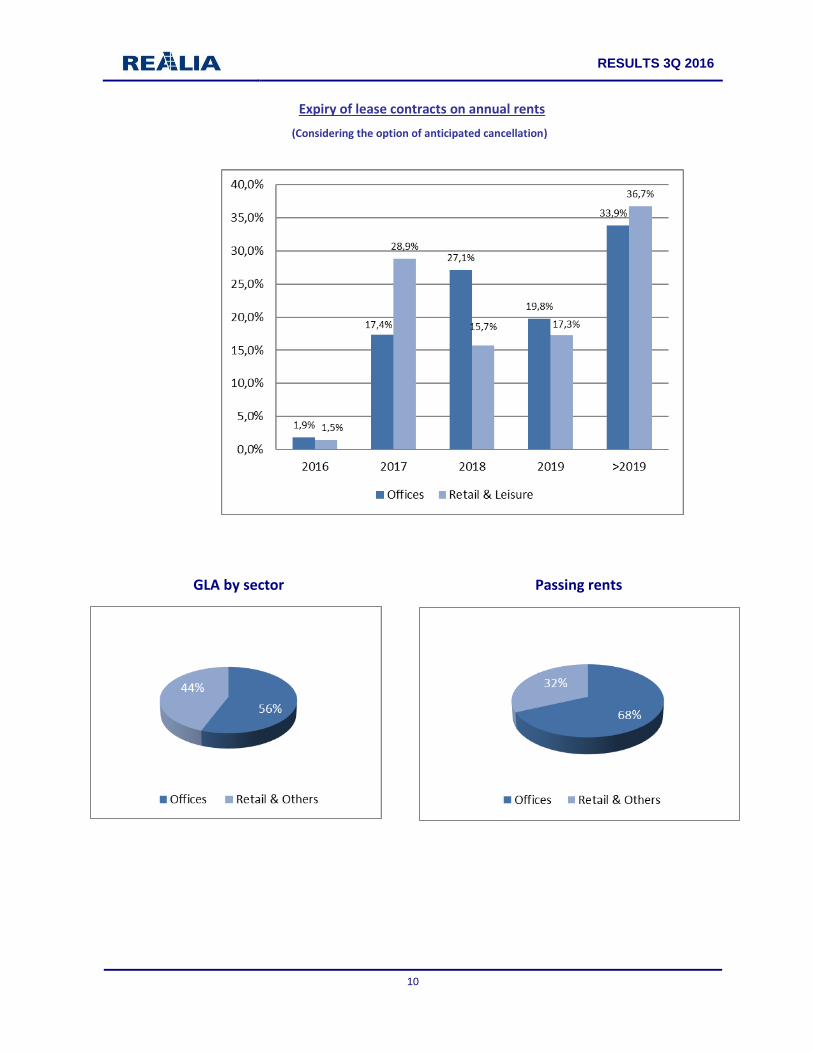
Expiry of lease contracts on annual rents
(Considering the option of anticipated cancellation)
GLA by sector Passing rents

RESULTS 3Q 2016
11
8.- LAND AND HOMEBUILDING (RESIDENTIAL)
(€mm) 3Q 2016 3Q 2015 Var. (%)
Revenues
Homebuilding 13,4 11,3 19
Land sales & Others 2,3 1,4 64
Total Revenues 15,7 12,7 23
Costs
Sale costs -14,6 -12,9 -13
Other costs -2,8 -2,7 -2
Total Costs -17,4 -15,7 -11
Homebuilding Margin -1,6 -2,9 45
Homebuilding Margin (%) -10% -23% 55
Reversal of provisions Res. Fin Prod. 2,6 3,4 -24
MargIn (discounting provisions) 1,0 0,5 111
Residential portfolio
Revenue from the Land & Homebuilding business amounted €15,7m, 23% higher than last year.
Gross margin reaches €-1,6m but it has improved by 55% reaching -10%. Once deducted the reversal of provisions in Finished residential product, the Residential business has reached 1 million Euros vs 0,5 million Euros in 2015.
Deliveries Nr Units Revenue MM €
Madrid/Centro 39 8,2
Levante 11 2,7
Catalonia 10 1,5
Andalusia 8 0,9
Poland 1 0,1
Total 69 13,4

RESULTS 3Q 2016
12
Home stock evolution 3Q 2016 3Q 2015 Var. (%)
Pre-sales
Number of units 71 55 29%
Total value of contracts (€MM) 14,3 10,6 35%
Deliveries
Number of homes 69 60 15%
Total value of contracts (€MM) 13,4 11,3 19%
Stock at eoP
Number of units 560 644 -13%
In this period, Realia has delivered 69 units (homes, small retail and offices) for an amount of €13,4m vs 60 units delivered in 2015 for an amount of €11,3m. Deliveries have gone up by 19% .
71 deposit agreements were signed for an amount of €14,3m vs €10,6m in 3Q 2015, 29% more than the previous year.
As of September 2016, Realia has a total stock of 515 units (homes, small retail and offices) finished non-delivered, of which 12 are pre-sold and 503 are for sale (141 in Madrid and Centre area, 190 in Andalusia, 97 in Levante, 58 in Catalonia, 14 in Portugal and 3 in Poland).
There are also 57 plots for single-family housing for sale in a development (30 in Catalonia and 27 in Andalusia).
The homes breakdown is the following: 77,1% first homes and 22,9% second homes.

RESULTS 3Q 2016
13
9.- STOCK DATA
The closing data price (€ per share) has been 0,97 Euro. It increased by 27,63% vs 2015. IBEX 35 has performed -8,01% and EPRA (European Real Estate Companies) has gone down by -4,49%.
30 Sept. 2016
Closing stock price (€ per share) 0,970
Market cap. EoP (€) 446.928.856
High of the period (€ per share) 1,165
Low of the period (€ per share) 0,640
Average market Price (€ per share) 0,913
Daily trading volume (€) 370.246
Daily trading volumen (shares) 336.769
Contact details
Tel: +34 91 353 44 09
E-mail: [email protected] / [email protected]

RESULTS 3Q 2016
14
LEGAL DISCLOSURE
This document has been produced by Realia Business, S.A. (the “Company”), exclusively to be used during the presentation of the Company results.
The accounting statements contained in this document have not been verified by independent third parties. Therefore, neither implicitly nor explicitly, a guarantee is given on the impartiality, accuracy, completeness or correction of the information and assertions herein expressed.
Neither the Company nor its consultants and representatives accept any liability whatsoever, for negligence or otherwise, for damages or losses derived from the use of this document and the information contained herein.
This document is neither an offer nor an invitation to acquire or subscribe shares, in accordance with provisions of Spain’s Royal Decree-Law 4/2015 of 23 October, where the revised text of the Securities Market Law was approved, Royal Decree-Law 5/2005 of 11 March, and/or Royal Decree 1310/2005 of 4 November and their implementing regulations.
Additionally, this document is neither an offer to buy nor a request to buy, sell or exchange shares, nor is it a request for any kind of vote or approval in any other jurisdiction.
Neither this document nor any part of it is contractual, nor can it be used or construed as a contract or any other type of commitment.