january 2021 - rtpi
TRANSCRIPT

rtpi.org.uk
Registered charity number: 262865
Scottish registered charity number: SC 037841
RTPI
Research
Paper
JANUARY 2021
MAY 2018
Methodological Appendix
NET ZERO TRANSPORT

The Royal Town Planning Institute (RTPI)
The RTPI champions the power of planning in creating prosperous places and vibrant
communities. We have over 25,000 members in the private, public, academic and voluntary
sectors.
Using our expertise and research we bring evidence and thought leadership to shape
planning policies and thinking, putting the profession at the heart of society's big debates.
We set the standards of planning education and professional behaviour that give our
members, wherever they work in the world, a unique ability to meet complex economic,
social and environmental challenges. We are the only body in the United Kingdom that
confers Chartered status to planners, the highest professional qualification sought after by
employers in both private and public sectors.
About this paper
This is the Methodological Appendix to the research paper Net Zero Transport: the role of
spatial planning and place-based solutions, which was carried out by a research
consortium led by LDA Design with City Science and Vectos.
Contents 1. Modelling carbon ......................................................................................................... 4
1.1. Use of Data and Carbon Tool in this Study ........................................................... 5
2. Summary of interventions considered .................................................................... 19
2.1. Substitute Trips .................................................................................................... 19
2.2. Shift Modes .......................................................................................................... 23
2.3. Switch Fuels ......................................................................................................... 33
3. Assumptions and targets used in carbon modelling of pathways for each place typology ..................................................................................................................... 34
References ................................................................................................................. 36

4
Net zero transport: methodological appendix
1. Modelling carbon Human settlements are naturally open systems with no fixed boundary. This is especially true for
transport emissions which derive from the flows of people and goods, often between settlements.
Many of these flows can occur cross traditional administrative boundaries or even country borders.
Defining an approach to accounting for GHG emissions therefore presents a series of challenges.
In particular, there are three common methodological challenges that need to be considered in
determining an appropriate approach:
System Boundary Problem (Box 1): People come and go with settlements changing over
the long-term and even at different times of the day. Estimates of GHG emissions can
therefore vary significantly depending on the choice of system boundary applied. One of
the key challenges therefore is in defining and delineating the exact boundaries of
settlements.
Accounting Scope (Box 2): Once a settlement boundary has been chosen, the emissions
associated with the settlement do not all take place within that boundary. This is particularly
the case with transport where residents create activity that generates GHG emissions
beyond the settlement’s own boundary, while the region itself acts as attractor for other
GHG-generating activities such as employment, commerce or use of energy produced
elsewhere. The accounting scope is commonly referred to by the terminology – Scope 1,
Scope 2 and Scope 3.
Calculation Method: Significant differences can result from the choice of calculation
method. Differences could result, for example, from simple choices such as the difference
between a top-down allocation of terrestrial carbon emissions vs. a bottom-up approach to
emissions calculations. Different modelling approaches will also yield different results.
Other differences include emissions factors used, methods for infilling missing data and
methods used for calculating indirect emissions (Heijungs and Suh, 2010; Ibrahimet al.
2012).

5
Net zero transport: methodological appendix
1.1. Use of Data and Carbon Tool in this Study
1.1.1. Disaggregation of Carbon
In this study we made use of a disaggregation model based on the UK Territorial Emissions table
for Local Authorities published by BEIS. This data covers a basket of six greenhouse gases which
contribute to global warming. These include Carbon Dioxide (CO2), methane (CH4), nitrous oxide
(N2O), hydrofluorocarbons (HFC), perfluorocarbons (PFC) and sulphur hexafluoride (SF6). In
accordance with international reporting and carbon trading protocols, each of these gases is
weighted by its global warming potential (GWP), so that total greenhouse gas emissions can be
reported on a consistent basis (in terms of CO2 equivalent units). Our model uses the secondary
table provided which covers emissions deemed to be “within the scope of influence” of Local
Authorities. This table excludes emissions for trunk roads, railways and sites within the EU ETS.
We use the secondary table in order to remove motorways and large industrial sites which could
adversely impact the perceived carbon for smaller settlements, however this choice may also
underestimate carbon for larger settlements where the strategic road network is used by a larger
Box 1 | What is urban? The system boundary problem
Any empirical analysis of urban and rural areas, as well as human settlements, requires clear
delineation of physical boundaries. However, it is not a trivial or unambiguous task to determine
where a city, an urban area, or human settlement physically begins and ends. In the literature,
there are a number of methods to establish the boundaries of a city or urban area Elliot, 1987;
Buisseret, 1998; Churchill, 2004). Three common types of boundaries include:
Administrative boundaries, which refer to the territorial or political boundaries of a city
(Hartshorne, 1933; Aguilar and Ward, 2003).
Functional boundaries, which are delineated according to connections or interactions
between areas, such as economic activity, per capita income, or commuting zone
(Brown and Holmes, 1971; Douglass, 2000; Hidle et al., 2009).
Morphological boundaries, which are based on the form or structure of land use, land
cover, or the built environment. This is the dominant approach when satellite images
are used to delineate urban areas (Benediktsson et al., 2003; Rashed et al., 2003)
What approach is chosen will often depend on the particular research question under
consideration. The choice of the physical boundaries can have a substantial influence on the
results of the analysis. For example, the Global Energy Assessment (GEA) (GEA, 2012)
estimates global urban energy consumption between 180-250 EJ/yr depending on the particular
choice of the physical delineation between rural and urban areas. Similarly, depending on the
choice of different administrative, morphological, and functional boundaries, between 37% and
86% in buildings and industry, and 37% to 77% of mobile diesel and gasoline consumption can
be attributed in urban areas (Parshall et al., 2010). Thus, any empirical evidence is dependent
on the particular boundary choice mode in the respective analysis.
Reproduced from IPCC, Fifth Assessment, Chapter 12 (Seto K. C., 2014)

6
Net zero transport: methodological appendix
proportion of residents for day-to-day activities.
The disaggregation model firstly allocates terrestrial emissions to each of the typologies examined
in this study. For some places (e.g. the Wotton City-Region Polycentric Conurbation) this requires
aggregation of Local Authority data, while for others (e.g. Ebsham, the smallest typology) this
requires disaggregating emissions data. In these cases the relevant local authority data was used
and local emissions disaggregated on the basis of population. The model then uses trip purpose
and mode share data drawn from the National Travel Survey (NTS) and 2011 Census Journey to
Work and regional road traffic data from the Department for Transport. The model utilises an in-
depth analysis of OD trip patterns to establish commuting behaviours and carbon and then uses
relationships observed within the NTS to allocate carbon across all purposes and modes. The
results (for personal trips) were validated against a similar exercise undertaken by the DfT in 2008
(Barrett, 2008). The impact of vehicle emission assumptions on the model were also validated
using emission factors in DfT’s WebTAG.
As with any model of carbon, the model has a number of limitations. The following limitations may
have a particular impact on some of the observations in the research:
Sample Size: The NTS sample size is especially useful for national-level observations
but the survey was not designed for disaggregation to the level of built-up areas in the
UK. While our method makes use of local data and nationally-observed relationships,
there is no guarantee these relationships persist at the localised level. In particular, the
method applies nationally observed purpose splits to all typologies which does not
capture any localised differences in trip purpose. For example, it is expected that there
is likely to be a strong income driver for the types of activities undertaken which could
lead to regional differences in journey purposes being under-represented.
Data Sources: Each individual data source has its own limitations, for example the
NTS excludes people not living in households such as students and tourists, the Van
split between personal and non-personal trip types is undertaken based a national
source without regional variation etc. Each of these steps may mask regional
differences that will not have been picked up by this study.
Carbon Data: Our method seeks to reconcile nationally recognised carbon data with a
bottom-up analysis such that it can be used by Local Authorities. However, the local
authority dataset is itself a model, which we then disaggregate further for smaller
settlements. The current disaggregation approach (by population) may disguise some
of the larger differences in trip lengths at the aggregate level. These are captured in the
underlying analysis but a full regional model of transport movements for a potentially
more appropriate carbon disaggregation was beyond the scope of this study.
Freight: While freight patterns were reviewed in independent national models, the
disaggregation of freight carbon uses the vehicle mile split drawn from DfT statistics at
regional level. This split is applied proportionately to vehicle miles in each geography.
This is again likely to limit the regional variations. In freight in particular, further high-
quality data would be beneficial to improve the analysis.

7
Net zero transport: methodological appendix
1.1.2. Modelling the impact of Carbon Interventions
Having developed a carbon disaggregation for each typology we then apply a series of
interventions. The underlying research that feeds into the assumptions for modelling the impact of
each intervention is set out in section 0.
The carbon impact model uses a hierarchical (ordered) attribution of carbon emissions. This is
important to note, as the ordering of the interventions impacts the size / scale of the carbon benefit
attributed. For example, imagine a town that produces 100 units of transport carbon. If transport
demand was first reduced by 50% and then 50% of the remaining travel served by zero carbon
modes, demand reduction would be attributed 50 units of benefit and mode shift 25. If this ordering
was reversed, mode shift would be attributed 50 units and demand reduction 25.
Our chosen hierarchy is based on the SAM framework which prioritises interventions that
substitute (avoid) trips first, shift modes second and finally switch fuels. As a result of initial
substitution (trip avoidance), mode-shift impacts may appear reduced. After all interventions have
been “exhausted”, fuel switching is then applied to all residual carbon.
Each typology also includes a “do nothing” carbon increase. This is the carbon increase that would
be expected if we were to assume that new developments were built with no change in the
intensity of current transport carbon i.e. all new developments induce new travel demand and no
measures are taken either locally or nationally to reduce emissions. Housing projections in each
case are taken from the ONS housing forecasts and, as a result, do not reflect potential local
increases from national housing targets outlined in the planning white paper.
Finally, carbon impacts are presented in the following categories – Do nothing increase in carbon,
zero-carbon developments (which combine interventions to ensure new developments add no
carbon), substitute trips, shift modes, switch fuels. For the workshops, in total 40 interventions
were individually modelled based on the available academic evidence and real-world evidence
presented in section 0. Naturally, this evidence was converted into a series of assumptions. Many
of the assumptions represent a balance between ambition and evidence. The assumptions for the
final pathways are presented in Section 3.
Allocation of individual measures is highly complex in a range of areas but in particular attribution
of different interventions (enablers vs. deterrents) within the shift-mode category and attribution of
vehicle-based vs. infrastructure-based interventions within the switch-fuels category. To simplify
this, in the mode-shift category, we first present the impact of mode-shift in line with a UK
benchmark, then we present the further impact of mode-shift beyond the UK experience to date
without attribution. For switch-fuels we present the interventions by vehicle group – freight, private
vehicles and public transport.
1.1.3. Understanding Current Emissions Profiles
Despite the limitations, the model enables us to make some broad conclusions about transport
carbon, in particular with regards to mode and purpose. We start by discussing the broad
observations and then identify Typology-specific observations through further analysis of
commuting data.
Personal Trips:

8
Net zero transport: methodological appendix
To disaggregate carbon by journey purpose, the model draws on data from the National Travel
survey including trips, average trip lengths (Figure 1), trip modes (Figure 2) and occupancies
enabling us to calculate vehicle miles and carbon emissions by purpose. The carbon split for
personal travel is presented in

9
Net zero transport: methodological appendix
Figure 1: Average trip lengths by purpose and mode . Data from previous analysis by the DfT
(Barrett, 2008) is included for comparison. The overall split for personal travel by purpose appears
relatively consistent, however as discussed above, this may be a limitation of the data input to the
model being more appropriate for national analysis.
Table 1: Estimated CO2 emissions from all modes of passenger transport by journey purpose. DfT
Source - Barrett, 2008
DfT
Analysis
(2008)
Base
Model
(NTS Only)
Wotton City-
Region
(Polycentric
Conurbation)
Castlemore
(Unicentric
Regional
Centre)
Stoneborough
(Regeneration
Town)
Ebsham &
Monteshire
(Growing
County)
Commuting 24% 22.9% 22.9% 22.8% 23.2% 22.9%
Business 13% 9.7% 9.7% 9.7% 9.6% 9.6%
Education 4% 3.6% 3.6% 3.4% 3.9% 3.4%
Shopping 14% 10.8% 10.8% 10.8% 10.8% 10.8%
Other Escort 8% 7.6% 7.6% 7.7% 7.3% 7.5%
Personal
business 8% 7.9% 7.9% 8.0% 7.9% 8.0%
Leisure 30% 37.4% 37.4% 37.5% 37.3% 37.6%
Other 0% 0.1% 0.1% 0.1% 0.1% 0.1%
100% 100% 100% 100% 100% 100%

10
Net zero transport: methodological appendix
Figure 1: Average trip lengths by purpose and mode
Figure 2: Average mode share by purpose
Figure 3 shows the difference between the share of trips, vehicle miles and carbon emissions by
purpose at the national level for personal trips. From this we can see for example that commuting
accounts for 14% of personal trips, 22% of personal vehicle miles and 23% of carbon emissions
while Leisure purposes account for 26% of personal trips, 36% of personal vehicle miles and 37%

11
Net zero transport: methodological appendix
of carbon emissions. Overall, ~70% of carbon emissions derive from commuting, business and
leisure trips. These trips are also those with longer average trip lengths.
Figure 3: Difference between trips, vehicle miles and carbon emission share (Source: NTS)
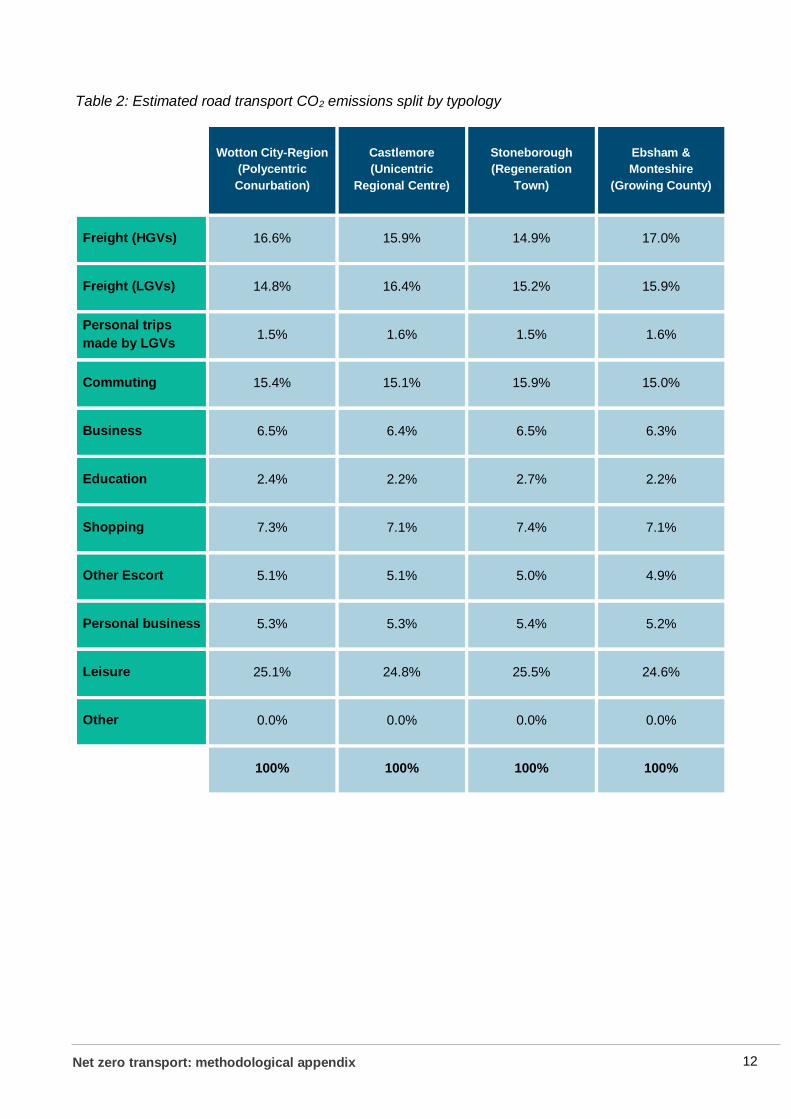
Total Trips: Error! Reference source not found. and Figure 4 set out the split for each typology
including Freight trips. It can be seen that freight accounts for between 30%-33% of total emissions
in each typology. Addressing the decarbonisation of freight will require considerable new
understanding for local freight movements and their drivers.
Base Model - Trips (Inner Ring), Vehicle Miles and Carbon Emissions (Outer Ring) by Personal Travel Purpose
Commuting Business Education Shopping Other Escort Personal business Leisure Other
12
Net zero transport: methodological appendix
Table 2: Estimated road transport CO2 emissions split by typology
Wotton City-Region
(Polycentric
Conurbation)
Castlemore
(Unicentric
Regional Centre)
Stoneborough
(Regeneration
Town)
Ebsham &
Monteshire
(Growing County)
Freight (HGVs) 16.6% 15.9% 14.9% 17.0%
Freight (LGVs) 14.8% 16.4% 15.2% 15.9%
Personal trips
made by LGVs 1.5% 1.6% 1.5% 1.6%
Commuting 15.4% 15.1% 15.9% 15.0%
Business 6.5% 6.4% 6.5% 6.3%
Education 2.4% 2.2% 2.7% 2.2%
Shopping 7.3% 7.1% 7.4% 7.1%
Other Escort 5.1% 5.1% 5.0% 4.9%
Personal business 5.3% 5.3% 5.4% 5.2%
Leisure 25.1% 24.8% 25.5% 24.6%
Other 0.0% 0.0% 0.0% 0.0%
100% 100% 100% 100%

13
Net zero transport: methodological appendix
Figure 4: Transport Carbon Emission Disaggregation by Purpose
Local Movements: Figure 5 - Figure 8 show the detailed picture of trips and vehicle kilometers
travelled for each of the typologies by distance derived from Journey to Work data from the 2011
census. Since vehicle miles are a key driver of carbon, this analysis can help us understand the
broad travel footprint of each of the typologies. For example, in Typology 1 (the Wotton City-
Region), the majority of trips are in the 0-40 km range with the majority of vehicle miles recorded
below 60 kms. In contrast, as we move down to Typology 4, trips are much more geographically
dispersed with many trips being greater than 40 km. The majority of vehicle miles (over 80%) for
typology 4 are actually generated more than 20 kms away from the settlement itself! Addressing
longer distance trips is one of the key factors our interventions need to consider.
Figure 5: Typology 1: Polycentric Conurbation (the Wotton City-Region) - trip number (left) and
vehicle miles (right) by distance
21.5%
19.2%
1.9%13.2%
5.6%
2.0%
6.2%
4.4%
4.5%
21.4%
0.0%
Base Model - Transport Carbon Emission Split by Purpose
Freight (HGVs) Freight (LGVs) Personal trips made by LGVs
Commuting Business Education
Shopping Other Escort Personal business
Leisure Other

14
Net zero transport: methodological appendix
Figure 6: Typology 2: Unicentric Conurbation (Castlemore) - trip number (left) and vehicle miles
(right) by distance
Figure 7: Typology 3: Regeneration Town (Stoneborough) - trip number (left) and vehicle miles
(right) by distance
Figure 8: Typology 4: Growing County (Ebsham and Monteshire) - trip number (left) and vehicle
miles (right) by distance
Table 3 summarises these charts into the average daily commuting vehicle km for each typology,
presenting these on a per capita basis. This offers an indication of the likely trends in per capita
carbon emissions for each typology. The table clearly shows that the vehicle kilometres for private
vehicles increase as the size of the settlement gets smaller.

15
Net zero transport: methodological appendix
Table 3: Average daily commuting vehicle km per capita by mode and typology
Typology Private Vehicle km /
capita
Public Transport
Vehicle km / capita
Active Travel Vehicle
km / capita
Typology 1 (Largest) 0.6 0.3 0.1
Typology 2 3.4 0.9 0.7
Typology 3 5.9 0.5 0.6
Typology 4 (Smallest) 6.1 1.4 0.7
1.1.4. Carbon Emissions and Urban Form
The RTPI previously reviewed the evidence linking settlement patterns, urban form and
sustainability (RTPI, 2018). The UK is one of the most densely populated countries in Europe with
13% of land built-up. Most of the UK’s settlements have largely concentric densities (high-density
inner areas; medium density outer-central areas; low-density suburbs), with many being belted by
protected land (Williams K. , 2014). The traditional development pattern in many English
settlements is for larger settlements to be surrounded a “patchwork of smaller towns, villages and
hamlets separated by open land”. The majority of places settlements are of low density with
around 84% of the English population estimated to live in some form of suburb (RTPI, 2018).
Urban form has a clear impact on overall carbon of different typologies for settlement. An extensive
body of evidence has explored the relationship between urban form and greenhouse gas
emissions with the majority focusing on broad energy use across all purposes. While there are
limited studies focusing solely on transport some general drivers have been identified. Key drivers
identified for total carbon include density, land use mix, connectivity and accessibility (Seto, 2014;
Creutzig, 2015; Williams, 2013). However, emissions of individual settlements are also
charaterised by unique, place-specific combinations of factors, in particular income (Baiocchi,
2015) and other potential factors such as fuel mix, distance to nearest larger settlements and
effectiveness of regional services (O'Regan, 2009). Previous analysis of human settlements in the
UK finds that very high income households in low-density settlements with large houses are likely
to exhibit the highest household total carbon emissions (Baiocchi, 2015). In contrast, large and
compact settlement patterns tend to make more efficient use of infrastructure networks (RTPI,
2018) and as a result should minimise per capita carbon. However, the scope of carbon emissions
reviewed is also likely to play a significant factor with some evidence that consumption-based CO2
emissions may be higher in urban areas with socio-economic determinants such as income,
education and car-ownership key drivers (Minx, 2013).
A holistic analysis of transport carbon in the UK has not previously been undertaken. To address
this, we use a mixed effects linear model to estimate the effects of fixed socioeconomic factors and
random geographically related factors at MSOA-level. The analysis addresses transport carbon

16
Net zero transport: methodological appendix
from commuting only with data drawn from the ONS 2011 Census JTW tables. Using this mode,
population, average income and economic activity indicators all significantly predicted commuting
carbon. Geographical factors at MSOA and LA level were also significant predictors.
Figure 9: Carbon Footprint of Commuting in the UK (Source: City Science estimates, ONS Census
JTW 2011)
Overall, the model predicted 61% of the variance in carbon emissions at the MSOA level. The
pattern of MSOA factors is clearly very geographically dependent with large cities tending to have
much lower-than-expected commuting carbon footprints. Rural areas with good access to the
transport network are seen to have the highest carbon footprints (

17
Net zero transport: methodological appendix
Figure 10). Greenfield sites with good access to the road transport network are often very
attractive sites, but the implications of this initial model imply that these are likely to generate the
highest commuting carbon footprints.

18
Net zero transport: methodological appendix
Figure 10: Modelled MSOA factors for transport carbon (Source: City Science estimates, ONS
Census 2011)

19
Net zero transport: methodological appendix
2. Summary of interventions considered
For each typology over 40 individual interventions were considered and their potential impacts
modelled. Interventions were grouped using the SAM framework. The research that underpins the
treatment of the interventions in the subsequent carbon estimation is outlined below.
2.1. Substitute Trips
Land Use Planning
Mixed use developments meeting greater range of local needs
For a development to be truly low carbon, the strategic location, land use mix and access to
transport options need to be right (Campbell, 2020). Previous research regarding the impact of
built environment on travel behaviour has reported mixed findings, with some studies observing
statistically significant effects while others not (Zhang, 2012). The reasons for these different
conclusions are not known and this gap has made it difficult for decision makers to evaluate land
use plans and policies according to their impact on vehicle miles travelled (VMT), and as a result
their carbon impacts. Development ‘compactness’ is usually defined by ‘D-variables’ - density,
diversity, design, destination accessibility, and distance to public transport. A body of evidence
suggests that compact settlements encourage reduced driving, but that the effects can be small,
depending on the D-variable observed (Stevens, 2016). Previous US studies have modelled the
carbon impacts of compact developments assessing the impacts against a future ‘business as
usual’ baselines (Burchell et al., 2002; Ewing, 2007). These studies indicate that Carbon emissions
could be reduced by between 4%-10% against a future baseline. However, since the baselines in
these studies assume significant development, there is a risk that absolute carbon emissions
increase. In this study, we take the view that to secure net zero, all new developments need be net
zero by design to mitigate against any residual carbon. Achieving this will likely involve a
combination of land-use planning, transit-oriented development, and restrictions to private
vehicles.
Local amenities within short walk and cycle (15-minute neighbourhood)
The concept of the “15-minute neighbourhood” (also referred to as the “15-minute city” and “20-
minute neighbourhood”) aims to reduce the need to travel by ensuring that all services and
activities fundamental to well-being are provided within a short walking or cycling distance. This
concept essentially aims to achieve mixed use, but through retrofit of existing settlements. As a
planning concept the 15-minute neighbourhood is growing in popularity and was generally
embraced by participants in this study. A meta-analysis of 36 studies of the relationship between
development compactness and vehicle miles, identifies that distance to the centre (or ‘downtown’)
has an elasticity of -0.63 – i.e. a 1% reduction in distance to the centre, would reduce Vehicle Miles
by 0.63% (Stevens, 2016). This adds promise to concept that greater proximity could reduce
vehicle miles. However, since implementations of 20-minute neighbourhoods are at an early-stage,
further empirical research on their successes and carbon impacts is needed. For the purposes of
this study we estimate the potential impacts by considering the potential to reduce vehicle miles or

20
Net zero transport: methodological appendix
switch individual trips by purpose, considering the context of each individual typology. It is
important to note that in less populous typologies (e.g. Typology 4), questions of cost-
effectiveness, viability and the role of the state will need to be addressed.
Recreation space embedded in neighbourhoods
Increased space for leisure, in particular recreational space, is expected to impact carbon in the
following ways – 1) providing a modest reduction in the need to travel for a sub-set of leisure trips,
2) replacing car dominant design, in some cases restricting access and reducing the convenience
of driving and 3) increasing the natural carbon sinks in the built environment. In our modelling, we
do not consider recreation space explicitly, rather addressing the effects as part of the 20-minute
neighbourhood or traffic restrictions. We do not consider the impact of carbon sinks.
Co-Working Spaces (local, in new developments / disused shops)
At the peak of the COVID-19 pandemic, 49% of workers were working from home (ONS, 2020). It
has therefore been suggested that Co-Working spaces could encourage more people to work in
their local area on a permanent basis. While it is unlikely that co-working space is a necessary
condition to support increased local working over the long-term, it is seen as likely to be an
attractive option in supporting reduced need for travel, potentially encouraging workers with a
lower propensity to work from home to reduce their commuting distances. At the same time,
however the intervention may also induce some local trips to a shared space that would otherwise
work from home. As an emerging area, more formal research will be needed. In the next section
we consider the broader impacts of digital technology and home working on carbon emissions.
IT Infrastructure
Home working (Superfast broadband and house design to allow for work space)
The Code for Sustainable Homes provided credits for a home office recognising the potential role
of home working on reducing the need to commute (CLG Communities and Local Government,
2010). The potential role of digital technology in transport planning to achieve accessibility
outcomes had been noted well before the COVID-19 pandemic (Lyons, 2016). Prior to COVID-19
there had been some work on the impacts of ‘telecommuting’ but 2020 has revealed the full
potential of home working as an alternative to office-based work. In fact, at the peak of the COVID-
19 pandemic, 49% of workers were working from home (ONS, 2020). A systematic review of 39
empirical studies was recently undertaken to provide an up-to-date state of knowledge with
regards to the energy (and carbon) impacts of home-working (Hook, 2020). The 39 papers
reviewed vary in their conclusions with some suggesting teleworking could reduce emissions by up
to 77%, while others suggest emissions may increase. While many studies identify the potential
benefits from reduced commuting, other factors may reduce the overall carbon benefits if
unmanaged – for example, impacts of increases in home energy consumption or unpredictable
increases in non-work travel. It is also generally found that workers are more inclined to accept a
job that is located farther away from home if they have the ability to work from home one day a
week or more (de Vos, 2018). With studies suggesting possible increased distances of between
2.3-10.7 miles, if uncontrolled, longer-term land-use effects could induce sprawl and result in
higher carbon for non-commuting journeys (Helminen, 2007; De Abreu, 2017). To realise carbon

21
Net zero transport: methodological appendix
benefits then, home working likely needs to be combined with other land-use and energy efficiency
measures to mitigate potential unintended consequences.
Impact of Digital on other Journey Purposes
Once we consider the potential benefits of home working on carbon emissions, it is then natural to
consider its potential role on other purposes. A range of services are increasingly being delivered
through digital means including elements of further and higher education and some health and GP
services. We can explore the potential impacts of these advances by applying potential impacts to
the carbon emissions by purpose (see section 1.1.3). Overall, the impacts are likely to be less than
for commuting given the lower carbon contribution. However, additional efforts to minimise the
need for travel across other purposes could also be an important consideration to mitigate the
potential rebound effects of home working noted above.
Home Deliveries
Another area where digital technology is having a significant impact is in our shopping habits.
Home supermarket retail reached 20% of the total market share in June 2020 (Kantar, 2020) and
the online share of total retail sales reached 32.8% (ONS, 2020). There is general agreement that
online shopping is beneficial from a carbon perspective with store based (‘bricks-and-mortar’) retail
systems likely to have lower emissions in only a small number of contexts (Smidflet Rosqvist,
2016; Al-Mulali, 2015; Weber, 2010; Van Loon, 2014; Carling, 2015). However, again there are
complex effects that need to be considered, in particular shopping behaviour and rebound effects
such as use of time-saved to conduct more travel.
While overall there is evidence that home deliveries are beneficial, the impacts likely vary by
location and purpose. For example in our Typology 4: Ebsham and Monteshire (Growing County),
distances to the nearest supermarket are high (5-6 miles). Reducing these car trips and replacing
with an optimised route is likely to be beneficial. But with multiple operators and limited sharing of
commercial data, it is difficult to monitor, let alone guarantee these benefits. Specific behavioural
impacts also matter including the degree to which online shoppers attend traditional retail outlets in
their buying decision (Weideli, 2013); whether the delivery is itself successful first time; and the
returns policy of the retailer, in particular in relation to ‘fast fashion’ (Edwards, 2009). Similarly, the
delivery mode has an impact in particular where the long-haul leg is by air (Van Loon, 2014). In
some city centres, online retail is also having a significant impact on traffic volumes (Jamshid,
2016) with wider potential implications on traffic speeds and emissions. These latter effects are
likely to be most acute in our Typology 1: Polycentric Conurbation (the Wotton City-Region).
Logistics Infrastructure
Micro-consolidation - Cargo bike / Electric Vehicle last mile delivery:
Micro-consolidation refers to interventions that seek to replace last-mile deliveries with low carbon
options. These could include cargo bikes, e-cargo bikes or electric vehicles. Delivery services by
LGVs have been claimed to account for 29% of LGV miles (Cherrett, 2019; DfT, 2009)1 however,
1 The original source for this figure is believed to be the Van Activity Baseline Survey 2008. Given the changes to LGV activity over that period it is recommended that more up-to-date studies on LGV activity are undertaken.

22
Net zero transport: methodological appendix
there is limited data on the split between "depot to town" and "within town" legs of the journey. A
number of studies have sought to estimate the potential for cargo-bikes/e-cargo bikes to replace
motorised trips within city centres with potential impacts ranging between 14% to 55% (Schliwa,
2015; Gruber, 2013; Browne, 2011). Using these values and depending on the impacts assumed,
the carbon impacts could therefore be between 4% and 16% of current carbon associated with
LGVs. However, given recent increases in LGV miles, further research should be undertaken to
validate movement data and constraints to realising this potential.
In addition to mode shift of vehicles, consolidation (combining multiple servicing or delivery vehicle
movements into fewer, larger consignments) can also have beneficial impacts. Evaluation of
Freight Consolidation Demonstrator Projects in London found positive impacts on trips and vehicle
miles, in projects where data on vehicle mileage was available (TfL, 2019) – for example the
Camden Freight Consolidation Centre demonstrator claims a 66% reduction in vehicle miles2. In
urban areas then, combined with mode shifting, consolidation has high potential. Research on the
impact of consolidation approaches in more rural typologies is limited.
Flexible pick up / drop off points for home deliveries:
In addition to consolidation and mode-shift, flexible pick up / drop off points could be introduced for
home deliveries. Parcel pickup points would reduce the very final portion of the trip to a walking trip
instead of taking the goods directly to the customer's door. Since a single drop-off can be made
instead of multiple, it can potentially save multiple short trip-legs. However, if cargo bikes are
already implemented the introduction of pick-up points will have limited additional carbon impact.
From an operational perspective such facilities may improve fleet optimisation opportunities
reducing delivery times and costs, and, as a result, may help to make cycle-based deliveries more
viable for certain goods.
Negative Carbon Developments
Negative carbon developments bring together all demand reduction, mode shift and fuel switching
interventions to ensure that new developments have no net carbon impact. This is important since
until our systems are at a net zero position, every new development will create a net generation of
carbon unless this is managed. It is envisaged that this would be achieved through a number of
approaches including restraint on private vehicles – for example eliminating parking within the
development itself. But successfully achieving this will also require greater integration between
transport and land-use planning, increased density, improved facilities that better cater for the full
range of needs of residents, long-term support for alternative sustainable modes to and from these
new developments, on-site generation and charging infrastructure and improvements to wider
networks to enable connectivity.
2 Note the underlying data supporting this was not reviewed as part of the evaluation.

23
Net zero transport: methodological appendix
2.2. Shift Modes
Incentives vs Deterrents
The interventions that follow consist of those designed to shift use away from the private car to
either public transport or active modes. These interventions naturally comprise both carrots
(enablers of alternative modes) and sticks (deterrents to the private car). The majority of studies
focus on interventions aimed at enabling active travel rather than deterring driving and there are
limited studies covering both effects simultaneously. Literature reviews find that interventions
aimed at enabling active travel have modest impacts - up to 5% at best (Piatkowski, 2017).
However, often schemes will involve both enablers and deterrents, in particular many of the best
practice examples reviewed in this study. The question then emerges of how to attribute change
between each of the measures.
Two UK examples were widely cited through our workshops that help articulate the challenge from
a carbon impact perspective – Milton Keynes and Cambridge. In the words of one workshop
participant “Milton Keynes has great cycle infrastructure but everyone drives, whereas Cambridge
doesn’t have that good infrastructure but it is difficult to drive and so everyone cycles”. Comments
such as this were widespread and suggest that making it less convenient to drive is a likely to be a
critical factor in promoting adoption of more sustainable modes. Case studies cited for success in
active travel such as Houten or Ghent often impose traffic restrictions in the central core (Foletta,
2011). The few studies that cover the subject suggest that deterrents may in fact be more powerful
than enablers (Piatkowski, 2017; Petronuff, 2015). One study in particular reviews travel plans
across two similar hospitals, one using only enablers and the other combining enablers with
deterrents. The impact of the plans were 5% (enablers alone) and 42% (enablers and deterrents)
respectively, indicating a 37% difference in impact when combining enablers with deterrents
(Petronuff, 2015).
For the purposes of the modelling in this study, we assume that both enablers and deterrents need
to be in place to achieve maximum impact on mode share – for simplicity we split the impacts.
However, it may be that much can be achieved with deterrents alone. It is often the case that
practitioners want to ensure alternatives to the private car exist, before measures perceived as
taking mobility away are introduced. However, two points should be made: 1) it is not clear that
new infrastructure will achieve sufficient scale to provide suitable alternatives within the timeframe
needed to address the climate emergency, and 2) some deterrents in particular could provide new
revenue through which to fund improved alternatives. The role of deterrents therefore needs to be
strongly considered - this is an area where we recommend further research.
Street Design and Access Restrictions
We commence this section by looking at street design and access restrictions.
Congestion Charging Zone
Congestion Charging impacts differ 1) over time and 2) depending on the make-up of the place.
ITF published useful analysis on the long-term effects of congestion charging in Sweden
(OECD/ITF, 2015). In Stockholm, where good public transport is available, congestion charging

24
Net zero transport: methodological appendix
has been more successful (both in terms of price elasticity and public support) compared to
Gothenburg where reactions have been lower.
Parking Restrictions
Parking restrictions refer to any price differentials or controls on parking number or access.
Restrictions could cover certain vehicle types (e.g. higher emissions vehicles or SUVs) to the
outright closure of certain car parks. Parking charges can also be increased as a disincentive to
car-based travel. Parking charges have been shown to have a fairly low price elasticity, meaning
that prices can be increased significantly before behaviour change is material. A review of 50
studies shows that observed price elasticities range from -0.02 to -2.40 (Lehner, 2018). Lehner
suggests a baseline price elasticity for commuting trips of -0.52 which suggests that a 1% increase
prices leads to a 0.52% decrease in occupancy. Such an elasticity means that in many cases,
price increases can raise additional revenue which could be recycled into alternative modes.
20 mph zones
20 mph zones can be implemented through speed limits or, using design through the introduction
of traffic calming measures (e.g. speed humps and chicanes). Reduced speed limits can impact
carbon in the following ways: 1) reducing the risk of road accidents making it more attractive to
walk and cycle; 2) increasing journey times and reducing convenience for car-based journeys; and
3) speed changes will also impact driving behaviour and vehicle performance with impacts on fuel
efficiency, braking and idling.
With regards to road safety, it is expected that there is a 6% reduction in collisions for every 1mph
reduced (Welsh 20mph Task Force, 2020). 20mph zones are widely believed to lead to a five-fold
reduction in mortality risk. An evaluation of 12 case studies in the UK showed 20 mph zones
resulted in significant speed reductions with 47%-65% compliance with the limit. The majority of
residents perceive the 20mph limits to be beneficial for cyclists and pedestrians, but evidence to
date from these case studies shows no significant change in collisions and casualties (Atkins,
2018).
With regards to journey times, the Atkins evaluation estimated that journey times for private
vehicles increased by 3% in residential areas and 5% in city centre areas following introduction of
the 20 mph zones. However, the majority of residents (about two-thirds) and non-resident drivers
(just over half) have not noticed a reduction in the speed of vehicles. These case studies also
show small (but significant) increase in the proportion of residents stating that they have increased
their active modes (5% for cycling and 2% for walking), with a significant minority (16% and 9%
respectively) saying that it is more likely they will walk or cycle rather than using the car (Atkins,
2018).
With regards to fuel efficiency, NICE Guidance suggests that ensuring motorists drive steadily at
the optimum speed can help reduce stop–go driving and so improve fuel consumption as well as
reducing congestion and air pollution (NICE, 2017). While there are some concerns that lower
speeds might reduce fuel efficiency, research in London shows no net negative impact on
emissions from 20mph zones (TfL, 2018). Some studies even report that a 30km/h zone could
improve fuel efficiency overall by 12% (Transform Scotland, 2017).

25
Net zero transport: methodological appendix
Low Traffic Neighbourhoods - Active travel priority
An alternative or complementary approach to 20mph zones is the introduction of Low Traffic
Neighbourhoods. Low Traffic Neighbourhoods are groups of residential streets bordered by main
or “distributor” roads where “through” motor vehicle traffic is discouraged or removed (Living
Streets, 2020). A recent analysis of the People and Places survey covering areas of Outer London
and associated LTNs suggests that LTNs make a difference to car ownership, with residents
becoming 20% less likely to own a car as time goes on. There is also evidence that LTNs are more
likely to see increased active travel (Aldred, 2020).
Street space reallocation from car to active and Public Transport
Reallocation of road space could significantly increase the attractiveness of alternatives to the
private car, but road space reallocation schemes are often controversial. Research has often
focused on the key areas of contention – namely the effects on dispersed traffic and congestion
and economic impacts. Research often finds that on both fronts the impacts are far less serious
than predicted (Cairns, 2002; Fleming, 2013; Living Streets, 2018).
With respect to the effect on road users, evidence across over 70 case studies demonstrates that
detractors often overestimate the negative impacts and that in fact significant reductions in traffic
can be observed. More recently, research has turned to addressing the economic push-back with a
range of studies bringing together individual case studies where reported increases in footfall or
retail sales have been observed. Studies demonstrate that sustainable transport users can often
account for a large proportion of the total expenditure in shopping areas (Fleming, 2013), that
reallocation schemes often result in a significant increase in both footfall and sales (Natural
Economy Northwest, 2009; Ryder, 2020; Living Streets, 2018).
Car Free Zones
A further measure to enable mode shift, by increasing the attractiveness of sustainable modes,
while deterring driving, is the development of car free zones. Examples include pedestrianisation
schemes or car free development. In a similar manner to interventions discussed above car free
zones often meet with contention and perceptions that they could impact negatively on congestion
and re-routing behaviour. Car free zones are increasingly popular in larger cities where they are
likely to have direct and indirect health benefits, but the exact magnitude and potential conflicting
effects are as yet unclear (Nieuwenhuijsen, 2016). Much will depend on the precise
implementation and the alternatives available. However, to avoid the continuous increase in
commuting-related CO2 emissions, restrictions on car use is seen as one of the most important
traffic demand management measures (Wang, 2019).
Fiscal Measures
Workplace Parking Levy
A Workplace Parking Levy (WPL) is a mechanism to restrict car use and raise funds to invest in
public transport services. Workplace Parking Levies can be an effective mechanism to target
pricing interventions towards commuter journeys. Examples of implementations in the UK include
Nottingham, where the WPL is believed to have contributed to additional investment in public

26
Net zero transport: methodological appendix
transport modes. In addition to the revenue raising potential, research by Loughborough University
suggests that WPLs can also provide a strong influence on mode shift – their study of the
Nottingham WPL suggests that 8.6% of commuters switched their behaviour following
implementation of the WPL with 50% of these citing WPL as an "important" factor (Dale, 2019).
Fuel Tax
As with parking charges there have been a number of studies to investigate the effects (price
elasticity) of fuel costs. Whether or not a car trip will be avoided in response to prices changes
depends on a range of factors of which price is only one. However, studies trying to separate the
impact of price report elasticities ranging from -0.93 to +0.09 (Hössinger., 2017). Some reports
indicate that price elasticities change over time and in some contexts have fallen in recent decades
(EIA, 2014). To give an example, a price elasticity of -0.1, would imply that a 10% price increase in
cost would result in a 1% reduction in travel demand (which we can represent as vehicle miles). In
a UK context, let's assume we were to normalise Fuel Duty, hiking it to 65p/litre. The effect would
be to add 7.05p to the pump price of petrol (113.29 via BEIS weekly fuel prices at the time of
writing). At current prices this would equate to a 6% increase on Petrol and Diesel. If the -0.1 price
elasticity holds, then we would assume travel demand would reduce by 0.7%. On it’s own, it might
not have a significant impact on travel, but that’s not to say fuel taxes do not have an important
role to play.
Firstly, fuel taxes could have a significant role in revenue raising to fund the transition to more
sustainable modes. Data from the Office for Budget Responsibility (

27
Net zero transport: methodological appendix
Figure 11) demonstrate the potential impact with previous forecasts based on fuel duty rising in
line with inflation suggesting an additional £9bn of annual revenue (Office of Budget Responsibility,
2019). But central policies, including taxation policy, also play a critical role in managing the
relative costs between modes. Consider the divergence in travel costs for public and private
transport modes since 1987 (Figure 12). Increases to the cost of driving have trailed RPI over that
period while the cost of using trains has increased by 300% and buses by over 350% (Dempsey,
2018). If it is cheaper to drive for the majority of long-distance trips, it should come as no surprise
that the driving is then the preferred mode. Deterring long-distance travel at a national level will
likely require some kind of pricing regime – a pricing regime for private cars that scales according
to distance, while offering subsidies for public transport might offer the best disincentive against
longer-distance travel by private car.

28
Net zero transport: methodological appendix
Figure 11: Previous Forecasts for Tax Income from Fuel Duty, Office for Budget Responsibility
Figure 12: Transport Cost Evolution by Mode Compared to RPI, Source – Dempsey, 2018

29
Net zero transport: methodological appendix
Cycling Infrastructure – Genuine Connected Network
Joining up cycling infrastructure, ensuring direct routes between key sites, linking cycling networks
to public transport networks and extending the number places that are cyclable are clearly
welcome. There is good evidence that safe, separated cycling infrastructure is likely to be among
the key influencing factors of cycling propensity (Wardman, 2007; Hirst, 2020). Ongoing
operational and maintenance costs of cycle infrastructure are also significantly lower than for any
other form of infrastructure (National Infrastructure Commission, 2018). However, as discussed in
section Error! Reference source not found. above, it is rare to find best practice examples that
rely solely on infrastructure alone. An evaluation of Connect2 in Cardiff notes the potential for
active travel to replace short car trips and reduce carbon (4.9% for personal trips), but also notes
that the scheme in question was unlikely to promote a significant change in travel behaviour on its
own (Neves, 2015). Studies of European best practice conclude that “the key to achieving high
levels of cycling appears to be the provision of separate cycling facilities along heavily travelled
roads and at intersections” (Pucher, 2008) but also adds that calming measures are also needed.
Our purpose is not to present an argument that genuine connected cycling networks are not
important – they are. But we do think it important to challenge the notion that they are sufficient. If
we are truly going to change our places then we need active travel to be the priority – that means
making it more convenient than the private car. Milton Keynes is a great example - Milton Keynes
has 300 km of cycleways known as the ‘redways’, nearly all of which are segregated from cars. As
a result, it could be described as ‘infrastructure rich’ compare to many UK towns. However, despite
this plentiful infrastructure, the commuter mode share for cycling within the city is only 4.2% while
cars account for 75% of commuter journeys (National Infrastructure Commission, 2018). In its
2018 report promoting investment in cycling infrastructure across the Ox-Cam arc, the NIC
fatalistically states “the car clearly is, and will remain, Milton Keynes’ dominant mode”. In contrast it
is clear from studies of European best practice that many areas where cycling is a success (the
Netherlands, Denmark and Germany) make driving expensive and inconvenient in city centres.
This is an important take home message for places that really want car dominance to end.
Walking Infrastructure – Genuine Connected Network
“A walkable environment is a crucial factor for promoting active transportation” (Kim, 2020).
Numerous studies have sought to develop metrics to evaluate the quality of the built environment
for pedestrians with various definitions of “walkability” (Humberto, et al., 2019). Walkability can
generally be considered a measure of how friendly an area is for walking. At this local level,
measures of walkability are influenced by a range of factors such as network quality itself, traffic
speeds/restrictions, climate, built environment, density, safety, community, aesthetics and
experience, greenspace, on-street facilities among others (Tight, 2018; Zuniga-Teran, 2017).
Walkability studies broadly focus on three core areas: 1) examining the relationship between
walking behaviour and the physical or built environment; 2) exploration of the importance of
individual perspectives and perceptions; and 3) framing walkability in more general terms of quality
of life (Blecic, 2020). As we have seen with cycling, there is the sense that appropriate packages of
measures, tailored to the circumstances and context of a location, have the potential to be more
effective than single measures (Tight, 2018).

30
Net zero transport: methodological appendix
A number of studies have shown that aggregate measures of walkability and the individual
components can be good predictors of propensity to walk with individuals being seen as more
likely to walk in neighbourhoods with higher walkability (Liao B. v., 2019; Zuniga-Teran, 2017;
Kartschmit, 2020; Humberto et al., 2019). For example, one study found that the odds of walking
were almost 3.5x higher when the Walk Score for the trip origin was “Walker’s Paradise” compared
to less walkable neighbourhoods (Duncan, et al., 2016), another found that every one-point
increase in the Walkability Score was associated with 1.5%-1.8% higher odds of active
transportation for certain journey purposes (Kim, 2020).
Different studies expose different elements supporting walking. For example, in one study
categories such as traffic safety, experience, and greenspace showed a strong influence,
especially for recreational walking, while in another proximity to services such as supermarkets,
daily goods stores, cafeterias and high urban density were found to be significant (Zuniga-Teran,
2017; Liao, 2020). Others have found the relationship between car ownership and walking
propensity to be very strong, suggesting that highly car-dependent neighbourhoods discourage
walking (Habib, 2011). This links to findings on the related area of severance – usually defined as
the separation of local communities by transport infrastructure, in particular road traffic. A literature
review on severance by Jacobsen et al. identified a consistent inverse correlation between traffic
volumes and speeds and levels of walking and cycling (Anciaes, 2014).
Studies also suggest that individuals or groups are likely to experience the environment differently,
exhibiting different propensities to walk based on changes in the external environment. For
example, conditions for walkability may not be the same for all age groups (Lioa B. v., 2019; Kim,
2020), genders (Kim, 2020) and physical abilities (Kartschmit, 2020).
Electric Bikes
In addition to cycling and walking electric bikes also offer great potential, in particular to extend
distances and accessibility to key locations. Research by CREDS suggests that e-bikes could offer
significant (up to 50%) carbon saving potential if they were to replace all car trips in the UK
(Philips, 2020). Whole life carbon of an e-bike is estimated at 22g/km vs. electric cars at 104g/km
meaning that transition to an e-bike fleet could make more carbon sense than transition to electric
vehicles. However, there are limited real-world examples where e-bikes have yet provided a
significant mode share. The replacement effects are also not known (e.g. how much will e-bikes
replace bus journeys for example).
While these implementation questions are not fully known, it cannot be ignored that each person
using an e-bike to replace all the car journeys could be able to save 0.7 tonnes CO2 per annum
(Philips, 2020). This raises an important point about the role of vehicles in the transition to net
zero. Recent research into SUVs for example, suggests that SUVs have been the second largest
contributor to the increase in global carbon emissions from 2010 to 2018 and yet, today, almost
half of all cars sold in the United States and one-third of the cars sold in Europe are SUVs (Cozzi,
2019). This demonstrates the need to promote smaller, functional electric vehicles that simply
require less energy but can address some of the limitations of fully self-propelled vehicles.

31
Net zero transport: methodological appendix
Modern Public Transport
Bus Rapid Transit
BRT could attract significantly private vehicle users to change mode choice and can attract many
passengers if travel time reductions are sufficiently high. A review of 86 international projects finds
modal shifts away from private cars of between 0% and 50% with the majority of schemes
reviewed delivering double digit percentage shifts away from private cars (Ingvardson, 2018). Both
travel time and travel cost ultimately affect the mode choice, but travel time is likely to have a
highly significant effect on car users' switching to BRT (Satiennam, 2016).
In reality, for most places in the UK, full BRT is unlikely to be needed, but improved bus services
with greater frequencies and reliability, supported through dedicated lanes could have a
meaningful, but cost-effective impact. In addition, as we have seen with many of the other mode
shift interventions, the benefits are likely to be enhanced through wider traffic restrictions. For
example, the efficiency of public transport systems can be increased simply and cost-effectively
through a range of constraints on private vehicles such as reduced number of lanes, parking
restrictions, and limited access (La Branche, 2011) and in many cases schemes could be
enhanced by combining measures. For example, a modelling exercise in Lille covering multiple
strategies for CO2 reduction finds that combining significant increases in parking tariffs and tolls
combined with travel time improvements for public transport is likely to be the most effective
scenario (Hammadou, 2015).
Other Public Transport Measures
Other measures to afford priority include bus priority at junctions, transport hubs and greater
integration with first and last mile connectivity. Previous work by City Science indicated that up to
48% of vehicular trips could be replaced by first- and last-mile shuttles, through the reallocation of
a small amount of road space to shuttles, cycles or e-bikes (City Science, 2017). Integration of
public transport and active transport networks is therefore key to providing an attractive all round
transport offer and genuine alternative to the private car. In the final section, we briefly review the
potential for shared mobility.
Shared Mobility
Car Share (club)
Car clubs can be introduced to offer the service of a car to those who can eliminate a car from their
lives but want residual access to a car, for occasions when they may need it. Estimates suggest
that each round trip car club vehicle put on the street can replace 10.5 privately owned vehicles
(Marsden G. A., 2019). However, to dates car clubs often operate in central urban areas where
there is a good mix of alternative transport options and suitable density to achieve service viability.
It is unclear the extent to which car clubs are complementary rather than a solution which itself
provides direct effects. Some authors have estimated that between 20%-50% of members could
give up their car as a result of joining a car club (Cairns S, 2004). There is certainly strong
evidence that if someone gives up their vehicle when joining a car club, they are likely to
significantly reduce their vehicle miles, but changes to car ownership may also require a range of

32
Net zero transport: methodological appendix
other external factors to be in place. Car clubs can also be electric, which, as well as offering zero
tailpipe emissions, may enable users who have never tried an electric vehicle to use one – this in
turn could help in promoting the transition to low carbon vehicles.
Car Pooling
Car Pooling or Ride-sharing enables users to share a trip from a common origin, to a common
destination or for a particular leg of a journey. By combining multiple users into a single trip that
would otherwise be undertaking the journey as sole occupants, car-pooling has strong potential to
reduce vehicle miles and, as a result, carbon. Studies of employment sites that have implemented
car pooling demonstrate that the intervention can reduce vehicle miles by users in the region of
4%-6%. When evaluated regionally, impacts can be in the region of 1%-1.6% (Shaheen, 2018).
However, it is also worth noting the potential when financial disincentives to single-occupancy trips
are introduced – research during the 1970s energy crisis indicated that car pooling enabled a
reduction of vehicle miles by 23% due to the significant additional financial incentive to share
(Shaheen, 2018). This suggests again that a coordinated approach that combines the intervention
with wider deterrents might be the most effective way to induce uptake.
Bike Share
Bike sharing systems are highly flexible and can provide users access to a bike from multiple
locations. Implementations can be “docked” with fixed locations for pick-up/drop-off or “dockless”
potentially providing more freedom and flexibility. Bike sharing has universally been observed to
reduce personal driving and taxi use, especially for short trips (Ma, 2020). Mode-shift changes as a
result of bike sharing are reported to range from 0.3%-21% within the affected areas (Ma, 2020).
Bike sharing also has the potential to increase public transit trips - where bike-sharing and public
transport are integrated this has been shown to strengthen the benefits of both modes. The effects
of bike sharing may also vary by implementation location with one study finding that bike-share is
more likely to act as a substitute for public transport trips in larger, more dense cities while serving
an important first/last mile function in small to medium size and less denser cities. The full benefits
towards overall mode shift away from private vehicles are therefore likely to depend on the
presence of, and integration with Public Transport (Ma, 2020).
E-Scooters
One final mode receiving significant attention currently is e-scooters. E-scooters offer an
alternative for short trips and are likely to be particularly suited to the first- and last-mile of trips
when integrated with public transport. Data from trials is still emerging, but there is emerging
evidence that e-scooters can help shift trips away from private vehicles, but may also shift modes
away from walking with a lower shift from public transport and cycling (London Cycling Campaign,
2020). Analysis of trials in Portland confirm these broad trends, with mode shift being most notable
away from walking, single occupancy vehicles and ride hailing (PBOT, 2018).

33
Net zero transport: methodological appendix
2.3. Switch Fuels
Finally, we consider the need for fuel switching. This naturally involves a concurrent replacement
of the existing fleet with electric or hydrogen vehicles, the provision of new re-fuelling or re-
charging infrastructure and necessary changes to grid capacity and fuel mix to ensure the system
can be effectively powered over the long-term by renewable energy. This in itself is no easy
undertaking with many issues to consider across different vehicle types.
In the market for private vehicles one of the key concerns is that approximately a third of
households do not have off-street parking to install a home chargepoint (Energy Savings Trust,
2019). This will naturally require increased provision of public charge points or cost- and time-
effective re-charging points at convenient locations.
The transition to electric buses involves many challenges noted by participants in our workshops
and confirmed through this research, in particular concerns over limitations of power and range.
Challenges include confusion about the most appropriate technology, grid instability and limitations
for charging at stations, disjointed e-bus market place, combined with a range of financial and
institutional barriers (Sclar, 2019).
Similarly the transition to zero carbon freight also faces considerable challenge due to confusion
over competing technologies including Large-battery electric vehicles, Hydrogen fuel cells,
Biofuels, synthetic fuels, of electric road systems such as overhead conductive transmission
(Ainalis, 2020). A clear direction of travel is needed to support roll-out and uptake of the technology
most likely to deliver within the decarbonisation time frame.
Finally, the transition to zero carbon vehicles across all modes will also likely need to be supported
by incentives and restrictions. While some local authorities have programmes to support zero
emission fuel adoption, there are currently limited powers or direction to support accelerated
transitions for those places aspiring to achieve net zero faster.

34
Net zero transport: methodological appendix
3. Assumptions and targets used in carbon modelling of pathways for each place typology
Category Intervention Assumptions / targets used in proposed pathway
Negative
Carbon
Developments
Negative Carbon
Developments
Full offset of all new developments. Effectively
requires all new developments to zero carbon by
design with independently verified carbon modelling a
key determinant of whether or not they are allowed to
go ahead.
Substitute
Trips
Home Working The equivalent of 30% of commuting trips can be
avoided over the long-term.
Co-Working Spaces
An additional 2.5% uptake is enabled for commuting
purposes, reducing the commuting distance by the
difference between the long- and short- distance
average.
Replace 'Personal
Business' with
Digital Services
The equivalent of 30% personal business trips can be
avoided over the long-term.
Replace 'Leisure'
Trips / Other Escort
with Digital Services
The equivalent of 2.5% of leisure and other escort
trips (or miles) can be removed.
Local amenities
within 15 minute
walk/cycle
Vehicle miles can be reduced by an additional 20%
across other escort, personal business and leisure
trips.
Micro-Consolidation LGV delivery miles can be reduced by 30%.
Shift Modes
Active Travel Mode
Share (UK
Benchmark)
UK “benchmark” seeks 50% active modes for short-
distance trips and 11% share for longer-distance trips.
This is the same across all typologies.
Public Transport
Mode Share (UK
Benchmark)
Public transport mode share for the Polycentric
conurbation achieves 43% for short- and long-
distance trips. For other typologies public transport
share achieves 15%.
Additional Public
Transport Target
Public transport is mode share is extended to 50% of
longer-distance trips in the Polycentric conurbation
and 40% of short- and long-distance trips in all other
typologies.

35
Net zero transport: methodological appendix
Switch Fuels
Private Vehicles
Residual carbon emissions to the 80% 2030 target
can be achieved through fuel switching. Private
vehicle share is allocated on the basis of residual
private vehicle emissions following all previous
interventions.
Public Transport
Residual carbon emissions to the 80% 2030 target
can be achieved through fuel switching. Public
Transport share is allocated on the basis of residual
public transport emissions following all previous
interventions.
Freight
Residual carbon emissions to the 80% 2030 target
can be achieved through fuel switching. Freight share
is allocated on the basis of residual freight emissions
following all previous interventions.

36
Net zero transport: methodological appendix
References Ainalis, D. T. (2020). Decarbonising the UK's Long-Haul Road Freight at Minimum Economic Cost.
SRF: The Centre for Sustainable Road Freight.
Aldred, R. G. (2020). Low Traffic Neighbourhoods, Car Use, and Active Travel: evidence from the
People and Places survey of Outer London active travel interventions.
Al-Mulali, U. L.-T. (2015). The global move toward Internet shopping and its influence on pollution:
an empirical analysis. Environmental science and pollution research international, 22(13): p. 9717-
9727.
Anagnostou, E. J. (2020). Proxy evidence for state-dependence of climate sensitivity in the Eocene
greenhouse. Nat Commun 11. https://doi.org/10.1038/s41467-020-17887-x, 4436.
Anciaes, P. J. (2014). Quantifying community severance. London: UCL.
Atkins. (2018). 20mph Research Study, Process and Impact Evaluation Headline Report.
Baiocchi, G. C. (2015). A spatial typology of human settlements and their CO2 emissions in
England. Global Environmental Change, 13-21.
Barrett, M. T. (2008). Carbon Pathways Analysis: Informing Development of a Carbon Reduction
Strategy for the Transport Sector .
Blecic, I. C. (2020). Planning and Design Support Tools for Walkability: A Guide for Urban
Analysts. Sustainability.
Browne, M. A. (2011). Evaluating the use of an urban consolidation centre and electric vehicles in
central London. International Association of Traffic and Safety Sciences Research. 35. , 1-6.
Buisseret. (n.d.). 1998.
Burchell, R. L. (2002). Cost of Sprawl. TRB.
Cairns S, S. L. (2004). Smarter Choices – Changing the Way We Travel. Transport for Quality of
Life.
Cairns, S. A. (2002 ). Disappearing traffic? The story so far. Municipal Engineer 151, 13-22.
Campbell, M. W. (2020). Decarbonising Transport: The Role of Land Use, Localisation and
Accessibility. London: LGA.
Carling, K. e. (2015). Measuring transport related CO2 emissions induced by online and brick-and-
mortar retailing. Transportation Research Part D: Transport and Environment, 40: p. 28-42.
Cherrett, T. a. (2019). Last mile urban freight in the UK: how and why is it changing? Government
Office for Science.
Churchill. (2004).
CIHT. (2019). Better planning, better transport, better places. CIHT.
City Science. (2018). Spatial analysis of cycling rates on a level playing field. City Science.

37
Net zero transport: methodological appendix
CLG Communities and Local Government. (2010). Code for Sustainable Homes, Technical Guide.
77.
Cozzi, L. a. (2019, October 15). iea.org. Retrieved from Growing preference for SUVs challenges
emissions reductions in passenger car market: https://www.iea.org/commentaries/growing-
preference-for-suvs-challenges-emissions-reductions-in-passenger-car-market
Creutzig, F. B. (2015). Global typology of urban energy use and potentials for an urbanization
mitigation wedge. PNAS vol 112, 6283-6288.
Dale, S. F. (2019). The impact of the Nottingham Workplace Parking Levy on travel to work mode
share. . Loughborough University. Journal contribution. https://hdl.handle.net/2134/10067039.v1 .
De Abreu, E. S. (2018). Does home-based telework reduce household total travel? A path analysis
using single and two worker British households. J. Transp. Geogr. 73, 148–62.
de Vos, D. M. (2018). Working from home and the willingness to accept a longer commute. Ann
Reg Sci 61, 375–398.
DeFries, R. E. (2019). The missing economic risks in assessments of climate change impacts. The
Earch Institute, Columbia University, Grantham Research Institute on Climate Change and the
Environment and the Potsdam Institute for Climate Impact Research.
Dempsey, N. (2018). Railways: fares statistics. London: House of Commons Library.
DfT. (2009). Van Activity Baseline Survey 2008: Provisional Results.
Duncan, D., Méline, J., Kestens, Y., Day, K., Elbel, B., Trasande, L., & Chaix, B. (2016). Walk
Score, Transportation Mode Choice, and Walking Among French Adults: A GPS, Accelerometer,
and Mobility Survey Study. Int J Environ Res Public Health, 611.
Edwards, J. M. (2009). Shopping trip or home delivery: which hasthe smaller carbon footprint?
CILT.
EIA. (2014). US Energy Information Administration. Retrieved from Gasoline prices tend to have
little effect on demand for car travel: https://www.eia.gov/todayinenergy/detail.php?id=19191
Elliot. (1987).
Energy Savings Trust. (2019). Positioning chargepoints and adapting parking policies for electric
vehicles.
Ewing, R. B. (2007). Growing Cooler: The Evidence on Urban Developmentand Climate Change.
Washington: Urban Land Institute.
Fleming, T. T. (2013). Reallocation of road space. . NZ Transport Agency RR 530.
Foletta, N. (2011). Houten, Utrect, The Netherlands - A Case Study. ITDP Europe.
Gruber, J. E. (2013). Technical potential and user requirements for the implementation of electric
cargo bikes in courier logistics services. . Institute of Transport Research.
Habib, K. N. (2011). Joint modelling of propensity and distance for walking-trip generation.
Transportmetrica A: Transport Science , 420-436.

38
Net zero transport: methodological appendix
Hammadou, H. a. (2015). Policy packages for modal shift and CO2 reduction in Lille, France.
Transportation Research Part D: Transport and Environment, 105-116.
Helminen, V. a. (2007). Relationships between commuting distance, frequency and telework in
Finland. J. Transp. Geogr., 331–42.
Hirst, D. (2020). Active Travel: Trends, Policy and Funding. House of Commons Library.
Hook, A. C. (2020). A systematic review of the energy and climate impacts of teleworking.
Environmental Research Letters, Volume 15, Number 9.
Hössinger., R. L. (2017). Estimating the price elasticity of fuel demand with stated preferences
derived from a situational approach. Transportation Research Part A: Policy and Practice, 103,
154-171.
Humberto, M., Laboissiere, R., Giannotti, M., Marte, C. L., Cruz, D. A., & Primon, H. (2019).
Walking and walkability: do built environment measures correspond with pedestrian activity?
AmbienteConstruído, Porto Alegre, v. 19, n. 4,, 23-36.
Ingvardson, J. a. (2018). Effects of new bus and rail rapid transit systems – an international review.
Transport Reviews 38 (1), 96-116.
Jamshid, L. A. (2016). Impacts of home shopping on vehicle operations and greenhouse gas
emissions: multi-year regional study . International Journal of Sustainable Development & World
Ecology, 23:5, , 381-391.
Kantar. (2020, June 23). Online grocery growth clicks up as lockdown continues. Retrieved from
www.kantarworldpanel.com: https://www.kantarworldpanel.com/global/News/Online-grocery-
growth-clicks-up-as-lockdown-continues
Kartschmit, N. S. (2020). Walkability and its association with walking/cycling and body mass index
among adults in different regions of Germany: a cross-sectional analysis of pooled data from five
German cohorts. BMJ Open.
Kim, E. K. (2020). Neighborhood Walkability and Active Transportation: A Correlation Study in
Leisure and Shopping Purposes. Int. J. Environ. Res. Public Health, 2178.
La Branche, S. (2011). La gouvernance climatique face à la mobilité quotidienne. Le cas des
Lyonnais.
Lehner, S. a. (2018). The price elasticity of parking: a meta-analysis. Department of
Socioeconomics, Vienna University of Economics and Business.
Liao, B. v. (2019). How Does Walkability Change Behavior? A Comparison between Different Age
Groups in the Netherlands. Sustainability.
Liao, B. v. (2020). Empirical analysis of walkability using data from the Netherlands. Transportation
Research Part D: Transport and Environment.
Living Streets. (2018). The Pedestrian Pound - The Business Case for Better Streets and Places.
Living Streets.
Living Streets. (2020). Low Traffic Neighbourhoods - An Introduction for Policy Makers.

39
Net zero transport: methodological appendix
https://www.livingstreets.org.uk/media/3843/lcc021-low-traffic-neighbourhoods-intro-v8.pdf.
Lokesh, K. A. (2020). Decarbonising Transport: Travelling Less and the Role of Online
Opportunities. London: ocal Government Association.
London Cycling Campaign. (2020). Micromobility and active travel in the UK. Policy Forum of the
London Cycling Campaign.
Lyons, G. D. (2016). Guidance for transport planning and policymaking in the face of an uncertain
future. Transport Research Part A 88, 104-116.
Ma, X. Y. (2020). Bike-sharing systems’ impact on modal shift: A case study in Delft, the
Netherlands. Journal of Cleaner Production.
Marsden, G. A. (2019). Shared mobility – where now, where next? The second report of the
Commission on Travel Demand. Oxford.: Centre for Reseach into Energy Demand Solutions. .
Minx, J. B. (2013). Carbon footprints of cities and other human settlements in the UK.
Environmental Research Letters.
National Infrastructure Commission. (2018). Running out of Road - Investing in cycling in
Cambridge, Milton Keynes and Oxford. National Infrastructure Commission.
Natural Economy Northwest. (2009). The economic benefits of Green Infrastructure: The public
and business case for investing in Green Infrastructure and a review of the underpinning evidence.
Natural England, Northwest Regional Development Agency.
Neves, A. (2015). The impact of walking and cycling infrastructure on personal travel and carbon
emissions:the case of Cardiff Connect2. University of Oxford.
NICE. (2017). Air pollution: Outdoor air quality and health, NICE Guideline 70. London: NICE.
Nieuwenhuijsen, M. a. (2016). Car free cities: Pathway to healthy urban living. Environment
International.
OECD/ITF. (2015). Adapting Transport Policy to Climate Change: Carbon Valuation, Risk and
Uncertainty.
Office of Budget Responsibility. (2019, April 16). Office of Budget Responsibility. Retrieved from
Fuel Duty: https://obr.uk/forecasts-in-depth/tax-by-tax-spend-by-spend/fuel-duties/
ONS. (2019). Net zero and the different official measures of the UK's greenhouse gas emissions .
ONS. (2019). Understanding towns in England and Wales: an introduction.
ONS. (2020). Coronavirus and the social impacts on Great Britain. ONS.
ONS. (2020, May). Retail sales, Great Britain: May 2020. Retrieved from www.ons.gov.uk:
https://www.ons.gov.uk/businessindustryandtrade/retailindustry/bulletins/retailsales/may2020
O'Regan, B. M. (2009). The relationship between settlement population size and sustainable
development measured by two sustainability metrics. Environmental Impact Assessment Review,
169-178.
PBOT. (2018). E-Scooter Findings Report. PBOT.
40
Net zero transport: methodological appendix
Petronuff, N. R. (2015). Carrots and sticks vs carrots: Comparing approaches to workplacetravel
plans using disincentives for driving and incentivesfor active travel. Journal of Transport & Health
2, 563-567.
Pfeiffer, A. e. (2018). Committed emissions from existing and planned power plants and asset
stranding required to meet the Paris Agreement.
Philips, I. A. (2020). e-bike carbon savings – how much and where? . CREDS.
Piatkowski, P. M. (2017). Carrots versus Sticks: Assessing Intervention Effectiveness and
Implementation Challenges for Active Transport. Journal of Planning Education and Research, 1-
15.
Pucher, J. a. (2008). Making Cycling Irresistible: Lessons from The Netherlands, Denmark and
Germany. Transport Reviews, vol 28, 4, 495-528.
RTPI. (2018). Settlement Patterns, Urban Form and Sustainability: An Evidence Review. RTPI
Research Paper.
Ryder. (2020). Economic Benefits of the Reallocation of Street Space - Urban design and
transportation working together to save the high street. Ryder Alliance.
Satiennam, T. J. (2016). Potential for modal shift by passenger car and motorcycle users towards
Bus Rapid Transit (BRT) in an Asian developing city. IATSS Research, 121-129.
Schliwa, G. A. (2015). Sustainable city logistics - Making cargocycles viable for urban freight
transport. Research in Transportation Business and Management, 15, 50-57.
Sclar, R. G. (2019). BARRIERS TO ADOPTING ELECTRIC BUSES. Washington DC: World
Resources Institute.
Scott, K. R. (2018). Extending European energy efficiency standards to include material use: an
analysis. Climate Policy, 18:5, 627-641.
Seto K. C., S. D. (2014). IPCC: Human Settlements, Infrastructure, and Spatial Planning. Climate
Change 2014: Mitigation of Climate Change. Fifth Assessment Report to IPCC.
Seto, K. D. (2014). Human Settlements, Infrastructure and Spatial Planning. Climate Change 2014:
Mitigation of Climate Change. Contribution of Working Group III to the Fifth Assessment Report of
the Intergovernmental Panel on Climate Change.
Shaheen, S. C. (2018). The Benefits of Carpooling - The Environmental and Economic Value of
Sharing a Ride.
Smidfelt Rosqvist, L. &. (2016). Online shopping habits and the potential for reductions in carbon
dioxide emissions from passenger transport. Journal of Cleaner Production, vol. 131, 163-169.
Smidfelt Rosqvist, L. a. (2016). Online shopping habits and the potential for reductions in carbon
dioxide emissions from passenger transport. . Journal of Cleaner Production, 131: p. 163-169.
Stevens, M. (2016). Does Compact Development Make People Drive Less? Journal of the
American Planning Association.
TfL. (2018). Speed, Emissions and Health. London: http://content.tfl.gov.uk/speed-emissions-and-

41
Net zero transport: methodological appendix
health.pdf.
TfL. (2019). Evaluation of Freight Consolidation Demonstrator Projects.
Tight, M. (2018). Walking in the UK transport system: how and why is it changing? Government
Office for Science.
Transform Scotland. (2017). 20mph default speed limits for residential areas, . Edinburgh:
Transform Research & Communication.
Van Loon, P. e. (2014). The growth of online retailing: a review of its carbon impacts. . Carbon
Management, 5(3): p. 285-292.
Vogt-Schilb, A. M. (2018). When starting with the most expensive option makes sense: Optimal
timing, cost and sectoral allocation of abatement investment. Journal of Environmental Economics
and Management 88 (2018), 210-233.
Wang, H. a. (2019). Revealing Urban Carbon Dioxide (CO2) EmissionCharacteristics and
Influencing Mechanisms from thePerspective of Commuting. Accessed at:
https://www.google.com/url?sa=t&rct=j&q=&esrc=s&source=web&cd=&ved=2ahUKEwjYn8C0rc3s
AhVrSxUIHaFoB3oQFjABegQIBhAC&url=https%3A%2F%2Fwww.mdpi.com%2F2071-
1050%2F11%2F2%2F385%2Fpdf&usg=AOvVaw1P7-EpbLVqDABJ7AuGzTC2.
Wardman, M. T. (2007). Factors influencing the propensity to cycle to work. Transportation
Research Part A: Policy and Practice, 339-350.
Weber, C. J. (2010). The energy and climate change implications of different music delivery
methods. Journal of Industrial Ecology, 14(5): p. 754-769.
Weideli, D. (2013). Environmental Analysis of US Online Shopping . MIT Center for Transportation
& Logistics.
Welsh 20mph Task Force. (2020). Final Report.
Wiedmann, T. L. (2020). Scientists' warning on affluence. Nature communications.
Williams, J. (2013). The role of planning in delivering low-carbon urban infrastructure. Environment
and Planning B: Planning and Design 2013, volume 40, 683-706.
Williams, K. (2014). Urban form and infrastructure: a morphological review. Government Office for
Science Future of Cities Working Paper.
Zenghelis, D. R. (2020). Rebuilding to last: How to design an inclusive, resilient and sustainable
growth strategy after COVID-19. Report for the Aldersgate Group.
Zhang, L. &. (2012). How Built Environment Affects Travel Behavior: A Comparative Analysis of
the Connections between Land Use and Vehicle Miles Traveled in U.S. Cities. . Journal of
Transport and Land Use., 40-52.
Zuniga-Teran, A. O. (2017). Designing healthy communities: Testing the walkability model.
Frontiers of Architectural Research, 63-73.

Royal Town Planning Institute,
41 Botolph Lane, London EC3R 8DL.
Registered Charity in England (262865) & Scotland (SC037841)
For more information about this paper, visit:
www.rtpi.org.uk/netzerotransport
RTPI - Royal Town Planning Institute
Tel: 0370 774 9494