january 2021 - global ship lease | global ship lease
TRANSCRIPT

PwC 1
Investor Presentation
January 2021

2
Disclaimer
This presentation does not constitute or form part of, and should not be construed as, an offer to sell or an invitation, solicitation, or inducement to purchase or subscribe for securities
with respect to any transaction, nor shall it or any part of it form the basis of, or be relied on in connection with, any contract or commitment whatsoever. This presentation does not
constitute either advice or a recommendation regarding any securities.
The financial information and data contained in this communication is unaudited and does not conform to the U.S. Securities and Exchange Commission (“SEC”) Regulation S-X.
Accordingly, such information and data may not be included in, may be adjusted in or may be presented differently in, Global Ship Lease’s filings with the SEC. This communication
includes certain numerical measures, estimated financial information and forecasts presented as pro-forma financial measures that are not derived in accordance with generally
accepted accounting principles (“GAAP”), and which may be deemed to be non-GAAP financial measures within the meaning of Regulation G promulgated by the SEC. Global Ship
Lease believes that the presentation of these non-GAAP financial measures serves to enhance the understanding of the financial performance of Global Ship Lease. However, these
non-GAAP financial measures should be considered in addition to and not as substitutes for, or superior to, financial measures of financial performance prepared in accordance with
GAAP. Please refer to the appendix appearing at the end of this presentation and the last quarter’s earnings press release for a discussion of these non-GAAP financial measures and
a reconciliation of these measures to the most comparable GAAP measures.
No representations or warranties, express or implied are given in, or in respect of the accuracy or completeness of any information included in, this presentation.
Recipients of this presentation are not to construe its contents, or any prior or subsequent communications from or with Global Ship Lease or its representatives as financial,
investment, legal, tax, business or other professional advice. In addition, this presentation does not purport to be all-inclusive or to contain all of the information that may be required to
make a full analysis of Global Ship Lease. Recipients of this presentation should consult with their own advisers and should each make their own evaluation of Global Ship Lease and
of the relevance and adequacy of the information. Furthermore, this presentation contains certain tables and other statistical analyses (the “Statistical Information”). Numerous
assumptions were used in preparing the Statistical Information, which may not be reflected herein. Certain Statistical Information is derived from estimates and subjective judgments
made by third parties. As such, no assurance can be given as to the accuracy, appropriateness or completeness of the Statistical Information as used in any particular context; nor as
to whether the Statistical Information and/or the judgments and assumptions upon which they are based reflect present market conditions or future market performance.
Unless otherwise specified, all information in this presentation is as of the date of this presentation. Neither the delivery of this presentation nor any other communication with you
shall, under any circumstances, create any implication that there has been no change in Global Ship Lease’s affairs since such date. Except as otherwise noted herein, Global Ship
Lease does not intend to, nor will it assume any obligation to, update this presentation or any of the information included herein.

3
Safe Harbor StatementThis communication contains forward-looking statements. Forward-looking statements provide Global Ship Lease’s current expectations or forecasts of future events. Forward-looking statements include statements about Global Ship Lease’sexpectations, beliefs, plans, objectives, intentions, assumptions and other statements that are not historical facts. Words or phrases such as ‘‘anticipate,’’ ‘‘believe,’’ ‘‘continue,’’ ‘‘estimate,’’ ‘‘expect,’’ ‘‘intend,’’ ‘‘may,’’ ‘‘ongoing,’’ ‘‘plan,’’ ‘‘potential,’’‘‘predict,’’ ‘‘project,’’ ‘‘will’’ or similar words or phrases, or the negatives of those words or phrases, may identify forward-looking statements, but the absence of these words does not necessarily mean that a statement is not forward-looking. Theseforward-looking statements are based on assumptions that may be incorrect, and Global Ship Lease cannot assure you that these projections included in these forward-looking statements will come to pass. Actual results could differ materially fromthose expressed or implied by the forward-looking statements as a result of various factors
The risks and uncertainties include, but are not limited to:
• Risks relating to the acquisition of Poseidon Containers and Global Ship Lease’s ability to realize the anticipated benefits of the acquisition;
• future operating or financial results;
• expectations regarding the strength of future growth of the container shipping industry, including the rates of annual demand and supply growth;
• the length and severity of the ongoing outbreak of the novel coronavirus (COVID-19) around the world and governmental responses thereto;
• the financial condition of CMA CGM (the company’s principal charterer and main source of operating revenue) and other charterers and their ability to pay charterhire in accordance with the charters;
• the overall health and condition of the U.S. and global financial markets;
• Global Ship Lease’s financial condition and liquidity, including its ability to obtain additional financing to fund capital expenditures, vessel acquisitions and for other general corporate purposes and its ability to meet its financial covenants and repayits borrowings;
• Global Ship Lease’s expectations relating to dividend payments and forecasts of its ability to make such payments including the availability of cash and the impact of constraints under its first priority secured notes;
• future acquisitions, business strategy and expected capital spending;
• operating expenses, availability of key employees, crew, number of off-hire days, drydocking and survey requirements, costs of regulatory compliance, insurance costs and general and administrative costs;
• general market conditions and shipping industry trends, including charter rates and factors affecting supply and demand;
• assumptions regarding interest rates and inflation;
• change in the rate of growth of global and various regional economies;
• risks incidental to vessel operation, including piracy, discharge of pollutants and vessel accidents and damage including total or constructive total loss;
• estimated future capital expenditures needed to preserve Global Ship Lease’s capital base;
• Global Ship Lease’s expectations about the availability of vessels to purchase, the time that it may take to construct new vessels, or the useful lives of its vessels;
• Global Ship Lease’s continued ability to enter into or renew charters including the re-chartering of vessels on the expiry of existing charters, or to secure profitable employment for its vessels in the spot market;
• the continued performance of existing charters;
• Global Ship Lease’s ability to capitalize on management’s and directors’ relationships and reputations in the containership industry to its advantage;
• changes in governmental and classification societies’ rules and regulations or actions taken by regulatory authorities;
• expectations about the availability of insurance on commercially reasonable terms;
• unanticipated changes in laws and regulations; and
• potential liability from future litigation.
Forward-looking statements are subject to known and unknown risks and uncertainties and are based on potentially inaccurate assumptions that could cause actual results to differ materially from those expected or implied by the forward-lookingstatements. Global Ship Lease’s actual results could differ materially from those anticipated in forward-looking statements for many reasons specifically as described in Global Ship Lease’s filings with the SEC. Accordingly, you should not unduly relyon these forward-looking statements, which speak only as of the date of this communication. Global Ship Lease undertakes no obligation to publicly revise any forward-looking statement to reflect circumstances or events after the date of thiscommunication or to reflect the occurrence of unanticipated events. You should, however, review the factors and risks Global Ship Lease describes in the reports it will file from time to time with the SEC after the date of this communication.

4
NYSE:GSL 43ContainershipsPublicly Listed since 2008
$280.4 millionLTM Total Revenue(2)
$160.7 millionLTM Adjusted EBITDA(2)
$ 46.1 millionLTM Normalized Net Income(2)
Company Profile
Containership owner & lessor
Mid-size Post-Panamax & smaller ships
Operational flexibility & low slot costs
High refrigerated cargo capacity
Embedding ESG culture & practices
Strong liquidity & healthy balance sheet(¹)
Resilient business, positioned for growth
(2) LTM is last 12 months to September 30, 2020. See Appendix for reconciliation with US GAAP; EPS & Adjusted EPS
both assume conversion of Series C Preferred to Common Equity; Adjusted EPS is based on Normalized Net Income
(3) Includes charters agreed up to January 19, 2021; 2.4 years average forward cover is TEU-weighted
LeverageNet Debt As adjusted / LTM Adjusted EBITDA(2)
4.5x
EPSLTM EPS - Diluted(2)
$1.13
(1) In January 2021 Moody’s upgraded GSL credit rating from B3 / Positive to B2 / Positive
$ 34.8 millionLTM Net Income(2)
EPSLTM Adjusted EPS - Diluted(2)
$1.50Adjusted
$710.0Contracted Revenue @ Sep. 30, 2020(3)
million2.4 years

Industry Back-Drop: COVID Rebound, Fundamentals-Driven Recovery
5
Monthly Head-haul Container Trade Growth in 2020 (1)Challenging 1H 2020
Strong demand rebound in 2H 2020, accelerating into 2021
Capacity discipline shown by liner operators is a game-changer
Highly supportive supply-side fundamentals tightening supply / demand balance
Earnings and asset values on upward trajectory
COVID resilience
& rebound
Fundamentals-
driven recovery
ESG & regulatory impetus (eg. EU, IMO) to reduce carbon footprint of industry
Increase in slow steaming expected from January 2023, reducing effective fleet capacity
Uncertainty on future green fuels and propulsion putting damper on orderbook
Decarbonization
imperative
Fragmented containership owner sector, with sub-scale players
Limited number of prospective consolidators, after challenging decade for the industry
Consolidation
potential
Co
nta
ine
rize
d V
olu
me
Gro
wth
Ye
ar-
on
Ye
ar
(1) Maritime Strategies International Ltd (MSI)
-40%
-30%
-20%
-10%
0%
10%
20%
30%
40%
Jan-2
0
Feb
-20
Ma
r-2
0
Apr-
20
Ma
y-2
0
Jun-2
0
Jul-2
0
Aug-2
0
Sep-2
0
Oct-
20
No
v-2
0
Asia-Europe Asia-US North-South Intra-Regional
(1) Maritime Strategies International Ltd (MSI) – Mainlane trades are the Transpacific, Asia-Europe, and Transatlantic; Non-Mainlanes represented 71% of global volumes in 2019, which reflects a normalized year
and excludes extraordinary impact of Covid-19
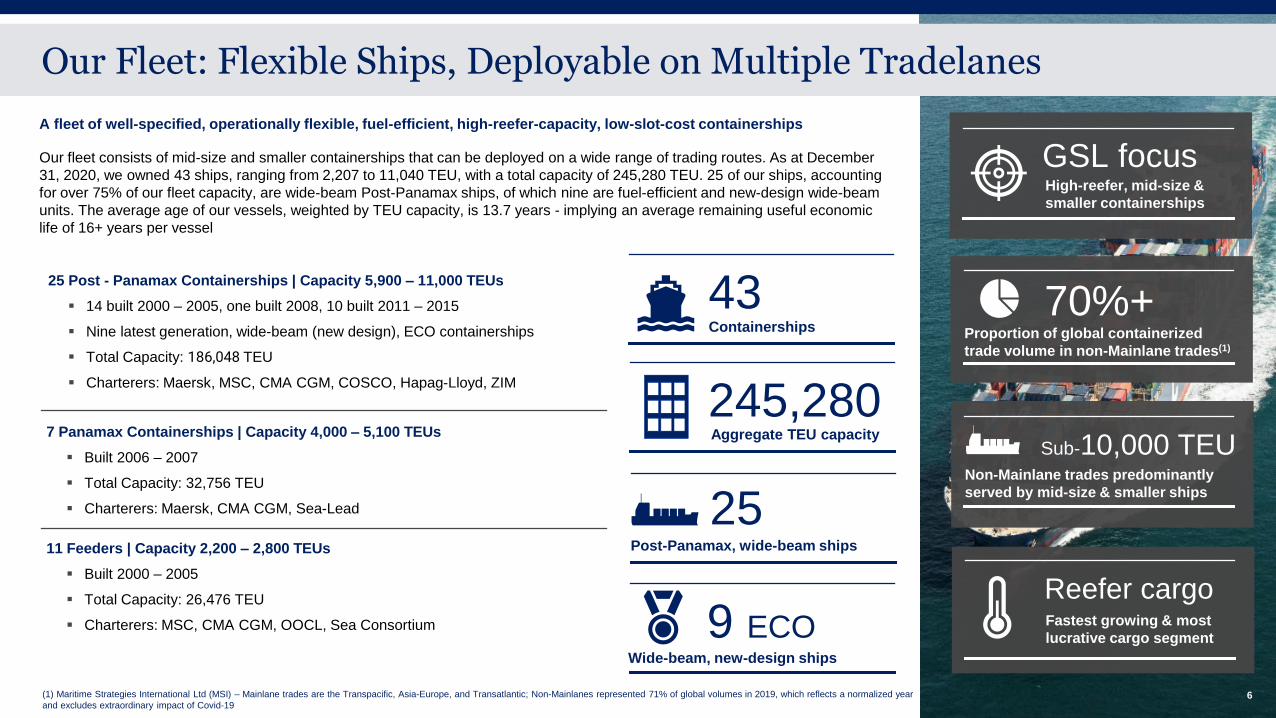
A fleet of well-specified, operationally flexible, fuel-efficient, high-reefer-capacity, low-slot-cost containerships
Our fleet consists of mid-size and smaller containerships that can be deployed on a wide range of trading routes. As at December
31, 2020, we owned 43 ships, ranging from 2,207 to 11,040 TEU, with a total capacity of 245,280 TEU. 25 of our ships, accounting
for over 75% of our fleet capacity, are wide-beam Post-Panamax ships, of which nine are fuel-efficient and new-design wide-beam
units. The average age of our vessels, weighted by TEU capacity, is 13.7 years - implying an average remaining useful economic
life of 16+ years per vessel
11 Feeders | Capacity 2,200 – 2,800 TEUs
▪ Built 2000 – 2005
▪ Total Capacity: 26,476 TEU
▪ Charterers: MSC, CMA CGM, OOCL, Sea Consortium
7 Panamax Containerships | Capacity 4,000 – 5,100 TEUs
▪ Built 2006 – 2007
▪ Total Capacity: 32,756 TEU
▪ Charterers: Maersk, CMA CGM, Sea-Lead
25 Post - Panamax Containerships | Capacity 5,900 – 11,000 TEUs
▪ 14 built 2000 – 2005, one built 2008, 10 built 2011 – 2015
▪ Nine latest generation, wide-beam (new design), ECO containerships
▪ Total Capacity: 186,048 TEU
▪ Charterers: Maersk, MSC, CMA CGM, COSCO, Hapag-Lloyd, ZIM
Our Fleet: Flexible Ships, Deployable on Multiple Tradelanes
245,280Aggregate TEU capacity
43
25Post-Panamax, wide-beam ships
Containerships
9 ECOWide-beam, new-design ships
6
GSL focusHigh-reefer, mid-size &
smaller containerships
70%+Proportion of global containerized
trade volume in non-Mainlane trades(1)
Sub-10,000 TEUNon-Mainlane trades predominantly
served by mid-size & smaller ships
Reefer cargoFastest growing & most
lucrative cargo segment

Green Fuel(s) & Propulsion
Not yet commercially available / viable
Increased Slow Steaming
Will reduce effective fleet capacity
40%IMO set CO2 emissions by 2030(1)
Reduction
Industry focused on decarbonization
Container Shipping
GSL core focus:
5,500-10,000 TEU
18.6
15.5
11.4 10.3
8.8 7.7
6.4
0.1-1.3 kTEU
1.3-2.9 kTEU
2.9-3.9 kTEU
3.9-5.2 kTEU
5.2-7.6 kTEU
7.6-12 kTEU
12+ k TEU
(1) Maritime Strategies International Ltd (MSI); reduction in CO2 emissions “per transport work”
(2) Please refer to Appendix – ESG for GSL specific information on CO2 emissions
“Eco” Design Global Containership Fleet (1)
Emissions by Containership Segment (1)Emissions by Transportation Type (1)
ESG & Decarbonization
Container shipping compares favorably to other transport modes for CO2
emissions
7
GSL core focus on mid-size, Post-Panamax, fuel-efficient containerships combines
high operational flexibility with low emissions per cargo slot(2)
GSL is working with industry think-tanks on next generation fuel and propulsion to better understand commercial availability and economic viability
Age profile of, and limited investment in, mid-size and smaller ship segments mean that “Eco” design ships are uncommon in these segments
0 500 1,000 1,500 2,000
Air
Road
Rail
ContainerShipping
CO2 Emissions (g/Ton-km)
CO2 Emissions (g/dwt/Nautical Mile)
22.3% 22.4% 24.4%12.4% 9.1%
41.5%
83.1%
77.7% 77.6% 75.6%87.6% 90.9%
58.5%
16.9%
Sub-2k TEU 2-2.9k TEU 3-3.9k TEU 4-5.09k TEU 5.1-7.49k TEU 7.5-9.9k TEU 10k+ TEU
Eco Design Non-Eco Design
Eco Design: 23% | Non-Eco Design: 77% (excluding 10k+ TEU)
Low comparative CO2 emissions
Considerable R&D in progress
Expected from January 2023

Our Contract Cover: Strong Base with Upside Potential in Firming Market
$710.0Contracted Revenue @ Sep. 30, 2020¹
million
2.4 yearsAv. Contract Cover @ Sep. 30, 2020¹
GSL ships fixed in 2H20 v. 2Q20-lows
19 Agreed for GSL ships since July 2020
(1) Table shows charters updated as at September 30, 2020 - adjusted to include charters, acquisitions, and divestments agreed up to January 19, 2021. The chart shows the quarter within which the mid-point expiry of any given charter falls, unless a specific redelivery notice has otherwise been tendered, in which case the chart reflects the quarter for that redelivery notice. Contracted revenue is for the median charter period (excluding extension options), is net of liner address commission, and is calculated as at September 30, 2020 - adjusted to include charters, acquisitions, and divestments agreed up to January 19, 2021. Expected Adjusted EBITDA, a non-GAAP financial measure, represents expected net income available to common shareholders before interest income and expense, income taxes, depreciation and amortization, and earnings allocated to preferred shares. Percentage of Fleet Adjusted EBITDA Covered by Contracts for a given year assuming open vessels are employed at 10-year historic average charter rates net of 5% commissions and pro-rating operating costs and management fees.
8
Rates up &
terms longer
charters
Firm charter cover, assuming median redelivery date
New charters (agreed 2H2020 & YTD2021) - firm cover, assuming median redelivery date
Charter periods at option of / callable by Charterers (also assuming median redelivery date)
Vessel TEU Built Charter Agreed Charterer 1Q 2Q 3Q 4Q 1Q 2Q 3Q 4Q 1Q 2Q 3Q 4Q 1Q 2Q 3Q 4Q
Keta 2,207 2003 4Q19/1Q20/3Q20 OOCL $9,400 $8,000 $8,000
Julie 2,207 2002 3Q19/2Q20/3Q20 CMA CGM / Seacon $6,600
Kumasi 2,207 2002 3Q16/3Q20 CMA CGM
Marie Delmas 2,207 2002 3Q16/3Q20 CMA CGM
La Tour 2,272 2001 4Q19/3Q20 MSC
Manet 2,272 2001 4Q19/2Q20/3Q20/4Q20 COSCO / Sea-Lead $6,750 $7,750
Maira 2,506 2000 1Q20/2Q20 MSC / Confidential $8,250 $9,000
Nikolas 2,506 2000 1Q20/2Q20 MSC / Confidential $9,000 $9,000
Newyorker 2,506 2001 1Q20/2Q20 MSC $8,000
Athena 2,762 2003 1Q19/1Q20 MSC $9,000
GSL Valerie 2,824 2005 2Q19/1Q20 MSC $9,000
CMA CGM Sambhar 4,045 2006 4Q07 CMA CGM
CMA CGM America 4,045 2006 1Q08 CMA CGM
CMA CGM Jamaica 4,298 2006 2Q08 CMA CGM
CMA CGM Alcazar 5,089 2007 3Q08/4Q20 CMA CGM
GSL Chateau d'If 5,089 2007 4Q08/4Q20 CMA CGM / Hapag-Lloyd
Dolphin II 5,095 2007 4Q19/3Q20/4Q20 F-Tech / Sea-Lead / OOCL
Orca I 5,095 2006 2Q19 Maersk
Tasman 5,936 2000 2Q19 Maersk
Dimitris Y 5,936 2000 2Q19/3Q20 ZIM
Ian H 5,936 2000 2Q19 ZIM
GSL Vinia 6,080 2004 4Q19 Maersk
GSL Christel Elisabeth 6,080 2004 4Q19 Maersk
Agios Dimitrios 6,572 2011 4Q16 MSC
CMA CGM Berlioz 6,621 2001 4Q07 CMA CGM
GSL Christen 6,840 2002 4Q19/1Q20/3Q20 Confidential / Maersk Conf. Conf. Average $12,830 (to median redelivery)
GSL Nicoletta 6,840 2002 4Q19/3Q20 Confidential / MSC
Alexis 6,877 2015 4Q18 CMA CGM
Olivia I 6,877 2015 4Q18 CMA CGM
Mary 6,927 2013 4Q18 CMA CGM
Kristina 6,927 2013 4Q18 CMA CGM
Katherine 6,927 2013 4Q18 CMA CGM
Alexandra 6,927 2013 4Q18 CMA CGM
GSL Kalliopi 7,847 2004 2Q19 Maersk
GSL Grania 7,847 2004 2Q19 Maersk
GSL Eleni 7,847 2004 2Q19 Maersk
MSC Tianjin 8,667 2005 2Q19 MSC
MSC Qingdao 8,667 2004 2Q19 MSC
GSL Ningbo 8,667 2004 3Q18/3Q20 Maersk / MSC
UASC Al Khor 9,115 2015 1Q19 Hapag-Lloyd
Anthea Y 9,115 2015 1Q15/2Q20/4Q20 COSCO
Maira XL 9,115 2015 1Q15/3Q20 COSCO / ONE
CMA CGM Thalassa 11,040 2008 4Q07 CMA CGM
% of Fleet Annualized Adjusted EBITDA Covered by Contract
$13,250 (to 4Q24)
$10,000$9,000
Average $12,825
$14,500
$33,750
$33,750
$16,000
$14,500
$24,500
$39,200
$14,500
$18,000
$34,000
$23,000 to 2Q24 (Scrubber-Fitted)
$16,500 (to 3Q24)
$23,000 through 1Q21; then $19,000 to 2Q24 (Scrubber Installation Cancelled)
$39,200 $23,500 $38,000
100% 93% 73%
$14,500
$14,500
$14,500
$34,000
$25,910 (to 2Q24)
$25,910 (to 1Q24)
$25,910
Options to 4Q24 at $17,750
Confidential
$31,650
$25,910 (to 2Q24)
46%
$47,200 (to 4Q25)
2023
$9,900
$12,500 $20,000
$20,000 (Scrubber-Fitted)
2021 2022
$9,000
2020
$25,350
$25,350
$8,000
$8,000
$8,500
$9,400
$13,250 (to 4Q24)
$8,800 $7,250
$12,500
$25,350
$9,000
$7,000
$9,000
$12,850
$9,000
Expected Adjusted EBITDA ~$6.0 million
Expected Adjusted EBITDA ~$6.5 million
$9,250
$9,800
$9,800
$9,300
$9,300
$13,500
Options to 4Q24 at $18,900
$22,500
$25,910 (to 1Q24)
$25,910 (to 2Q24)
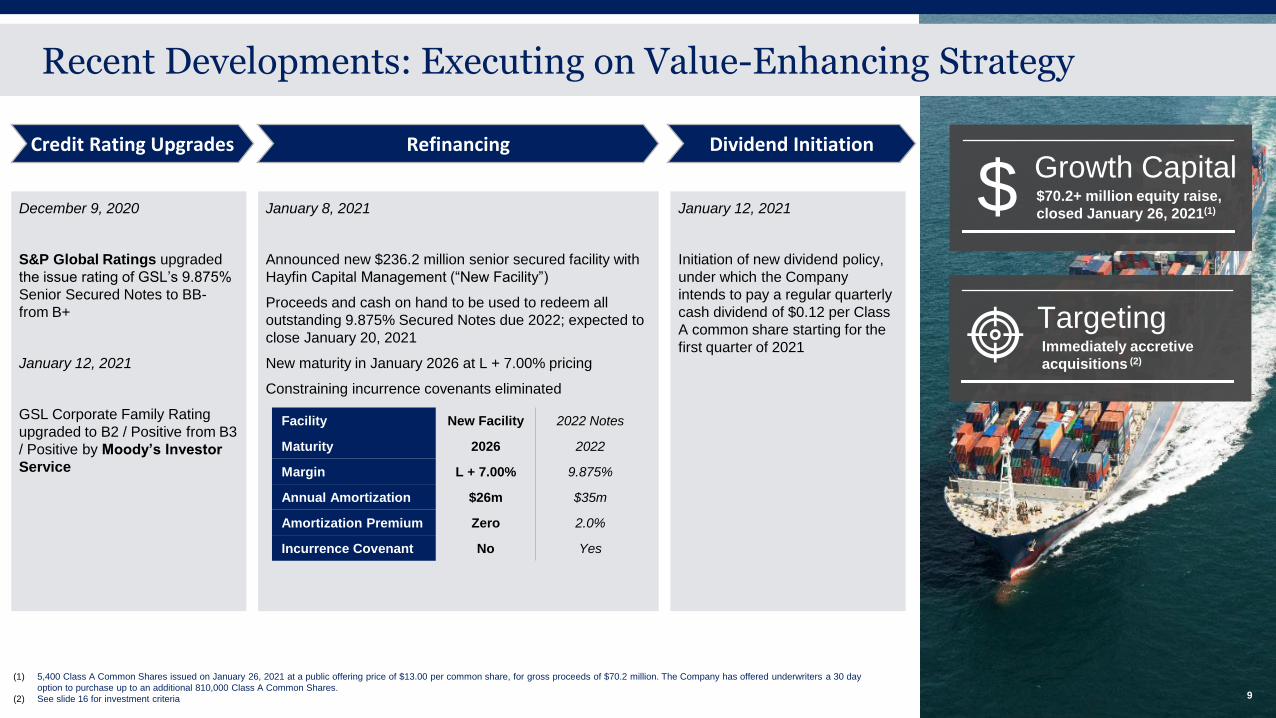
Recent Developments: Executing on Value-Enhancing Strategy
Credit Rating Upgrades Refinancing
January 8, 2021
Announced new $236.2 million senior secured facility with
Hayfin Capital Management (“New Facility”)
Proceeds and cash on hand to be used to redeem all
outstanding 9.875% Secured Notes due 2022; expected to
close January 20, 2021
New maturity in January 2026 at L + 7.00% pricing
Constraining incurrence covenants eliminated
Facility New Facility 2022 Notes
Maturity 2026 2022
Margin L + 7.00% 9.875%
Annual Amortization $26m $35m
Amortization Premium Zero 2.0%
Incurrence Covenant No Yes
Dividend Initiation
January 12, 2021
Initiation of new dividend policy,
under which the Company
intends to pay a regular quarterly
cash dividend of $0.12 per Class
A common share starting for the
first quarter of 2021
December 9, 2020
S&P Global Ratings upgraded
the issue rating of GSL’s 9.875%
Senior Secured Notes to BB-
from B+
January 12, 2021
GSL Corporate Family Rating
upgraded to B2 / Positive from B3
/ Positive by Moody’s Investor
Service
9
Growth Capital$70.2+ million equity raise,
closed January 26, 2021(1)$
(1) 5,400 Class A Common Shares issued on January 26, 2021 at a public offering price of $13.00 per common share, for gross proceeds of $70.2 million. The Company has offered underwriters a 30 day
option to purchase up to an additional 810,000 Class A Common Shares.
(2) See slide 16 for investment criteria
Targeting Immediately accretive
acquisitions (2)

(1) As Adjusted basis to give effect to events since September 30, 2020 (i) the issuance of 531,428 depositary shares (representing an interest in 5,314 Series B Preferred Shares) of $11.9 million
aggregate principal amount of Series B in connection with the At Market Issuance Sales Agreement for net proceeds of $11.9 million, (ii) the sale of $1.7 million aggregate principal amount of 2024
Notes for net proceeds of $1.7 million under the Notes ATM Program, (iii) the refinancing of our 2022 Notes, (iv) the full repayment of CITI Credit Facility, (v) the issuance of 12,955,188 Class A
common shares upon the conversion of 250,000 of the Company’s Series C Preferred Shares and (vi) the issuance of 5,400,000 Class A common shares at an offering price of $13 per share
(2) Hayfin includes both New Facility and Valerie facility of $236.2 million and $6.7 million, respectively 10
Pro forma Sources of Debt Capital (9/30/20)(1)Capitalization
$ in millionsAs of
9/30/2020As Further Adjusted(1)
Cash $113.9 $153.5
Total Debt 830.3 798.4
Net Debt 716.4 644.9
Series B Preferred 43.8 57.1
Book Value of Equity 398.0 456.2
Total Capitalization 1,272.1 1,311.7
Credit Statistics
LTM Adj. EBITDA $160.7 $160.7
Debt / Adj. EBITDA 5.2x 5.0x
Net Debt / Adj. EBITDA 4.5x 4.0x
2024 Senior Unsecured
Notes
CIT
CACIB
Blue Ocean
Deutsche Bank
ABN Amro
HellenicSiemens
CTBCBank Sinopac
HCOB
Banque Palatine
Chailease
Re-fi:Old: 9.875% NotesNew: Hayfin(2)
Capitalization Overview & Debt Capital
10

-10.0%
-5.0%
0.0%
5.0%
10.0%
15.0%
20.0%
0.0
50.0
100.0
150.0
200.0
250.0
20
00
20
01
20
02
20
03
20
04
20
05
20
06
20
07
20
08
20
09
20
10
20
11
20
12
20
13
20
14
20
15
20
16
20
17
20
18
20
19
E
20
20
F
20
21
F
Mainlane Trades Non-mainlane East-West
North-South Intra-Regional
World GDP Growth (RH Axis) Containerised Trade Growth (RH Axis)
(1) Maritime Strategies International Ltd (MSI) – Forecasts (F) for 2020 & 2021 are based on data available in January 2021, and may be subject to significant change
(2) MSI forecast demand growth for FY2020 in our 1Q2020 results presentation was -7.4%. Forecast growth has been upgraded to -3.0%: an improvement of 4.4 percentage points
Macro: Challenging 1H 2020, Followed by Significant Rebound
6.6%1H 2020 container volumes v. 1H 2019
down¹
ReboundLed by strong fundamentals recovery
11
FY 2020F container vols. v. FY 2019²
down¹3.0%
FY 2021F container vols. v. FY 2020F
up¹7.1%
Ye
ar-
on
-Ye
ar
Gro
wth
(R
ed
& B
lac
k L
ine
s)
Co
nta
ine
rize
d V
olu
me
(T
EU
mm
)
-8.2%
15.2%
-3.0%
7.1%
Global GDP & Container Trade Growth 2000 – 2021F(¹)
Financial
Crisis
COVID-
19
Covid-19 Impact
Covid-19 Impact
Market Recovery
Market Recovery

4,249
2,745
1,697 1,297
5,515
3,878
2,0441,538
Maersk CMA CGM Hapag Lloyd CoscoShipping
9M2019 9M2020
Our Liner Customers: New Industry Norm Capacity Discipline
12
89 - 190%Y-o-Y increase in CCFI & SCFI indices
(1) Maritime Strategies International Ltd (MSI)
(2) Capital IQ, publicly available releases
10+ years¹Record high rates China to USA (WC)
Liner Operator Freight Rate Indices for China Exports, 2019 – 2020(¹)
600
800
1,000
1,200
1,400
1,600
1,800
2,000
2,200
2,400
2,600
2,800
3,000
Fre
igh
t R
ate
In
de
x
Jan-2
019
Feb-2
019
Mar-
2019
Apr-
2019
May-2
019
Jun-2
019
Jul-2
01
9
Aug-2
019
Sep-2
019
Oct-
2019
Nov-2
019
Dec-2
019
Jan-2
020
Feb-2
02
0
Mar-
2020
Apr-
2020
May-2
020
Jun-2
020
Jul-2020
Aug-2
020
Sep-2
020
Oct-
2020
Nov-2
020
Dec-2
020
Shanghai Containerized Freight Index (Composite)
China Containerized Freight Index (Composite)Year-on-year
gains
Chinese New Year & commencement of
COVID-19 lock-down
$ 000s
Strong Liner Results: EBITDA Comparison (2)
+30% +19%+20%+41%

(1) Maritime Strategies International Ltd (MSI)
(2) MSI - as at December 31, 2020; down from 11.7% in June 2020
(3) MSI - high proportion of operator-owned idle capacity during 8M20 (period of elevated idle capacity) reflects capacity discipline from liners: eg. blanked sailings for larger ships
69%Liner capacity discipline 8M 2020
liner-
owned³
1.2%Down from ~12% at 2Q 2020 peak
idle
capacity²
Positive Supply-Side Trends: Idle Capacity Down, Ship Recycling Active
Idle Fleet Peaked in 2Q2020; Now Trending Down Sharply(¹)
202,000TEU capacity recycled in 2020¹
13
0.0%
0.5%
1.0%
1.5%
2.0%
2.5%
3.0%
3.5%
0
100
200
300
400
500
600
700
200
0
200
1
200
2
200
3
200
4
200
5
200
6
200
7
200
8
200
9
201
0
201
1
201
2
201
3
201
4
201
5
201
6
201
7
201
8
201
9
202
0
5,100+ TEU
4,000-5,099 TEU
3,000-3,999 TEU
2,000-2,999 TEU
Sub-2,000 TEU
Scrapping as % of Fleet (RH Axis)
Cap
ac
ity S
cra
pp
ed
(T
EU
kk
)
Ship Recycling Market Active Again After COVID-19 Shut-Down(¹)
Sc
rap
pin
g t
o F
lee
t R
ati
o
0.0%
2.0%
4.0%
6.0%
8.0%
10.0%
12.0%
14.0%
16.0%
0.0
0.3
0.6
0.9
1.2
1.5
1.8
2.1
2.4
2.7
3.0 12,000 + TEU 7,600-11,999 TEU
5,200-7,599 TEU 3,900-5,200 TEU
2,900-3,899 TEU 1,300-2,899 TEU
sub-1,300 TEU Idle % of Total Fleet (RH Axis)
Idle
Ca
pa
cit
y (
TE
U m
m)
Idle
Fle
et
Rati
o (
Re
d L
ine
)
2009 2010 2011 2012 2013 2014 2015 2016 2017 2018 2019 2020

1.3%Our focus segments 2,000 – 9,999 TEU
0.1%Core mid-size post-panamax segment
orderbook
to fleet¹
40+ years¹Record low orderbook to fleet (9.9%)²
Supportive Fundamentals: Negligible Fleet Growth, Minimal Orderbook
14(1) Maritime Strategies International Ltd (MSI) – as at December 31, 2020; orderbook deliveries phased over the next 2 - 3 years.
(2) As at respective year-ends
Minimal Orderbook for our Focus Segments(¹)
Delivered Scrapped Net Growth
Sub-2
,000 T
EU
2,0
00 –
2,9
99 T
EU
3,0
00 –
3,9
99 T
EU
4,0
00 –
5,0
99 T
EU
5,1
00 –
7,4
99 T
EU
7,5
00 –
9,9
99 T
EU
10,0
00+
TE
U
0.4% 2.1% (0.9%) (3.1%) (2.4%) 1.2% 14.1%CAGR
Fle
et
Gro
wth
(T
EU
mm
)
(1.0)
1.0
2.0
3.0
5.0
4.0
Net Fleet Growth 2016 – 2020(¹)
Our focus segments
0.0
0.2
0.4
0.6
0.8
1.0
1.2
1.4
1.6
1.8
2.0
2.2
2,0
00 –
2,9
99 T
EU
4,0
00 –
5,0
99 T
EU
5,1
00 –
7,4
99 T
EU
7,5
00 –
9,9
99 T
EU
10,0
00+
TE
U
3,0
00 –
3,9
99 T
EU
Sub-2
,000 T
EU
Cap
ac
ity o
n O
rde
r (T
EU
mm
)
Our focus segments
Future Green Fuel(s)
& Propulsion
Uncertainty restraining newbuilding
?
orderbook
to fleet¹
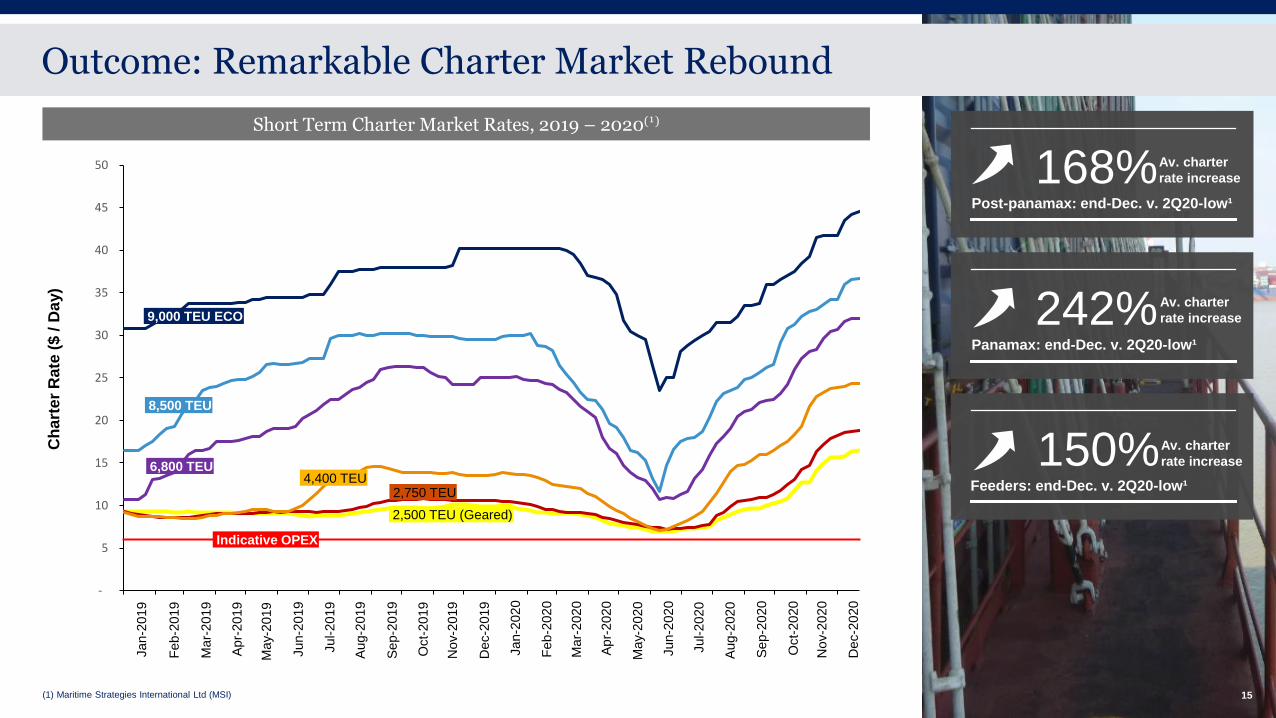
168%Post-panamax: end-Dec. v. 2Q20-low¹
Outcome: Remarkable Charter Market Rebound
15(1) Maritime Strategies International Ltd (MSI)
Ch
art
er
Rate
($ /
Da
y)
-
5
10
15
20
25
30
35
40
45
50
Jan-2
019
Feb-2
019
Mar-
2019
Apr-
2019
May-2
019
Jun-2
019
Jul-2019
Aug-2
019
Sep-2
019
Oct-
2019
Nov-2
019
Dec-2
019
Jan-2
02
0
Feb
-2020
Mar-
2020
Apr-
2020
Ma
y-2020
Jun-2
020
Jul-2020
Aug-2
020
Sep-2
020
Oct-
2020
Nov-2
020
Dec-2
020
Short Term Charter Market Rates, 2019 – 2020(¹)
Indicative OPEX
9,000 TEU ECO
8,500 TEU
6,800 TEU4,400 TEU
2,750 TEU
2,500 TEU (Geared)
242%Panamax: end-Dec. v. 2Q20-low¹
Av. charter
rate increase
150%Feeders: end-Dec. v. 2Q20-low¹
Av. charter
rate increase
Av. charter
rate increase

Looking Ahead: Poised for Value-Accretive Growth
Sweet spot: existing ships,not newbuildings
Primary focus: mid-life, mid-size Post-Panamax containerships
Preferred vessels for liner operators, facilitating longer charter contracts
High operational flexibility, low costs and emissions per cargo slot
Flexible & agile
Short-medium term time horizon on returns, to allow adjustment of strategy to evolving decarbonization environment
Position company to be legacy-problem-free, with a strong cash position, to capitalize on next-generation green technologies when economically viable
ESG & economics well-aligned
Full life-cycle approach to minimizing carbon footprint
Optimize operation, and extend economic life, of existing ships
Build new ships when next-generation green fuels, propulsion technology, and supporting infrastructure are commercially available and viable
Risk averse approach,compelling returns
Target immediately cash-accretive deals, generating unlevered FCF yields and IRR in teens or above
Strong downside protection, with limited economic depreciation: ships acquired at modest premium to scrap
Limited residual value risk, with compelling upside potential over the remaining life of the asset
16

Summary
Extensive contract cover$710 million & 2.4 years TEU-weighted contract cover as at September 30, 2020
Debt service & CAPEX covered by contracted cash flows
Proven platform for selective & accretive growth
Resilient market, strengthening fast
Freight rates and charter rates on upward trajectory
Impressive results from liner operators in 9M2020; strong guidance for FY2020
Spot market charter rates up 150 – 242% since 2Q2020 low
Attractive fleet, supportive supply-side fundamentals
Sweet spot: high-reefer, mid-size Post-Panamax & smaller containerships
Idle capacity falling, ship recycling yards active again after 2Q shut-down
Negligible orderbook pipeline, with net negative fleet growth in key sizes
Strategic priorities, pivoting to growth
Safety & welfare of personnel at sea and on shore; embedding ESG culture
Delivered on re-fi of 9.875% Notes; implementing dividend from 1Q2021
Continue to build value in a strengthening market, through selective acquisitions
Strong balance sheet,positive credit outlook
$114 million cash on balance sheet as at September 30, 2020
Moody’s upgrade to B2 / Positive; no material debt maturities before mid-2022
Multiple sources of alternate capital: public (GSL-B, GSL-D)(¹) & private (banks)
17(1) See investor section of our website (www.globalshiplease.com) for details of our traded securities

PwC
Appendix
▪ Management & Board of Directors
▪ Financial Statements & Debt Structure
▪ EBITDA, Net Debt, and EPS Reconciliations
▪ EBITDA Calculator and CAPEX Guidance
▪ Diversification of Charterer & Shareholder Base
▪ Additional Market Data
▪ ESG

19
Experienced Management Team
Name Background
George Youroukos▪ Executive Chairman since 2018▪ Over 25 years of experience in Shipping, and founded Technomar in 1994
Ian J. Webber▪ Chief Executive Officer since August 2008▪ Previously as Partner at PriceWaterhouse and Chief Financial Officer of CP Ships Limited
Tassos Psaropoulos▪ Chief Financial Officer since November 2018▪ Over 12 years of experience in finance in shipping, and previously as Chief Financial Officer of Poseidon Containers and Technomar
which he joined in 2011
Thomas A. Lister▪ Chief Commercial Officer since August 2008▪ From April 2017 until the strategic combination with Poseidon Containers in November 2018 also served as Chief Financial Officer
Previously a ship financier at DVB Bank, and executive at a shipowner and various liner shipping companies and their agents
Maria Danezi▪ Company Secretary since November 2018▪ Also serves as Head of the Legal Team at Technomar Shipping, where she has worked since 2002
George Giannopoulos▪ Head of Internal Audit since November 2018▪ Served as Financial Controller from 2015 to 2018 at Technomar Shipping
20
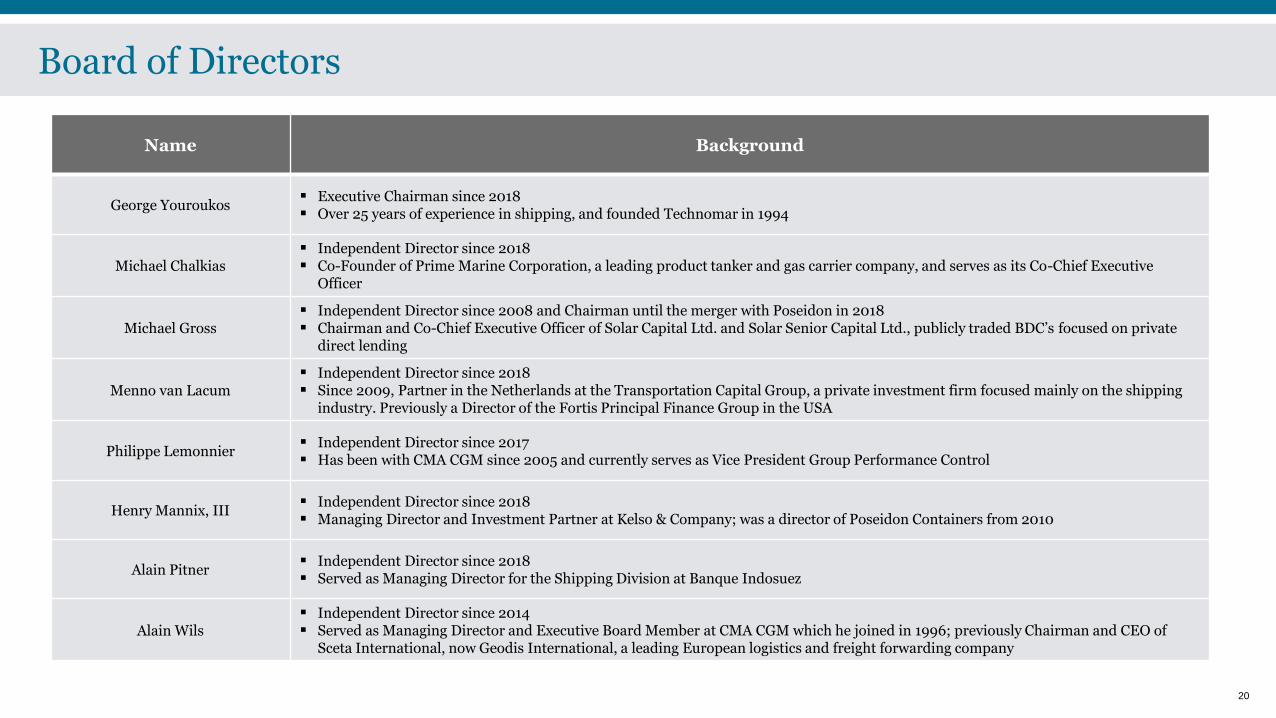
Board of Directors
Name Background
George Youroukos▪ Executive Chairman since 2018▪ Over 25 years of experience in shipping, and founded Technomar in 1994
Michael Chalkias▪ Independent Director since 2018▪ Co-Founder of Prime Marine Corporation, a leading product tanker and gas carrier company, and serves as its Co-Chief Executive
Officer
Michael Gross▪ Independent Director since 2008 and Chairman until the merger with Poseidon in 2018▪ Chairman and Co-Chief Executive Officer of Solar Capital Ltd. and Solar Senior Capital Ltd., publicly traded BDC’s focused on private
direct lending
Menno van Lacum▪ Independent Director since 2018▪ Since 2009, Partner in the Netherlands at the Transportation Capital Group, a private investment firm focused mainly on the shipping
industry. Previously a Director of the Fortis Principal Finance Group in the USA
Philippe Lemonnier▪ Independent Director since 2017▪ Has been with CMA CGM since 2005 and currently serves as Vice President Group Performance Control
Henry Mannix, III▪ Independent Director since 2018▪ Managing Director and Investment Partner at Kelso & Company; was a director of Poseidon Containers from 2010
Alain Pitner▪ Independent Director since 2018▪ Served as Managing Director for the Shipping Division at Banque Indosuez
Alain Wils▪ Independent Director since 2014▪ Served as Managing Director and Executive Board Member at CMA CGM which he joined in 1996; previously Chairman and CEO of
Sceta International, now Geodis International, a leading European logistics and freight forwarding company

Financial Statements: Balance Sheet at September 30, 2020 (Unaudited)September 30, 2020 December 31, 2019
ASSETS
CURRENT ASSETS
Cash and cash equivalents $ 98,964 $ 138,024
Restricted cash 8,728 3,909
Accounts receivable, net 2,356 2,350
Inventories 5,415 5,595
Prepaid expenses and other current assets 6,075 8,132
Due from related parties 2,371 3,860
Assets held for sale - -
Total current assets $ 123,909 $ 161,870
NON - CURRENT ASSETS
Vessels in operation $ 1,148,116 $ 1,155,586
Advances for vessels acquisitions and other additions 4,047 10,791
Intangible assets - charter agreements 49 1,467
Deferred charges, net 18,858 16,408
Restricted cash, net of current portion 6,216 5,703
Total non - current assets 1,177,286 1,189,955
TOTAL ASSETS $ 1,301,195 $ 1,351,825
LIABILITIES AND SHAREHOLDERS' EQUITY
CURRENT LIABILITIES
Accounts payable $ 9,469 $ 9,052
Accrued liabilities 21,852 22,916
Current portion of long-term debt and deferred financing costs 81,313 87,532
Deferred revenue 6,115 9,987
Due to related parties 153 109
Total current liabilities $ 118,902 $ 129,596
LONG-TERM LIABILITIES
Long - term debt, net of current portion and deferred financing costs $ 735,509 $ 809,357
Intangible liability-charter agreements 4,964 6,470
Total non - current liabilities 740,473 815,827
Total liabilities $ 859,375 $ 945,423
Commitments and Contingencies - -
SHAREHOLDERS' EQUITY
Class A common shares – authorized 214,000,000 shares with a $0.01 par value; 17,741,008 shares issued and outstanding (2019 – 17,556,738 shares) 177 175
Class B common shares – authorized 20,000,000 shares with a $0.01 par value; nil shares issued and outstanding (2019 – nil shares) - -
Series B Preferred Shares – authorized 44,000 shares with a $0.01 par value; 16,655 shares issued and outstanding (2019 – 14,428 shares) - -
Series C Preferred Shares – authorized 250,000 shares with a $0.01 par value; 250,000 shares issued and outstanding (2019 - 250,000 shares) 3 3
Additional paid in capital 574,186 565,586
Accumulated deficit (132,546) (159,362)
Total shareholders' equity 441,820 406,402
TOTAL LIABILITIES AND SHAREHOLDERS' EQUITY $ 1,301,195 $ 1,351,825
(Expressed in thousands of U.S. dollars, except share data)
21

Financial Statements: P&L for 3Q 2020 & 9M 2020 (Unaudited)(Expressed in thousands of U.S. dollars, except share data)
Three months ended September 30, Nine months ended September 30,
2020 2019 2020 2019
OPERATING REVENUES
Time charter revenue (includes related party revenues of $37,027 and $40,409 for each of the three month
periods ended September 30, 2020 and 2019, respectively, and $111,551 and $112,887 for each of the nine
month periods ended September 30, 2020 and 2019, respectively) $ 70,520 $ 65,947 $ 212,843 $ 193,548
OPERATING EXPENSES:
Vessel operating expenses (includes related party vessel operating expenses of $3,276 and $2,773 for each
of the three month periods ended September 30, 2020 and 2019, respectively, and $9,381 and $7,006 for
each of the nine month periods ended September 30, 2020 and 2019, respectively)25,442 21,537 75,124 63,302
Time charter and voyage expenses (includes related party time charter and voyage expenses of $600 and
$478 for each of the three month periods ended September 30, 2020 and 2019, respectively, and $1,801
and $1,328 for each of the nine month periods ended September 30, 2020 and 2019, respectively) 2,537 2,420 8,718 6,055
Depreciation and amortization 11,844 11,174 34,970 32,884
Vessel impairment losses - - 8,497 -
General and administrative expenses 1,619 2,115 6,378 7,083
Loss on sale of vessels 244 - 244 -
Operating Income 28,834 28,701 78,912 84,224
NON OPERATING INCOME/(EXPENSES)
Interest income 66 414 897 1,198
Interest and other finance expenses (14,994) (18,424) (50,533) (56,484)
Other income, net 688 881 337 2,117
Total non operating expenses (14,240) (17,130) (49,299) (53,169)
Income before income taxes 14,594 11,572 29,613 31,055
Income taxes (47) - (50) 40
Net Income 14,547 11,572 29,563 31,095
Earnings allocated to Series B Preferred Shares (957) (765) (2,747) (2,297)
Net Income available to Common Shareholders $ 13,590 $ 10,807 $ 26,816 $ 28,798
22

Financial Statements: Cash flows for 3Q 2020 & 9M 2020 (Unaudited)(Expressed in thousands of U.S. dollars)
Three months ended September 30, Nine months ended September 30,
2020 2019 2020 2019
Cash flows from operating activities:
Net income $ 14,547 $ 11,572 $ 29,563 $ 31,095
Adjustments to reconcile net income to net cash provided by operating activities:
Depreciation and amortization $ 11,844 $ 11,174 $ 34,970 $ 32,884
Vessel impairment losses - - 8,497 -
Loss from vessel sale 244 244
Amortization of deferred financing costs 1,109 755 3,030 2,244
Amortization of original issue discount/premium on repurchase of notes 173 202 2,455 607
Amortization of intangible liability/asset-charter agreements (443) 490 (88) 1,436
Share based compensation 358 430 1,640 1,288Changes in operating assets and liabilities:
Decrease/(increase) in accounts receivable and other assets $ 1,869 $ 1,660 $ 2,051 $ (86)
Decrease in inventories 656 650 180 456
Increase in accounts payable and other liabilities 9,674 6,023 4,520 6,812
Increase/(decrease) in related parties' balances, net 4,993 (510) 1,533 (6,877)
Increase/(decrease) in deferred revenue 1,096 4,506 (3,872) 3,717
Unrealized foreign exchange gain/(loss) 1 (30) 2 (16)Net cash provided by operating activities $ 46,121 $ 36,922 $ 84,725 $ 73,560Cash flows from investing activities:
Acquisition of vessels $ - $ (15,001) $ (23,060) $ (33,497)
Cash paid for vessel expenditure (3,104) (7,286) (4,489) (14,062)
Advances for vessel acquisitions and other additions (4,839) (1,500) (6,118) -
Cash paid for drydockings (2,910) (2,485) (10,099) (3,182)
Proceeds from sale of vessels 2,733 - 6,852 (1,500)Net cash used in investing activities $ (8,120) $ (26,272) $ (36,914) $ (52,241)Cash flows from financing activities:
Proceeds from issuance of 2024 Notes $ - $ - $ 19,193 $ -
Repurchase of 2022 Notes, including premium (1,793) - (59,615) -
Proceeds from drawdown of credit facilities - 280,500 47,000 293,500
Repayment of credit facilities (12,890) (11,272) (46,802) (37,819)
Repayment of refinanced debt - (262,809) (44,366) (262,809)
Deferred financing costs paid 7 (3,890) (962) (4,212)
Costs relating to offering of Class A common shares - - (76) -
Proceeds from offering of Series B preferred shares, net of offering costs 1,854 - 6,836 -
Series B Preferred Shares-dividends paid (957) (765) (2,747) (2,297)Net cash (used in)/provided by financing activities $ (13,779) $ 1,764 $ (81,539) $ (13,637)Increase/(decrease) in cash and cash equivalents and restricted cash 24,222 12,414 (33,728) 7,682
Cash and cash equivalents and restricted cash at beginning of the period 89,686 85,340 147,636 90,072Cash and cash equivalents and restricted cash at end of the period $ 113,908 $ 97,754 $ 113,908 $ 97,754Supplementary Cash Flow Information:
Cash paid for interest 7,273 10,307 40,371 45,094
Non-cash Investing activities:
Unpaid drydocking expenses 260 - 260 -
Unpaid vessel additions 90 - 90 -
Non-cash financing activities:
Issuance of Class A common shares - - - -
Issuance of Series C preferred shares - - - -
Unpaid offering costs - 856 - 85623
24
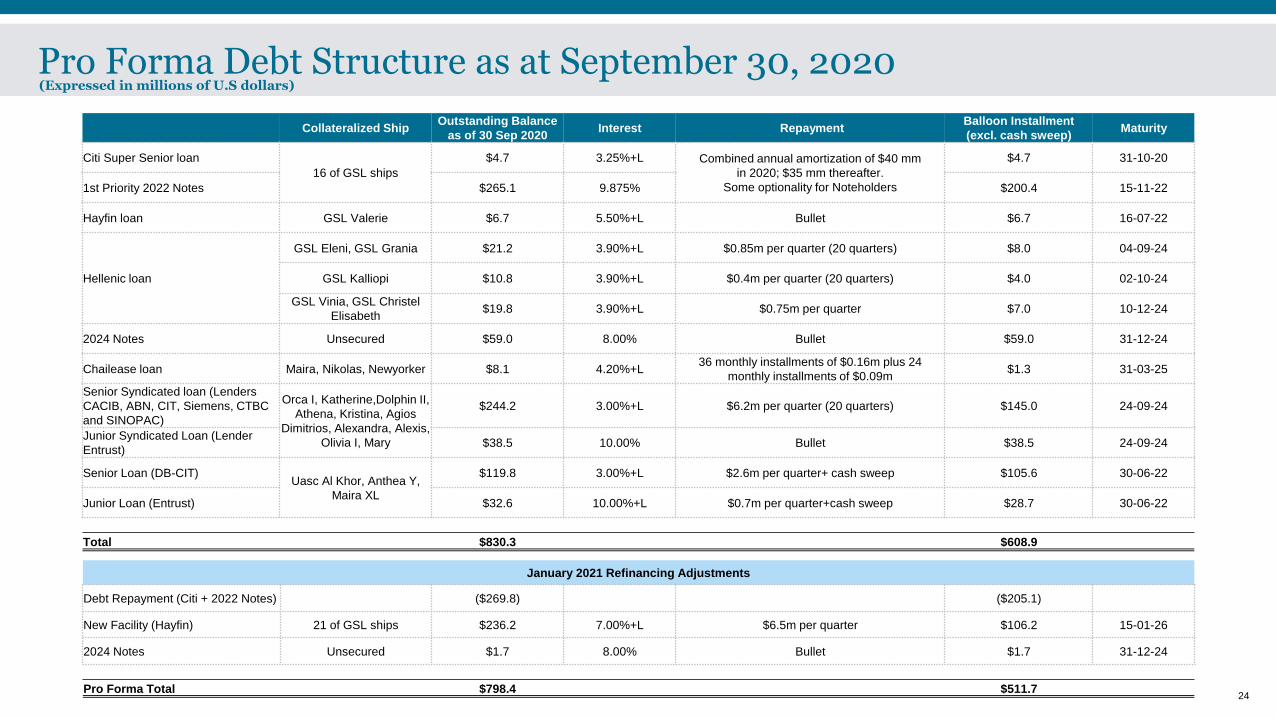
Pro Forma Debt Structure as at September 30, 2020 (Expressed in millions of U.S dollars)
Collateralized ShipOutstanding Balance
as of 30 Sep 2020Interest Repayment
Balloon Installment
(excl. cash sweep)Maturity
Citi Super Senior loan
16 of GSL ships
$4.7 3.25%+L Combined annual amortization of $40 mm
in 2020; $35 mm thereafter.
Some optionality for Noteholders
$4.7 31-10-20
1st Priority 2022 Notes $265.1 9.875% $200.4 15-11-22
Hayfin loan GSL Valerie $6.7 5.50%+L Bullet $6.7 16-07-22
Hellenic loan
GSL Eleni, GSL Grania $21.2 3.90%+L $0.85m per quarter (20 quarters) $8.0 04-09-24
GSL Kalliopi $10.8 3.90%+L $0.4m per quarter (20 quarters) $4.0 02-10-24
GSL Vinia, GSL Christel
Elisabeth$19.8 3.90%+L $0.75m per quarter $7.0 10-12-24
2024 Notes Unsecured $59.0 8.00% Bullet $59.0 31-12-24
Chailease loan Maira, Nikolas, Newyorker $8.1 4.20%+L36 monthly installments of $0.16m plus 24
monthly installments of $0.09m$1.3 31-03-25
Senior Syndicated loan (Lenders
CACIB, ABN, CIT, Siemens, CTBC
and SINOPAC)
Orca I, Katherine,Dolphin II,
Athena, Kristina, Agios
Dimitrios, Alexandra, Alexis,
Olivia I, Mary
$244.2 3.00%+L $6.2m per quarter (20 quarters) $145.0 24-09-24
Junior Syndicated Loan (Lender
Entrust)$38.5 10.00% Bullet $38.5 24-09-24
Senior Loan (DB-CIT)Uasc Al Khor, Anthea Y,
Maira XL
$119.8 3.00%+L $2.6m per quarter+ cash sweep $105.6 30-06-22
Junior Loan (Entrust) $32.6 10.00%+L $0.7m per quarter+cash sweep $28.7 30-06-22
Total $830.3 $608.9
January 2021 Refinancing Adjustments
Debt Repayment (Citi + 2022 Notes) ($269.8) ($205.1)
New Facility (Hayfin) 21 of GSL ships $236.2 7.00%+L $6.5m per quarter $106.2 15-01-26
2024 Notes Unsecured $1.7 8.00% Bullet $1.7 31-12-24
Pro Forma Total $798.4 $511.7

Adjusted EBITDA & Normalized Net Income - Reconciliations
Reconciliation of Non-U.S. GAAP Financial Measures
Adjusted EBITDA
Adjusted EBITDA represents net income available to common shareholders before interest
income and expense, income taxes, depreciation and amortization and earnings allocated to
preferred shares. Adjusted EBITDA is a non-US GAAP quantitative measure used to assist in
the assessment of the Company’s ability to generate cash from its operations. The Company
believes that the presentation of Adjusted EBITDA is useful to investors because it is frequently
used by securities analysts, investors and other interested parties in the evaluation of
companies in our industry. Adjusted EBITDA is not defined in US GAAP and should not be
considered to be an alternate to Net income or any other financial metric required by such
accounting principles.
Adjusted EBITDA is presented herein on a forward-looking basis in certain instances. The
Company has not provided a reconciliation of any such forward looking non-US GAAP financial
measure to the most directly comparable US GAAP measure because such US GAAP financial
measures on a forward-looking basis are not available to the Company without unreasonable
effort.
Normalized net income
Normalized net income represents net income adjusted for impairment charges and the
premium paid on redemption of 2022 notes. Normalized net income is a non-GAAP quantitative
measure which we believe will assist investors and analysts who often adjust reported net loss
for items that do not affect operating performance or operating cash generated. Normalized net
income is not defined in US GAAP and should not be considered to be an alternate to net
income or any other financial metric required by such accounting principles. Our use of
Normalized net income may vary from the use of similarly titled measures by others in our
industry.
Nine Nine
Months Months
Ended Ended
Sep 30, Sep 30,
2020 2019
Net income available to common shareholders 26,816 28,798
Adjust: Depreciation and amortization 34,970 32,884
Vessel impairment losses 8,497 -
Loss on sale of vessels 244 -
Interest income (897) (1,198)
Interest expense 50,533 56,484
Income taxes 50 (40)
Earnings allocated to preferred shares 2,747 2,297
Adjusted EBITDA 122,960 119,225
Adjusted EBITDA - unaudited
Nine Nine
Months Months
Ended Ended
Sep 30, Sep 30,
2020 2019
Net income available to common shareholders 26,816 28,798
Adjust: Impairment charges 8,497 -
Loss on sale of vessels 244 -
Premium paid on redemption of 2022 Notes 2,271 -
Normalized net income 37,828 28,798
Normalized net income - unaudited
(Expressed in thousands of U.S dollars)
25

Net Debt to LTM Adjusted EBITDA/Operating Revenue/Normalized Net Income - Reconciliation(Expressed in thousands of U.S dollars, except Net Debt / LTM Adjusted EBITDA Ratio)
Net Debt / Adjusted EBITDA / Operating Revenue for 12 Months to September 30, 2020
26
Gross debt as at September 30, 2020 830,294
Cash and restricted cash as at September 30, 2020 (113,908)
Net debt as at September 30, 2020 716,386
Three months ended Nine months ended LTM
December 31,2019 September 30,2020 September 30,2020
Net income available to common shareholders 7,961 26,816 34,777
Adjust: Depreciation and amortization 11,028 34,970 45,998
Impairment charges 8,497 8,497
Loss on sale of vessels 244 244
Interest income (593) (897) (1,490)
Interest expense 18,510 50,533 69,043
Income tax 43 50 93
Earnings allocated to preferred shares 785 2,747 3,532
Adjusted EBITDA 37,734 122,960 160,694
Operating Revenue 67,554 212,843 280,397
Net Debt/LTM Adjusted EBITDA 4.5
Three months ended Nine months ended LTM
December 31,2019 September 30,2020 September 30,2020
Net Income avaialable to common shareholders 7,961 26,816 34,777
Adjust: Vessel Impairment losses - 8,497 8,497
Loss on sale of vessels - 244 244
Premium paid on redemption of 2022 Notes 346 2,271 2,617
Normalized net income 8,307 37,828 46,135
27
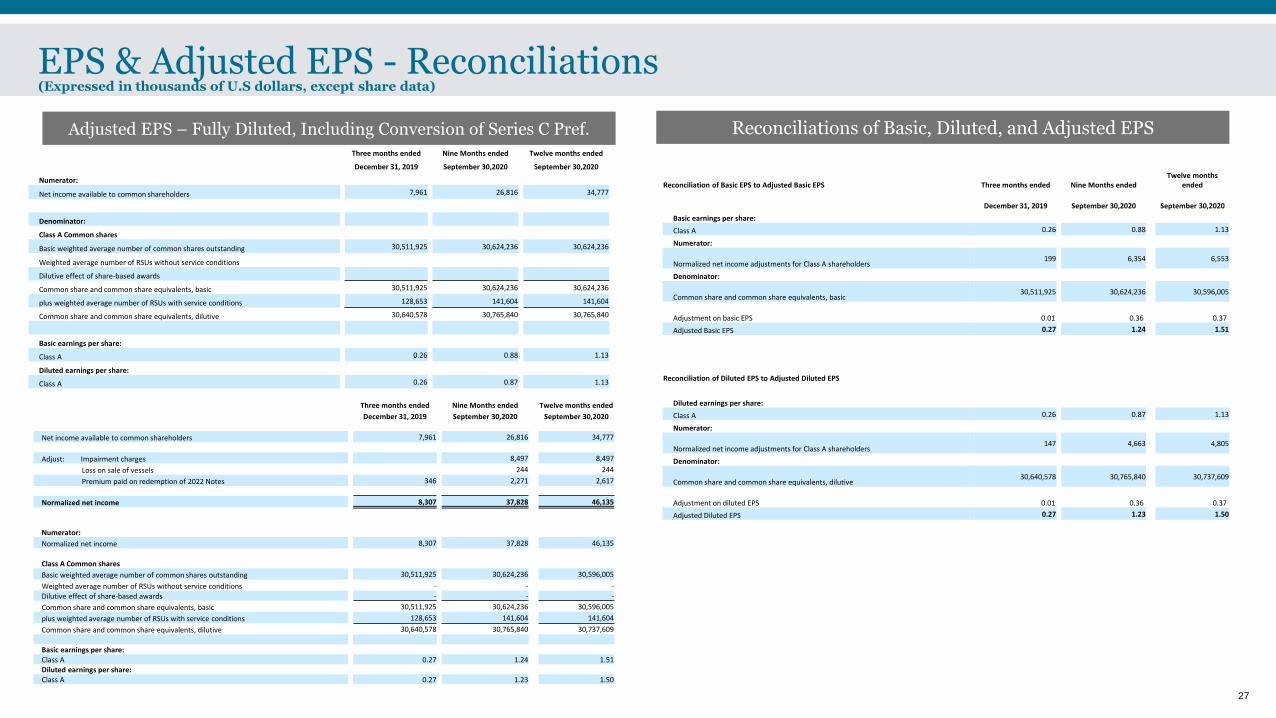
EPS & Adjusted EPS - Reconciliations(Expressed in thousands of U.S dollars, except share data)
Adjusted EPS – Fully Diluted, Including Conversion of Series C Pref. Reconciliations of Basic, Diluted, and Adjusted EPS
Three months ended Nine Months ended Twelve months ended
December 31, 2019 September 30,2020 September 30,2020
Net income available to common shareholders 7,961 26,816 34,777
Adjust: Impairment charges 8,497 8,497
Loss on sale of vessels 244 244
Premium paid on redemption of 2022 Notes 346 2,271 2,617
Normalized net income 8,307 37,828 46,135
Numerator:
Normalized net income 8,307 37,828 46,135
Class A Common shares
Basic weighted average number of common shares outstanding 30,511,925 30,624,236 30,596,005
Weighted average number of RSUs without service conditions - - -
Dilutive effect of share-based awards - - -
Common share and common share equivalents, basic 30,511,925 30,624,236 30,596,005
plus weighted average number of RSUs with service conditions 128,653 141,604 141,604
Common share and common share equivalents, dilutive 30,640,578 30,765,840 30,737,609
Basic earnings per share:Class A 0.27 1.24 1.51Diluted earnings per share:Class A 0.27 1.23 1.50
Three months ended Nine Months ended Twelve months ended
December 31, 2019 September 30,2020 September 30,2020
Numerator:
Net income available to common shareholders 7,961 26,816 34,777
Denominator:
Class A Common shares
Basic weighted average number of common shares outstanding 30,511,925 30,624,236 30,624,236
Weighted average number of RSUs without service conditions
Dilutive effect of share-based awards
Common share and common share equivalents, basic 30,511,925 30,624,236 30,624,236
plus weighted average number of RSUs with service conditions 128,653 141,604 141,604
Common share and common share equivalents, dilutive 30,640,578 30,765,840 30,765,840
Basic earnings per share:
Class A 0.26 0.88 1.13
Diluted earnings per share:
Class A 0.26 0.87 1.13
Reconciliation of Basic EPS to Adjusted Basic EPS Three months ended Nine Months endedTwelve months
ended
December 31, 2019 September 30,2020 September 30,2020
Basic earnings per share:
Class A 0.26 0.88 1.13
Numerator:
Normalized net income adjustments for Class A shareholders199 6,354 6,553
Denominator:
Common share and common share equivalents, basic30,511,925 30,624,236 30,596,005
Adjustment on basic EPS 0.01 0.36 0.37
Adjusted Basic EPS 0.27 1.24 1.51
Reconciliation of Diluted EPS to Adjusted Diluted EPS
Diluted earnings per share:
Class A 0.26 0.87 1.13
Numerator:
Normalized net income adjustments for Class A shareholders147 4,663 4,805
Denominator:
Common share and common share equivalents, dilutive30,640,578 30,765,840 30,737,609
Adjustment on diluted EPS 0.01 0.36 0.37
Adjusted Diluted EPS 0.27 1.23 1.50

Adjusted EBITDA and Operating Cash Flow Calculator (Illustrative)The table below presents our calculator for our current fleet for 2021 and 2022, based on historical performance, contracted revenue, assumed expenses, CAPEX , Net Interest Expense and Debt
Amortization after 2022 Notes1
(1) This information is presented for illustrative purposes only and is not a projection of future charter rates, revenues, costs, Adjusted EBITDA, capex, interest expense, debt amortization or operating cash flow, which may vary materially from the data which
may be derived from the assumptions on which this table is based.
(2) Spot Revenue Days and Rates do not include vessel segments which are not expected to have open days in either 2020 or 2021.
(3) Spot Revenue, Net should be after deduction of market standard commissions totaling 5%. Open days have already been adjusted for 1% of unplanned offhire.
(4) Fixed Revenue, Net is estimated based on the average between earliest and latest redelivery dates under our current charters and is net of all address and brokerage commissions, adjusted based on 2019 utilization rates and for anticipated offhire
drydock days.
(5) OPEX and Mgt Fees are based on average per vessel per day for 2019 and nine months to Sept 30, 2020, adjusted by 2% inflation every year starting with 2020.
(6) Voyage Expenses are based on average per vessel per day for 2019 and nine months to Sept 30, 2020, excluding brokerage commission which is deducted from Revenues, adjusted by 2% inflation every year starting with 2020.
(7) G&A Expenses are based 2019 and nine months to Sept 30, 2020, adjusted by 2% inflation every year, starting with 2020.
(8) Adjusted EBITDA represents net income available to common shareholders before interest income and expense, income taxes, depreciation and amortization, and earnings allocated to preferred shares. Adjusted EBITDA is a non-GAAP quantitative
measure and is not defined in US GAAP and should not be considered to be an alternate to Net income or any other financial metric required by such accounting principles.
(9) Capex (DD) is estimated based on average costs in 2019 and nine months to Sept 30, 2020, adjusted by 2% inflation every year.
(10) Capex (Scrubbers, BWTS, other) is estimated based on average costs in 2019 and nine months to Sept 30, 2020, adjusted by 2% inflation every year.
(11) Debt Amortization is based only on scheduled proforma fixed amortization after 2022 Notes refinance.
(12) Interest Expense is estimated based on balances including scheduled fixed amortization schedule, margin/coupon as contractually agreed and 3M LIBOR of 0.22338 as of Jan 15, 2021 and does not include any premium which may be paid on 2022
Notes redemption.
TEU Category
2021 2022
Spot Revenue
days1 Spot Net Rate Revenue ($m) Spot Revenue days1 Spot Net Rate Revenue ($m)
2,200-2,800 1,278 3,178
4,000 - 44
5,100 368 1,287
5,500-6,000 234 834
6,000-6,650 507 1,059
7,500-8,700 - 109
9,000 ECO - 448
Spot Revenues, Net 2,3
Fixed Revenues, Net 4 $257 $183
Total Revenues
Ownership Days Expense/Day ($)
OPEX & Mgt Fees 5 15,695 $6,417 ($101) ($103)
Voyage Expenses 6 15,695 $448 ($7) ($7)
G&A Expenses 7 ($7) ($8)
Adjusted EBITDA8
Capex(DD)9 ($10) ($9)
Capex(BWTS, Scrubbers)10 ($4) ($2)
Interest Expense12 ($46) ($36)
Debt Amortization11 ($71) ($62)
Balloon Installments - ($141)
Operating Cash Flow
TEU Category
10Y
Historical
Average
15Y
Historical
Average
2,200-2,800 8,817 11,843
4,000-5,100 11,398 16,202
5,500-6,000 15,509 20,286
6,000-6,650 17,998 22,120
7,000 eco 25,409 28,162
7,500-8,700 25,848 29,234
9,100 eco 34,812 36,506
28

CAPEX Guidance
Vessel Dry Docking Date as per 20F Revised Dry Docking Start Dates BWTS Shipyard / Offhire Days (3)
UASC AL KHOR (1) Jun-20 Dec-22 Fitted since NB 25
ANTHEA Y (1) Aug-20 Feb-23 Fitted since NB 25
MSC TIANJIN (2) Mar-20 Mar-21 ✓ 35
IAN H Jul-20 Nov-20 ✓ 36 (Completed)
CMA CGM AMERICA Dec-20 Sep-21 ✓ 40
GSL VALERIE Jun-20 Sep-20 ✓ 33 (Completed)
MAIRA Aug-20 Nov-20 ✓ 35 (Completed)
NIKOLAS Aug-20 Dec-20 ✓ 49 (Estimation, In Progress)
CMA CGM BERLIOZ Jul-21 ✓ 50
ORCA I Nov-21 ✓ 40
CMA CGM JAMAICA Sep-21 ✓ 40
CMA CGM SAMBHAR Jul-21 ✓ 40
NEWYORKER (2) Jan-21 Apr-21 ✓ 40
LA TOUR Jun-21 ✓ 40
MANET Oct-21 ✓ 40
GSL NICOLETTA Nov -22 ✓ 25
DOLHPIN II Jan-22 ✓ 25
CMA CGM ALCAZAR Nov-22 ✓ 25
CMA CGM CHATEAU D’IF May-22 Dec-22 ✓ 25
GSL JULIE Nov-22 ✓ 25
KUMASI Mar-22 ✓ 25
MARIE DELMAS Jan-22 ✓ 25
Revisions to the dry-docking schedule disclosed in our 20-F
➢ Please refer to summary table below for revised guidance, updated January 14, 2021
➢ Where possible, in order to minimize off-hire, we arrange for regulatory dry-dockings and upgrade work to be concurrent
Indicative CAPEX, based on average costs FY2019 – 9M2020 and adjusted for expected inflation
➢ Average five year special survey & dry-docking for 2021: ~$1.1 million per ship
➢ Average Ballast Water Treatment System (BWTS) for 2021: ~$0.4 million per ship
(Expressed in millions of U.S. dollars)
(1) Extended dry-docking program, on 7.5 year cycle
(2) Extension granted by classification society and flag administration
(3) Off-hire days are based on estimated arrival to and departure from shipyard
29

Evolution of Charterer Diversification: 2018 – 9M2020
Pro
po
rtio
n o
f O
ve
rall
Ch
art
er
Reve
nu
e, b
y P
eri
od
(%
)
80.4%
6.8%
1.4%
6.1%
2.3% 1.8%0.6% 0.7%
58.8%
4.3%
9.8%11.0%
6.6% 6.0%
1.1%2.4%
52.4%
13.8%
11.7%
9.2%
4.4%3.4% 3.0%
2.0%
FY2018 FY2019 9M 2020
CMA CGM Maersk MSC COSCO Hapag-Lloyd ZIM ONE Other
Diversification of Charterer & Shareholder Base
30
Shareholder Base(1)
(1) GSL shareholder base pro forma for Kelso conversion upon redemption of 2022 Notes, and for the issuance of 5,400,000 Class A common shares at an offering price of $13 per share on January 26, 2021,
resulting in a total of 36.1 million Class A common shares
Shareholder % Ownership(1)
Kelso & Co 35.9%
CMA CGM 8.5%
B. Riley Capital Management 6.1%
George Youroukos (Shipping Participations) 4.4%
Michael Gross 3.7%
Other Shareholders 41.4%

◼ Containership charter-owners provide over half the capacity in the
global fleet
◼ Despite significantly reduced activity since 2008, German KG /
Bank owned tonnage is still an important part of the charter market
➢ 56% by TEU capacity
➢ Sub-10,000 TEU, charter-owned capacity increases to
58%
➢ 21% of overall capacity in sub-10,000 TEU fleet
➢ 35% of chartered capacity in sub-10,000 TEU fleet
(1) Maritime Strategies International Ltd (MSI) as of December 31, 2020
Ownership of Global Fleet, by Size Segment(¹)
31
Over Half of the Fleet is Chartered from Containership Owners like GSL
3131
Key Points
57%
61%
65%
58%56%
58%
51%
27%
22%
30%
12%
28%
15%
4%
0.0
0.5
1.0
1.5
2.0
2.5
3.0
3.5
4.0
4.5
5.0
0%
10%
20%
30%
40%
50%
60%
70%
sub-2,000TEU
2,000-2,999TEU
3,000-3,999TEU
4,000-5,099TEU
5,100-7,499TEU
7,500-9,999TEU
10,000+TEU
Charter Owner Capacity as % of TotalGerman Charter Owner Capacity as % of TotalCharter Owner Fleet (RH Axis)
Ow
ners
hip
as P
roport
ion o
f T
ota
l F
leet
Capacity
Siz
e o
f Charte
red F
leet (T
EU
millio
n)

Name
Year of
Build
TEU
(Nominal) LWT
Existing Reefer
Capacity
Potential Additional
Reefer Capcaity
Max. Potential
Reefer Capacity
Other Special
Features
CMA CGM Thalassa 2008 11,040 38,577 700 780 1,480 New Bulbous Bow
UASC Al Khor 2015 9,115 31,764 1,500 318 1,818 Eco / WB / AMP
Anthea Y 2015 9,115 31,890 1,500 318 1,818 Eco / WB / AMP
Maira XL 2015 9,115 31,820 1,500 318 1,818 Eco / WB / AMP
MSC Tianjin 2005 8,603 34,325 710 770 1,480 -
MSC Qingdao 2004 8,603 34,305 710 770 1,480 Scrubber
GSL Ningbo 2004 8,603 34,340 710 770 1,480 AMP
GSL Kalliopi 2004 7,849 29,261 814 590 1,404 -
GSL Grania 2004 7,849 29,105 814 590 1,404 -
GSL Eleni 2004 7,849 29,190 814 590 1,404 -
Mary 2013 6,927 23,424 1,200 400 1,600 Eco / WB
Kristina 2013 6,927 23,421 1,600 - - Eco / WB
Katherine 2013 6,927 23,403 1,600 - - Eco / WB
Alexandra 2013 6,927 23,348 1,600 - - Eco / WB
Alexis 2015 6,882 23,919 1,600 - - Eco / WB
Olivia I 2015 6,882 23,864 1,600 - - Eco / WB
CMA CGM Berlioz 2001 6,621 26,776 500 300 800 -
Agios Dimitrios 2011 6,572 24,746 500 300 800 Scrubber
GSL Christen 2002 6,650 27,954 600 600 1,200 -
GSL Nicoletta 2002 6,650 28,070 600 600 1,200 -
GSL Christel Elisabeth 2004 6,080 23,745 500 710 1,210 New Bulbous Bow
GSL Vinia 2004 6,080 23,737 500 710 1,210 New Bulbous Bow
Tasman 2000 5,936 25,010 500 777 1,277 Optimized Hull
Dimitris Y 2000 5,936 25,010 500 777 1,277 Optimized Hull
Ian H 2000 5,936 25,128 500 777 1,277 Optimized Hull
Dolphin II 2007 5,095 20,596 330 472 802 -
Orca I 2006 5,095 20,633 330 472 802 -
CMA CGM Alcazar 2007 5,089 20,087 386 - - -
GSL Chateau d'If 2007 5,089 19,994 386 - - -
CMA CGM Jamaica 2006 4,298 17,272 600 - - -
CMA CGM Sambhar 2006 4,045 17,429 700 - - -
CMA CGM America 2006 4,045 17,428 700 - - -
GSL Valerie 2005 2,824 11,971 566 - - -
Athena 2003 2,762 13,538 300 220 520 -
Maira 2000 2,506 11,453 420 - - Geared
Nikolas 2000 2,506 11,370 420 - - Geared
New Yorker 2001 2,506 11,463 420 - - Geared
GSL La Tour 2001 2,272 11,742 446 - - Geared
Manet 2001 2,272 11,727 446 - - Geared
Keta 2003 2,207 11,731 350 - - Geared
Julie 2002 2,207 11,731 350 - - Geared
Kumasi 2002 2,207 11,791 350 - - Geared
Marie Delmas 2002 2,207 11,731 350 - - Geared
32
GSL Fleet is Flexible, Highly-Specified, Fuel Efficient, and Low-Slot-Cost
3232
Key Characteristics
◼ Post-Panamax
◼ Eco
◼ Reefer Capacity
◼ Gear
➢ Wider beam than Panamax ships, which improves vessel
stability and materially increases cargo load-factors
➢ Latest generation Wide Beam vessels offer even higher load
factors
➢ At standard operating speeds, a fully laden eco-vessel
consumes 20 – 30 mt per day less fuel than non-eco tonnage
of comparable size (6,500 – 9,500 TEU)
➢ High fuel efficiency reduces running costs for charterers –
thus facilitating lower slot costs
➢ AMP allows use of shore power, minimizing emissions during
port stays
➢ New bulbous bows and optimized hulls improve energy
efficiency and reduce emissions
➢ High reefer capacity allows charterers to carry more high-
margin refrigerated cargo
➢ Geared vessels have onboard cranes allowing them to
service ports with limited shoreside infrastructure

(1) Maritime Strategies International Ltd (MSI) as of December 31, 2020
(2) Derived from MSI, with illustrative fuel costs
Key Points
33
GSL is Focused upon Providing Low-Slot-Cost Ships
3333
Slot Cost Calculation for Liner Companies
◼ Slot cost is the daily cost to a liner company for the space that each loaded container
occupies on a ship
◼ The greater the cargo-carrying capacity and fuel-efficiency of a ship, the lower the slot cost
◼ The lower the slot cost, the more attractive the ship to liner companies in the charter market
◼ Liner companies look for lowest possible slot cost on any given trade, and size vessels
accordingly. But considerations include:
◼ Feeder vessels are expected to remain relevant
◼ Container shipping already emits less pollution than other existing transport modes on ton-
mile basis
◼ Furthermore, there is a clear correlation between low slot costs and low emissions per TEU,
favoring GSL’s low slot cost fleet
➢ Physical limitations: shoreside infrastructure, vessel length, vessel draft
➢ Commercial constraints: cargo volumes, required service frequency
➢ 42% of global fleet by number of ships is 2,000 TEU or smaller (¹)
Illustrative Daily Fuel Cost per TEU Slot, by Ship Size (2)
Fuel Cost
($ per Day)
Charter Hire
($ per Day)
Loadable Capacity of Ship
(# TEU @ 14 mt)
+
=Slot Cost
($ per TEU per Day
$0.0
$2.0
$4.0
$6.0
$8.0
$10.0
$12.0
$14.0
0 1,000 2,000 3,000 4,000 5,000 6,000 7,000 8,000 9,000 10,000
Daily fuel cost per TEU at assumed
fuel cost of $400 per mt
Daily
Fu
el C
ost per
Slo
t
Ship Size (TEU – Nominal)

(1) Maritime Strategies International Ltd (MSI) as of December 31, 2020; assumes fuel costs of $400 / mt, and an operating speed of 18 knots
Implied Charter Rates for Slot Cost Parity, by Ship Size (¹)
34
GSL Low-Slot-Cost Fleet is Positioned to Capitalize on the Cascade
3434
Slot Cost Calculation for Liner Companies
◼ Slot cost parity is when the cost per loaded container is equal
across all ships
◼ Liner companies’ drive to lower slot costs prompts vessel up-
sizing and cascading
◼ GSL fleet is well-positioned to capitalize on the cascade
➢ Daily fuel cost per TEU decreases as vessel size
increases
➢ Larger vessels can charge a higher daily charter
rate while delivering a lower overall slot cost
➢ If fuel costs rise, implied daily charter rates for
larger vessels can increase while still delivering
slot price parity, or better
➢ 75%+ of GSL’s fleet capacity is in size segments
with lowest slot costs in liquid charter market
-$20,000
$0
$20,000
$40,000
$60,000
$80,000
$100,000
1,100 1,700 2,200 2,500 2,800 4,250 5,100 5,900 6,500 6,900(Eco)
8,500 9,100(Eco)
$ p
er
Day
Reference vessel for calculating slot
cost parity: 4,250 TEU Panamax, with
market rate of $24,000 per day
@ December 31, 2020¹

(1) Maritime Strategies International Ltd (MSI) as of December 31, 2020
Reefer Plug Count by Size Segment of Global Fleet (¹)
35
GSL’s High-Reefer Vessels are Market-Leaders
3535
Key Points
◼ Carriage of temperature controlled “reefer” cargo is fastest
growing element of containerized trade
◼ Investment in high reefer capacity ships is a comparatively
recent phenomenon
◼ High reefer capacity ships are upside outliers for mid-size
and smaller vessels
➢ Higher paying cargo for liner operators than
standard “dry” cargo
➢ Vital link in supply-chain for foodstuffs and
medical supplies
➢ Lower reefer counts are the standard for mid-size
and smaller ships: average counts for the bottom
quartile and full-segment median are similar
➢ Tend to command employment, earnings, and
valuation premiums
100
182
263327
469
676
784
150
400
500
400
562
762
1,000
770
990 1,000
1,304
1,600
1,700
2,200
0
500
1,000
1,500
2,000
2,500
Sub-2,000 TEU 2,000-2,999TEU
3,000-3,999TEU
4,000-5,099TEU
5,100-7,499TEU
7,500-9,999TEU
10,000+ TEU
Bottom Quartile Average Median Max
Reefe
r P
lug C
ount
per
Ship
by F
leet
Segm
ent
Min. / max. plugs of GSL ships in size segment
Max. upgradeable plug count for GSL ships

(1) Maritime Strategies International Ltd (MSI) as of December 31, 2020
Chinese Built Containership Capacity by Size Segment of Global Fleet (¹)
36
GSL Fleet Build Quality is High v. Peer Group
3636
Key Points
◼ Yard quality is a proxy for vessel build quality
◼ Lower vessel build quality is reflected in comparatively lower
valuations and lower commercial appeal in the charter market
◼ A substantial share of the global fleet of mid-size and smaller
containerships is built at yards in Mainland China
➢ S. Korean, Japanese, Taiwanese and N.
European yards are traditionally seen as higher
quality operations producing higher quality ships
➢ Mainland Chinese yards are generally considered
to be second or third tier in build quality
➢ All of GSL’s ships are built at high quality yards
➢ None of GSL’s ships are built in Mainland Chinese
yards
37%
27%
39%
27%
6%
16%17%
Sub-2,000TEU
2,000-2,999TEU
3,000-3,999TEU
4,000-5,099TEU
5,100-7,499TEU
7,500-9,999TEU
10,000+TEU
Pro
port
ion o
f F
leet
Segm
ent B
uilt
at
Main
land C
hin
ese Y
ard
s
Number of GSL ships built at yards in Mainland China: Zero

(1) Maritime Strategies International Ltd (MSI) as of December 31, 2020
“Eco” Ships as a Proportion of Global Fleet, by Size Segment (¹)
37
3737
Key Points
◼ Limited investment in mid-size and smaller vessels since the
Global Financial Crisis means pre-Eco tonnage is still the
norm in these segments
◼ Above 10,000 TEU, Eco vessels are now the standard,
representing >80% of capacity
➢ Pre-Eco tonnage determines benchmark rates in
the liquid charter market
➢ Eco vessels command earnings and valuation
premiums
➢ GSL controls significant Eco containership
capacity in the 5,100 – 9,999 TEU size segments
➢ Between 2,000 and 5,099 TEU, GSL Eco-
ownership is consistent with market standards
➢ In the GSL fleet, only one ship (CMA CGM
Thalassa) is in this segment, with contracted
charter coverage through 2025
22% 22%24%
12%
9%
41%
83%
Sub-2,000TEU
2,000-2,999TEU
3,000-3,999TEU
4,000-5,099TEU
5,100-7,499TEU
7,500-9,999TEU
10,000+TEU
Eco D
esig
n C
onta
iners
hip
s a
s a
Pro
port
ion o
f T
ota
l F
leet C
apacity
Pre-Eco Tonnage still Standard for Mid-Size & Smaller Ships

4,193 4,179
3,299 3,335
1,8701,598 1,751
839 761368
Maersk MSC Cosco Shipping CMA CGM Hapag-Lloyd ONE Evergreen HMM Yang Ming ZIM
OTW-Fleet Orderbook
(1) Maritime Strategies International Ltd (MSI)
Significant Market Share Among Top Containership Owners(¹)
Top 10 Liner Operators(1)
1,144
549
386
245 209
798
590 510
430 386 384 293
226 222 203 203
Atlas Corp. Costamare Danaos Global ShipLease
NaviosGroup
Shoe Kisen EasternPacific
Shipping
ZodiacMaritime
BoComLeasing
Offer, ClausPeter
MinshengLeasing
Peter DohleHammonia
V. Ships CIMCLeasing
SchulteGroup
NissekKaiun
OTW-Fleet Orderbook
US Listed Containership Owners Financial / Privately Held Containership Owners
Capacity Deployed
38
Containership Market: Containership Owners and Charterers
3838
000s T
EU
000s T
EU

Demand recovery has led liner companies to increase charter book coverage, fixing vessels on increasingly longer duration charters especially in smaller vessel segments
(1) Maritime Strategies International Ltd (MSI)
39
Containership Market: Liner Mega-Alliances & Charter Duration
39
TEU Capacity by Liner Alliance (¹)
0.5K – 7.9K TEU Average Charter Length (¹)
8.0 7.3
4.73.8
0.41.1
0.60.1
32.4% 32.5%
20.2%15.0%
2M Alliance OCEAN Alliance THE Alliance Other Top 100 Operators
Fleet Orderbook % Share Of Total TEU
Liner consolidation and alliance formations have created capacity discipline and rationalization within the containership sector
Million TEU, unless otherwise stated
0.8
0.5
0.0
0.2
0.4
0.6
0.8
1.0
1Q
2011
2Q
2011
3Q
2011
4Q
2011
1Q
2012
2Q
2012
3Q
2012
4Q
2012
1Q
2013
2Q
2013
3Q
2013
4Q
2013
1Q
2014
2Q
2014
3Q
2014
4Q
2014
1Q
2015
2Q
2015
3Q
2015
4Q
2015
1Q
2016
2Q
2016
3Q
2016
4Q
2016
1Q
2017
2Q
2017
3Q
2017
4Q
2017
1Q
2018
2Q
2018
3Q
2018
4Q
2018
1Q
2019
2Q
2019
3Q
2019
4Q
2019
1Q
2020
2Q
2020
3Q
2020
4Q
2020
Average Charter Length 10YR Average39
Years

Evolution of Global Fleet and Orderbook-to-Fleet Ratio
Containership Fleet Composition & Orderbook-to-Fleet Ratio, 2007 – 2020(¹)
60%+ 2007Orderbook-to-fleet, December 31, 2007
$
Uncertainty inhibiting new orders
? Future Green Fuel(s)
& Propulsion
Disciplined approach to ordering
Liner Operator
Mega-Alliances
Orderbook-to-fleet, December 31, 2020¹
9.9% 2020
0%
10%
20%
30%
40%
50%
60%
70%
80%
0
5
10
15
20
25
2007 2008 2009 2010 2011 2012 2013 2014 2015 2016 2017 2018 2019 2020
Sub-2,000 TEU 2,000-2,999 TEU 3,000-3,999 TEU
4,000-5,099 TEU 5,100-7,499 TEU 7,500-9,999 TEU
10,000+ TEU Orderbook as % of Fleet (RH Axis)
Fle
et
Cap
ac
ity (
TE
U m
m)
Red
Lin
e:
Ord
erb
oo
k-t
o-F
lee
t R
ati
o (
%)
40

41
Evolution of Charter Rates, Asset Values, and Scrap Prices
Short-Term Market Charter Rates & Asset Values, 2000 – 2020(¹)
Scrap Prices, 2000 – 2020¹ (Recovering after COVID-19 Shut-Down)
Sharp up-turn in earnings in 2H 2020
Charter Rates:
Leading Indicator
$Positive inflection in values beginning
Asset Values:
Lag Charter Rates$
$399 10 year historic average scrap price¹
per LWT
0
50
100
150
200
250
300
Newbuild Price Index
TC Rate Index
Second Hand Price Index
Ind
ex
(1
00
= A
v.
20
00
–2
02
0)
2009 2010 2011 2012 2013 2014 2015 2016 2017 2018 2019 20202000 2001 2002 2003 2004 2005 2006 2007 2008
0
100
200
300
400
500
600
700
800
Sc
rap
Pri
ce
($ /
LW
T)
2009 2010 2011 2012 2013 2014 2015 2016 2017 2018 2019 20202000 2001 2002 2003 2004 2005 2006 2007 2008
(1) Maritime Strategies International Ltd (MSI) 41

(1) See ESG section of our website (www.globalshiplease.com) for details of our ESG strategy & our inaugural ESG report
ESG Overview(¹)
In our ESG report, we endeavor to identify the levers that we, as a company, can pull in order to continue to translate environmental sensitivity, social responsibility, and good
governance into specific actions. To this end, we have enlisted the help of our core stakeholders - including customers, employees, investors, financiers, suppliers, and industry
bodies - to gauge the materiality of the many different facets of ESG and guide us in drafting a strategic roadmap to address them. To help drive this process, and to ensure that ESG
becomes increasingly embedded in our company culture and the way we do business, we have established a specialized ESG committee at the Board level.
These are complex times, and the challenges we must collectively face, together with the nature of ESG itself, will continue to evolve. We are committed to continuous improvement
and to ensuring that Global Ship Lease creates sustainable value over the long term.
80% of global trade is carried by sea
Shipping is a low carbon form of transportation
Shipping contributes to the United Nations Sustainable Development Goals
As an industry, shipping has a number of strengths.
However, that is not to understate the magnitude of the challenges we need to address going forward, arguably the most critical of which is to play a role in the global effort to tackle
Climate Change and create a sustainable environment for our children.
Recognizing this, the International Maritime Organization has targeted a reduction in Greenhouse Gas emissions from shipping of at least 50% by 2050. And the Getting to Zero
Coalition - an alliance of companies across the maritime, energy, infrastructure, and finance sectors, supported by governments and IGOs - of which Global Ship Lease is a committed
member, is focused on getting commercially viable, zero-emissions vessels into operation by 2030.
Against this backdrop, the Global Ship Lease investment strategy is weighted towards Post-Panamax containerships, which retain a high level of operational flexibility while also
reducing costs and Greenhouse Gas emissions per unit of cargo carried, aligning our commercial interests with reduced emissions.
Furthermore, we are focused on extending the economic lifetime and optimizing the operating performance of existing ships - thus avoiding the carbon footprint associated with
constructing new vessels - until the industry can transition to next-generation, green propulsion technologies.
42

KPI Performance 2019 *
Energy Efficiency Operation Index (EEOI) Handymax (gr CO2 / TEU-mile) 187.6
Energy Efficiency Operation Index (EEOI) Panamax (gr CO2 / TEU-mile) 146.3
Energy Efficiency Operation Index (EEOI) Post-Pananax (gr CO2 / TEU-mile) 102.9
Total GHG emissions (tn CO2e) 1,057,937
Total fuel consumption (tn) 339,653
Total SOx emissions (tn) 6,259
Total NOx emissions (tn) 16,971
Total waste generated (m3) 14,997
Total water consumption (m3) 55,630
Percentage of fleet implementing ballast water exchange / system (%) 100 / 40
Number and volume of spills and releases to the environment 0
Energy Efficiency and Emissions
187.6
143.6
98.0
00
20
40
60
80
100
120
140
160
180
200
0
300
600
900
Handymax Panamax Post-Panamax
EEOI (gr CO2 / TEU - mile)
Our GHG emissions (‘000 tonnes CO2e) and
EEOI (gr CO2 / TEU - mile)The container shipping industry represents a low carbon form of transportation, with
GHG emissions comparing very favorably to those associated with moving comparable
volumes of cargo over the equivalent distances using other common modes of freight
transport such as air, road, or rail. But significant improvements are still required.
There is considerable variation in vessel emissions per tonne-mile of cargo carried,
with the (fuel) economies of scale yielded by larger vessels typically resulting in lower
emissions per container carried. Other factors, such as vessel age and design, fuel-
saving retrofits, operating speed, time in port, weather routing, and other operational
differences, also significantly impact the relative fuel efficiency of different sizes types
of containership. However, in general, there is a strong correlation between ships with
low fuel costs per TEU “slot” and ships with low emissions per TEU slot.
To assess the energy performance of our ships we use the IMO Energy Efficiency
Operation Index (EEOI). In container shipping, the most appropriate relevant cargo
metric is the TEU (Twenty Foot Equivalent Unit – a standard container).
The majority of our ships beat the relevant IMO EEOI industry benchmarks - basis
IMO 2009 (with 2008 as the industry’s “year zero” for emissions benchmarking), and
AMC benchmarks for 2019.
Monitoring and control of emissions is increasingly important.
Our vessels outperform the industry in terms of low GHG emissions.
Recognizing the serious social and economic challenges of climate change, and
the significant value of transitioning shipping to a decarbonized future, we are a
committed member of the “Getting to Zero Coalition” (GTZ).
Our EEOI Profile (gr CO2 / tonnes - mile)
Fleet average IMO benchmark AMC benchmark
* The reported KPIs refer to the second semester of 2019 and/or data as at December 31, 2019
0
10
20
30
40
Handymax Panamax Post-Panamax
gr CO2 / Tonnes-km per mode of transport*
0 500 1,000 1,500 2,000 2,500
Air
Road
Rail
Container shipping
*Source: 2nd IMO GHG Study, and Maritime Strategies International Ltd (MSI)
43

Corporate Governance
Our Board of Directors
The Board of Directors of Global Ship Lease (GSL) is committed to its fiduciary
responsibility to represent shareholder interests and oversee the management of GSL’s
business and sets high standards for the Company’s directors, officers, and
employees.
The corporate governance standards of the New York Stock Exchange (NYSE) are
different for United States domestic issuers and foreign private issuers. While a number
of the NYSE corporate governance standards for United States domestic issuers do not
apply to GSL as a foreign private issuer, the Company still strives to meet this optional
higher standard.
The procedures and standards the Board of Directors follows to fulfill its responsibilities
are recorded in the charters of the Board Committees, and in various guideline
documents, all of which are available in the Governance section of the Company’s
website.
The various GSL Board Committees are summarized below:
Audit Committee
Our Audit Committee is responsible for all issues related to the preparation of our
financial information and its disclosure. More specifically, the Audit Committee is
involved in (i) providing recommendations for the appointment and review of external
auditors, (ii) performing the internal audit process, (iii) supervising financial transactions
and related policies and strategies. Another significant role of the Audit Committee is to
identify and monitor business risks as well as ensure that we fully meet all the
disclosure requirements of regulatory authorities.
Conflicts Committee
The primary purposes of our Conflicts Committee are to review, evaluate, and approve
any transaction or other matter referred or disclosed to it where a conflict of interest or
potential conflict of interest exists or arises, whether real or perceived. Such matters
may include transactions between Global Ship Lease or any of its subsidiaries on the
one hand, and Technomar Shipping, Inc., or ConChart Commercial, Inc., or any of the
Company’s officers or directors or affiliates of its officers or directors, on the other hand.
ESG Committee
The primary purposes of our ESG Committee are to (i) guide, support, and supervise
management in developing, articulating, and continuing to evolve our ESG strategy; (ii)
evaluate and recommend ESG initiatives for adoption; (iii) assess ESG risks and
opportunities; and (iv) promote ESG practices within our business culture and
processes.
Nomination and Corporate Governance Committee
The Nominating / Corporate Governance Committee is engaged in issues related to
succession planning and the appointment, development and performance evaluation of
the members of the Board and senior executives of our company. Furthermore, the
Committee evaluates the effectiveness of our Corporate Governance Guidelines with a
view to review and provide recommendations to the Board whenever appropriate.
Compensation Committee
The Compensation Committee is responsible for evaluation and compensation plans,
reviewing and reporting on directors’ and executives’ compensation in accordance with
the rules and regulations of the Securities and Exchange Commission (SEC).
44