january 2016 march, 2013 january 2016 · as the newco interest in ecorodovias represents ... volume...
TRANSCRIPT

GAVIO GROUP
March, 2013 January 2016 January 2016

2
Disclaimer
This document has been prepared by ASTM S.p.A. and SIAS S.p.A. (the “Companies” or the “Group”) for the sole purpose
described herein. In no case it may be interpreted as an offer or invitation to sell or purchase or subscribe any security issued by
the companies or their subsidiaries
The content of this document has a merely informative and provisional nature and the statements contained herein have not
been independently verified. Certain figures included in this document have been subject to rounding adjustments; accordingly,
figures shown for the same category presented in different tables may vary slightly and figures shown as totals in certain tables
may not be an arithmetic aggregation of the figures which precede them
This document may contain forward-looking statements, including (without limitation) statements identified by the use of
terminology such as "anticipates", "believes", "estimates", "expects", "intends", "may", "plans", "projects", "will", "would" or similar
words. These statements are based on the companies’ current expectations and projections about future events and involve
substantial uncertainties. All statements, other than statements of historical facts, contained herein regarding the companies’
strategy, goals, plans, future financial position, projected revenues and costs or prospects are forward-looking statements.
Forward-looking statements are subject to inherent risks and uncertainties, some of which cannot be predicted or quantified.
Future events or actual results could differ materially from those set forth in, contemplated by or underlying forward-looking
statements. Therefore, you should not place undue reliance on such forward-looking statements. The companies do not
undertake any obligation to publicly update or revise any forward-looking statements
The companies have not authorized the making or provision of any representation or information regarding the companies or
their subsidiaries other than as contained in this document. Any such representation or information should not be relied upon as
having been authorized by the companies
Each recipient of this document shall be taken to have made its own investigation and appraisal of the condition (financial or
otherwise) of the companies and their subsidiaries
Neither the companies nor any of their representatives shall accept any liability whatsoever (whether in negligence or otherwise)
arising in any way from the use of this document. This document may not be reproduced or redistributed, in whole or in part, to
any other person

3
Acquisition of the joint control of Ecorodovias: Executive
Summary
▪ On 18 December 2015 ASTM and SIAS executed a binding agreement for the acquisition of the joint control, together with CR Almeida, of a new holding company (“Newco”) that, on its turn, will control Ecorodovias, the third largest toll road operator in Brazil (the investment will be made by means of the subscription of a capital increase of R$ 2,224m, approx. EUR503m(1)). ASTM and SIAS investment in such new holding company will be and will represent 50% of the common shares and 100% of the non-voting preferred shares issued by such company representing, in the aggregate, 64.1% of Newco’s total capital. As the Newco interest in Ecorodovias represents 64% of the total equity, ASTM and SIAS will jointly own an indirect 41% equity interest in Ecorodovias.
▪ By completing such transaction ASTM and SIAS will be in the management of a portfolio of toll road concessions of around 3,320km (1,462 in Italy and 1,858 in Brazil) in prosperous and highly industrialized areas, thus becoming the fourth largest player among European and South American motorways operators and materially increasing their capability to take part to international tenders.
▪ The transaction represents a significant step in the process of growth and geographical diversification undertaken by ASTM and SIAS fostering the implementation of the Group strategy of joint development of concession and construction businesses.
▪ Ecorodovias assets are located in the highest populated and richest areas of Brazil. Toll roads will benefit from favorable traffic dynamics (historical traffic growth well above GDP and low car ownership) coupled with a stable and flexible regulatory framework (potential contractual amendments, i.e. extension of concessions duration in exchange of additional capex).
▪ Moreover the deal constitutes a solid base for the Group to take part in the new infrastructure wave in toll roads promoted by the Brazilian Government for an estimated value of around R$ 65bn (expected tenders in 2015-16). Current adverse macro and political situation in Brazil could trigger several potential opportunities in the secondary market and lower competition in new tenders.
▪ The joint-venture represents a potential platform to jointly participate in the acquisition of new initiatives in concessions, construction, logistics and ports in the entire South America by sharing the historical expertise of Gavio Group and CR Almeida in developing infrastructural projects.
(1) Exchange rate hedged at 4.4189 €/R$ on average

4
Ecorodovias & Vem overview
Deal structure and rationale
Value creation plan
Annex

5
Overview of Ecorodovias
Transaction Perimeter
Ecorodovias Infraestrutura
& Logística S.A.
100%
Belo
Horizonte
Beltway
100% 100%
100% 100% 90% 58% 100% 20% 100% 100%
Toll Road Assets
100% 64% 36%
Logistics Assets
55% 1
Ecorodovias
Concessões & Serviços
S.A.1
100%
1 2 3 4 5 6 7 8
Urban Mobility Asset Construction Business
2
Investors base (free float)
(in Nov/30/15)
Foreign investors 54.5%
National investors 40.8%
Individuals 4.5%
Investment clubs 0.2%
Primav belongs to CR Almeida Group and is the controlling shareholder of Ecorodovias, one of the largest infrastructure
players in Brazil with focus on toll road assets which also owns one port and a logistic platform
(1) Market price and exchange rate as at 07/01/2016 (R$ 4,54 per share and 4,4001€/R$ )
Mkt cap 2.54 R$bn
(0.6 €bn)(1)
Free Float

6
Overview of Ecorodovias assets: geographic footprints
1,858 km of roads under concession
All assets are operational (except BH Beltway)
264.2 million equivalent paying vehicles (2014)
Ecoporto located in Port of Santos, the largest in LatAm
Elog as the main player in the customs segment
(1) Considers the GDP and population of the states within the geographic footprint
(2) Volume share of Brazilian cargo imported and exported transported through Ecorodovias’ toll roads influence zone as of 2013 (i.e. no t considering Ecoponte)
Highlights Geographic footprint concentrates 2/3 of Brazilian GDP, 1/2 of the country’s
population, and 1/2 of all the Brazilian cargo imported and exported
Belo
Horizonte
Beltway
GDP1 Population1
67,9% 44.0%
56,1%
Cargo Transported
Through Ecorodovias2
Geographic Footprint
Ecorodovias’ portfolio comprises 1,858 km of toll road concessions, one logistic platform (Elog) and one port asset
(Ecoporto) in seven different states of Brazil, located in the main trade corridors in the South and Southeast regions
SOURCE: IBGE 2014 and Brazilian Ministry of Development, Industry and Foreign Trade
Espirito
Santo
Parana
Sao
Paulo
Rio De
Janeiro
Rio Grande
Do Sul
Minas
Gerais Goias

7
Ecorodovias: the third largest toll road operator in Brazil
(1) Potential new contractual amendments. CCR discussing a potential 13 years extension on one concession in exchange of R$2.3bn of additional capex.
(Source: Valor International, Dec 9 2015)
(2) Average based on km. Simple average of the remaining years on the concession equal to 17.2 years.
Ecorodovias
Stake (%) Km Expiry Remaining
duration State
% EBITDA
9M-15
Ecovias dos Imigrantes 100% 177 Oct-25 9.8 SP 49%
Ecopistas 100% 135 Jun-39 23.4 SP 11%
Ecovia Comiho do Mar 100% 137 Nov-21 5.8 PR 11%
Ecocataratas 100% 387 Nov-21 5.8 PR 12%
Ecosul 90% 457 Mar-26 10.2 RS 10%
ECO101 58% 476 May-38 22.3 ES 5%
Ecoponte 100% 23 May-45 29.3 RJ 2%
Belo Horizonte Beltway 20% 66 Dec-46 31.0 MG na
Total toll roads 1,858 14.0(2)
Diversified portfolio of assets with long remaining duration: 14 years (based on km) without taking
into consideration potential extensions (1)
▪ SIAS+Ecorodovias: 3,320 km
▪ CCR: 3,285 km
▪ Arteris: 3,250 km
▪ SIAS+Ecorodovias: 13.5 years average
▪ CCR: 11 concessions, 13.9 years average
▪ ARTERIS: 9 concessions, 13.2 average

8
Ecorodovias – Main data
EURmln (1) 2013 2014
9M-2014 9M-2015
Comparable Pro-Forma Net Revenues¹ 539 555 409 433
Comparable Pro-Forma EBITDA(2) 284 292 218 237
Comparable Pro-Forma EBITDA margin(2) 53% 53% 53% 55%
Toll roads EBITDA margin 70% 68% 68% 69%
Comparable Net Income3 85 59 47 16
Pro-Forma Capex4 186 235 182 123
Pro-Forma Net Debt4 609 848 749 1.007
Net Debt/EBITDA - LTM4 2.0x 2.4x 2.1x 3.2x
(1) Exchange rate as at 07/01/2016 (4,4001€/R$ )
(2) Excludes Construction Revenue and Costs, Provision for Maintenance, sale of the interest in STP and the
proportional consolidation of Elog
(3) Excludes the sale of the interest in STP in March 2014 and STP's equity income
(4) Includes Elog's proportional consolidation
Amongst the highest profitability of toll roads in the sector
Leverage broadly in line with SIAS Group
Toll roads EBITDA Margin:
▪ SIAS: 67%
▪ CCR: 69%
▪ Arteris: 60%

9
Ecorodovias traffic dynamics: traffic growth well above GDP
Ecorodovias’ traffic growth rate kept well above Brazil’s GDP growth. Even in years of recession traffic
showed resilience also thanks to the exposure of the assets to varied drivers (ie commuting, leisure, ports,
metropolitan areas, trade corridors, ports and airports)
Adjusted Traffic Performance Compared to General Economic Performance (GDP)
9.2%
2.7% 0.7%
12.0%
9.2%
3.5%
6.1%
4.0%
0.3%
6.1%
5.2%
(0.3%)
7.6%
2.8%
0.9%
2.3%
0.2% (2.1%)
(04%)
(02%)
01%
03%
05%
07%
09%
11%
13%
2007 2008 2009 2010 2011 2012 2013 2014 LTM Sep-15
Ecorodovias' Traffic Growth Brazil's GDP (real term growth)
The Company’s assets
show strong recovery
after sluggish economic
activity
Z
Average of Ecorodovias’ adjusted
traffic growth over the past nine years 5.3%
Average of Brazil’s GDP growth over
the past nine years 2.5%
Adjusted traffic x GDP growth relation over the
past nine years (xGDP) 2.1x
1 Ecocataratas not included (acquired in 2008)
2 Ecopistas not included (non operational in the beginning of 2009)
3 Eco101 not included, as operations started in 2014
4 Ecoponte not included, as operations started in 2015
5 Excluding effects of suspended axles
1 2 2 3 1 3,4,5
10
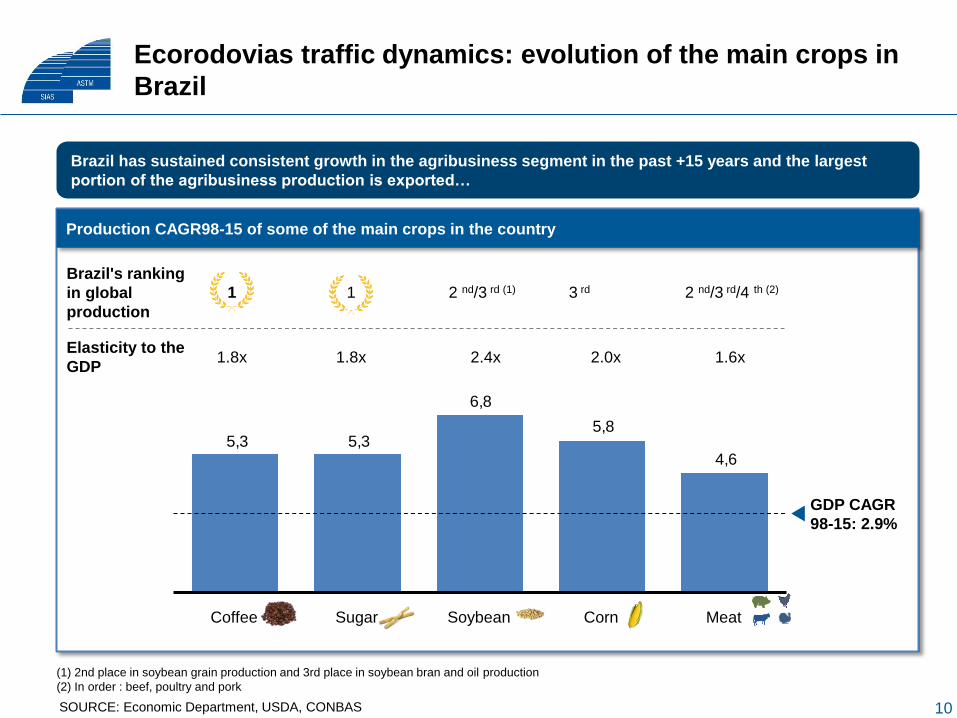
Ecorodovias traffic dynamics: evolution of the main crops in
Brazil
Production CAGR98-15 of some of the main crops in the country
Brazil has sustained consistent growth in the agribusiness segment in the past +15 years and the largest
portion of the agribusiness production is exported…
4,6
5,8
6,8
5,35,3
GDP CAGR
98-15: 2.9%
Sugar Soybean Meat Corn Coffee
Brazil's ranking
in global
production
Elasticity to the
GDP
2 nd/3 rd (1) 3 rd 2 nd/3 rd/4 th (2) 1 1
2.4x 2.0x 1.6x 1.8x 1.8x
(1) 2nd place in soybean grain production and 3rd place in soybean bran and oil production
(2) In order : beef, poultry and pork
SOURCE: Economic Department, USDA, CONBAS
11
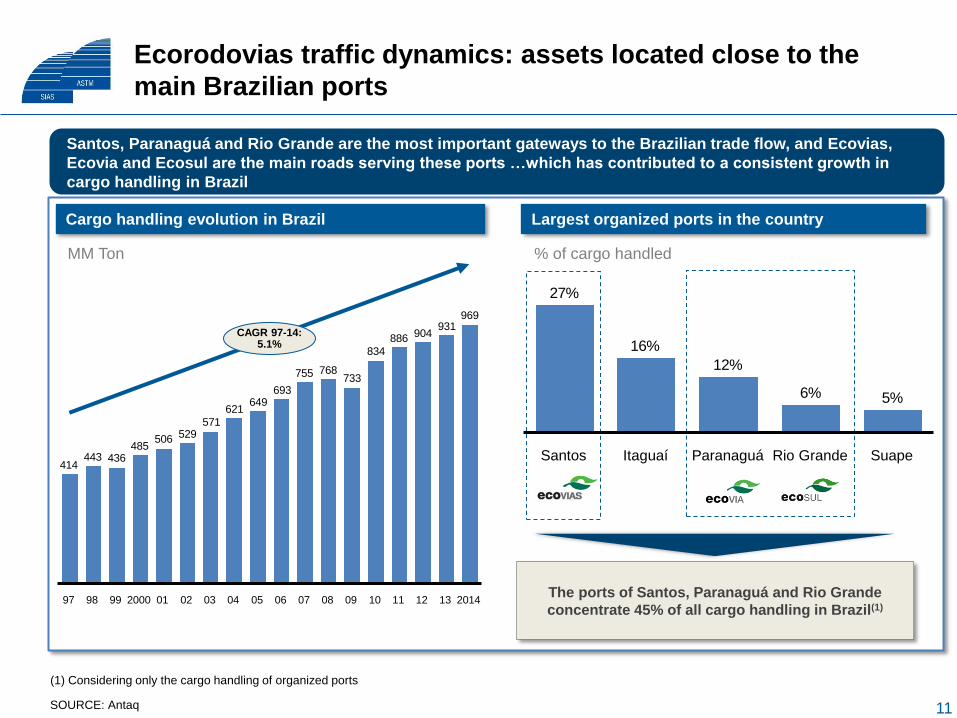
Ecorodovias traffic dynamics: assets located close to the
main Brazilian ports
Cargo handling evolution in Brazil
The ports of Santos, Paranaguá and Rio Grande
concentrate 45% of all cargo handling in Brazil(1)
Largest organized ports in the country
Santos, Paranaguá and Rio Grande are the most important gateways to the Brazilian trade flow, and Ecovias,
Ecovia and Ecosul are the main roads serving these ports …which has contributed to a consistent growth in
cargo handling in Brazil
969931
904886
834
733768755
693649
621
571529506
485436443
414
03 02 12 2000 04 11 09 13 06 08 05 10 07 2014 01 99
CAGR 97-14: 5.1%
97 98
MM Ton % of cargo handled
SOURCE: Antaq
(1) Considering only the cargo handling of organized ports
5%6%
12%
16%
27%
Paranaguá Santos Itaguaí Suape Rio Grande

12
VEM ABC main data
VEM ABC
is a greenfield project to build and operate a 14.9-km monorail system linking the São Paulo rail network with the ABC region
Object
Construction, concession and operation of
14.9 km monorail in São Paulo metropolitan
region with 13 stations
Demand 443 thousand passengers per day
Implementation deadline 4 years
Concession model PPP (sponsored concession) with minimum
level of revenues guaranteed.
Contract signing date August 22, 2014
Contract starting date 2017
Term 25 years
Total CAPEX 6bn R$ of which 3bnR$ of public grants
PPP structure
Government subvention for CAPEX and
pecuniary consideration paid by the
government to the consortium
Operating starting date Expected for 1H-2019
Shareholdings

13
Ecorodovias & Vem overview
Deal structure and rationale
Value creation plan
Annex

14
Deal highlights
Deal structure
Governance
▪ Capital increase of R$ 2.224mln (€503mln (1)) in Newco (which will own 64% of Ecorodovias and
55% of VEM and which will have R$ 2.571mln of debt as at Dec. 2015 equal to €584mln(2)) to be
subscribed by the Italian SPV participated by ASTM/SIAS (with respective stakes of 60% and 40%)
▪ Newco will be co-controlled with the following ownership structure: (i) 50% of the voting capital
owned by CR Almeida; (ii) 50% of the voting capital and 100% of the preferred capital (representing
28.2% of the entire capital) owned by the Italian SPV
▪ ASTM/SIAS to have an economic interest of 64.1% in Newco (through the Italian SPV),
corresponding to an indirect participation of 41% in Ecorodovias
▪ Main conditions precedent: Required authorization of certain governmental authorities and approval
of the lending banks of Primav and its subsidiaries
▪ Given the deal structure and co-control governance, no mandatory tender offer is required
Rationale
(1) Exchange rate hedged at 4.4189 €/R$ on average
(2) Exchange rate as at 07/01/2016 equal to 4.4001 (fixing BCE)
▪ Co-control of Newco and its subsidiaries
▪ ASTM/SIAS (through the Italian SPV) and CR Almeida to appoint the same number of Board
Members in Newco, Ecorodovias and its subsidiaries
▪ Right of first refusal and a co-sale right in case of disposal of Newco ordinary shares. The Italian
SPV will have the possibility of disposing the preferred shares at its convenience
▪ Internationalization of the core business in a country still with high growth perspectives in
infrastructure, regulatory stability and favorable traffic dynamics across several asset classes
▪ Potential platform to jointly acquire new construction and concession contracts in South America,
leveraging on the expertise of Gavio and CR Almeida Groups in developing of infrastructure projects
▪ Base to pursue the concession development plan underway in Brazil estimated in R$ 65 bn (around
€15bn)
▪ Good momentum to acquire infrastructure assets in Brazil despite the economic slow-down given
depressed valuations and historically favorable exchange rate
1
2
3

15
Deal structure
▪ PRIMAV should drop down (contribution in kind or spin-off of) all of its shares in Ecorodovias (64%) and VEM (55%) as well as transfer to Newco its financial indebtedness amounting to R$ 2,571 million (€584mln(1)) as of Dec. 31, 2015 (plus interest that will mature from 1° January 2016 to the closing)
▪ Italian SPV to be participated by ASTM/SIAS in proportion respectively of 60% and 40%
▪ Italian SPV to subscribe to a capital increase in Newco (in part for common shares and in part for preferred shares) for an aggregate amount of R$ 2,224 mln (€503mln(2))
(1) Exchange rate as at 07/01/2015 equal to 4.4001 €/R$ (fixing BCE)
(2) Exchange rate hedged at 4.4189 €/R$ on average
Main steps After subscription to the increase of capital, Newco shareholdings will be
allocated as follows:
– 50% common shares: CR Almeida.
– 50% common shares: Italian SPV (ASTM/SIAS)
– 100% of preferred shares (representing 28.2% of the entire capital): Italian SPV (ASTM/SIAS)
The total economic interest in Newco will be:
– 35.9%: CR Almeida.
– 64.1%: Italian SPV (ASTM/SIAS)
Indirect participation at Ecorodovias level
– 41%: Italian SPV(ASTM/SIAS)
– 23%: CR Almeida
Primarily used for the repayment of part of the financial debt Well sustainable debt level after the deal
Required authorization of certain governmental authorities Approval of the lending banks of Primav and its subsidiaries
2.2bn R$ for 64.1% of Newco subscribed by the Italian SPV corresponding to 41% stake in Ecorodovias (on a look-through basis)
Fundamental value of Ecorodovias well above market price (stock currently trading at the lowest EV/EBITDA in the sector)
Shareholding
structure
Valuation
Use of
proceeds
Conditions
precedent
1 Detailed next
15
Financing The deal will be financed by ASTM and SIAS by recourse to the financial resources and credit lines currently available with the possibility to recur to new specific bank financing

16
Deal structure
Pre-deal
100%
64% 55%
CR Almeida
Post-deal
35.9%
64% 55%
Newco
CR Almeida Italian SPV
64.1%(1)
100%
Toll roads Ports and
logistic Toll roads Ports and
logistic
1
Transaction
perimeter
(1) After the capital increase Newco shareholding will be allocated as follows: (i) 50% common shares to Almeida Family; (ii) 50% common shares to the Italian
SPV and (iii) 100% of preferred shares (representing 28.2% of the entire capital) owned by the Italian SPV, these stakes represent a 41% indirect
participations in Ecorodovias
ASTM SIAS
Transaction
perimeter
Indirect stakes:
▪ 41% ASTM/SIAS
▪ 23% CR Almeida
Aucap 2.2bnR$/
€503 mln
60% 40%

17
▪ Two blocks of shareholders would exist at the joint-venture company level: one formed by the Italian SPV (participated by ASTM and SIAS) and the other formed by CR Almeida
▪ Each block would own 50% of the joint-venture company’s voting stock; therefore, both joint-venture partners will share control on an equal basis
▪ Each block will appoint the same number of Directors in Newco, Ecorodovias and its subsidiaries
▪ The first Chairman of Newco will be designed by CR Almeida while the first CEO will be designed by ASTM/SIAS. There will be a 2-years rotation system in place for the appointment of the Chairman and the CEO
▪ All strategic and extraordinary matters will be agreed by consensus, whether by the general meeting or the meetings of the Board of Directors
▪ The control of the joint venture company’s subsidiaries, including Ecorodovias, will derive from the decisions mutually taken at the joint-venture company
▪ No block will have any pre-negotiated mechanism to increase or decrease its equity interest in the joint-venture company
▪ Only the shares of the common stock of the joint-venture company will be bound by the shareholders’ agreement
2 Governance

18
Rationale of the deal
▪ Localization of assets in the highest populated and richest area of Brazil
▪ Favorable traffic dynamic and low car ownership penetration
▪ Stable and flexible regulatory framework
▪ Potential new contractual amendments for the toll roads in portfolio
▪ Potential early renewal of Ecoporto concession
▪ Internationalization of the core business in a country with long term growth perspectives
▪ Co-control over approx. 1860 km of network (reaching ~3.320 km of total toll roads managed in Italy and Brazil) as well as one major logistic platform and one port
▪ Potential industrial synergies for new construction works in Ecorodovias and toll systems (IT)
▪ Deep knowledge of the management team and the assets (ex Impregilo)
▪ Platform to pursue the concession development plan underway in Brazil estimated in R$ 65 bn (of which R$ 50bn auctions at federal level expected in 2015-16 and R$ 15bn of potential additional opportunities at State level) plus additional 4,400km at State level
▪ Newco will be the partners’ exclusive platform for new initiatives in toll-roads, logistics and ports in South America
Unique opportunity for
Gavio Group
Asset with strong
fundamentals
and upsides…
…and representing a
distinctive platform to grow
in concession and
adjacent business
3

19
1
2
"Chinas"
within Brazil 3
▪ Northeast vs. the Southeast
▪ Mid-sized cities vs. mega-cities
▪ Interior vs. State Capitals
Infrastructure segments benefit from certain trends that
create favorable tailwinds
▪ Demographic trends are still positive
▪ Still low car ownership penetration
▪ A middle class with potential for growth
▪ Increased worker training/qualifications
▪ Comparative advantages in agribusiness
▪ Development of the pre-salt layer
(oil & gas)
▪ Despite numerous crises over the course of the past 30
years, the macroeconomic fundamentals have improved
significantly
Historical
resilience
Trends in
favor

20
Infrastructure Inventory Historical investment in infrastructure
Historical comparison of infrastructure investments
Infrastructure investments in Brazil are still well short of
international references and must double to close existing gaps
Average in period, % GDP
Brazil(1)
(1) Data from 2002 to 2012
Water
Power
2.2 2.2 Transportation
2011-12 Average 2001-10
2.2
Telecom
2.3
1990-2000
Telecom
3.8
2.2 Power
1.8
5.1
India Países em
Desenv.
4.7 Transportation
Mundo China
8.5
America
Latina
Water
70.6
Water
Brazil
53.6
Global
Telecom
Power
Transportation
% GDP
Average in 1992-2012 period, % GDP
Closing existing
gap requiring
investments of
~5.0% of GDP or
~R$ 240B/year
SOURCE: IBGE (Statistics for XX Century, GEIPOT (Annual Statistics), Eletrobras (SIESE) Ferreira & Milagros (1998), C. Calderón, W. Easterly & L. Servén (2003),
ITF; GWI; IHS Global Insight; ABCR, ANTIF, Sigla Brasil e Contas Abertas, Puga e Borça Jr (2011); McKinsey analysis

21
Urban
Mobility
Airports
Ports
Roads
The attractiveness of different segments for private-sector
varies substantially…focus on toll roads and urban mobility
▪ Established model, but with limited
experiences of private ownership and
fragmented regulatory power
▪ Varying quality of frameworks–
integrated (e.g.: Salvador, Rio) and
fragmented operations (e.g.: São Paulo)
▪ Projects with relevant levers for value creation,
e.g.:
– Operational improvements,
– Non-tariff revenues (retail, real estate, payment
systems, space for advertisement) and
– Expansions of existing network
▪ Large – Significant investment
needed in most large metropolitan
areas to relieve traffic congestion;
additionally, potential to optimize
existing operations and improve non-
regulated business (retail, real
estate)
▪ Model being changed from first to
second round of concessions, with
stricter requirements regarding the
experience and participation of operators
▪ Renewed interest in privatizing
remaining airports, but model still
unclear
▪ Projects with relevant levers for value creation,
e.g.:
– Operational improvements,
– Non-tariff revenues (retail, real estate, payment
systems, space for advertisement) and
– Expansion of capacity (e.g.: terminals, runway)
▪ Medium – with main airports
privatized, new investment
opportunities limited to medium-
sized airports (e.g.: Salvador, Porto
Alegre) and secondary market
(GRU, VCP, BSB)
▪ Regulatory model under review,
important elements still undefined and
the possibility of renewing contracts prior
to 1993 for another 5 years
▪ Potential to improve operations and expand
operations and services
▪ Consolidation potential
▪ Medium – Concessions, leases
and TUPs until 2017
▪ Large – significant new
investments besides secondary
market
– Amendments in contracts with
potential increase of duration
– Total infrastructure plan: R$ 65bn
of new projects (expected in 2015-
16)
– Macroeconomic and political
scenario coupled with demand for
capital fuels the secondary market
▪ Mature market, with narrower margins due to
regulation and intense competition for larger
projects
▪ Recent review of auction terms making program
more attractive with diversified assets (in terms of
size, geography and investments)
▪ Sector with stable regulations and
established history of private-sector
participation
▪ Recent review of terms maintained
economic balance of existing
concessions
Magnitude of opportunity Operational margin Regulatory stability
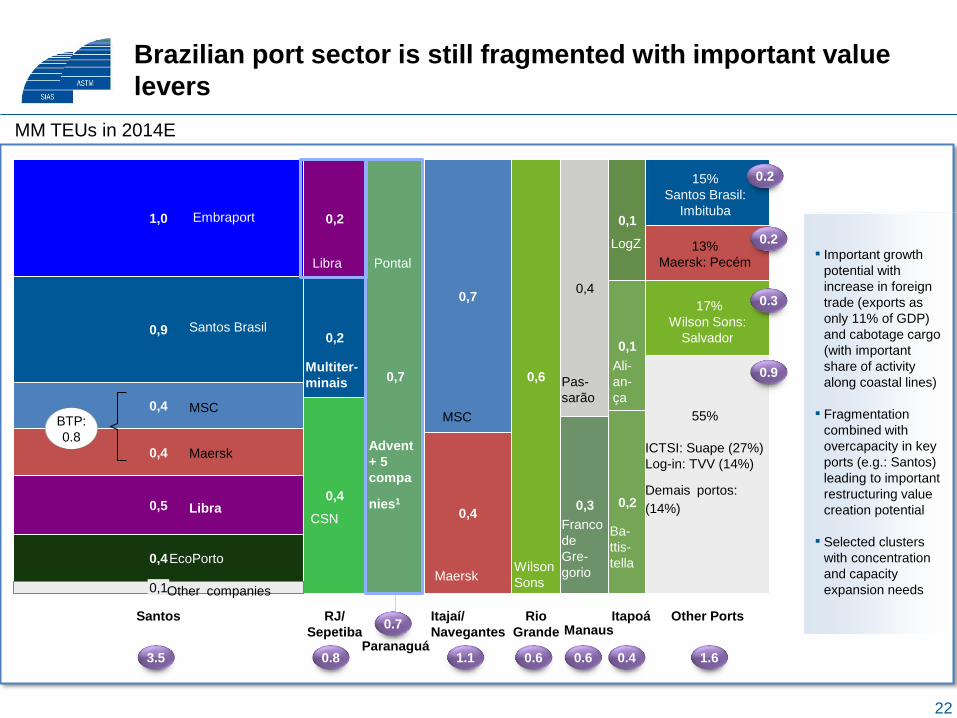
22
Brazilian port sector is still fragmented with important value
levers
0,4
1,0
Santos Manaus
0,5
0,6
Itajaí/
Navegantes
0,9
Rio
Grande
0,7
0,4
Itapoá
0,2
0,4 0,7
Paranaguá
RJ/
Sepetiba
0,2
Other Ports
0,2 0,3
0,1
0,1
0,4
0,1
0,4
0,4
3.5
0.7
0.8 1.1 0.6 1.6
55%
ICTSI: Suape (27%)
Log-in: TVV (14%)
Demais portos:
(14%)
15%
Santos Brasil:
Imbituba
13%
Maersk: Pecém
17%
Wilson Sons:
Salvador
0.3
0.9 Multiter-
minais
Wilson
Sons
Franco
de
Gre-
gorio
MSC
Maersk
CSN
EcoPorto
Other companies
Libra
Santos Brasil
Embraport
Libra
LogZ
Advent
+ 5
compa
nies1
MSC
Maersk
BTP:
0.8
0.2
0.2
Ba-
ttis-
tella
Ali-
an-
ça
0.4 0.6
Pas-
sarão
Pontal ▪ Important growth
potential with
increase in foreign
trade (exports as
only 11% of GDP)
and cabotage cargo
(with important
share of activity
along coastal lines)
▪ Fragmentation
combined with
overcapacity in key
ports (e.g.: Santos)
leading to important
restructuring value
creation potential
▪ Selected clusters
with concentration
and capacity
expansion needs
MM TEUs in 2014E

23
An increase in investments – especially in infrastructure - and in the
aggregate investment rate will contribute to increased growth
SOURCES: PIL – Logistics Investment Program; PDE; PlanSab; BNDES; Petrobras
(1) Planned investments for the next 5 years
55
135
50
65
Urban Transport(1)
Rails
Airports 17
Ports
Highways
Announced investments per sector in Brazil
▪ Logistics investment
program (PIL)
▪ Logistics investment
program (PIL)
▪ Logistics investment
program (PIL)
▪ Logistics investment
program (PIL)
▪ Private and public
investments
Sector Investment in BRL billion Investment source
▪ 50bn R$ of auctions at federal
level expected in 2015-16
▪ 15bn R$ of additional opportunities
at State level
▪ 4.400km of additional new projects
at State level
▪ Concession of 159 port terminals
from north to south
▪ Concession of two international
airports and 270 regional airports
▪ Concession of 11,000 km in rails
▪ Concession of High Speed Train
▪ Several (mainly in state capitals)
Main projects

24
The transaction will turn Gavio Group into the fourth biggest
player among European and South American motorway operators
Larger asset base and international presence will help Gavio Group to acquire new contracts and participate
in international tenders (i.e. technical and financial qualifications)
SOURCE: Bloomberg; Company presentations; McKinsey Research
After Ecorodovias acquisition
December 20153
Top motorway networks under concession of European origin (in km)
989
1,462
Brisa 1,678
Ecorodovias 1,858
Ferrovial 2,232
Eiffage 2,240
Arteris 3,250
CCR2 3,285
Gavio Group + Ecorodovias 3,320
Vinci1 4,401
Atlantia 4,997
Abertis 7,500
Pinfra2
OHL Mexico 1,003
Grana y Montero 1,121
Impulsora Desarollo y Empleo2 1,165
Gavio Group
1 Vinci Autoroutes includes: ASF, Cofiroute, Escota, Arcour; 2 2014 data

25
Ecorodovias & Vem overview
Deal structure and rationale
Value creation plan
Annex

26
The proposed transformation agenda intends to position the
companies to capture the value potential identified
Current
valuation
Intrinsic value As Is
Rationalization
program value
Valuation with operational and
organizational rationalization
Growth agenda
value
Valuation with effective
execution of growth strategy
Optimization of
capital base
Fundamental valuation with
capital market repositioning
Potential for value
creation
Fundamental
elements to
capture value
▪ Detailing of initiatives for value creation
▪ Governance model to monitor and facilitate progress
▪ Committed executive leadership team

27
A few key levers will drive that transformation agenda
Rationalization
program
Growth
strategy
Capital markets
repositioning
▪ Review organizational model (consolidating corporate functions and shared services
into entities with clear scope, while eliminating overlap with operations)
▪ Achieve a new level of operating efficiencies
▪ Optimize operational process at concessionaire level (including toll plaza operations
and maintenance practices) and capital expenditures
▪ Rationalize procurement function and practices (services and materials)
▪ Capture profitable growth with new round of privatizations of road concessions (at
federal, state and municipal levels)
▪ Explore the potential of new contractual amendments for the toll roads under
management (i.e. extensions)
▪ Actively participate in sector consolidation, including ports (currently highly
fragmented in main areas) and roads (focused on small groups’ portfolios)
▪ Develop proprietary urban mobility projects in main metropolitan centers
▪ Divest assets where the group is not best positioned to extract value releasing
capital to be reinvested in other businesses
▪ Clearly communicate strategy and progress on transformation program to key
stakeholders in capital markets
Key value levers
Significant
value creation
potential
▪ Short term impact driven by rationalization program
▪ Mid term upside deriving from new contractual amendments
▪ Long term portfolio renewal through growth strategy
▪ Financial strategy ensuring shareholders capturing value and limiting risks

28
Last 2 Years Ecorodovias Share Performance
8,0%
9,0%
10,0%
11,0%
12,0%
13,0%
14,0%
15,0%
16,0%
4
6
8
10
12
14
16
18
20
Jan-14 Mar-14 Apr-14 Jun-14 Aug-14 Oct-14 Dec-14 Feb-15 Mar-15 May-15 Jul-15 Sep-15 Nov-15 Jan-16
Price (BRL)
ECORODOVIAS - Share Price BOVESPA Rebased CCR Rebased CDI (RHS)
(22.0%)
(59.3%)
(17.3%)
19 May 2015
BRZ Investimentos exercises
option to sell 20% stake in
Elog for R$214m
5 July 2014
1Q 2014 results
10 July 2014
Announces diversification
into urban mobility with
Vem ABC (referring to
Primav not Ecorodovias)
18 March 2015
Award of Ecoponte
concession
19 March 2015
FY 2014 results
9 September
2015
2Q 2015 results
11 November 2015
3Q 2015 results
Announces possibility of discontinuation of
Ecoporto operations
12 November 2015
Ercorodovias was excluded from MSCI
Brazil Index
14 July 2014
Credit Suisse cut to hold its
recommendation 11 November 2014
3Q 2014 results
SOURCE: FactSet as of 7th January 2016. Prices adjusted for dividends distribution.
Over the last 2 years Ecorodovias share price has significantly underperformed the Bovespa Index as well as CCR, its closest Brazilian peer mainly due to (i)
overhang of Primav shares and (ii) market concern about the capability of the company to take part in the infrastructure wave underway in Brazil given the high debt
burden and need for cash at parent company level
18 December 2015
Annoucement of the
acquisition by
ASTM/SIAS

29
Valuation highlights
Ecorodovias Equity Valuation Comments
“Brokers” refers to the range of brokers valuations (range
of target prices over the past three months). Brokers
average equal to R$ 7.8 per share
Multiples range refers to implicit valuation using the Latin
American toll road operators EV/EBITDA 15E multiples
ranging from 5.4x (Eco) and 8.0x (CCR) (1)
Ecorodovias shares are currently trading at the lowest
multiple within the sector
In Dec 2012 CR Almeida acquired a 19% stake from
Impregilo for R$ 15.44 (implying a total value of approx.
EUR0.8bn). Under current transaction through the
subscription of EUR0.5bn capital increase it will be
acquired a 41% indirect stake in Ecorodovias.
Fundamental valuation points to a value of Ecorodovias well above market price
Ecorodovias is trading at the lowest EV/EBITDA 15E multiple in the sector (5.1x)
15,44 (2)
Acquisition by Primav from Impregilo in Dec.
2012 corresponding to ~10x EV/EBITDA
Upsides
(1) As at the time of the deal announcement vs. ~6,5x of SIAS and 8.5x average of European operator
(2) R$ 19 per share adjusted for dividends
Several medium to long term upsides to valuation
overlooked by the market:
Historic strong long term traffic growth
Potential new projects
Estimates that interest rates will normalize over the
long run
Implied
EV/EBITDA 15E
Reais per share
5.4x
5.5x
5.4x
7.8x
7.2x
8.0x
0,0 5,0 10,0 15,0
52-week Trading
Brokers
Valuation based on market multiplesrange
30
Ecorodovias & Vem overview
Deal structure and rationale
Value creation plan
Annex

31
Annex- Brazil macroeconomic outlook
Brazilian macro forecasts Inflation Rates
Differential in Brazilian and US Inflation and average FX rate
FX rate
Key Base Interest Rates
Inflation
Key Indices
IGP-M: Market General Price Index,
calculated by the Fundação Getúlio Vargas on
the basis of wholesale and consumer prices,
and construction costs
IPCA: Amplified Consumer Prices Index. It is
calculated by IBGE in the metropolitan regions
of Rio de Janeiro, Porto Alegre, Belo
Horizonte, Recife, São Paulo, Belém,
Fortaleza, Salvador and Curitiba and Goiânia.
It measures the price variation of products and
services consumed by families with income
between 1 and 40 minimum wages
TJLP: Taxa de Juros de Longo Prazo, is the
official long-term interest rate defined by the
Central Bank and used as reference in long-
term loans provided by the BNDES
CDI: Average One-Day Interbank Deposit;
annual rate representing the average rate of
all inter-bank overnight transactions in Brazil
GDP: real GDP forecasts as per Global
Insight, underlying the traffic forecasts
provided by Leigh Fisher
Source: All forecasts except GDP GI based on Brazilian Central Bank’s estimates as of December 4 th 2015. (1) Source: Global Insight version October 2015
--%
5,0%
10,0%
15,0%
dic '12 dic '13 dic '14 dic '15 dic '16 dic '17 dic '18 dic '19IPCA IGP-M
--
1,0
2,0
3,0
4,0
5,0
--%2,0%4,0%6,0%8,0%
10,0%12,0%
dic '12 dic '13 dic '14 dic '15 dic '16 dic '17 dic '18 dic '19
USD avg US inflation IPCA
--%2,0%4,0%6,0%8,0%
10,0%12,0%14,0%16,0%
dic '12 dic '13 dic '14 dic '15 dic '16 dic '17 dic '18 dic '19CDI (Selic, average) TJLP
GDP
(5,0%)
--%
5,0%
dic '12 dic '13 dic '14 dic '15 dic '16 dic '17 dic '18 dic '19
GDP (GI) GDP (Bacen)
(1)

32
Tough Brazilian macro-economic outlook in the short term…
Key output
indicators
▪ Growth in overall economic activity non expected to turn positive until 2017
– GDP projected to contract by 3.1% (2015) and 2.3% (2016)
– 2017 projections ranging from 0.0 to – 2.0%
Macroeconomic fundamentals – 2016 and 2017
Key monetary
indicators
▪ Inflation to remain above Central Bank targets, albeit on downward trends, e.g.
from ~ 10.5% (2015) to 6.7% (2016) per consensus projections
▪ Nominal and real interest rates projected to remain stable or slightly above current
levels, which are among the highest among all major economies
Key fiscal
indicators
▪ Public sector deficit projected at 10,5% (2015), 8,0% (2016) and 7.0% (2017) of
GDP, after nearly 10 years in 2.5 - 3.5% range, leading to decelerating rate of
increase in gross and net public sector debt
▪ Many analysts project Brazil will lose its investment grade rating at some point in
2016 (1). Market credit instruments already reflect loss of investment grade
Key external
account indicators
▪ Current account may reach surplus of 0.5 - 1.0% of GDP in 2017 after deficit of
4.0% of GDP as recently as 2014, reflecting the impact of devaluation and
economic slowdown on:
– Imports of goods (more than enough to offset deterioration of terms of trade)
– Imports of services, especially reduction in international travel deficit
– Corporate remittances (may decrease to levels last seen in 2005)
(1) Brazil credit rating: Baa3 (neg) by Moodys, BB+ by S&P and Fitch
SOURCE: Analysts reports, Brazilian Central Bank

33 SOURCE: Bacen; McKinsey analysis
1 NTN-B IPCA-indexed bonds due 15/08/2024
2 Considering case of FX in long-term equilibrium (differential in real rates) and FX 10-Year hedge (Brazil real rate in US$ of 4,34%)
1. Interest rates
Real interest rate; % per year in R$1
3%
4%
5%
6%
7%
8%
9%
10%
11%Fears of unorthodox macro
economic policies in early
years of Lula Administration
Macro-economic and political
stability with strong capital
inflows
Fiscal imbalance,
rising inflation and
foreign capital
drain
With inflation risk, real interest rates have climbed back
Implied
probability of
default of 40
to 65%2 given:
Risk-free rate
of 0,73% (real)
Recovery of
25%

34
gen-14 gen-08 gen-00
300
gen-10 gen-94 gen-02
250
gen-04 gen-16
150
200
100
gen-12 gen-06 gen-98 gen-96
Real exchange rate is currently at the highest level in the last 10
years
R$/US$ exchange rate adjusted for inflation
SOURCE: MCM Consultores; McKinsey analysis
Emerging
market
currency
crises
Expectation of election and early
years of Lula administration
Global financial
crisis
2. Exchange rates

35
…but asset prices seem to reflect current macro-economic
challenges
30.000
40.000
50.000
60.000
70.000
80.000
SOURCE: Capital IQ; MCM Consultores; McKinsey analysis
5
10
15
20
2,0
2,5
3,0
3,5
4,0
4,5
5,0
gen-15 gen-16 gen-14 gen-13 gen-12 gen-11 gen-09 gen-08 gen-10
IBo
ve
sp
a
pp
ts
Pri
ce
to
ea
rnin
g
Forw
ard
-loo
kin
g
Div
ide
nd
yie
ld
% p
y
3. Asset pricing

36
Cost of equity reflecting high real interest rates, not higher
risk premium
SOURCE: Capital IQ; MCM Consultores; McKinsey analysis
% per year in nominal terms; local currency
1,3
2,2
0,3
1,9
7,6
4,1
3,4
14,4
7,0
7,4
2,9
18,9
16,0
1,6
Sovereign 10-year
bond
Rate on 10-year A-
rating corporate debt
Cost of equity implied
in current P/E multiple
Expected inflation
(CPI)
Real interest rate
Corporate debt
spread
Equity risk
premium
1 Forward price to earnings ratio for Ibovespa ex-Vale and Petrobras
3. Asset pricing
▪ Equity risk
premium over
sovereign rate
similar in both
markets
▪ Yet, corporate
debt spread
capturing a larger-
than-usual portion
of premium (over
equity)
▪ Main potential
upside for broad
equity investments
is lowering real
interest rates
PE: 20,2x
Earnings
g: 2,5%
PE: 10,51x
Earnings
g: 2,5%
US capital markets Brazil capital markets

37
Annex - Operational Benchmarking
Main Brazilian toll road operators
CR Almeida/ ASTM/ SIAS …
Free Float 36%
Source: Company information, Factset as of 4th January 2016. Kilometres under management
(1) Excludes Construction Revenue and Costs, Provision for Maintenance, sale of the interest in STP and the proportional consolidation of Elog. (2) Excluding construction revenue. (3) Adjusted for maintenance provisions.
(4) Calculated as of 31 December 2015. (5) Including BH Beltway, that is not consolidated as Ecorodovias owns a 20% stake.
Ecorodovias CCR Arteris
Serveng 17%
Andrade Gutierrez
17%
Camargo Correa 17%
Free Float 49%
Jan 15 Mar 15 May 15 Aug 15 Oct 15 Jan 16
0
5
10
15
-55.21%
10.05%
Ecorodovias Bovespa
Jan 15 Mar 15 May 15 Aug 15 Oct 15 Jan 16
10
15
20
25
-17.46%
9.99%
CCR Bovespa
Jan 15 Mar 15 May 15 Aug 15 Oct 15 Jan 16
5
10
15
20
-20.18%
10.01%
Arteris Bovespa
Market cap:
R$ 2.7bn
Enterprise value:
R$ 7.1bn
Market cap:
R$ 21.5bn
Enterprise value:
R$ 31.4bn
Market cap:
R$ 3.2bn
Enterprise value:
R$ 8.5bn
R$ R$ R$
11,9 13,2
Simple Average Weighted by length (km)
Mark
et
Data
an
d O
wn
ers
hip
K
ey F
ina
ncia
ls
Netw
ork
an
d
Avera
ge
Co
nc
essio
n L
ife (4
) 3,250 km
km
13,3 13,9
Simple Average Weighted by length (km)
3,285 km 1,858 km
(5) (5)
17,3
14,0
Simple average Weighted by length (km)
R$m, FYE 31 Dec 2012A 2013A 2014A
Net Revenue (1) 1,983 2,372 2,442
growth (%) 19.6% 2.9%
EBITDA (1) 1,066 1,248 1,286
margin (%) 53.8% 52.6% 52.7%
Net Debt 2,176 2,680 3,732
Leverage 2.0x 2.1x 2.9x
R$m, FYE 31 Dec 2012A 2013A 2014A
Net Revenue (2) 4,659 5,207 5,653
growth (%) 11.8% 8.6%
Adj. EBITDA (3) 3,002 3,486 3,649
margin (%) 64.4% 67.0% 64.5%
Net Debt 6,672 6,996 8,862
Leverage 2.2x 2.0x 2.4x
R$m, FYE 31 Dec 2012A 2013A 2014A
Net Revenue (2) 2,211 2,343 2,479
growth (%) 6.0% 5.8%
Adj. EBITDA (3) 1,314 1,429 1,503
margin (%) 59.5% 61.0% 60.6%
Net Debt 2,420 3,084 4,383
Leverage 1.8x 2.2x 2.9x

Annex – Gavio Group
Group structure
(1) Net of treasury shares: 5.62%
(2) Mainly captive business
(3) January 2016
Motorway companies Maintenance
• ~1,460 km of network In Italy (and
84km in UK)
• Construction and
maintenance
of roads (2)
Other fields of activity
• Transportation and Logistics
• Shipbuilding
• Power Generation and Distribution
• Insurance Brokerage
Aurelia
57.14% (1) 6.23%
SIAS (Mkt Cap 2.1 bln) (3)
63.42% (SINA 1.72%)
ASTM (Mkt Cap 0.9 bln)(3)
Information Technology
• Electronic plants and equipment
for motorways concessionaries
• IT outsourcing
GAVIO FAMILY
Aurelia International
Engineering
Large-scale infrastructure and civil
construction works
Car Parks
• Car Park management under
concession
38
The Gavio Group is a leading infrastructure player in Italy with focus on toll roads, engineering and construction, freight transports,
ports and logistics. Strategic fit with CR Almeida Group is very high
Group aggregate
2014 revenues:
€ 3.9bn
5,600 direct
employees

ASTM and SIAS overview
SIAS is controlled by the Gavio family (1) through the holdings Aurelia and ASTM (approximately 70% stake).
SIAS is the second largest toll road operator in Italy (22% market share). The network consists of approximately 1,460 km of toll motorways operated through eight concessions with maturities ranging from 2017 to 2038 (12,6 years average based on km). The company network covers the north-west of Italy which is one of the wealthiest and most economically active regions in Italy and Europe.
SIAS’s shares are listed on the Italian Stock Exchange with a market capitalization of approximately € 2.1bn (as at January 2016).
As at 30 September 2015, SIAS Group reported €829m of revenues with an EBITDA of €505m (61% margin). The net financial position as at 30 September 2015 amounted to approximately € 1,538m (2,4x LTM EBITDA).
SIAS senior secured debt is rated Baa2 by Moody’s and BBB+ by Fitch on the back of the consolidated credit quality of the Group
ASTM is controlled by the Gavio family through the holding Aurelia (approx. 56% stake).
ASTM is an industrial holding operating primarily in the management of motorways and in the large infrastructural works design and construction sectors.
ASTM shares are listed on the Italian Stock Exchange with a market capitalization of approximately € 0.9bn (as at January 2016).
As at 30 September 2015, ASTM Group reported €840m of revenues with an EBITDA of €505m (60% margin). At holding company level the net financial position(1) was positive for €194m.
(1) Including approx. €12m in investment funds 39

SIAS Group: geographical footprints
Equity investment
Subsidiaries consolidated with the line-by-line method
40
SATAP A4
SATAP A21 SAV
ASTI-CUNEO
ADF
CISA
SALT
ATIVA
SITAF
SITRASB
ATS
BreBeMi
TE
Main motorway operator in the North-West of Italy
Network: ~1,460km (1)
(of which ~104 under construction) equal to
approximately 22% of the national grid
Average remaining duration of the concessions:
12,6 years
ACP-A21: awarded
on May 2015
(1) Including the stretch ACP-A21 recently awarded.
1,545km including 84 km related to the stretch NewCastle-Carlisle (UK)

SIAS Group: the second largest toll road operator in Italy
(1) Inclusive of the planned 81km stretch linking Parma to Brennero motorway
(2) Inclusive of 23km under construction
(3) 23.5 years starting from completion of the infrastructure
(4) Awarded on May 2015. Start of management of the asset expected in 2016.
(5) 25 years from start of management
(6) Average based on km. Simple average 14,6 years
(7) Joint control with Intesa Sanpaolo
(8) Plus indirect stake of 47.7% held though TEM in which the group own a 40% stake (plus 7.2% held directly by the affiliate company Itinera)
(9) Full opening to traffic on 16 May 2015.
(10) Indirect stake of 79% held through Autostrade Lombarde in whiich the group own a 13.3% stake (plus 2.2% held directly by the affiliate company Itinera)
(11) Ongoing discussion to extend to 2039 41
Stake (%) Km Expiry Remaining
duration (years)
% EBITDA
9M-15
Su
bsid
iaries
SATAP A4 99.9% 130 Dec-26 11.0 22%
SATAP A21 99.9% 168 Jun-17 1.5 17%
SALT 95.2% 155 Jul-19 3.6 19%
CISA 87.0% 182(1) Dec-31 16.0 9%
SAV 65.1% 60 Dec-32 17.0 7%
ADF 68.3% 113 Nov-21 5.9 15%
ATS 100.0% 131 Dec-38 23.0 6%
AT CN 60.0% 78 (2) -(3) - 0%
Centropadane(4) 70.0% 89 -(5) -
Total susidiaries 1,105 12.6 (6)
Eq
uity
inve
stm
en
ts ATIVA 41.2% 156 Aug-16 n.a.
SITAF 36.5% 94 Dec-50 n.a.
SITRASB 36.5% 13 Dec-34 n.a.
TE (7) 8.4% (8) 32 (9) 2065 n.a.
BreBeMi (7) - (10) 62 2033 (11) n.a.
Total toll roads 1,462

SIAS Group: main data
42
EURmln 2013 2014
9M-2014 9M-2015
Net revenues 977 1.032 793 829
EBITDA 566 609 479 505
EBITDA margin (1) 58% 59% 60% 61%
Toll roads EBITDA margin (1) 66% 64% 66% 67%
Net income 138 143 na na
Capex 283 224 155 143
Net debt adj. (2) 1,670 1,644 1,574 1,538
Net debt adj. / EBITDA LTM 3.0x 2.7x 2.6x 2.4x
(1) Excluding construction revenues and costs
(2) Including the net present value of the non financial debt vs. ANAS Central Fund (FCG)

-10,0%
-8,0%
-6,0%
-4,0%
-2,0%
0,0%
2,0%
4,0%
6,0%
6.000
6.500
7.000
7.500
8.000
8.500
9.000
9.500
Ch
an
ge (
%)
Millio
ns o
f v
eh
icle
s /
km
SIAS Group total traffic (millions of vehicles / km) SIAS Group total traffic (y-o-y change) Italian GDP (y-o-y change)
SIAS Group: Traffic
43
In the first 9m of
2015 traffic volumes
posted growth of
2.7%
After a long period
of volume decline,
traffic turned
positive in 2014-15
(but still 9% below
pre-crisis levels).
9M-15: +2.7%
0.93%
3.45% .3,29%
0,00%
0,50%
1,00%
1,50%
2,00%
2,50%
3,00%
3,50%
4,00%
Q1 2015 Q2 2015 Q3 2015

44
READY TO FACE ALL NEW CHALLANGES