january 2014 trends - alaska department of labor …labor.alaska.gov/trends/jan14.pdf ·...
TRANSCRIPT


January Authors
Neal Fried, a De-partment of Labor economist in Anchor-age, specializes in the Anchorage/Mat-Su region’s employment, wages, and the cost of living. To reach him, call (907) 269-4861 or e-mail him at [email protected].
Caroline Schultz, an Alaska Department of Labor and Work-force Development economist in Juneau, specializes in state-wide employment and wages. To reach her, call (907) 465-6027 or e-mail her at [email protected].
Alyssa Shanks, an economist for the Department of Labor in Anchorage, special-izes in the employ-ment and wages of the Interior, Gulf Coast, and Northern economic regions. To reach her, call (907) 269-4863 or e-mail [email protected].
Mali Abrahamson, a Department of Labor economist in Juneau, specializes in the em-ployment and wages of the Southeast and Southwest economic regions. To reach her, call (907) 465-6037 or e-mail her at [email protected].
2 ALASKA ECONOMIC TRENDS JANUARY 2014
January 2014Volume 34Number 1
ISSN 0160-3345
To contact Trends authors or request a free electronic or print subscription, e-mail trends@
alaska.gov or call (907) 465-4500. Trends is on the Web at labor.alaska.gov/trends.
Alaska Economic Trends is funded by the Employment Security Division of the
Alaska Department of Labor and Workforce Development. It’s published by the Research
and Analysis Section.
Alaska Economic Trends is printed and distributed by Assets, Inc., a vocational
training and employment program, at a cost of $1.37 per copy.
Material in this publication is public information, and with appropriate credit may
be reproduced without permission.
On the cover:Sunrise behind the Treadwell Mine Salt Water
Pump House at Sandy Beach in Douglas, photo by Sam Dapcevich
On the forecast:Hiking on Flattop Mountain photo by Eli Duke
Salmonberry photo by Jennifer WilliamsAnchorage ceremonial Iditarod start
photo by BLLR EntertainmentRockfi sh photo by Ken Curtis
Fairbanks ice festival photo by Carl ChapmanUsage license:
creativecommons.org/licenses/by-sa/2.0/legalcode
Sean Parnell, GovernorDianne Blumer, Commissioner
Sam DapcevichCover Artist
Sara WhitneyEditor
Dan RobinsonChief, Research and Analysis
Economic Forecast for 2014 4 Statewide 4 Anchorage 8 Fairbanks 11 Southeast 14
Employment Scene 18

3JANUARY 2014 ALASKA ECONOMIC TRENDS
Alaska looks ahead to ensure job growth will continue
By Dianne Blumer, Commissioner
This month’s Trends provides our annual economic forecast for Alaska and the state’s three largest population centers. The Alaska Department of Labor and Workforce Development’s Research and Analysis Section predicts Alaska’s em-ployment will continue to grow in 2014, adding 1,500 jobs statewide.
The 2014 forecast refl ects an Alaska in transition, with cuts in government jobs at all levels being offset by increases in the private sector.
Alaska’s natural resources will continue to be a major economic driver. Under the More Alaska Production Act, Alaska is once again an attractive investment in both new exploration and our legacy fi elds. With billions of barrels of recover-able oil, Alaska will maintain a healthy economy with good jobs for Alaskans.
Gov. Sean Parnell’s commitment is to live within our means and meet our con-stitutional priorities. He has proposed a fi scal year 2015 budget that is $1.3 bil-lion less than the current year.
The $5.6 billion state general fund budget represents the governor’s commitment to decrease state spending while maintain-ing Alaska’s constitutional priorities, which include resource development, public safety, education and training, and transportation and infrastructure.
The proposed total budget for FY 2015 is $12.4 billion when the Permanent Fund, federal funding, and other funds are in-cluded. The governor’s commitment is to continue to reduce state budgets, which will be offset by continued growth in Alaska’s private sector. More information on the budget is online at:OMB.Alaska.Gov.
Better Workforce Grants System
The Alaska Department of Labor is re-sponding to Gov. Parnell’s call for more effi cient state agencies that better serve Alaskans, and one way is to more effi ciently fund training for workforce development. In mid-January, we’ll begin accepting applica-tions for competitive FY 2015 workforce training grants. This will help us get the grants to successful applicants in early July, ensuring a full year to plan, implement, and report on training.
Our primary commitment continues to be training Alaskans for Alaska jobs.
State-funded workforce development pro-grams provide a gateway to train low in-come adults, laid-off workers, low income youth, and oil and gas workers, among others. Other workforce development funds develop training capacity and career and technical education options across the state.
The Business Partnerships Division will hold a technical assistance workshop on Friday, Jan. 31 for grant seekers. Staff will be available to answer questions about all of the funds and provide guidance on ap-plication strategies. Staff will also explain and answer questions about the E-GrAMS online grant application system.
Grants will be accepted through 5 p.m. on Feb. 28. Based on appropriations by the Alaska Legislature, we will be able to award grants during the fi rst week of June, well ahead of the July 1 start of the state fi scal year. More information is available by call-ing (907) 269-4651.
Building on both our natural and human resources, Alaska will continue to be a great place to work and live, with unlimited fu-ture potential.

4 ALASKA ECONOMIC TRENDS JANUARY 2014
By CAROLINE SCHULTZ, NEAL FRIED, ALYSSA SHANKS, and MALI ABRAHAMSON
More Modest Growth for AlaskaEmployment change, 2003 to 20141
*PreliminarySource: Alaska Department of Labor and Workforce Development, Research and Analysis Section
Economic Forecast for 2014
1.5%
1.7%1.8%
1.7%
1.0%
1.3%
-0.4%
1.3%
1.7%
1.5%
0.5%0.4%
2003 2004 2005 2006 2007 2008 2009 2010 2011 2012 2013* 2014
By CAROLINE SCHULTZ
Preliminary data show Alaska’s job growth slowed to 0.5 percent in 2013, and the state is expected to add jobs at a rate of 0.4 percent this year. (See Exhibit 1.) That would make 2014 the fi fth straight year of employment increases since the 2009 downturn, but the growth will be at a lower rate than the state’s 10-year average.
Shrinking government employment is a major
Alaska’s employment to grow by 0.4 percent this year
reason for this tempered forecast. Government has traditionally provided slow but steady job growth in Alaska, but several years of cuts — mainly federal — have put a damper on overall job growth.
Predicted declines in federal spending and oil revenue, foundationally important to Alaska’s economy, make a conservative forecast neces-sary. An overall decline in employment is not likely, though, as industries with strong growth — such as health care, natural resource extrac-tion, and leisure and hospitality — will likely compensate for losses elsewhere.
Relatively few economic drivers
Compared to most other states, Alaska relies on a small number of economic drivers — oil, fed-eral government spending, fi shing, tourism, and mining are the largest — and this lack of diver-sity can be a boon. The state avoided the worst of the recent recession because the demand for

5JANUARY 2014 ALASKA ECONOMIC TRENDS
Growth for Oil and GasStatewide, 2003 to 20143
*PreliminarySource: Alaska Department of Labor and Workforce Development, Research and Analysis Section
Oil, Mining Growth to Offset Government Job LossesStatewide employment forecast, 2013 and 20142
2012MonthlyAverage
2013Monthly
Average1
Change2012
to 2013
PercentChange
2012 to 2013
2014
MonthlyAverage
Change2013 to
2014
PercentChange
2013to 2014
Total Nonfarm Employment2 334,400 336,200 1,800 0.5% 337,700 1,500 0.4%Total Private Employment 250,300 253,100 2,800 1.1% 255,500 2,400 0.9%Natural Resources and Mining 17,000 17,700 700 4.1% 18,300 600 3.4% Oil and Gas 13,700 14,200 500 3.6% 14,700 500 3.5%Construction 16,400 16,300 -100 -0.6% 16,200 -100 -0.6%Manufacturing 14,000 14,100 100 0.7% 14,200 100 0.7%Wholesale Trade 6,300 6,600 300 4.8% 6,500 -100 -1.5%Retail Trade 35,800 35,700 -100 -0.3% 35,900 200 0.6%Transportation, Warehousing. and Utilities 21,800 21,800 0 0% 21,900 100 0.5%Information 6,200 6,100 -100 -1.6% 6,000 -100 -1.6%Financial Activities 12,300 12,400 100 0.8% 12,500 100 0.8%Professional and Business Services 29,600 30,000 400 1.4% 30,400 400 1.3%Educational3 and Health Services 46,300 47,200 900 1.9% 47,900 700 1.5% Health Care 32,900 33,500 600 1.8% 34,100 600 1.8%Leisure and Hospitality 33,000 33,400 400 1.2% 33,800 400 1.2%Other Services 11,600 11,800 200 1.7% 11,900 100 0.8%Total Government 84,100 83,100 -1,000 -1.2% 82,200 -900 -1.1% Federal4 16,400 15,600 -800 -4.9% 15,000 -600 -3.8% State5 26,100 26,300 200 0.8% 26,300 0 0% Local6 41,600 41,200 -400 -1.0% 40,900 -300 -0.7%1Preliminary estimates2Excludes the self-employed, fi shermen and other agricultural workers, and private household workers. For estimates of fi sh harvesting employment and other fi sheries data, go to labor.alaska.gov/research/seafood/seafood.htm.3Private education only4Excludes uniformed military5Includes the University of Alaska. Variations in academic calendars from year to year occasionally create temporarily large over-the-year changes.6Includes public school systems. Variations in academic calendars from year to year occasionally create temporarily large over-the-year changes. Source: Alaska Department of Labor and Workforce Development, Research and Analysis Section
-9.0%
1.2%
6.1%
16.1%
13.9%
11.3%
0.8%
-1.6%
2.4%
5.4%
3.6% 3.5%
2003 2004 2005 2006 2007 2008 2009 2010 2011 2012 2013* 2014
oil, minerals, and fi sh stayed relatively high and Alaska didn’t have the manufacturing or fi nancial jobs that disappeared in large numbers elsewhere. Another thing the state didn’t have was an over-heated construction industry fueled by specula-tive home-buying.
But Alaska’s lack of economic diversity also means that when one of its economic drivers veers off course, it has a more noticeable effect on the state’s economic trajectory.
The 2014 employment forecast doesn’t anticipate a worst-case scenario, but almost-certain declines in government spending will have a ripple effect through other industries as well as stifl e public job growth.
Although federal spending will remain important to Alaska’s economy, sequestration and increased scrutiny in Washington, D.C. have resulted in lower spending levels. The obvious result is the steep decline in federal employment that began in

6 ALASKA ECONOMIC TRENDS JANUARY 2014
5 Eateries, Lodging to Grow 1.2%Statewide, 2005 to 2014
2.3%1.9% 1.9%
0.3%
-3.4%
1.3%
3.2%
1.5%1.2% 1.2%
2005 2006 2007 2008 2009 2010 2011 2012 2013* 2014
*PreliminarySource: Alaska Department of Labor and Workforce Development, Research and Analysis Section
2011 and has accelerated since.
The federal government’s reach extends far be-yond civilian employment. The military is a mas-sive player in Alaska’s economy, and while these employment forecasts don’t include active-duty soldiers, many civilian jobs are tied to the military.
Military-related construction is likely to take a hit in 2014, even without any cuts to active-duty personnel. Nonmilitary federal spending is also anticipated to fall this year as federal austerity measures ripple through depart-ments.
Over much of the last decade, rising oil prices offset production declines and legislators passed large capital budgets. State-funded projects have mitigated some declines in federal construction spending, but new state revenue forecasts suggest belt-tightening will be in order. Unless oil prices are higher than anticipated, state capital and possibly operating budgets will be leaner.
Government job losses
Most of 2014’s job losses will be in gov-ernment, with an expected decrease of 900 jobs following a loss of 1,000 in 2013.
Of those 900 forecasted lost jobs, 600 are expect-ed to be federal, and this is assuming agencies won’t be forced to enact severe layoffs.
State government is expected to be fl at in 2014 following a 2013 increase of 200 jobs driven mostly by the opening of the Goose Creek Cor-rectional Center in the Matanuska-Susitna Bor-ough.
Local government employment fell further than expected in 2013, largely due to cutbacks in the Municipality of Anchorage and the Anchor-age School District. This trend is expected to continue in 2014. Although some districts and city governments are expected to grow in 2014, reductions in Anchorage and other larger commu-nities will likely overwhelm any growth. Some city governments may already feel the pinch of reduced state and federal funding, but others may reduce payrolls in anticipation of future revenue shortfalls.
Though these public sector losses will put a damper on job growth, they’ll be neutralized by modest gains in private industries.
Health care to grow, but slower
Alaska’s health care industry has been on an unparalleled growth streak over the past decade, adding nearly 10,000 jobs since 2003. Although the industry has added jobs at a slightly slower
About these forecastsBecause of the ongoing revision process, the 2012 and 2013 employment numbers these forecasts use as base years are not necessarily the same as the employment numbers available on the Research and Analysis site, laborstats.alaska.gov, at any point in time.
Employment numbers go through several revisions before they are considered fi nal. The fi rst and largest revisions are early in the year, and those revised numbers are released in March. Economists had a portion of these updated data when creating the forecasts.
All job numbers in these forecasts are annual averages. In other words, they are the average job counts for 12 months and not an actual count for any specifi c month. Forecasts are modeled using previous years’ trends and subjectively modifi ed by analyst interpretation.
Economists base these forecasts on the assumption that what drives job demand in specifi c industries won’t change dramatically, and don’t include the possibility of catastrophic economic events. While it’s unlikely these employment forecasts will be exact, they represent the mostly likely middle outcomes given these assumptions.

7JANUARY 2014 ALASKA ECONOMIC TRENDS
Health Care Growth SlowsStatewide, 2004 to 20144
5.9%
3.6%3.1%
1.5%1.1%
4.0%
4.9%4.3%
4.8%
1.2% 1.2%
2004 2005 2006 2007 2008 2009 2010 2011 2012 2013* 2014
*PreliminarySource: Alaska Department of Labor and Workforce Development, Re-search and Analysis Section
A Fourth Year of Federal DeclinesStatewide, 2004 to 20146
*PreliminarySource: Alaska Department of Labor and Workforce Development, Re-search and Analysis Section
0.6%
-1.2%-1.8%
0.6% 0.6%1.2%
2.3%
-2.3%
-4.1%
-4.9%
-3.8%
2004 2005 2006 2007 2008 2009 2010 2011 2012 2013* 2014
rate in recent years, the growth trend will likely continue this year with a forecast of 600 new jobs.
As a young state, Alaska has historically been underserved in health care, especially outside the Anchorage area. Many specialized services are still not available in Alaska’s larger communities, and in some ways, Alaska is still playing catch-up to the rest of the country.
Increased insurance coverage as a result of the Affordable Care Act could increase demand for health care among some populations. The state’s changing demographics also play a role in in-creasing health care demand. Alaska’s popula-tion has always been young, but the population of those 65 and over is growing quickly and is anticipated to increase by more than 20,000 be-tween 2010 and 2015.
Social assistance has also expanded throughout the decade, and despite pressure from govern-ment funding cuts, it is forecasted to grow slight-ly in 2014.
Energy, mining to remain strong
Mining and oil and gas have been a strong source of new jobs since 2010, and this growth is fore-casted to continue in 2014. Though not quite at their recent peaks, oil and mineral prices have remained relatively high, which will encourage development.
Oil industry employment is expected to drive most of the growth in the larger category this year, with an increase of about 500 jobs. Oil companies have an-nounced plans to increase activity in the near future following a change in Alaska’s oil taxes, though most of those efforts wouldn’t show up in job numbers this year.
The mining industry is expected to add jobs as well, but at a slower rate than in previous years. No new mines will open in 2014, and some current projects face challenges. Nixon Fork mine opera-tions have ceased, and Anglo American has withdrawn as a shareholder in the Pebble project. Despite these setbacks, the industry is expected to grow slightly this year.
Leisure, hospitality to grow
The majority of Alaska’s leisure and hospitality jobs are in food services and drinking establish-ments, and Alaskans and visitors appear to be go-ing out more frequently. The balance of jobs is in accommodations and the arts, entertainment, and recreation industries, which are also expected to grow modestly.
Continued on page 19

8 ALASKA ECONOMIC TRENDS JANUARY 2014
Mixed outlook for Anchorage to produce slight growthBy NEAL FRIED
Anchorage’s employment grew by less than 1 percent in 2013 — and with the city’s economic fundamentals unlikely to
change much in the near future, that’s the forecast for this year as well.
The plus side of the ledger includes a robust oil indus-try, buoyed by continued high oil prices, and an ever-expanding visitor industry. After a long dry spell, retail is forecasted to grow some-what in 2014, and health care is expected to continue its long contribution to new Anchorage jobs, though at a slower rate. The big-gest losses are expected in government, and particu-larly in federal jobs.
Decline for government jobs
Federal losses were steep last year at about 400 jobs in Anchorage, a trend that’s likely to continue into 2014. The assumption is the federal govern-ment will spend less money in Alaska again next year and possibly into the foreseeable future. With federal spending driving about a third of the state’s
Minor Job Growth for Anchorage2003 to 2014*1
*PreliminarySource: Alaska Department of Labor and Workforce Development
1.3%
1.7%
1.2%
1.0%
1.4%
-0.6%
0.6%
1.6%1.7%
0.4%
0.2%
20042003 2005 2006 2007 2008 2009 2010 2011 2012 2013* 2014
1.1%
economy, this is a meaningful shift.
At the state government level, which includes the University of Alaska Anchorage, employment could fall slightly in 2014. Slightly lower oil prices in recent months and production declines have put pressure on state budgets, but Alaska is in the envi-able position of having billions of dollars in its two
rainy-day funds, the Constitutional Budget Reserve and the Statu-tory Budget Reserve.
Most of that money was put away when oil prices were high and the state had large budget surpluses, but
withdrawals will be necessary to balance the budget in the short term and that will restrain spending.
Employment in local government fell by 400 in 2013 and additional declines are forecasted for 2014, a continuance of four years of downsizing for the Municipality of Anchorage’s workforce. Local government’s largest employer, the Anchor-age School District, took a relatively big hit in 2013 when it lost approximately 500 jobs, and because of tighter budgets and falling enrollment, more losses are anticipated in 2014.
Oil production down, oil jobs up
Besides government declines, the other possible downside for the Anchorage economy is the price of oil, which has become a more critical point as production continues to fall. Any signifi cant drop in oil prices could cause work in the oil patch to fall off quickly and put a bigger dent in state revenues.
Although production is down, the North Slope has continued to expand its record-size workforce over the past six years and that’s been good for Anchor-age, the state’s oil industry headquarters.
BP Alaska and ConocoPhillips plan to sustain their current levels of staff and activity in 2014, with a possible bump-up in work. ExxonMobil’s Point Thompson project that began in 2013 and generated considerable employment will continue in 2014, including the construction of a 22-mile pipeline that

9JANUARY 2014 ALASKA ECONOMIC TRENDS
2 Losses in Government Offset by Other IndustriesAnchorage employment forecast, 2013 and 2014
2012MonthlyAverage
2013Monthly
Average1
Change2012 to
2013
PercentChange2012 to
2013
2014
MonthlyAverage
Change2013 to
2014
PercentChange2013 to
2014Total Nonfarm Employment2 157,200 157,700 500 0.3% 158,000 300 0.2%Natural Resources and Mining 3,400 3,500 100 2.9% 3,600 100 2.8% Oil and Gas 3,300 3,400 100 3.0% 3,400 – Construction 8,400 8,400 – 0% 8,400 – 0%Manufacturing 2,300 2,300 – 0% 2,300 – 0%Wholesale Trade 4,600 4,800 200 4.3% 4,800 – 0%Retail Trade 17,100 17,000 -100 -0.6% 17,300 300 1.7%Transportation, Warehousing, and Utilities 11,300 11,100 -200 -1.8% 11,000 -100 -0.9%Information 3,900 3,800 -100 -2.6% 3,800 – 0%Financial Activities 7,800 7,800 – 0% 7,800 – 0%Professional and Business Services 20,400 20,900 500 4.5% 21,200 300 1.4%Educational3 and Health Services 24,600 25,100 500 2.5% 25,400 300 1.2% Health Care 18,000 18,200 200 1.1% 18,500 300 1.6%Leisure and Hospitality 16,900 17,100 200 1.2% 17,300 200 1.2%Other Services 5,800 6,000 200 3.4% 6,100 100 1.6%Total Government 30,700 29,900 -800 -2.6% 29,000 -900 Federal4 9,100 8,700 -400 -4.4% 8,400 -300 -3.6% State5 10,700 10,800 100 0.9% 10,500 -300 -2.9% Local6 10,800 10,400 -400 -3.7% 10,100 -300 -3.0%
1Preliminary estimates2Excludes the self-employed, fi shermen and other agricultural workers, and private household workers. For estimates of fi sh harvesting employment and other fi sheries data, go to labor.alaska.gov/research/seafood/seafood.htm.3Private education only4Excludes uniformed military5Includes the University of Alaska. Variations in academic calendars from year to year occasionally create temporarily large over-the-year changes.6Includes public school systems. Variations in academic calendars from year to year occasionally create temporarily large over-the-year changes. Source: Alaska Department of Labor and Workforce Development, Research and Analysis Section
will connect to the Trans-Alaska Pipeline System. Royal Dutch Shell recently announced plans to re-sume drilling in the Chukchi Sea, possibly as early as 2014.
Stability for construction
Building permit valuation in Anchorage was up by $169 million, or 40 percent, for the fi rst 11 months of 2013 — the highest since 2007.
Construction employment was fl at in 2013 and is expected to hold steady in 2014. Three new sizable offi ce buildings will go up this year, and buildings with construction that will continue in 2014 include a retail-outlet shopping center and some smaller stores, two large parking garages, the new University of Alaska Anchorage Sports Arena, the new UAA Engineering and Industrial building, and one or two hotels.
Highway construction is forecasted to remain high in 2014, even at the federal level, as the U.S. Army Corps of Engineers has revised its numbers upward for 2014.
Residential construction could pick up somewhat after a number of lackluster years. Low interest rates and a very small housing inventory on the market could prompt more home construction.
Modest growth for health care
Health care has generated the largest number of new jobs in Anchorage for many years. Between 2002 and 2012, health care employment grew by nearly 6,800, or just shy of 5 percent per year, ver-sus 1 percent for overall employment.
Growth in 2013 was more modest, adding approxi-mately 200 jobs, or 1 percent. A decline in federal

10 ALASKA ECONOMIC TRENDS JANUARY 2014
spending could affect these numbers for 2014. A possible offset would be the implementation of the Affordable Care Act, which some predict would increase the demand for health services.
New players for retail
After a decade of little change in retail employ-ment, Anchorage could see some growth in 2014 — but that comes with a cautionary note because of past employment trends in this industry. Anchorage retail employment has barely budged over the past decade despite construction of the city’s largest shopping center and major expan-sions of existing retailers. However, a slew of new large retailers could give this industry a boost this year, assuming existing stores don’t cut back or close their doors, which is always pos-sible in retail.
Some of the new players opening in 2014 include Cabella’s, Bass Pro Shop, a new and much larger Natural Pantry, a Three Bears, and an expanded Fred Meyer. A new Walmart opened in Anchor-age in fall of 2013, so most of its new jobs will be counted in 2014. The number of new jobs from these stores alone could add up to 700-900, but the net gain, if there is any, will likely be smaller as existing retailers react to the new com-petition.
Professional and business services Professional and business services is a tough indus-try to forecast because it has so many components with little relation to each other — law fi rms, engi-neering fi rms, employment services, tech support, janitorial businesses, and refuse companies are grouped together. However, this sector generated more jobs in Anchorage than any other in 2013, and healthy levels of oil and construction plus an overall
forecast for some growth should translate into an-other positive year.
Tourism expected to do well
Bars and restaurants represent two-thirds of An-chorage’s leisure and hospitality employment, with hotels representing another fi fth and the bal-ance in entertainment. Most of this sector, which includes tourism, counts on local consumption as well as visitor spending.
Tourism is important to Anchorage, however, and it’s expected to fare well in 2014. Bed taxes were up 4 percent through the fi rst three quarters of 2013 and are forecasted to grow another 5 percent in 2014. The Anchorage Visitor and Convention Bureau also predicts another good year for the broader industry.
One new hotel will open in late 2014 and at least half a dozen new eating and drinking places have announced they will open soon. Some of these in-clude Hard Rock Café, Texas Roadhouse, Chili’s, The Fat Ptarmigan, three Krispy Kreme stores, and Turnagain Arm Pit BBQ.
Financial industry stays positive
Continued low interest rates and a robust stock market — as well as a healthy real estate market and business climate — should keep Anchorage banks, insurance companies, credit unions, and other fi nancial companies in relatively good shape this year.
Home sales in Anchorage were up 15 percent dur-ing the fi rst half of 2013 despite fl at residential construction. If construction picks up this year, it will give this industry an additional boost.

11JANUARY 2014 ALASKA ECONOMIC TRENDS
Some Job Recovery ForecastedFairbanks borough, 2003 to 20141
*PreliminarySource: Alaska Department of Labor and Workforce Development, Research and Analysis Section
2.1%
3.7%
2.6%
0.6%
0.3% 0.2%
-1.0%
2.1%
0.8% 0.8%
-1.0%
0.5%
2003 2004 2005 2006 2007 2008 2009 2010 2011 2012 2013* 2014
Some growth for Fairbanks a er 1 percent loss in 2013By ALYSSA SHANKS
Several years of relatively stable job growth in Fairbanks was interrupted in 2013 as the borough’s employment declined by 1 per-
cent, driven primarily by job losses in construc-tion and federal govern-ment. (See exhibits 1 and 2.)
The employment outlook for 2014 is a bit more promising, with forecast-ed growth of 0.5 percent, though it wouldn’t be quite enough to regain last year’s losses.
Construction lost ground in 2013
Fairbanks’ construction industry had a diffi cult year in 2013, losing 100 jobs despite visible construction projects around the borough. The main cause was a switch from mostly vertical construction — houses and other buildings — to horizontal construction projects, or the build-ing of roads, highways, and bridges. Horizontal construction requires more heavy equipment and fewer workers.
New structures of all types were down signifi -cantly from 2012 to 2013, according to the Fair-banks North Star Borough. This led to a decline in construction jobs, particularly specialty trade contractors, which include framing, glass and glazing, roofi ng, and siding contractors. (See Exhibit 3.) With no new large housing projects planned for 2014, employment in vertical con-struction is expected to remain at the same level as last year.
Overall, the construction industry is forecasted to grow somewhat in 2014, as six additional highway construction projects slated for the Parks Highway will increase employment in the heavy and civil engineering piece of the construction industry.
New stores, but few new jobs
Road construction disrupted shopping downtown last year and put pressure on some of the area’s
stores, though those businesses are a fairly small portion of retail employment. General merchan-dise stores such as Fred Meyer and Walmart make up nearly 30 percent of the industry, and stability in these larger stores led to steady employment for the industry overall in 2013.
With the end of the construc-tion downtown and the addition of several new businesses, such as REI, Walgreen’s, and Kay Jewelers, retail employment in Fairbanks is expected to hold steady this year.
Attrition in utilities
Utilities make up approximately 17 percent of the transportation, warehousing, and utilities sector in the Fairbanks North Star Borough. While trans-portation and warehousing have been a source of stable employment for years, Fairbanks’ power companies have lost jobs.
This highly automated utilities sector has not un-dergone major changes, but has steadily lost em-ployees over the last two years through attrition, or not replacing employees who retire. However, the job losses through the end of 2013 were large enough that additional losses in 2014 are unlikely.

12 ALASKA ECONOMIC TRENDS JANUARY 2014
Construction, Health Care Expected to Balance out Government LossesFairbanks North Star Borough employment forecast, 2013 and 20142
2012 Monthly Average
2013 Monthly Average1
Change 2012 to
2013
Percentage Change 2012
to 20132014 Monthly
AverageChange
2013 to 2014
Percentage Change 2013
to 2014Total Nonfarm Employment2 39,300 38,900 -400 -1.0% 39,100 200 0.5%Natural Resources and Mining 1,500 1,500 0 0% 1,500 0 0%Construction 2,600 2,500 -100 -3.8% 2,600 100 4.0%Manufacturing 600 600 0 0% 600 0 0%Trade, Transportation, and Utilities 7,900 7,800 -100 -1.3% 7,800 0 0% Retail Trade 4,700 4,700 0 0% 4,700 0 0% Transportation, Warehousing, and Utilities 2,500 2,400 -100 -4.0% 2,400 0 0%Information 500 500 0 0% 500 0 0%Financial Activities 1,400 1,400 0 0% 1,400 0 0%Professional and Business Services 2,500 2,400 -100 -4.0% 2,400 0 0%Educational5 and Health Services 5,200 5,300 100 1.9% 5,400 100 1.9% Health Care 3,800 3,900 100 2.6% 4,000 100 2.6%Leisure and Hospitality 4,200 4,200 0 0% 4,200 0 0%Other Services 1,200 1,200 0 0% 1,200 0 0%Total Government 11,700 11,500 -200 -1.7% 11,500 0 0% Federall6 3,300 3,100 -200 -6.1% 3,000 -100 -3.2% State7 5,400 5,400 0 0% 5,400 0 0% Local8 3,000 3,000 0 0% 3,100 100 3.3%
1Preliminary estimates2Excludes the self-employed, fi shermen and other agricultural workers, and private household workers. For estimates of fi sh harvesting employment and other fi sheries data, go to labor.alaska.gov/research/seafood/seafood.htm.3Private education only4Excludes uniformed military5Includes the University of Alaska. Variations in academic calendars from year to year occasionally create temporarily large over-the-year changes.6Includes public school systems. Variations in academic calendars from year to year occasionally create temporarily large over-the-year changes. Source: Alaska Department of Labor and Workforce Development, Research and Analysis Section
Construction Jobs Took a Hit in 2013Fairbanks North Star Borough, 2000 to 20133
*PreliminarySource: Alaska Department of Labor and Workforce Development, Research and Analysis Section
0
500
1,000
1,500
2,000
2,500
3,000
2000 2001 2002 2003 2004 2005 2006 2007 2008 2009 2010 2011 2012 2013*
Specialty Trade Contractors
Heav
Construc on of Buildings
Financial sector remains low
The general slowdown of the Fairbanks economy in 2013 limited the need for new jobs in the fi nancial sector. Individuals and businesses also seem to be sitting on their money instead of reinvesting, as shown by a decrease in the value of loans with an in-crease in account deposits.
The uncertainty during the fi rst of half of 2013 surrounding the possible movement of the F-16 Squadron from Eielson Air Force Base may have reduced the number of military families that might otherwise have purchased homes during the year. This uncertainty likely spilled over into other private industries and reduced invest-ments on a broad scale.
With the F16s remaining in Fairbanks and no deployments scheduled for this year, this industry may see an increase in

13JANUARY 2014 ALASKA ECONOMIC TRENDS
the coming year, but it’s unlikely to be enough to move the industry average by much.
Health care still growing
Health care has grown consistently for de-cades, gaining 100 jobs in 2013 and fore-casted to produce another 100 in 2014. Hospital employment, which makes up 45 percent of all health care in the borough, has been stable since 2010 and will likely continue that trend. (See Exhibit 4.)
The vast majority of the growth has come from ambulatory, nursing, and residential care and will continue into 2014 as an ag-ing population increases the demand, es-pecially for nursing and residential care.
The pace of health care’s growth has slowed with time, however, a trend that confl icts with the increasing need of an aging population and makes the industry’s distant future uncertain. Whether the industry con-tinues to grow after 2014 will depend somewhat on whether borough residents stay in the area as they get older.
Social services structure changes
Employment in private social services has been fairly stable for more than a decade in the Fair-banks area and will continue to be stable into 2014. (See Exhibit 4.)
The makeup of support services jobs has changed, though, with strong growth in individual and fam-ily services, which makes up 34 percent of all social services, mostly offset by losses in child day care, vocational rehabilitation, and emergency relief.
More visitors, but not more jobs
Preliminary counts of borough visitors were up slightly in 2013, though bed tax receipts for the third quarter of 2013 were down 11 percent com-pared to 2012. These numbers seem contradictory, so it’s likely the additional visitors were mostly day-visitors or visitors staying with area residents. There were no other increases elsewhere in the lei-sure and hospitality industry in 2013.
The 2013-2014 winter closure of the Princess Hotel will likely reduce employment in 2014, but it will be a boon to the remaining hotels hosting aurora borealis-viewing tourists this winter. Ad-ditional jobs from expected increased winter and summer tourism in 2014 would balance employ-ment losses from the closure of the Princess Hotel.
Fewer federal job declines
Federal employment has been declining through attrition and budget cuts since 2008, and fell by an additional 200 jobs in 2013. Due to the 400 jobs lost between 2008 and 2013, losses are likely to number just 100 in 2014.
When it comes to reducing payroll spending, the low-hanging fruit has already been plucked — ad-ditional declines in federal employment may have to start coming from layoffs instead of just retire-ments.
University enrollment inches up
Jobs at the University of Alaska Fairbanks re-mained stable in 2013 as enrollment increased slightly. Enrollment had declined each year since 2010 after a long-term upward trajectory, likely an after-effect of the recent national recession. (See Exhibit 5.)
Health Care Grows, Social Services SteadyFairbanks North Star Borough, 2000 to 20134
Source: Alaska Department of Labor and Workforce Development, Research and Analysis Section
0
1,000
2,000
3,000
4,000
5,000
6,000
2000 2001 2002 2003 2004 2005 2006 2007 2008 2009 2010 2011 2012 2013
Health Care
Social Services

14 ALASKA ECONOMIC TRENDS JANUARY 2014
With increased enrollment and fairly stable uni-versity budgets, employment at the university as well as state government as a whole is unlikely to change in Fairbanks in 2014.
More kids will mean more jobs
Public education makes up nearly two-thirds of all local government employment in the Fairbanks North Star Borough, and schools will likely need more jobs this year. Enrollment went up last year, and fall increases in both employment and enroll-ment will carry over into 2014.
This growth will likely continue for several years due to increasing numbers of borough children entering their school-age years, prompting an in-crease in employment as well.
Upward Bump for UAF EnrollmentUniversity of Alaska Fairbanks, 1998 to 20135
Source: Alaska Department of Labor and Workforce Development, Research and Analysis Section
0
1,000
2,000
3,000
4,000
5,000
6,000
7,000
8,000
9,000
10,000
1998 1999 2000 2001 2002 2003 2004 2005 2006 2007 2008 2009 2010 2011 2012 2013
JANUARY 1966
Nineteen-sixty-fi ve registered the greatest year-to-year workforce gains since
statehood. Backed up by this substantial boost, the January workforce level topped all comparable months, in spite of the seasonal employment dip over the last 30 days.
Manufacturing, trade, fi nance, services, and state and local government segments reached employment heights never before recorded for this time of year. Correlating with this growth, personal income, at an adjusted annual rate, continued climbing and marked a 64 percent rise since 1958.
Alaska fi gured in the national military construction cutback announced recently, with the postponement of a $15 million program. Several construction bid invitations issued by the U.S. Army Corps of Engineers have been canceled, with the Air Force taking the largest losses.
The value of total mineral production during the past year exceeded the 1964 level, due primarily to natural gas and crude oil output, as stated by the U.S. Bureau of Mines. In spite of a striking rise in gas production over December 1964, the yearly average was down, while oil production rose steadily but at a slower pace.
Alaska Economic Trends has been published in Alaska since 1961. Historical articles are available at labor.alaska.gov/trends as far back as 1978, and complete issues are available from 1994.
This month in Trends history

15JANUARY 2014 ALASKA ECONOMIC TRENDS
Modest growth for Southeast a er slight loss last yearBy MALI ABRAHAMSON
Southeast is forecasted to add about 100 jobs this year, for mild growth of 0.3 percent. Relatively small government job
losses will mostly offset scattered private sector gains.
In the absence of any large foundational changes to the region’s economy in 2014, three main factors are expected to infl uence 2014’s numbers: 1) lack of population growth, 2) disproportionately retirement-age workers, and 3) piecemeal ongoing recovery in several private-sector industries.
Southeast’s economic strengths in 2014 will be fi shing and tourism, while government and surprisingly health care will be weak spots. The mild growth will be a directional change from 2013, when Southeast lost jobs for the fi rst time since 2009. (See Exhibit 1.)
Economy changed in the ’90s
Between statehood and the early 1990s, Southeast added jobs at about 800 per year. In the last two decades, which included the declines of the timber and pulp industries and the population loss that followed, growth slowed to about 150 jobs a year on average. (See Exhibit 2.)
A shifting age structure
Two big questions for Southeast’s future are how much of its growing retirement-age population will stay and who will replace them at work. The age group in their prime working years, ages 25 to 54, grew from 2009 to 2011, possibly related to the opening of Kensington Mine near Juneau, but that growth slowed in 2012. (See Exhibit 3.)
Overall, population projections are mostly fl at through 2015 and show an increasingly older population, which means fewer workers.
Modest Job Growth for 2014Southeast Alaska, 2003 to 20141
*PreliminarySource: Alaska Department of Labor and Workforce Development, Research and Analysis Section
1.4%
-0.6%
2.2%
1.5%
-0.3% -0.1%
-2.2%
0.8%1.0%
1.7%
--0.1%
0.3%
2003 2004 2005 2006 2007 2008 2009 2010 2011 2012 2013* 2014
Government plays major role Government is Southeast’s biggest economic driver, providing 35 percent of jobs and 43 percent of wages, but federal and local jobs have fallen since 2010. Government jobs pay 40 percent more on average than the private sector and tend to be year-round, so those declines have a larger-than-average impact on the region’s economy.
With the exception of 2010, when the temporary hiring of Census workers raised job numbers, federal government employment has been shrinking in
Southeast since 2004, primarily due to reductions in Forest Service jobs within the U.S. Department of Agriculture.
This differs from other parts of the state where the defense-related jobs play a more important role and where federal government numbers have been more affected by sequestration and tighter federal budgets. (See Exhibit 4.) Another difference is that Southeast’s losses have been more gradual and long-term.

16 ALASKA ECONOMIC TRENDS JANUARY 2014
Southeast’s Population Gets OlderPercent change, 2001 to 20123
Source: Alaska Department of Labor and Workforce Development, Research and Analysis Section
-3%
-2%
-1%
0%
1%
2%
3%
-1,500
-1,000
-500
0
500
1,000
1,500 Under 25Age
25 to 5455+
growth (percent)
2001 2002 2003 2004 2005 2006 2007 2008 2009 2010 2011 2012
New Kensington mine
Historical Job GrowthSoutheast, 1959 to 20122
Source: Alaska Department of Labor and Workforce Devel-opment, Research and Analysis Section
5,000
10,000
15,000
20,000
25,000
30,000
35,000
40,000
19591963
19671971
19751979
19831987
19911995
19992003
20072011
Economy’s structure
Local government cutbacks have also become the norm over the past three years, decreasing by about 50 jobs a year, or 1 percent. This sector provides 16 percent of the region’s jobs. Tribal jobs — counted under local government — fell in 2011, bounced back in 2012, and fell again in 2013 while schools districts and municipal government have shed jobs since 2011.
State government employment has been fl at for a decade in the region, and neither the governor’s budget nor the most recent revenue forecasts suggest job growth is likely in 2014.
Effect on the private sector
Flat or declining government job counts impact private sector employment as well. Aside from job losses, retirements can also affect local economies given that workers with more experience tend to make more money. As they retire, many of those workers will be replaced by less experienced, less costly workers, which could temporarily lower both total and average wages.
If retirees remain and spend their retirement incomes and savings in the region, however, they
could also stimulate local economies.
Several sectors will grow
Leisure and hospitality will add 100 jobs in Southeast in 2014, continuing its upswing and recovery from the U.S recession. Transportation and trade saw an uptick in jobs in 2013 after dropping sharply in 2009 and staying low for a few years. Transportation and trade jobs are forecasted to grow by 100 again this year, on the way to regaining their 2008 peak of 7,800 jobs.
Health care growth slows
Private education, health care, and social services employment in Southeast has had a long growth streak of about 4 percent per year over the past decade. Though the health care demands of an aging population suggest more growth is possible, the industry is forecasted to decline by 1 percent this year. This may seem like a surprising drop for such a high-growth industry, but it isn’t unprecedented — job counts also dipped briefl y in 2007 and 2008.
The industry provides 17 percent of jobs in the region but just 10 percent statewide, and this

17JANUARY 2014 ALASKA ECONOMIC TRENDS
Professional Services, Tourism To Offset Federal Job LossesSoutheast Alaska employment forecast, 2013 and 20145
2012MonthlyAverage
2013Monthly
Average1
Change2012 to
2013
PercentChange
2012 to 2013
2014MonthlyAverage
Change2013 to
2014
PercentChange
2013 to 2014Total Nonfarm Employment2 37,550 37,450 -100 -0.3% 37,550 100 0.3%Total Private Employment 24,050 24,150 100 0.4% 24,350 200 0.8%Natural Resources and Mining 1,000 1,000 0 0% 1,000 0 0%Construction 1,550 1,600 50 3.2% 1,600 0 0%Manufacturing 2,050 2,100 50 2.4% 2,100 0 0%Trade, Transportation and Utilities 7,100 7,150 50 0.7% 7,250 100 1.4%Information 450 500 50 11.1% 500 0 0%Financial Services 1,250 1,150 -100 -8.0% 1,150 0 0%Professional and Business Services 1,650 1,600 -50 -3.0% 1,650 50 3.0%Educational3 and Health Services 4,050 3,950 -100 -2.5% 3,900 -50 -1.3%Leisure and Hospitality 3,700 3,750 50 1.4% 3,850 100 2.6%Other Services 1,250 1,350 100 8.0% 1,350 0 0%Government 13,500 13,300 -200 -1.5% 13,200 -100 -0.8% Federal4 1,700 1,600 -100 -5.9% 1,550 -50 -3.2% State5 5,550 5,550 0 0% 5,550 0 0% Local6 6,250 6,150 -100 -1.6% 6,100 -50 -1.0%
1Preliminary estimates2Excludes the self-employed, fi shermen and other agricultural workers, and private household workers. For estimates of fi sh harvesting employ-ment and other fi sheries data, go to labor.alaska.gov/research/seafood/seafood.htm.3Private education only4Excludes uniformed military5Includes the University of Alaska. Variations in academic calendars from year to year occasionally create temporarily large over-the-year changes.6Includes public school systems. Variations in academic calendars from year to year occasionally create temporarily large over-the-year changes. Source: Alaska Department of Labor and Workforce Development, Research and Analysis Section
Federal Jobs Used to Track DifferentlySoutheast vs. statewide, 2002 to 20144
*PreliminarySource: Alaska Department of Labor and Workforce Development, Research and Analysis Section
-6%
-4%
-2%
0%
2%
4%
6%
Percent change SoutheastPercent change Alaska
2002 2003 2004 2005 2006 2007 2009 2010 2011 2012 2013* 20142008
fi gure doesn’t include health care facilities run by local governments.
Health care run by local governments — the medical centers in Juneau, Wrangell, Petersburg, and Sitka — have added about 25 jobs a year, reaching 850 in 2013.
Mining growth levels off
Much of the recent growth in mining and logging, mostly from the Kensington mine near Juneau, has leveled off. Despite a busy exploration schedule — exploration and development expenditures in Southeast totaled $121 million in 2012 according to the most recent estimates by the Department of Natural Resources — no notable new mining projects are slated for 2014, so the industry isn’t forecasted to add jobs.
Continued on page 19
18 ALASKA ECONOMIC TRENDS JANUARY 2014
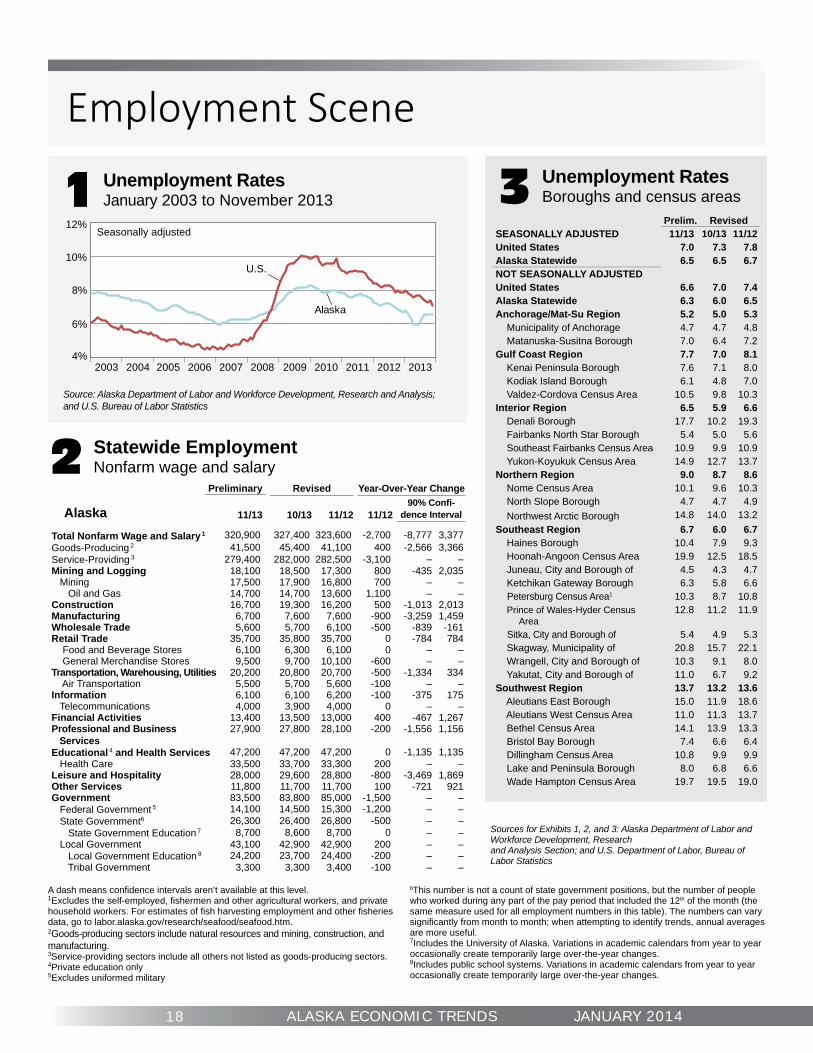
Employment Scene
Prelim. RevisedSEASONALLY ADJUSTED 11/13 10/13 11/12United States 7.0 7.3 7.8Alaska Statewide 6.5 6.5 6.7NOT SEASONALLY ADJUSTEDUnited States 6.6 7.0 7.4Alaska Statewide 6.3 6.0 6.5Anchorage/Mat-Su Region 5.2 5.0 5.3 Municipality of Anchorage 4.7 4.7 4.8 Matanuska-Susitna Borough 7.0 6.4 7.2Gulf Coast Region 7.7 7.0 8.1 Kenai Peninsula Borough 7.6 7.1 8.0 Kodiak Island Borough 6.1 4.8 7.0 Valdez-Cordova Census Area 10.5 9.8 10.3Interior Region 6.5 5.9 6.6 Denali Borough 17.7 10.2 19.3 Fairbanks North Star Borough 5.4 5.0 5.6 Southeast Fairbanks Census Area 10.9 9.9 10.9 Yukon-Koyukuk Census Area 14.9 12.7 13.7Northern Region 9.0 8.7 8.6 Nome Census Area 10.1 9.6 10.3 North Slope Borough 4.7 4.7 4.9 Northwest Arctic Borough 14.8 14.0 13.2Southeast Region 6.7 6.0 6.7 Haines Borough 10.4 7.9 9.3 Hoonah-Angoon Census Area 19.9 12.5 18.5 Juneau, City and Borough of 4.5 4.3 4.7 Ketchikan Gateway Borough 6.3 5.8 6.6 Petersburg Census Area1 10.3 8.7 10.8 Prince of Wales-Hyder Census Area
12.8 11.2 11.9
Sitka, City and Borough of 5.4 4.9 5.3 Skagway, Municipality of 20.8 15.7 22.1 Wrangell, City and Borough of 10.3 9.1 8.0 Yakutat, City and Borough of 11.0 6.7 9.2Southwest Region 13.7 13.2 13.6 Aleutians East Borough 15.0 11.9 18.6 Aleutians West Census Area 11.0 11.3 13.7 Bethel Census Area 14.1 13.9 13.3 Bristol Bay Borough 7.4 6.6 6.4 Dillingham Census Area 10.8 9.9 9.9 Lake and Peninsula Borough 8.0 6.8 6.6 Wade Hampton Census Area 19.7 19.5 19.0
3 Unemployment RatesBoroughs and census areas
2 Statewide EmploymentNonfarm wage and salary
Preliminary Revised Year-Over-Year Change
Alaska 11/13 10/13 11/12 11/1290% Confi -
dence Interval
Total Nonfarm Wage and Salary 1 320,900 327,400 323,600 -2,700 -8,777 3,377Goods-Producing 2 41,500 45,400 41,100 400 -2,566 3,366Service-Providing 3 279,400 282,000 282,500 -3,100 – –Mining and Logging 18,100 18,500 17,300 800 -435 2,035 Mining 17,500 17,900 16,800 700 – – Oil and Gas 14,700 14,700 13,600 1,100 – –Construction 16,700 19,300 16,200 500 -1,013 2,013Manufacturing 6,700 7,600 7,600 -900 -3,259 1,459Wholesale Trade 5,600 5,700 6,100 -500 -839 -161Retail Trade 35,700 35,800 35,700 0 -784 784 Food and Beverage Stores 6,100 6,300 6,100 0 – – General Merchandise Stores 9,500 9,700 10,100 -600 – –Transportation, Warehousing, Utilities 20,200 20,800 20,700 -500 -1,334 334 Air Transportation 5,500 5,700 5,600 -100 – –Information 6,100 6,100 6,200 -100 -375 175 Telecommunications 4,000 3,900 4,000 0 – –Financial Activities 13,400 13,500 13,000 400 -467 1,267Professional and Business Services
27,900 27,800 28,100 -200 -1,556 1,156
Educational 4 and Health Services 47,200 47,200 47,200 0 -1,135 1,135 Health Care 33,500 33,700 33,300 200 – –Leisure and Hospitality 28,000 29,600 28,800 -800 -3,469 1,869Other Services 11,800 11,700 11,700 100 -721 921Government 83,500 83,800 85,000 -1,500 – – Federal Government 5 14,100 14,500 15,300 -1,200 – – State Government6 26,300 26,400 26,800 -500 – – State Government Education 7 8,700 8,600 8,700 0 – – Local Government 43,100 42,900 42,900 200 – – Local Government Education 8 24,200 23,700 24,400 -200 – – Tribal Government 3,300 3,300 3,400 -100 – –
Unemployment RatesJanuary 2003 to November 20131
Source: Alaska Department of Labor and Workforce Development, Research and Analysis; and U.S. Bureau of Labor Statistics
Sources for Exhibits 1, 2, and 3: Alaska Department of Labor and Workforce Development, Research and Analysis Section; and U.S. Department of Labor, Bureau of Labor Statistics
A dash means confi dence intervals aren’t available at this level.1Excludes the self-employed, fi shermen and other agricultural workers, and private household workers. For estimates of fi sh harvesting employment and other fi sheries data, go to labor.alaska.gov/research/seafood/seafood.htm.2Goods-producing sectors include natural resources and mining, construction, and manufacturing.3Service-providing sectors include all others not listed as goods-producing sectors.4Private education only5Excludes uniformed military
6This number is not a count of state government positions, but the number of people who worked during any part of the pay period that included the 12th of the month (the same measure used for all employment numbers in this table). The numbers can vary signifi cantly from month to month; when attempting to identify trends, annual averages are more useful.7Includes the University of Alaska. Variations in academic calendars from year to year occasionally create temporarily large over-the-year changes.8Includes public school systems. Variations in academic calendars from year to year occasionally create temporarily large over-the-year changes.
2003 2004 2005 2006 2007 2008 2009 2010 2011 2012
U.S.
Alaska
Seasonally adjusted
4%
6%
8%
10%
12%
2013

19JANUARY 2014 ALASKA ECONOMIC TRENDS
Employer Resources ,
Consider on-the-job training for a new employeeThe On-the-Job Training program, or OJT, can greatly benefi t businesses wishing to grow. An OJT provides an “earn while you learn” work environment for a job seeker in need of training. Most importantly, with an established OJT, the employer can help customize the job seeker’s training plan to suit particular business needs.
For employers focused on the bottom line, the value of an OJT is in the partial reimbursement of wages. This wage reimbursement, which is provided by the Alaska Department of Labor and Workforce Development, helps the employer as well as the worker. By establishing an OJT, the employer invests in the business’ future and in
a loyal worker whose skills are tailored to the employer’s needs.
Creating an OJT is simple. Recruitment, screening, and training begin when an employer contacts an employ-ment specialist at one of Alaska’s 21 Job Centers. Call (877) 724-2539 to reach the Job Center near you.
Note: The On-The-Job Training program is contingent on availability of funds.
Employer Resources is published by the Employment Security Division of the Department of Labor and Workforce Development.
STATEWIDE FORECASTContinued from page 7
Just under a million cruise ship passengers vis-ited in 2013 and similar levels are expected in 2014. The cruise passenger count peaked in 2008 at just over a million before the recession tight-ened wallets across the country, but recently ris-ing levels suggest there’s still room to grow.
Strong outlookfor support services
Professional and business services is a hodge-podge, but it’s growing at a steady clip because of the important role many of its fi rms play in supporting Alaska’s basic industries, and is ex-pected to add 400 jobs in 2014.
Fishing’s contribution is major
Although commercial fi shermen are considered self-employed and not counted in the Alaska Department of Labor and Workforce Development’s standard job numbers, the industry’s economic impact on Southeast is signifi cant.
Fishing remains strong overall, and Southeast’s record $219 million in harvest value was the state’s highest in 2013.
Seafood processing employment — which is counted in the department’s job numbers — continued to inch toward an all-time high in 2013 with a July peak of 4,000 jobs. Processing employment is forecasted to remain fl at in 2014, though, due to the alternating harvest cycle of pink salmon.
SOUTHEAST FORECASTContinued from page 17