january 20081 mscl analyst’s toolbox instructors: jennifer barb, zoila g. rangel, peter munson jan...
Post on 19-Dec-2015
214 views
TRANSCRIPT

January 2008 1
MSCL Analyst’s Toolbox
Instructors:
Jennifer Barb, Zoila G. Rangel, Peter Munson
Jan 2008Mathematical and Statistical Computing LaboratoryDivision of Computational Bioscience

January 2008 2
Course OutlineDay 1
• MSCL Analyst’s Toolbox and JMP™ overview
• MSCL Toolbox Concepts
• JMP™fundamentals
• Lunch
• Affymetrix ExpressionConsole™, processing .cel files, exporting data
• MSCL Toolbox Demo– Data input– Basic Analysis (Master File, Final File, Data normalization, QC, PCA, )– Gene selection, statistical tests (p-values, FDR)– Annotation
Day 2
• Statistical Topics (PCA, Data normalization, FDR)
• MSCL Analyst’sToolbox Demo (cont.)
– Complex Analysis (2-way ANOVA, blocked ANOVA)– Data Visualization
January 2008 3
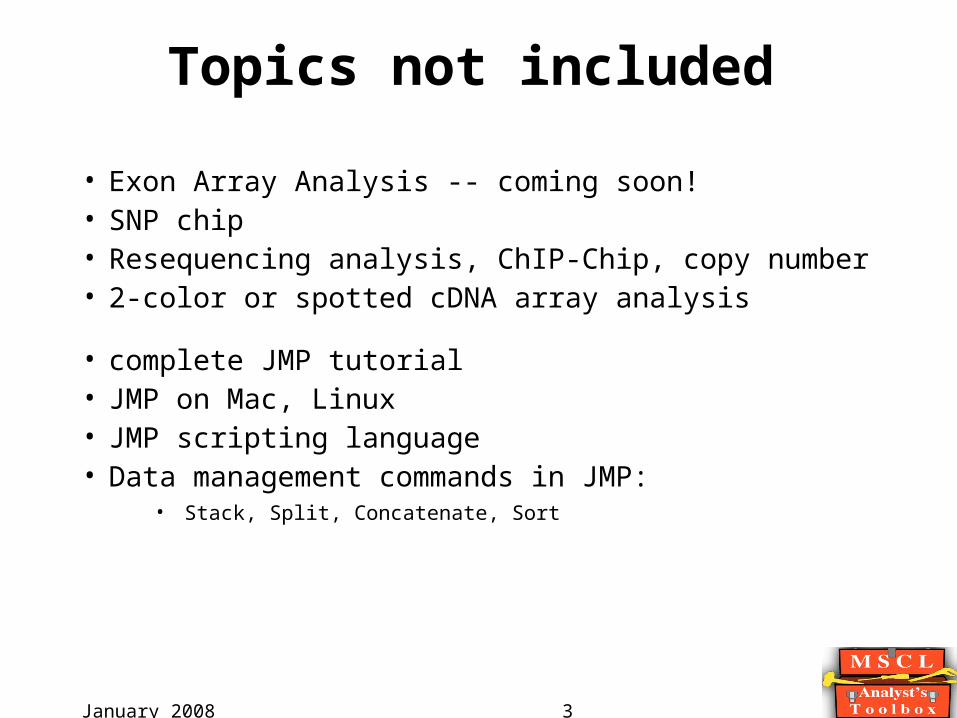
Topics not included
• Exon Array Analysis -- coming soon!• SNP chip• Resequencing analysis, ChIP-Chip, copy number• 2-color or spotted cDNA array analysis
• complete JMP tutorial• JMP on Mac, Linux• JMP scripting language• Data management commands in JMP:
• Stack, Split, Concatenate, Sort

January 2008 4
Why use JMP?
• Interactive graphics facilitates data exploration, discovery of features
• Powerful, > 2,00,000 rows by 100s of columns (currently, 2 GB limit)
• Scripting language -- object oriented, allows matrix manipulation
• Connects to database servers including NIHLIMS or local GCOS
• JMP is also general purpose statistics pack
• Good technical support for JMP from: (919) 677-8008 or www.jmp.com
• No direct cost to individual NIH users* (centrally supported in most NIH ICs)
• MSCL Analyst's Toolbox is FREE, adds tools for microarray studies

January 2008 5

January 2008 6
MSCL Analyst’s Toolbox Features
• Menu driven• Automated gene annotations• Web link-out**• Highly interactive, intuitive user interface• Analysis pipeline, based on years of experience• Familiar parametric analysis, e.g. ANOVA • Exploratory Data Analysis• Adaptable to new designs, analyses (e.g. Exon
chips, SNP chips)• Powerful, handles largest Affy chips, probe-
level analysis• Up to hundreds of chips at once• PC, Mac or Linux desktops• Support available through MSCL
January 2008 7
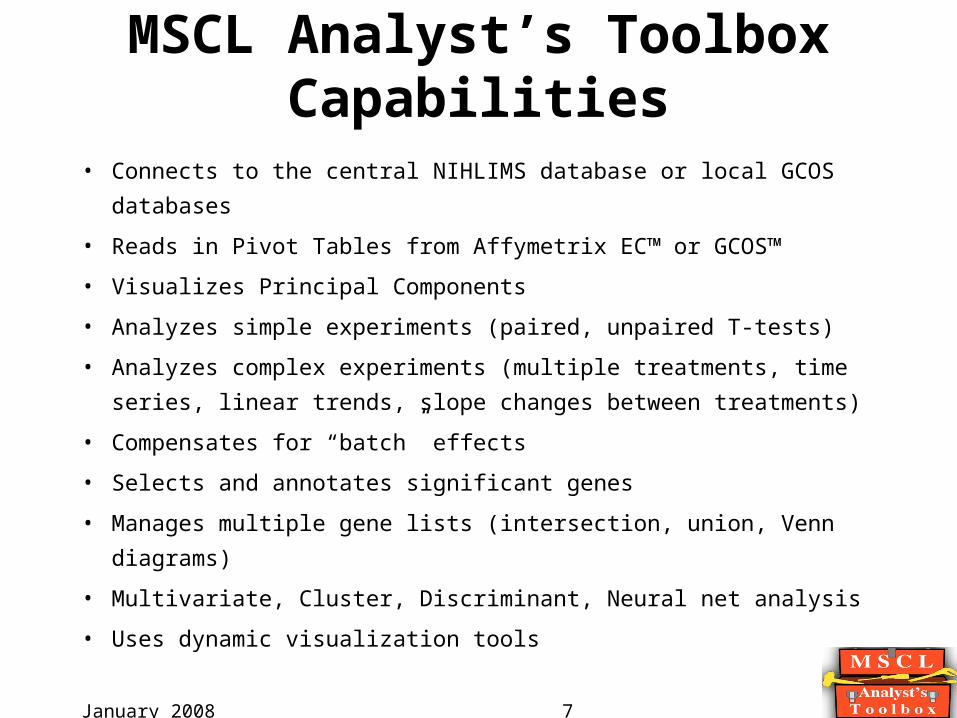
MSCL Analyst’s Toolbox Capabilities
• Connects to the central NIHLIMS database or local GCOS
databases
• Reads in Pivot Tables from Affymetrix EC™ or GCOS™
• Visualizes Principal Components
• Analyzes simple experiments (paired, unpaired T-tests)
• Analyzes complex experiments (multiple treatments, time
series, linear trends, slope changes between treatments)
• Compensates for “batch” effects
• Selects and annotates significant genes
• Manages multiple gene lists (intersection, union, Venn
diagrams)
• Multivariate, Cluster, Discriminant, Neural net analysis
• Uses dynamic visualization tools

January 2008 8
How to obtain:
• JMP
– http://isdp.cit.nih.gov/downloads/stats.asp
– Find your desktop support person at http://isdp.cit.nih.gov/information/contact_lookup_nih.asp
– JMP technical support from (919) 677-8008
• The MSCL Analyst's Toolbox
– Download from http://affylims.cit.nih.gov
– Help offered on collaborative basis by MSCL
– Email questions to: [email protected]

January 2008 9
NIH Bioinformatics Cooperative
http://affylims.cit.nih.gov

January 2008 10
• Input files or Fetch data
• Transform and normalize
• Principal Components Analysis
• Create Master file, add treatment groups
• Compute statistical test, get p-values
• Correct for multiple comparisons or use FalseDiscoveryRate
• Compute log fold-change
• Visualize results
• Select relevant genes
files
Xform
PCA
Master Final
MSCL Toolbox Data Pipeline:

January 2008 11
Data sources:
• NIHLIMS database via ODBC connection
• Local GCOS database via ODBC connection
• GCOS pivot table
• EC pivot table (NEW support for this option)
• Excel spread sheet
• Text files

January 2008 12
Data Input or data fetch
DCEG/NCIPublish DB<username/password>
MSCLPublish DB<username/password>
clientfiles
clientworkstation
Analyze (MAS)
Process DB<experiment>.dat files.cel files.chp files.rpt files
Import(LM)Export(LM)
Import
Publish(MAS)
ODBCaccess
DMT
Partek
GeneSpring
archive(LM)delete(LM)
assume ownership(LM)
Fluidics PlatformScanner
CCMDPublish DB
A-SCAN
NIHLIMS database
EC™ orGCOS™
MAS5™
.txt
January 2008 13
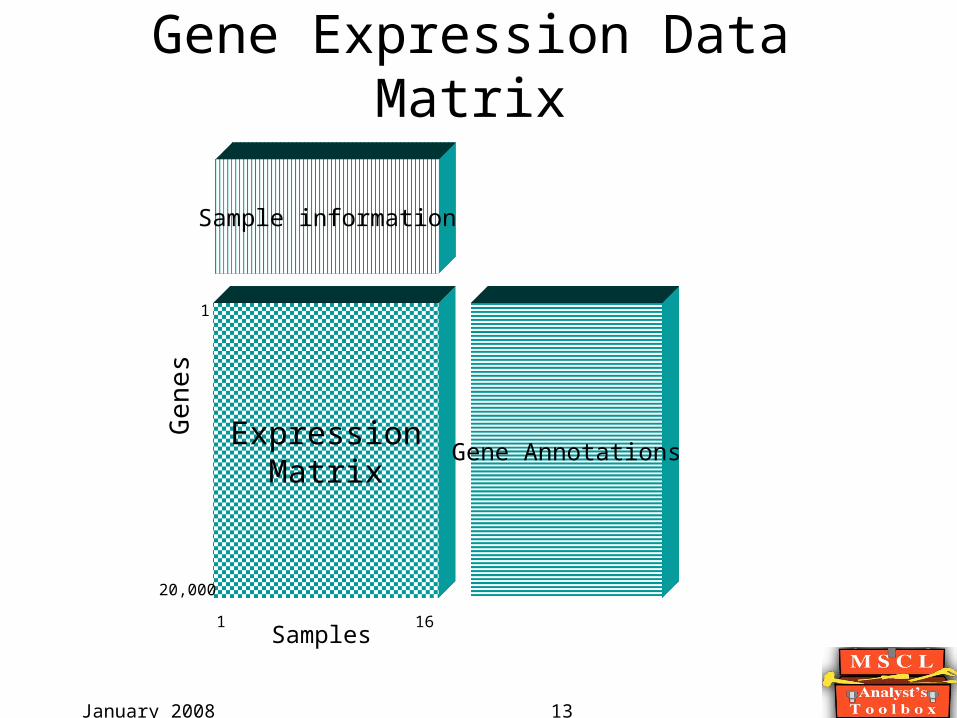
Gene Expression Data Matrix
ExpressionMatrix
1 16Samples
1
20,000
Gen
es
Gene Annotations
Sample information
January 2008 14
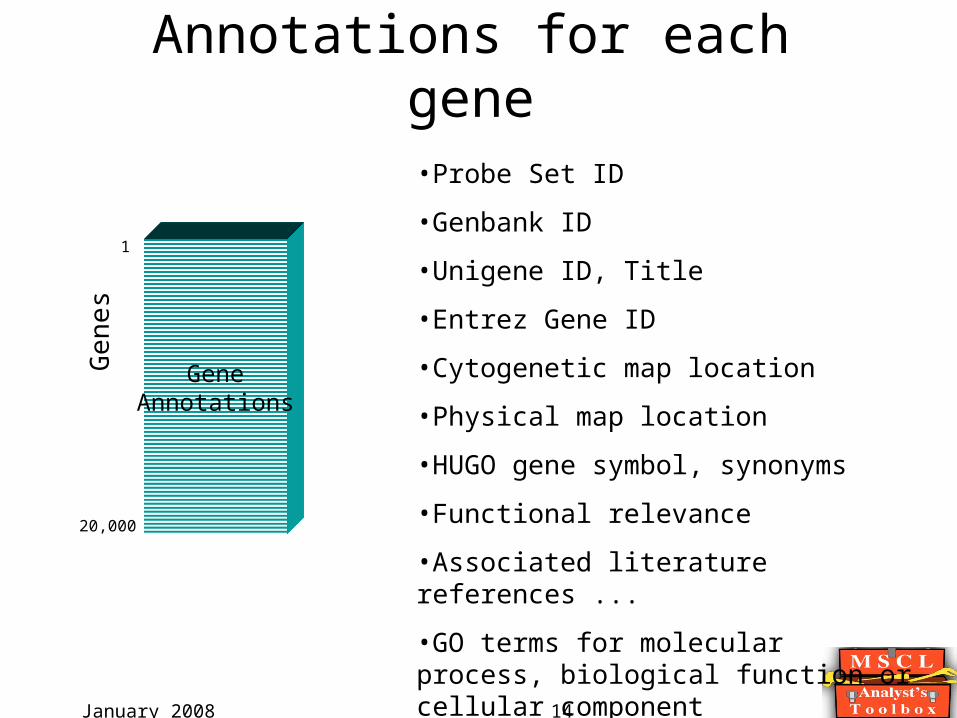
Annotations for each gene•Probe Set ID
•Genbank ID
•Unigene ID, Title
•Entrez Gene ID
•Cytogenetic map location
•Physical map location
•HUGO gene symbol, synonyms
•Functional relevance
•Associated literature references ...
•GO terms for molecular process, biological function or cellular component
GeneAnnotations
1
20,000
Gen
es
January 2008 15
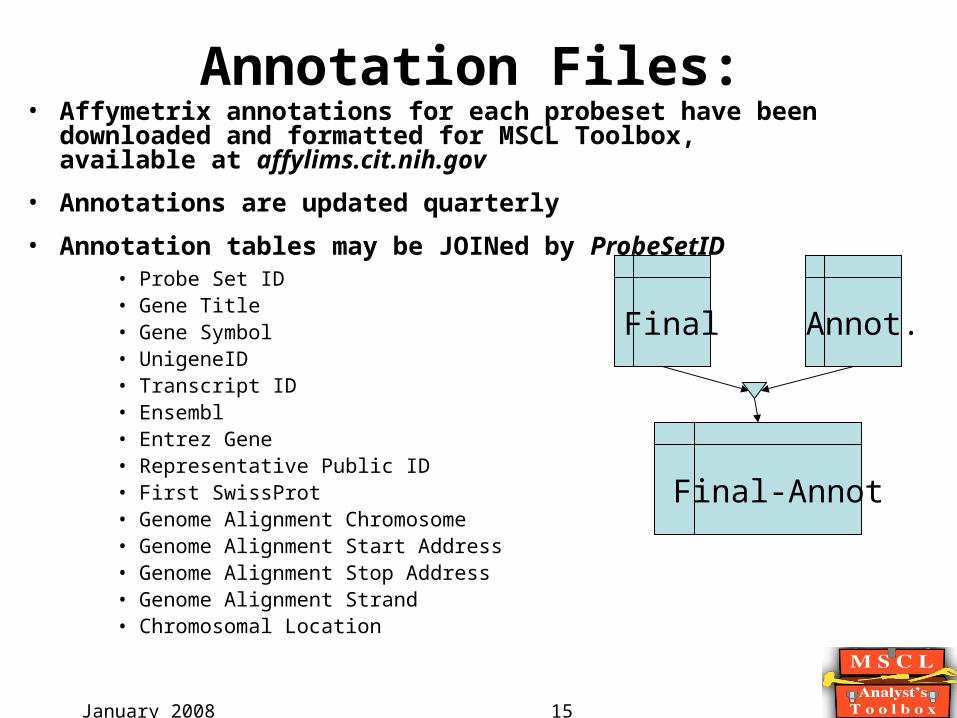
Annotation Files:• Affymetrix annotations for each probeset have
been downloaded and formatted for MSCL Toolbox, available at affylims.cit.nih.gov
• Annotations are updated quarterly
• Annotation tables may be JOINed by ProbeSetID • Probe Set ID• Gene Title• Gene Symbol• UnigeneID• Transcript ID• Ensembl• Entrez Gene• Representative Public ID• First SwissProt• Genome Alignment Chromosome• Genome Alignment Start Address• Genome Alignment Stop Address• Genome Alignment Strand• Chromosomal Location
Final Annot.
Final-Annot

January 2008 16
Annotating Genes
ProbeId SC1 SC2 SC3 SC4203895_at 2.587028 1.000087 2.36697 12.519738204438_at 20.304842 16.208242 18.255833 17.420254205014_at 27.675562 5.949408 11.417897 22.435179205422_s_at 0.675117 3.289166 1.246321 0.482394205723_at 57.744762 36.477444 57.647736 68.424454206202_at 0.747699 5.768585 1.697037 0.59452210059_s_at 132.814026 115.294777 173.679901 90.330193214694_at 69.676147 63.900715 75.71373 56.88485216618_at 11.109155 9.602924 6.501261 7.387063AFFX-r2-Hs18SrRNA-3_s_at901.977112 216.920197 1294.78479 487.987579
Probe Set ID Title Gene Symbol Sequence Derived FromUnigene NumberLocusLink203895_at phospholipase C, beta 4PLCB4 AL535113 Hs.151408 5332204438_at mannose receptor, C type 1MRC1 NM_002438 Hs.75182 4360205014_at heparin-binding growth factor binding proteinHBP17 NM_005130 Hs.1690 9982205422_s_at integrin, beta-like 1 (with EGF-like repeat domains)ITGBL1 NM_004791 Hs.311054 9358205723_at ciliary neurotrophic factor receptorCNTFR NM_001842 Hs.194774 1271206202_at mesenchyme homeo box 2 (growth arrest-specific homeo box)MEOX2 NM_005924 Hs.77858 4223210059_s_at mitogen-activated protein kinase 13MAPK13 BC000433 Hs.178695 5603214694_at Rho interacting protein 3RHOIP3 N31673 Hs.430725 23164216618_at --- --- AL117520 --- AFFX-r2-Hs18SrRNA-3_s_at--- --- AFFX-r2-Hs18SrRNA-3---
Probe Set ID Title of Subset of HG-U133A_annot.JMPGene Symbol Unigene NumberSC1 SC2 SC3 SC4203895_at phospholipase C, beta 4PLCB4 Hs.151408 2.587028 1.000087 2.36697 12.519738204438_at mannose receptor, C type 1MRC1 Hs.75182 20.304842 16.208242 18.255833 17.420254205014_at heparin-binding growth factor binding proteinHBP17 Hs.1690 27.675562 5.949408 11.417897 22.435179205422_s_at integrin, beta-like 1 (with EGF-like repeat domains)ITGBL1 Hs.311054 0.675117 3.289166 1.246321 0.482394205723_at ciliary neurotrophic factor receptorCNTFR Hs.194774 57.744762 36.477444 57.647736 68.424454206202_at mesenchyme homeo box 2 (growth arrest-specific homeo box)MEOX2 Hs.77858 0.747699 5.768585 1.697037 0.59452210059_s_at mitogen-activated protein kinase 13MAPK13 Hs.178695 132.814026 115.294777 173.679901 90.330193214694_at Rho interacting protein 3RHOIP3 Hs.430725 69.676147 63.900715 75.71373 56.88485216618_at --- --- --- 11.109155 9.602924 6.501261 7.387063AFFX-r2-Hs18SrRNA-3_s_at--- --- --- 901.977112 216.920197 1294.78479 487.987579
Netaffx, reformatted Your data file
“JOIN” on ProbeSetID

January 2008 17
Information about the Sample
(transposed into MasterFile)
1
16
Sam
ples
Information abouteach Sample
•Clinical information (human)
•Diagnosis
•Demographic information
•Treatment (in vivo, in vitro) in designed experiment
•Tissue of origin
•Cell culture, strain, passage
•Sampling date/time
•RNA preparation protocol
•Operator/batch/lot/laboratory information
•QC information (rawQ, scale factor, 3/5-actin, 3/5-GAPDH, etc)

January 2008 18
Table formats
• JMP usually deals with a single Table, but…
• TWO tables are needed for MSCL Analyst’s Toolbox:
• 1. "Master File" layout– Each ROW represents a chip
– Columns define treatment, replicate number, etc.
• 2. "Final" layout– COLUMNs correspond to chips (rows in Master File)
– Each ROW is a probe set, unique identifier is probe set ID
• Tables are LINKED by “Shortnames” field in Master

January 2008 19
Linked Table FormatsMaster File -- one row per chip
Final File -- one row per probe set

January 2008 20
Naming Convention for Final File Columns (prefixes)
• Data type: AD-, SG-, PA-
• Data transform: L-, Lmed-, GL-, S10-
• Statistical results: p-, FDR-, mean-, SFC-
• Column Naming Tips:
– Avoid punctuation, hyphen, period, slash, etc.
– Avoid spaces, use underscore “_” instead
– Shorter is better
– Toolbox utility available for trimming column names
Column Name
ITEM_NAMESG-33NHSG-33THS10-33NHS10-33THPA-33NHPA-33THSFC-7SFC-11p-slope¢2FDR slope¢2

January 2008 21
• Input files or Fetch data
• Transform and normalize
• Principal Components Analysis
• Create Master file, add treatment groups
• Compute statistical test, get p-values
• Correct for multiple comparisons or use FalseDiscoveryRate
• Compute log fold-change
• Visualize results
• Select relevant genes
Data Pipeline:files
Xform
PCA
Master Final

January 2008 22
Data Transformation and Normalization

January 2008 23
Log(x/median x) transform (“Lmed”)

January 2008 24
• Input files or Fetch data
• Transform and normalize
• Principal Components Analysis
• Create Master file, add treatment groups
• Compute statistical test, get p-values
• Correct for multiple comparisons or use FalseDiscoveryRate
• Compute log fold-change
• Visualize results
• Select relevant genes
Data Pipeline:files
Xform
PCA
Master Final

January 2008 25
Principal Components Analysis
-15
-10
-5
0
5
10
15
20Patt
ern
2
4C
4Dex
4IF
4IFDex
5C
5Dex
5IF 5IFDex
6C
6Dex6IF
6IFDex
7C7Dex7IF
7IFDex
8C
8Dex8IF
8IFDex
-30 -20 -10 0 10 20Pattern
10050861008115
Probe Array Lot
-15
-10
-5
0
5
10
15
20Patt
ern
2
4C
4Dex
4IF
4IFDex
5C
5Dex
5IF 5IFDex
6C
6Dex6IF
6IFDex
7C7Dex7IF
7IFDex
8C
8Dex8IF
8IFDex
-30 -20 -10 0 10 20Pattern
PC 1(38%)
PC 2(12%)

January 2008 26
• Input files or Fetch data
• Transform and normalize
• Principal Components Analysis
• Create Master file, add treatment groups
• Compute statistical test, get p-values
• Correct for multiple comparisons or use FalseDiscoveryRate
• Compute log fold-change
• Visualize results
• Select relevant genes
Data Pipeline:files
Xform
PCA
Master Final

January 2008 27
Analysis Scripts
• ANOVA1
• T-test, unequal variance
• Paired t-test
• Consistency test
• ANOVA1 with blocking
• ANOVA2 with interaction terms (unbalanced data allowed)
• ANOVA2 with blocking
• Linear regression
• ANCOVA with blocking (balanced data case)
• ANCOVA2 with blocking (balanced data case)
• Other tests are easily added (requires scripting)

January 2008 28
• Input files or Fetch data
• Transform and normalize
• Principal Components Analysis
• Create Master file, add treatment groups
• Compute statistical test, get p-values
• Correct for multiple comparisons or use FalseDiscoveryRate
• Compute log fold-change
• Visualize results
• Select relevant genes
Data Pipeline:files
Xform
PCA
Master Final

January 2008 29
Log(FoldChange)=“LFC”
FoldChange = treated / control
Log(FoldChange) = Log(treated / control)
= Log(treated) - Log(control)
Rule of Thumb for Base10 Logarithms:
Log10(2-fold change) = 0.3
Log10(10-fold change) = 1
Log10(0.1-fold change) = -1

January 2008 30
• Input files or Fetch data
• Transform and normalize
• Principal Components Analysis
• Create Master file, add treatment groups
• Compute statistical test, get p-values
• Correct for multiple comparisons or use FalseDiscoveryRate
• Compute log fold-change
• Visualize results
• Select relevant genes
Data Pipeline:files
Xform
PCA
Master Final

January 2008 31
Volcano PlotSignificance of change
Magnitude of change, Log Scale
0.00010.00006
0.00004
0.0010.0006
0.0004
0.0002
0.010.006
0.004
0.002
0.10.06
0.04
0.02
10.6
0.4
0.2p
-A1
-Tre
at-
tem
p
KIAA0626 gene product
-1 -0.5 0 .5 1LFC
SelectionRegions
January 2008 32
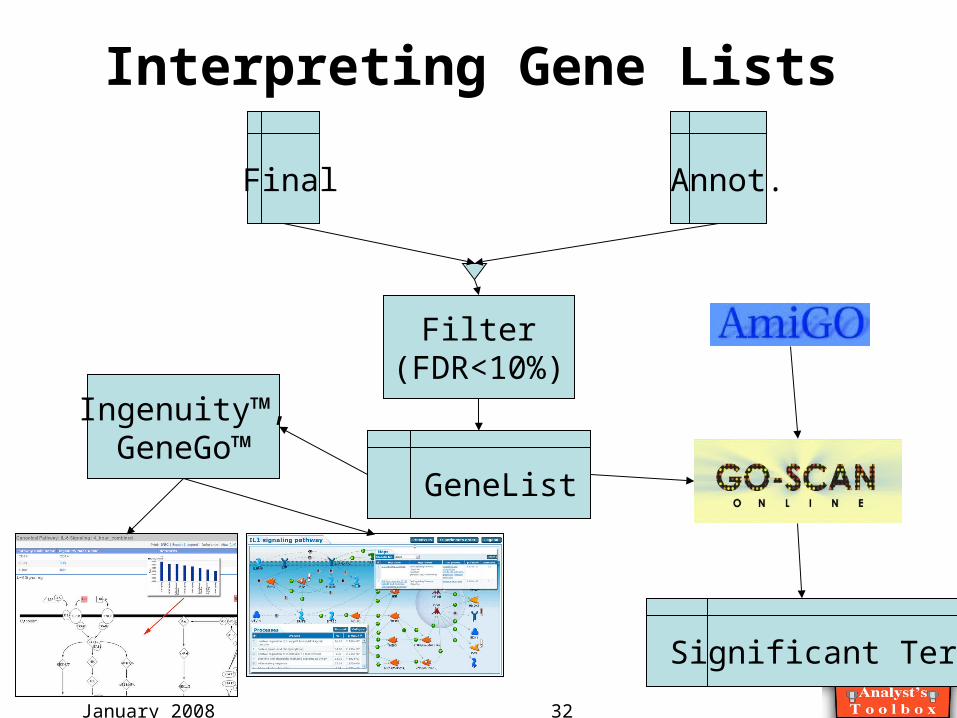
Interpreting Gene Lists
Final Annot.
Filter(FDR<10%)
GeneList
Significant Terms
Ingenuity™,GeneGo™

January 2008 33
GO-SCAN- Gene Ontology Annotations
•Gene Ontology for Significant Collection of Annotations: GO-SCAN is a bioinformaticstool that selects and presents relevant Gene Ontology (GO) annotations for a gene "hit"
list from an Affymetrix microarray experiment. http://goscan.cit.nih.gov/

January 2008 34
Ingenuity Pathway Analysis(Doug Joubert, NIH Library)