jan de vries university of california at berkeley
TRANSCRIPT

Taxing the Staff of Life: The Dutch bread tax, 1574-1855.
Jan de Vries University of California at Berkeley
For presentation to Yale Economic History Seminar
23 April 2012
Please do not cite without premission
Shortly after the Dutch Revolt began, in 1574, the province of Holland, as it
scrambled to secure revenue to conduct its war against Spain, introduced a series of excise taxes: on beer, wine, peat, slaughtered cattle, soap, fish, and on milled grain. Excise taxes had long been a familiar feature of municipal finances, especially excises of beer. But now, in addition to municipal excise taxes, there would be provincial levies as well, and these would be considerably larger than anything that had been collected by the towns. The new tax (called impost op ‘t gemaal, or het gemaal) was collected at grain mills, and varied according to the grain sort and the use to which the milled grain was to be put: more for wheat than rye, more for bread grain than brewers’ grain. This new tax was a cost born in the first instance by the baker. Bakers brought grain to the mill for conversion to flour (millers were forbidden to produce flour on their own account or to trade in flour), and paid the miller his fee plus the applicable tax. The milling tax was set at 3 guilders per last of wheat and 1.5 guilders per last of rye.1
Bakers in Holland – and nearly everywhere in Europe since at least the late
Middle Ages – were not free to set the prices for their products. Regulatory bodies, in Holland and the rest of the Dutch Republic these were always municipal authorities, set bread prices. They were guided in this by changes in the market prices of the bread grains, and usually required that bread be sold neither above nor below the official price. At the outset, the milling tax was a minor source of revenue. When the States of Holland introduced the excises in 1574 they estimated that they would yield a total annual revenue of 540,000 guilders, most of which would be generated by the
1 The Amsterdam last was the standard measure of Northern Europe‟s international grain trade. While it
was divided into smaller units which varied from town to town, all of these sub-units aggregated to the last.
The last measured 3003 liters, and amounted to a weight of approximately 2280 Kg. of wheat and 2160 kg.
of rye.

2
tax on beer.2 The milling tax, at its initial rates, tax added about 1.5-2.0 percent to the baker’s grain cost, but it appears to have had no effect on the cost of bread to consumers. The procedures used to set bread prices made no provision to add these costs to the calculation of bread prices; bakers were expected to “swallow” the cost of the new tax.3 But what began as a small levy gradually grew larger. The excise tax proved to be a flexible device to tap into the market-based consumption of Holland’s growing urban population. New goods became subject to the excise, and the tax rates were repeatedly increased. By 1586 all excises (in the aggregate, they were known as the gemene middelen, the general means, or general revenues), raised 1.5 million guilders, and by 1599, at least 2.7 million. Holland raised its milling tax faster than the average of its other excises: the milling tax was doubled in 1583, and doubled again in 1599. That is: the tax on a last of rye rose from 1.5 guilders to 3 guilders in 1583, and to 6 guilders in 1597. The tax on wheat was always double the tax on rye. The doubling of the milling tax in 1597 came at a time of very high grain prices. Political, religious and military disturbances beginning in the 1560s, and the general inflationary trend of the sixteenth-century “price revolution” had made grain price volatility a chronic problem and the region suffered full-blown subsistence crises in 1557, 1565-66, 1571-74. But the price rise of the mid-1590s was greater than anything the young Republic had experienced since it had set out to secure its independence some twenty years earlier. English grain prices rose considerably in 1593 and a poor harvest in 1594 cause wheat prices to rise to double the normal level.4 Matters only became worse in 1595 as shipments from the Baltic, mainly rye, declined sharply. By November of 1595 rye cost over 80 percent more than had prevailed in the decade 1582-91. The States General took the extraordinary step of placing a six-month prohibition of grain exports effective 19 November of that year and individual cities took a variety of measures to secure sufficient grain. Prices fell back a bit in the months thereafter, but political tensions led to the closure of the Danish Sound in1597, the vital artery for Baltic grain supplies and Dutch trade more generally. By July 1597 both rye and wheat sold for
2 W. Fritshy, MS. A full collection of het gemaal in 1575 might have brought in 65,000 guilders, about 12
percent of the expected total excise tax revenue. 3 I describe the method used to set bread prices – the method common to all of Europe – in Jan de Vries,
“The Political Economy of Bread in the Dutch Republic,” in Oscar Gelderblom, ed., The Political Economy
of the Dutch Republic (Farnam, Surrey, Ashgate, 2009), pp. 86-90. In a nutshell, bread prices were set in
direct proportion to the price of grain. If, say, a measure of wheat rose in price by 10 percent, the price of a
loaf of a given weight also rose by 10 percent. Thus, the added revenue would exactly suffice to cover the
increased cost of grain. No specific provision was made for other production costs (or taxes), but the
amount of bread that needed to be sold in order to cover the grain cost was always less – considerably less
– than the measure of grain was capable of yielding. In effect, a portion of the grain (called the baker‟s
“advantage loaves” in England, the overbroden in the Republic) was reserved to cover the non-grain
expenses and the profit of the baker. 4 R. B. Outhwaite, “Dearth, the English Crown and the „Crisis of the 1590s‟”, in Peter Clark, ed., The
European Crisis of the 1590s (xxxxxxxxxx), p. 28

3
double the 1582-91 average. Only in the course of 1599 did grain prices begin to drift down to more normal levels. The pressing reasons of state that led to a doubling of the milling tax in a period of enduring grain scarcity may also have led town magistrates all over Holland to introduce, beginning in 1596, a new method of bread price regulation. They replaced the conventional practice of linking the price of bread directly and proportionately to changes in the price of grain (which continued in use until at least the eighteenth century everywhere else in Europe) with a new system that distinguished the variable costs of grain with all other production costs, which were assumed to be constant. This new system required a more elaborate administration, since the constant costs needed to be identified of each type of bread and, of course, periodically adjusted. Moreover, the determination of the appropriate price for bread required the preparation and distribution of tables, since bakers and consumers could no longer simply read the official bread price from the market price of grain. This new, more sophisticated, regime of bread price regulation raises many interesting questions, but here I will confine my attention to its importance for Dutch tax policy. Until 1596, the bakers had been forced to absorb the milling tax. As this tax rose to non-trivial levels, the town magistrates must have recognized that they would face endless complaints from the guilds of bakers unless some means was devised to incorporate its cost into the official bread prices. To do so under the old system involved adding the tax to the grain price, and setting a correspondingly higher bread price. For example, if rye sold for 80 guilders per last, the price of a pound of rye bread would be that amount which, when multiplied by the pounds of bread agreed to be extractable from a last of grain, equaled the price of rye: 80 guilders/4000 pond = 0.02 gld, (or 0.40 stuiver). If one now added the tax of 1583: 80 + 3 guilders / 4000 pond = 0.021 gld (0.415 stuiver). At this higher price the baker can pay for his grain and the milling tax. He has passed the tax on to the consumer, but he has done much more than that. The baker would charge the same new higher price on all the additional bread he produced, bread intended to defray his other production costs. If this additional bread (the overbroden, or “advantage bread”) amounted to 1800 loaves, the baker’s revenue on a last’s worth of rye bread would increase from 36 guilders to 37.35. In short, to raise 3 guilders of public revenue, the baker would be allowed to charge consumers 4.35 guilders. And the higher the tax, the more the bakers would earn – all at the expense of the honest burghers. The 1597 tax would double those figures, increasing the “windfall” granted to the bakers. By introducing the new system of price regulation, with its clear distinction of constant costs (such as the excise tax) and variable costs, the magistrates resolved a source of friction with the bakers and established a mechanism by which the milling tax could be directly incorporated into the price of every type of bread. This was technically a superior procedure for setting bread prices. It corrected a tendency for bread prices to be too high (relative to total production costs) in time
4
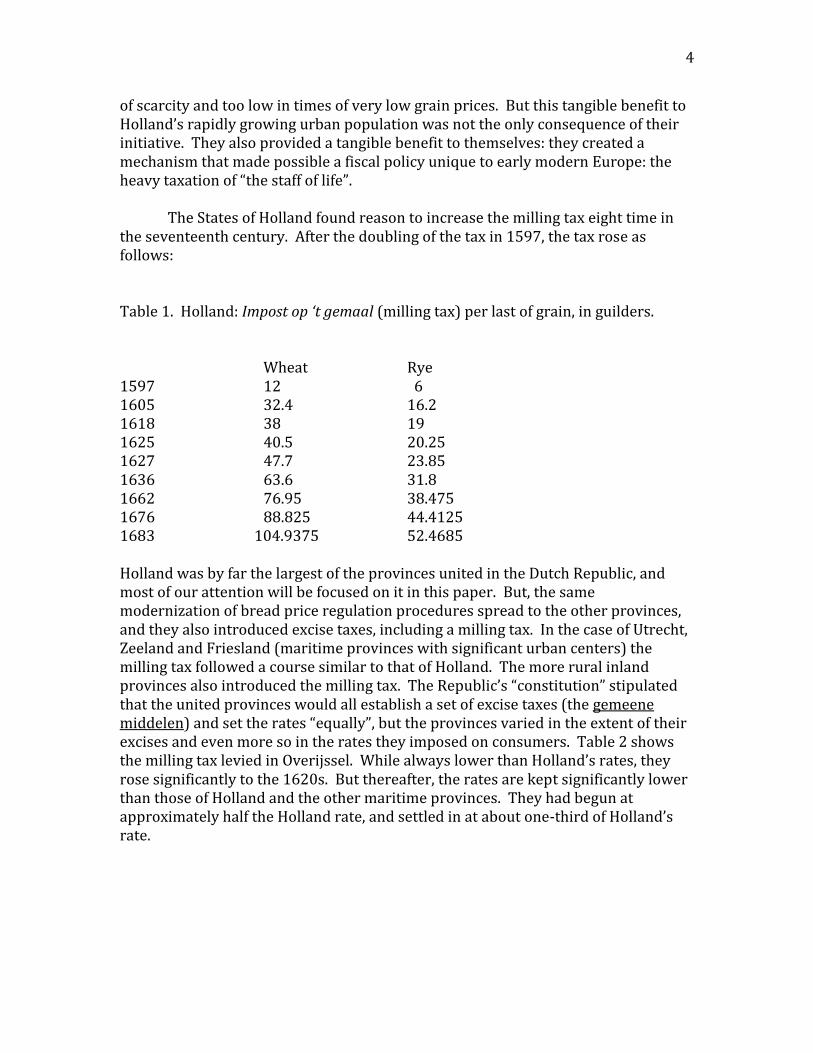
of scarcity and too low in times of very low grain prices. But this tangible benefit to Holland’s rapidly growing urban population was not the only consequence of their initiative. They also provided a tangible benefit to themselves: they created a mechanism that made possible a fiscal policy unique to early modern Europe: the heavy taxation of “the staff of life”. The States of Holland found reason to increase the milling tax eight time in the seventeenth century. After the doubling of the tax in 1597, the tax rose as follows: Table 1. Holland: Impost op ‘t gemaal (milling tax) per last of grain, in guilders. Wheat Rye 1597 12 6 1605 32.4 16.2 1618 38 19 1625 40.5 20.25 1627 47.7 23.85 1636 63.6 31.8 1662 76.95 38.475 1676 88.825 44.4125 1683 104.9375 52.4685 Holland was by far the largest of the provinces united in the Dutch Republic, and most of our attention will be focused on it in this paper. But, the same modernization of bread price regulation procedures spread to the other provinces, and they also introduced excise taxes, including a milling tax. In the case of Utrecht, Zeeland and Friesland (maritime provinces with significant urban centers) the milling tax followed a course similar to that of Holland. The more rural inland provinces also introduced the milling tax. The Republic’s “constitution” stipulated that the united provinces would all establish a set of excise taxes (the gemeene middelen) and set the rates “equally”, but the provinces varied in the extent of their excises and even more so in the rates they imposed on consumers. Table 2 shows the milling tax levied in Overijssel. While always lower than Holland’s rates, they rose significantly to the 1620s. But thereafter, the rates are kept significantly lower than those of Holland and the other maritime provinces. They had begun at approximately half the Holland rate, and settled in at about one-third of Holland’s rate.

5
Table 2. Overijssel: Impost op ‘t gemaal (milling tax) per last of grain, in guilders. Wheat Rye 1597 6.75 2.7 1603 12 3 1623 24 8 1627 24 12 1675 36 18
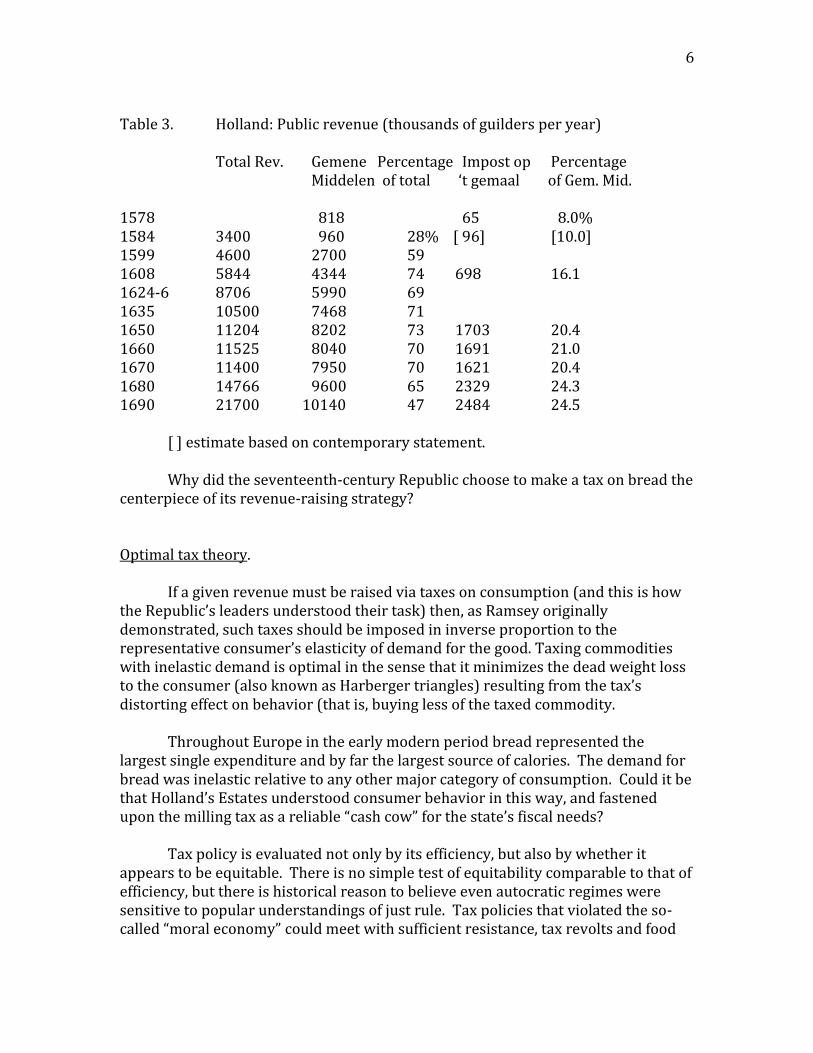
Let us pause for a moment to consider what the Republic’s rulers (the provincial estates, in which town regents predominated in nearly all provinces) had done. To begin with, they greatly increased public revenue from all sources. Table 3 shows the general course of Holland’s public revenues. Holland’s quota in the Republic’s budget was about 60 percent of the total though out the seventeenth and eighteenth century. It often contributed more to compensate for shortfalls in payments by other provinces, but the overall trends in the Republic’s revenues broadly followed those of Holland. Financing wars against Spain (to 1648), against England (1651-3 and 1664-7), and against France (1672-8 and 1689-1713) claimed the great bulk of public revenue, either in direct expenditures or in interest payments for public debt incurred, invariably, for war purposes. The Republic faced an urgent need to raise additional revenue, and the urgency recurred over and again throughout the seventeenth century. All provinces, and especially Holland, cultivated indirect taxes – the gemene middelen, or excise taxes – in order to raise additional revenues. Indeed, new excises and increased rates on those that existed delivered 95 percent of the growth in Holland’s revenues between 1584 and 1650. The milling tax, accounting for only 8 percent of the gemene middelen in 1584, grew to represent 20 percent by 1650, alone accounting for 23 percent of the total growth of the excises as a whole. After 1650, the gemene middelen cease to grow rapidly. Only a major renovation of these consumption taxes and a sharp increase in their rates pushes collections upward after 1680. But now the milling tax becomes even more important, accounting for a quarter of all excise tax receipts. By then, and for the entire eighteenth century – when the tax structure established in the 1680s changed very little – the milling tax stood at the heart of the complex of excise taxes, which accounted for over half of all public revenues.
6
Table 3. Holland: Public revenue (thousands of guilders per year) Total Rev. Gemene Percentage Impost op Percentage Middelen of total ‘t gemaal of Gem. Mid. 1578 818 65 8.0% 1584 3400 960 28% [ 96] [10.0] 1599 4600 2700 59 1608 5844 4344 74 698 16.1 1624-6 8706 5990 69 1635 10500 7468 71 1650 11204 8202 73 1703 20.4 1660 11525 8040 70 1691 21.0 1670 11400 7950 70 1621 20.4 1680 14766 9600 65 2329 24.3 1690 21700 10140 47 2484 24.5 [ ] estimate based on contemporary statement. Why did the seventeenth-century Republic choose to make a tax on bread the centerpiece of its revenue-raising strategy? Optimal tax theory.
If a given revenue must be raised via taxes on consumption (and this is how the Republic’s leaders understood their task) then, as Ramsey originally demonstrated, such taxes should be imposed in inverse proportion to the representative consumer’s elasticity of demand for the good. Taxing commodities with inelastic demand is optimal in the sense that it minimizes the dead weight loss to the consumer (also known as Harberger triangles) resulting from the tax’s distorting effect on behavior (that is, buying less of the taxed commodity.
Throughout Europe in the early modern period bread represented the largest single expenditure and by far the largest source of calories. The demand for bread was inelastic relative to any other major category of consumption. Could it be that Holland’s Estates understood consumer behavior in this way, and fastened upon the milling tax as a reliable “cash cow” for the state’s fiscal needs? Tax policy is evaluated not only by its efficiency, but also by whether it appears to be equitable. There is no simple test of equitability comparable to that of efficiency, but there is historical reason to believe even autocratic regimes were sensitive to popular understandings of just rule. Tax policies that violated the so-called “moral economy” could meet with sufficient resistance, tax revolts and food

7
riots, to make tax collection very costly.5 The milling tax was levied primarily on bakers (who “passed through” this cost via the regulated bread price) and it was collected by tax farmers who bid every six months for the right to collect this tax in a given district (a town and its surrounding district). It has been argued that this tended to diffuse opposition to the excise taxes in general, since ordinary consumers did not pay it and could direct their ire, when the occasion arose, at the small-fry tax farmers, who were easily replaced.6 But these arguments are difficult to accept as sufficient to account for Dutch quietude and a general lack of resistance to the milling tax. After all, the States of Holland raised the milling tax for wheat bread from one to two percent of the cost of bread in the 1580s, to an average of 4.1 percent in 1599-1604, then 10.5 percent in 1605-35, 15 percent in 1636-82, and finally 24 percent from 1683 until 1747. That is, from 1683 one quarter of the total price of a loaf of wheat bread as set every week by the municipal bread price commissioners consisted of provincial tax. In most cities a municipal milling tax added another percent or two to these figures. The States of Holland raised the milling tax ten times between its introduction in 1574 and the “final” increase in 1683. As Table 1 shows, most of these increases were very large, forcing immediate, significant increases in the retail price of bread. For example, in 1636 the milling tax was raised by one-third. In Haarlem, the bread price commissioners took note of this increase on 4 August, and revised the bread price. The market price of wheat had not changed that week, but the price of both the 3-pound loaf of whole wheat bread and the 6-pound loaf of rye bread rose by 3 penningen, from 9 stuivers to 9 stuivers 3 penningen and from 4.8 to 4.11, repectively. Just how inelastic relative to price was the demand for bread? Did the provincial authorities pay any heed to the response of consumers as they turned repeatedly to this commodity for additional revenue? It will come as no surprise that no seventeenth century documents discuss the concept of price elasticity or invoke optimal tax theory. But I believe that the provincial States were cognizant of consumer behavior and also sensitive to the problem of equity, and that this is reflected in the design of the bread tax as well as the timing of increases in the rates. Thus far I have discussed bread in general, using wheat bread to stand for the commodity as a whole. In the Dutch Republic, as in much of northwestern Europe, consumers could generally choose between several wheat breads and rye bread. Wheat lends itself to numerous grades of fineness, depending on whether the grain
5 E. P. Thompson, “The Moral Economy of the English Crowd,” in E. P. Thompson, Customs in Common:
Studies in Traditional Popular Culture (New York, New Press, 1993; Charles Tilly, “Food supply and
Public Order in Modern Europe,” in Charles Tilly, ed., The Formation of National States in Western
Europe (Princeton, Princeton University Press, 1975), pp. 380-455. 6 A. van Deursen, Plain Lives in a Golden Age (Cambridge University Press,1991)pp. 171-81 ; R.M.
Dekker, Holland in beroering; R. M. Dekker, “Opreoeren in de provincie Holland, 1600-1750. Frequentie
en karaketer, relatie met de conjunctuur en repressie,” Tijdschrift voor Sociale Geschiedenis 3 (1977), pp.
299-329.

8
is unbolted [removing the bran and other coarse materials] and how finely it is ground to flour. Rye bread tended everywhere to be more of a standardized product. Consequently, the bread price commissioners in each city defined the types of bread available – or allowed – for sale, and set the price of each type. And, as Table 1 reveals, the milling tax on wheat and rye differed. In seventeenth century Holland wheat always bore a tax double that of rye; in Overijssel and other eastern provinces, this ratio was not always adhered to. There, wheat bread was more closely associated with elite consumption, and it was often taxed in excess of the two-to-one ratio. There were other grains subject to the milling tax, primarily barley, beans, and buckwheat. None of these were not used in commercial bread baking, but there was a demand for these grains for consumption primarily in the form of pancakes and porridges.7 Thus, the tax rates of 1605 and 1636 provided for the following range of tax rates: Table 4 Milling rates per last by type of grain in 1605, 1636 and 1683 1605 1636 1683 Wheat 32.4 63.6 104.938 Rye 16.2 31.8 52.469 Buckwheat 6.0 11.788 11.00* Barley & beans 1.8 21.2 34.931** Buckwheat tax was later (1723) lowered to 9.825 guilders per last Barley and beans was later (1723) lowered to 21.2 guilders per last. Immediately apparent is the fact that in 1605 the non-bread grains faced much lower rates than wheat and rye. The buckwheat rate rose in harness with the bread grains until the increase of1636, but thereafter, as the tax on all other grains continued to rise, the buckwheat tax remained fixed and even declined. After 1683, the tax on barley and beans was also rolled back to the 1636 level. The design of the milling tax offered consumers a choice: their tax burden varied directly with their choice of diet. All of these grains were widely consumed in the Republic, and most households made use of all of them. The mix varied by income level and urban residence, with wheat bread held in the highest esteem and buckwheat in the lowest Over the course of the seventeenth century, the States of Holland increased the tax rates on milled grains in stages, until it became by the 1680s the largest single source of tax revenue and accounted for approximately one-quarter of the total price of every loaf of wheat bread consumed in Holland. The States also crafted the milling tax so that consumers could avoid some or even most of it by consuming rye
7 Barley was milled primarily for brewing and distilling. Special, very low, milling tax rates applied for
these purposes.

9
bread (taxed at half the rate of wheat) or buckwheat (taxed at 18.5 percent, and from 1683 at 10 percent of the rate of wheat). . Later, after 1740, another option became available. The potato, requiring no milling or other processing, escaped taxation altogether. This puts the application of optimal tax theory in a somewhat different light. The demand for “bread” may be highly inelastic with respect to price, but the Dutch economy offered several types of bread (and carbohydrate and calorie-rich grains). There was considerable scope for substitution at the margin, which raises the question of how Dutch consumers actually responded to the evolving tax policies of their leaders. And, presumably, the leaders were watching consumer behavior as they deliberated over further tax increases. We know that they faced a pressing need to increase revenue. Besides the original set of excises of 1574 (Beer, wine, milling, peat salt, soap, woolen cloth) they added, over time new excises on meat, silk, vinegar, candles, firewood, building supplies, oils, fish, coal, tobacco, butter, coffee and tea, as well as many services. But most of these new taxes raised nothing like the revenue of basic items of consumption and they often incurred heavy collection costs. What is worse, all these new taxes together barely compensated for the decline in what had been, at the outset, the centerpiece of the gemene middelen: the tax on beer. Municipal finances in the middle ages floated as a cork in a barrel of beer. When Holland introduced provincial excise taxes, beer accounted for nearly half of the total gemene middelen revenue. In 1608 it accounted for 42 percent, and by 1650, after many new excises had been introduced and the tax rates repeatedly raised, beer continued to be the largest single source of revenue, at 25.5 percent of the gemene middelen. The absolute amount of revenue from the beer tax had risen steadily to over 2 million guilders annually, but from then on, the absolute amounts began to drift downward. Increases in the rates slowed the decline temporarily, but never stopped it: by 1680 beer taxes accounted for only 16 percent of the gemene middelen, and by 1747 they had shrunk further to 8.5 percent. The central role of beer taxes had revolved around the attractive combination of ease of collection (at a small number of breweries) and inelastic demand. But, consumer behavior changed after the mid-seventeenth century as distilled spirits began to compete directly with beer. After 1710 tea and coffee quickly rose in public acceptance and undermined yet further the demand for beer. The demand for beer became more elastic relative to price and no adjustments to the beer tax made in this period (primarily increasing tax differentials by quality/strength of beer) succeeded in stopping the revenue decline. The milling tax rose as the beer tax fell. Beer faced new substitutes that shifted consumer demand away from heavily taxed beer. (The new, competing beverages acquired taxes of their own, of course, but they never generated revenue comparable to that lost from declining beer consumption.) Bread, as we have seen,

10
was also not a single, standardized product, and the tax rates on different sources of calories varied enormously. How did consumers’ respond? We do not know in detail how much of each grain type was consumed until the late eighteenth century. Until 1747 the various excise taxes, including the milling tax, were collected by tax farmers. Fiscal documents record the amount paid by the farmers (the net tax revenue), but not the amount they collected (the gross revenue) nor the amount raised from each grain individually. We do know the total net revenue raised annually beginning in 1650, and we have a few isolated observations before that. In addition, several source shed light on the consumption practices of specific populations (especially institutionalized or dependent groups, such as orphans and recipients of charity). What do we know about the demand for bread grains? For 1798 the details of the milling tax are preserved, and they reveal the following pattern of per capita consumption. Table 5. Grain consumption in Holland, 1798 (per capita, in kg.) Wheat Rye Buckwheat Total Urban 77.99kg 26.53 22.59 127.11 Rural 53.40 37.46 17.01 107.87 Total 67.05 31.39 20.11 118.55 Total Lasts 24,335 12,547 9,246 46,128 The annual per capita consumption of all grains, 118.55 kg, and of the bread grains(wheat and rye), 98.44 kg. is low by the European standards of that time, when figures double these are often cited. They are, however, constant with other, more localized, observations. Hollanders consumed all of these grains in significant quantities, and the urban and rural patterns did not differ radically. Everywhere, wheat was the preferred bread grain: overall, Hollanders ate twice as much wheat bread as rye bread. It is highly likely that the pattern of consumption revealed in 1798, and which remained much like this through the first half of the nineteenth century, also had prevailed throughout the eighteenth century. In this era of stable population and nearly constant milling taxes, the milling tax revenue was also quite stable.8 All of this leads to the conclusion that Hollanders, by 1700 at the latest,
8 All excises were abolished in 1747, only to be restored in 1750. Most tax rates remained as before, but
now collection of these taxes was no longer auctioned to tax farmers but done directly. This resulted in an
increase of revenue (now gross rather than net revenue) of 12-13%.

11
were consuming bread in relatively small absolute amounts, but in a relatively “rich” mix of 2/3 wheat and 1/3 rye. Did bread consumption in the 1580-90s differ significantly from this pattern? The scraps of evidence available to address this question are not sufficient to give a convincing answer, but they tend to draw a picture of a higher level of bread consumption (perhaps double the eighteenth century level) consisting of relatively more rye and less wheat bread.9 Since Holland in this period produced little grain of its own, import data are thought to offer clues regarding domestic consumption, and the large and growing Baltic grain trade was overwhelmingly a trade in rye until the first half of the seventeenth century. Then, while the overall trade volume declined, the absolute volume of wheat imports rose. In global terms, Dutch ships carried an annual average of 35,000 tons of grain from the Baltic in the period 1562-1657, 15 percent of which was wheat. In 16661-1783 Dutch ships carried an annual average of 27,000 tons, but 30 percent now consisted of wheat.10 Of course, not all grain sent to Amsterdam and the other Dutch ports was destined for domestic consumption, although a major and growing part was. In addition to Baltic grain, the Republic imported grain from England and Holland received grain from other provinces, especially Zeeland. Both England and Zeeland became significant suppliers of wheat (and in the case of England, barley).11 Thus, the trade data point in the direction of a growth in the relative weight of wheat in the course of the seventeenth century, while other data hint at a decline in total per capita bread consumption. When the States of Holland seized upon the milling tax to generate a major increase in revenue, notably in 1605, 1618, 1625-27, and 1636, they did so in a period of generally rising grain prices. The milling tax at least doubled the rate at which
9 Blockmans and Prevenier set sixteenth century per capita bread consumption in the Southern Netherlands
at a minimum of 228 kg. The account books of the Friesian farmer Rienck Hemmemma describe a diet for
the farm servants of 191 kg bread per year, almost entirely rye. Milja van Tielhof, reviews the entire grain
economy of the region, and concludes, tentatively, that per capita grain consumption may have been nearly
2 hl (equivalent to approximately 200 kg of bread) in the sixteenth century, and that it fell in the course of
the seventeenth century to 1.3 hl (about 130 kg. of bread). Van Tielhof, Mother of all Trades, pp. 86-87.
Van Zanden and Van Leeuwen, in their effort to calculate national income for Holland in the period 1510-
1800, estimate per capita grain consumption (excluding beer) circa 1500 at 200 liters. They believe this
level of consumption remains constant until circa 1750, when rising potato consumption drives grain
consumption down by 15 percent, i.e., to about 170 liters. They also estimate the share of wheat in these
totals as rising from 10 percent in the early sixteenth century to 70 percent by 1808. Bas van Leeuwen and
Jan Luiten van Zanden, “The origins of „modern economic growth‟? Holland between 1500 and 1800,”
(Utrecht University, Working Paper, 2009). Both the very late decline in grain consumption and the very
low share of wheat in sixteenth century grain demand in their estimates appear extreme to me. The
sixteenth century estimates are defended in Jan Luiten van Zanden, “Taking the measure of the early
modern economy. Historial national accounts for Holland in 1510/14,” European Review of Economic
History 6 (2002), pp. 3-36. 10 J. A. Faber, “Het probleem van de dalende graanaanvoer uit de Oostzeelanden in de tweede helft van de
zeventiende eeuw,” AAG – Bijdragen 9 (1963), pp. 3- 28. 11 Jan de Vries, “The Production and Consumption of Wheat in the Netherlands, with special reference to
Zeeland,” in B. de Vries, Het platteland in een veranderende wereld: Boeren en het process van
modernisering (Hilversum. Verloren, 1994), pp. 199-219.

12
wheat prices rose in this period, and this could be expected to encourage consumers to substitute away from the most expensive bread grain. Real earnings in this period appear to have risen (except for a sharp reversal in the 1620s), which may have induced an income effect toward wheat (and perhaps a more diversified diet that would have reduced bread consumption overall).12 If consumers revealed over time a preference for wheat bread made stronger by rising incomes, fiscal officials could exploit that pattern of consumption by raising the tax on wheat at the same time that it gestured its concern for equity by offering lower taxes on “inferior” grains. That is, they raised the milling tax because consumer behavior convinced them that wheat bread consumption would be sustained. The States continued to increase the milling tax after 1636: in 1662, 1676, and 1683. Here, they may have been exploiting something else. Grain prices peaked around 1663 and began a long term decline that persisted, with several sharp interruptions, into the eighteenth century. It would be hard to prove that fiscal officials understood this in 1662, but the trend was evident and much discussed by 1676 and 1683. Thus, while the milling tax on wheat was raised by a total of 41.34 guilders per last in this period, he average market price of wheat fell from an 244 guilders per last in 1636-61 to 152.12 in the decade beginning in 1683—by 92 guilders per last. In short, Holland’s fiscal policy filled, so to speak, a large part of the “space” vacated by falling grain prices. Since nominal wages did not decline with commodity prices, the effects of the rising taxes on the demand for bread (as opposed to its effect on the demand for other goods) may have been minimal. In the Dutch Golden Age, the state learned to tax the “wage good” heavily. It exploited a growing preference for wheat bread, and the resulting price inelasticity of demand, while simultaneously offering tax concessions to consumers willing or needing to consume lesser grains. Overall, the seventeenth century milling tax offers a good example of optimal tax policy.
12 On real earnings, see De Vries and van der Woude, First Modern Economy (Cambridge University
Press, 1997), pp. 627-31; on the diversified diet, see ibid., pp. 621-27; Anne McCants, “Monotonous but
not Meager: The Diet of Burgher Orphans in Early Modern Amsterdam,” Research in Economic History 14
(1992), pp. 69-116.

13
The Milling Tax in a Liberal era, 1780-1855. If we move forward by one hundred years, to the late eighteenth century, we find the milling tax continuing almost exactly as before. The entire excise structure was threatened with abolition in 1747, as the Republic’s regental regime faced a crisis of confidence that brought the return of the House of Orange to a position of authority it had not had since the death of Willem III in 1702. During this crisis the excises were abolished in a panicky reaction to popular unrest, but in 1750 the taxes were restored. The only important change was the replacement of the system of collection by tax farmers by direct collection by state fiscal officers. The milling tax remained as before, with the exception of the tax on rye, which was reduced from 52.4685 guilders per last to 42.35. And so it remained to the fall of the Republic in 1795. But beginning in the 1770s what was by now a venerable pillar of Dutch fiscalism began to attract new attention. If, in the Dutch “Golden Age” consumer preferences for wheat bread encouraged the Republic’s provincial governments to raise of milling taxes in stages to very high levels, now, in a period of high wages and declining industry, the milling tax began to appear as an obstacle to economic prosperity. Adam Smith raised the issue in The Wealth of Nations:
In Holland the money price of the bread consumed in the towns is supposed to be doubled by means of such taxes [excise taxes on the necessities of life]….These and some other taxes of the same kind, by raising the price of labour, are said to have ruined the greater part of the manufactures of Holland.13
In the Republic the cause was soon taken up by the political economist Elie Luzac. In
Hollands Rijkdom [The Wealth of Holland] of 1783, he wrote:
Taxes on the food consumption of the common man raise the cost of living of the
workers, and that therefore a worker has to earn more than otherwise… it will be
clear that the taxes are the cause of the high wages…14
13 Adam Smith, Inquiry into the Causes of the Wealth of Nations [1776]( Oxford, 1976), p. 875-76. A
generation later David Ricardo also found occasion to dwell on this theme. In arguing against Smith‟s
view that the abundance of capital explained the low interest and low profit rates of Holland, he wrote:
“Holland was obliged to import almost all the corn which she consumed, and by imposing heavy taxes on
the necessities of the labourer she further raised the wages of labour.” David Ricardo, Principles of Political
Economy and Taxation (R.H. Hartwell, ed. Hammondsworth, Penguin, 1971), p. 291n. 14 Elie Luzac, Hollands rijkdom (Leiden, 1783) Vol. 4, p 82. This line of reasoning did not go
unchallenged. Another influential figure and political leader in the province of Zeeland, Laurens van der
Spiegel, demonstrated that wages in his province were every bit as high as in Holland while the Zeeland
excises were significantly lower. L. P. van de Spiegel, Over de armoede en de bedelaary, met betrekkinge
tot de provintie van Zeeland (Goes, 1780 ), pp. 21-23.

14
The chief political opposition to the Republic’s two-century long rule by a varying mix of town regents and the Stadholders of the House of Orange was a political movement known as the Patriots. They had imbibed liberal critiques of economic regulation and advocated, among other measures, the abolition of guilds and the ending of the Republic’s elaborate structure of excise taxes. the excise on milled grain
attracted their particular scorn. While their first attempt to stir up a revolutionary
opposition to the institutions of the old Republic, in 1787, failed ignominiously. But after
the successful revolution in France, they came to power in 1795 behind an invading
French army. The newly proclaimed Batavian Republic embarked on a far-reaching
program of institutional change. It abolished all guilds in 1798 and proclaimed an
intention to abolish the excise taxes as well: indeed, the first draft of the Batavian
Republic‟s new constitution promised as much. Yet, the longer they pondered the matter -- and the more pressing the need to raise ever
more revenue in support of their French sponsors -- the more necessary these taxes
appeared.15 It was not without bitter irony that Batavian citoyen received the news from
Finance Minister I.J.A. Gogel (who had initially favored ending the milling tax) that the
tax on bread not only would be kept, but that the new national system of taxation he
announced in 1806 would extended to the entire Republic the high taxes that had
previously been levied only in Holland and its immediate maritime neighbors: the wheat
tax would be 108.00 guilders per last and the rye tax, 45.00.
This unwelcomed innovation met with immediate resistance in the inland provinces,
where rye taxes has always been much lower, and the new tax regime was almost
immediately revised effect in 1807: the rye tax was reduced to only 21.60 per last, or one-
fifth of the tax on wheat.16 The operation of a uniform national tax in a country long
accustomed to provincial autonomy proved unworkable, and in a series of steps the
national taxes on both wheat and rye were reduced somewhat while localities - now the
municipalities rather than the provinces -- were allowed to impose supplementary levies.
At first, in 1813, these supplements could not exceed 50 percent of the central
government tax, but by 1831 this restriction was lifted. In Holland and neighboring
15 Actually, it did not take long for Isaac Gogel to grasp the urgency – or impossibility – of the new state‟s
financial situation. Already in 1799 he wrote: “Were it possible to abolish this [the milling tax] and similar
taxes, or of the governing bodies actually advanced [such legislation], we would not advise in favor, since
the situation as it is does not allow for the disruction of such a major source of revenue.” Quoted in: J.M.
F. Fritschy, De patriotten en de financiën van de Bataafse Republiek (The Hague, Hollandse Hisorische
Reeks-10, 1988), p. 145. 16 The following comparison of milling taxes in Holland and the three tax districts of Gelderland illustrate
the shock of the new centralized tax system on the latter. (guilders per last of grain)
Holland Gelderland
Nijmegen Arnhem & Zutphen
Wheat Rye Wheat Rye Wheat Rye
Before 1806 104 43 45 21 30 14
1806 108 45 108 45 108 45
1807-10 108 21 108 21 108 21

15
provinces, and especially in the cities, the municipal surcharges came to exceed the
central government tax, and the old regime structure of large regional differences in the
milling tax had effectively been restored.
To simplify a complicated story, the central government milling tax followed the course
shown in Table 6. Municipal-level taxes varied enormously. In Holland, and the larger
cities, they added over 50 percent to national levy.
Table 6. The milling tax from 1795 to 1855. Guilders per last
Wheat Rye
1795-1805 104.9375 42.35
1806 108.00 45.00
1807-10 108.00 21.60
1811 72.00 21.60
1812-13 Republic is incorporated into French Empire. Tax is abolished
1814-16 104.90 21.60
1817-21 Central government tax is abolished. Municipal taxes are raised
1822-30 42.00 12.00
1830-32 Revolt of Belgium Tax is abolished
1833-55 60.00 18.00
1855 National excise on gemaal is abolished, along with the regulation of bread
prices.
1865 municipal excises are abolished
Examples of the total (central government plus municipal) milling taxes in large cities
Wheat Rye
Amsterdam 1849 165.00 31.50
Haarlem 1843 30.75
Leiden 1826 136.35 39.00
Dordrecht 1828 159.45 27.00
Utrecht 1826 94.35 27.00
In a series of fits and starts, the new Kingdom of the Netherlands (1814) made the milling
tax a somewhat more flexible instrument than it had become under the centralizing
Batavian Republic. The central government tax on wheat was less than half what it had
been for some 130 years, the rye tax fell to only 30 percent of the wheat tax, and local
options gave municipalities the ability to tailor the excises to local circumstances. In
practice, this latter power burdened nearly half of the population in this highly urbanized
country with taxes – certainly on wheat – that were higher than they ever had been
before. Municipalities of all sizes depended heavily on excise taxes. In 1849 municipal
taxes accounted for 17.5 percent of all taxes (direct and indirect) levied in the
Netherlands, but municipal excises accounted for 30 percent of all excises raised in the
Netherlands. The municipal milling tax played a key role in this, accounting for one-

16
third to one-quarter of all taxes raised in Holland‟s larger cities.17
By the 1840s, the debate that was smothered by the pressing need for revenue in
the 1790s was revived – stimulated, it appears, by the potato blight, the high grain
prices, the British Anti-Corn Law League‟s agitations, and the growing concern
that Dutch industry appeared structurally uncompetitive relative to surrounding
countries.
Liberals such as the clergyman O. G. Heldring and publicist J.L. de Bruyn Kops were
convinced that the excise stood in the way of a competitive industrial economy. Heldring
estimated that excises together took up 1/7th
of a poor man‟s income – thus reducing
demand for industrial products.18 The long Dutch tradition of reliance on indirect taxation
(in 1850 all levels of government together depended on indirect taxes for 74 percent of all
public revenues raised domestically) continued to have its defenders. A leading political
economist, J. de Bosch Kemper, estimated that the tax on milling averaged out on a per
capita basis to (only) 1.5 guilders per annum. Most of the other excises he could defend
because they were desirable (the tax on spirits), fell on the better off (taxes on meat and
wine) or were simply trivial in total weight (beer, soap, salt, vinegar, peat). They
remained, he concluded, as close as one could get to optimal taxes.19
The liberals won this debate. In 1855 the (central government) milling tax was abolished
and the regulation of bread prices brought to an end. Municipal milling taxes continued,
but by 1865 they too were (nearly) abolished.20 This raises two large questions:
First, did the milling tax really have the effects claimed by Smith, Ricardo and
Dutch liberals? Did this tax on the „wage good‟ make the Netherlands a high
wage economy, suppress demand for manufactures, and render Dutch industry
uncompetitive?
Second, did the sudden abolition of the milling tax (and release of the milling and
baking sectors from comprehensive regulation) contribute measurably to
economic growth after 1855?
17 Richard Griffiths, Industrial Retardation in the Netherlands, 1830-1850 (The Hague, 1979), p 58. See
also, R. van der Voort, “Gemeentelijke financiën,” in Tom Pfeil, et al.,eds., Steden en dorpen in last.
Historische aspecten van locale belastingen en financiën (Amsterdam, NEHA, 1999), pp. 141-155. 18 O.G. Heldring, Noodkreet over de belasting op het gemaal en den hoogen prijs van het brood
(Amsterdam, 1846); J. L. de Bruyn Kops, xxxxxx. Other opponents of the milling tax and the regulation of
bread prices (known as de broodzetting): M.M. von Baumhauer, “De Broodzetting,” De Gids, May 1848,
pp. 586-605; J. van Kuijk, De broodzetting. Onnut, schadelijk, ongeoorloofd (Amsterdam, 1852); P. N.
Muller, “Iets over de broodzetting,” De Economist (1853), pp. 52-61. 19 J. de Bosch Kemper, Geschiedkundig Onderzoek naar de Armoede in Ons Vaderland (Haarlem, 1851). 20 Of the 1134 municipalities into which the Netherlands were divided, 379 – and all larger ones –
exercised the right to continue the milling excise. In 1865 the municipal excise is also abolished, although
70 are allowed to persist with their taxes for a while longer.

17
Was the milling tax a millstone holding down the Dutch economy? Time has not eroded support for the assessments of the founders of political economy. The first generation of Dutch economic historians – whether inspired by social democratic ideals or defenders of the liberal critique of Dutch stagnation before the introduction of the Constitution of 1848 – were in broad agreement that the excises, and the milling tax in particular, was inefficient and unjust: it distorted the economy and weighted inequitably on the common man.21 In 1976 Joel Mokyr took up this issue, and sought to measure the impact of the milling tax on nineteenth century wages. Mokyr noted the importance of supply and demand elasticities to the calculation of the extent to which the milling tax would be ‘passed through’ to bread prices, and from there to wages. Focusing on the national milling tax – which after 1822 was significantly lower than before – he concluded that the milling tax could be no more than a quite minor factor in explaining the unquestionably high nominal wages prevailing in the Netherlands.22 Richard Griffiths challenged this conclusion. He called attention to the important and complicating role of the municipal milling tax and concluded that the highly large wage differentials between the maritime provinces and the more rural inland provinces was, indeed, explained substantially by the milling tax. Wages in the western provinces were high in order to compensate for the heavy burden of indirect taxes on the income of urban workers 23 One question no one has asked yet is whether bread prices in the Netherlands were actually higher than elsewhere. It stands to reason that, ceterus paribus, a hefty milling tax will force up the price of bread, but were other things actually equal in historical fact? A first step in answering this question is offered here via a comparison of wheat bread prices in London and Holland. London (and England generally) was subject to the assize of bread, a system of bread price regulation which, from its reform in 1709 until its abolition in 1815 (later outside of London) was comparable to the Dutch broodzetting.24 The “standard wheaten loaf”, the most widely consumed type of wheat bread allowed under the assize, can be compared to grof tarwe brood, or coarse (whole-wheat) wheat bread. Table 7 shows the average annual price for this bread in Holland as a percentage of the price in London. (From 1770 a “British” wheat bread price series is available. It differs but little from the London series.)
21 I.J. Brugmans, De arbeidende klasse in Nederland in de negentiende eeuw (2de druk, „s-Gravenhage,
1929); W. J. Wieringa, Economische heroriëntering in Nederland in de 19e eeuw (Groningen, 1955); see
also: Charles Wilson, "Taxation and the Decline of Empires. An unfashionable theme," Bijdragen en
Mededelingen van het Historisch Genootschap 77 (1963), 10-23. 22 Joel Mokyr, Industrialization in the Low Countries, 1795-1850 (New Haven, 1976), pp. 192-93. 23 Richard Griffiths, “The Role of Taxation,” pp. 266-67. 24 Christian Petersen, Bread and the British Economy, c. 1770-1870 (Aldershot, Hants., Scolar Press,
1995).

18
Bread weights have been converted to kilograms, and prices converted according to the silver value of the pound sterling and the guilder. Holland prices are an unweighted average of annual price averages for six cities (Amsterdam. Haarlem, Leiden, Delft, Rotterdam, and Dordrecht). The table also shows the comparable ratio for wheat prices. Table 7. Wheat bread prices and wheat prices in Holland relative to London: 1610-1855. Holland wheat bread prices Holland wheat prices as a percentage of London as a percentage of London 1610-1679 108.9 103.3 1680-1795 122.1 93.6 1796-1809/14 79.6 83.1 1820-55 76.9 74.3 Table 7 shows quite strikingly how bread prices in Holland rose far above those in London when the milling tax reached its high-water mark after 1680 and the long-term price of wheat was roughly equal in the two markets. After 1795 matters changed fundamentally. The Netherlands retained, except for brief periods, its milling tax, but Dutch consumers paid much less for their wheat bread than Londoners. If high bread prices drove up wages, they did so much more powerfully in nineteenth century London than in Holland. Much of the new Dutch advantage can we accounted for by the bifurcation in the grain markets: wheat now sold for 20-25 percent less in Holland than in England.25 The celebrated Corn Laws of Britain appear to have been effective in separating the domestic market from the international grain markets in which the Netherlands remained a central and an essentially unprotected player. The revisions to the Corn Laws of 1791, 1815, and 1828 strengthened the protection enjoyed by British grain producers. The revision of 1842 began to weaken this protection before abolition came in 1846. The Netherlands taxed the wage good directly, thereby raising revenue to pay the interest on the nation’s colossal public debt. Britain taxed the wage good indirectly, via agricultural protection, thereby raising the value of farm land and retaining unskilled labor in agriculture. The one supported the rentier families who stood at the pinnacle of Dutch political life; the other supported the landowning families who occupied this position in Britain. But just who supported the Dutch rentier? Who paid the milling tax?
25 A large gap also existed between England and other markets. shillings per bushel of wheat, in 1815-48:
England 61.695
France 47.05
Prussia 34.30
Source:

19
From 1798 to 1850 we have annual information on the amount of wheat and rye brought to the mills for processing and conversion to bread. As noted above, consumers in Holland purchased approximately two pounds of wheat bread for every pound of rye bread. In the neighboring provinces of Zeeland and Utrecht wheat was also dominant, but in the rest of the country rye held this position. For the Netherlands as a whole, wheat accounted for 46 percent of the grain converted to bread. This pattern held firm for much of the first half of the nineteenth century, until the “hungry forties” depressed the share of the more costly bread grain. Bread eaters paid a hefty price for their preference. While their wheat accounted for less than half of all bread consumption, it accounted for some two-thirds of the total national expenditure on bread, and some 70-80 percent of the total revenue raised by the national milling tax. (Since the municipal taxes weighted proportionately more heavily on wheat, the inclusion of these revenues would increase the contribution of wheat to total milling tax receipts.) Table 8. Wheat as a percentage of total grain consumption, total bread expenditure, and total milling tax revenue, 1804-50 Wheat as % Wheat bread as % Wheat as % of total grain of total bread of total milling expenditures tax. 1804-10 46.00 69.64 78.16 1811-12 37.05 58.33 64.96 1813-20 44.15 68.52 82.03 1821-30 44.53 67.25 73.84 1831-40 41.36 63.28 69.62 1841-50 36.04 57.45 65.22 1851-55 We might draw two tentative conclusions from the foregoing: first, it remains to be shown that the milling tax caused the cost of bread to be significantly higher than in other countries in the nineteenth century. However, in the eighteenth century it does appear to have had this effect. Wheat bread prices in Holland were, on average, 22 percent above the London price level; second, the great bulk of the milling tax – 70-80 percent – was paid by consumers of wheat bread. Netherlands could choose to pay less (for rye bread) or not at all (for potatoes). Did the sudden abolition of the tax and regulation system help “jump-start” the Dutch economy? The abolition of the milling tax and the end of bread price regulation occurred together, but also in close temporal proximity to a number of other major economic changes in the Dutch economy (reorganization of the public debt, influx of colonial revenues [from the Cultuurstelsel in the Netherlands East Indies]; introduction of a “liberal” constitution). The sudden break with a centuries-long policy that shaped

20
every aspect of the milling and baking industries set changes in motion in industrial organization that are primarily the result of the lifting of price regulation, which will be passed over here.26 But it also resulted in a sudden reduction in the cost of the largest single category of expense in most nineteenth century households. Table 9. The cost of wheat bread, per last of grain, 1846-76. Grain cost All other costs Non-grain bread price Gld per last Gld per last costs as % Gld per kg.
of total 1846-55 328.10 272.27 45.4 0.203 1857-66 292.78 139.11 32.2 0.151 1867-76 331.32 97.80 22.8 0.150 Index 1846-55 100 100 100 1857-66 89.2 51.1 74.5 1857-76 101.0 35.9 74.0 Table 10. The cost of rye bread, per last of grain, 1846-76.
Grain cost All other costs Non-grain bread price Gld per last Gld per last costs as % Gld per kg.
of total 1846-55 226.26 92.97 29.1 0.108 1857-66 200.64 61.48 23.5 0.088 1867-76 241.35 41.51 14.7 0.094 Index 1846-55 100 100 100 1857-66 88.7 66.1 81.5 1867-76 106.7 44.6 87.0 Tables 9 and 10 display the course of bread production costs and bread prices over three decades. The first (1846-55) was the last decade of the old system of taxes and regulations; the second (1857-66) saw the abolition of price regulation and of central government taxes; the third (1867-76) saw the removal of most remaining municipal milling taxes. Overall, deregulation and tax abolition removed nearly two-thirds of total non-grain costs from the price of wheat bread, and over half of
26 But, see Jan Luiten van Zanden and Arthur van Riel, The Strictures of Inheritance. The Dutch Economy
in the Nineteenth Century (Princeton, Princeton University Press, 2000), pp.144-50. In their view, the
milling and baking regulations harmed the economy more by imposing industrial inefficiency than by
imposing high costs onto the wage good.

21
non-grain costs from the price of rye bread. The total reduction in wheat bread costs, 129.47 guilders, exceeds the milling tax (60 guilders national tax plus, approximately 30-40 guilders in municipal tax, on average). New competition and industrial reorganization are also reflected in these numbers, but clearly the reduction of wheat bread prices by 25 percent is attributable primarily to the removal of the tax. Since the milling tax on rye bread weighed less heavily, its removal had a smaller effect on bread prices. The removal of 51.46 guilders in cost per last of rye was, again, primarily the consequence of the abolition of the 30 guilder national tax plus approximately 10 guilders in municipal tax. If we compare 1867-76 with 1846-55, one can conclude that consumers – if their bread consumption patterns remained constant – would have saved a considerable sum now available for non-food expenditures. Table 11. Model of consumer expenditures, 1845-1875 Household of 4.
A. If bread consumption remains as in 1846-55: 40% wheat; 128 kg bread per capita.
Wheat bread Rye bread Total bread cost 1846-55 41.09 33.29 74.38 1856-65 30.56 27.13 57.69 1866-75 30.36 28.98 59.34
B. Actual course of bread consumption in 1856-65: 54% wheat; 156 kg bread per capita; 1866-75: 62% wheat; 171 kg bread per capita.
1846-55 41.09 33.29 74.38 1856-65 51.01 25.32 76.33 1866-75 64.03 23.79 87.82 The immediate effect of the lifting of a tax that weighed heavily on wheat bread was to unleash a “pent up” demand for this desired commodity. Dutch consumers ate more bread –33 percent more within 20 years – and shifted sharply toward the costlier wheat bread. They spent all their “savings” on more and better bread. In looking back over more than 250 years of Dutch bread policy, it appears that rising income in the “Golden Age” revealed strong preference for wheat bread. This attracted the attention of the state, which exploited the inelasticity of demand by raising the tax on wheat – and shelter lesser grains from heavy taxation – until the preference for wheat bread was brought into check. For decades, indeed for at least 150 years, the tax structure described in this paper enforced a stable balance of

22
wheat and rye consumption. While wheat bread, without state intervention, would have sold, pound for pound, for approximately 1.5 times the price of rye bread, the effect of public policy was to raise this differential to 2.5 times the price of rye bread. In 1855 the differential quickly fell back to 1.5, and the long-standing preference for wheat bread reasserted itself. With barely an interruption per capita bread consumption rose and wheat bread replaced rye, such that by 1900 rye bread only accounted for one-quarter of the total and had become a minor factor among urban consumers. A detailed study of bread consumption in Amsterdam revealed the following shift in the 1850-1900 period:27 Table 12. Bread Consumption in Amsterdam, 1850-1900. 1850 1900 Witbrood (fine wheat bread) 50% 70% grof tarwebrood (whole wheat bread 0 30 roggebrood( rye bread) 50 0 total in gm per day 250 400 Annual bread consumption 91.25 kg 146.0 kg The Dutch had (finally) become a nation of wheat bread eaters.
27 J.J. Voskuil, “De weg naar Luilekkerland,” Bijdragen en mededelingen voor de gescheidenis der Nederlanden 98 (1983), pp. 460-82.