james s. liebman, columbia law school - crpe - liebman.pdf · james s. liebman, columbia law school...
TRANSCRIPT

USING ACCOUNTABILTY TO BUILD K-12 LEARNING ORGANIZATIONS James S. Liebman, Columbia Law School
July 10, 2013
1

Build a Learning Organization
Governance Method
Role of: Center / Local Units
Accounta-bility
Assumptions about Adult Learning
Weakness
Bureaucracy Experts set rules / local (public) units comply
Rule following based mainly on inputs
Mainly accessible to elite experts concentrated at center
Central experts lack local knowledge needed to solve ‘wicked’ problems
Markets Experts set terms / local (private) units compete
Choice, exit Tacit; discoverable only via proliferation of local transactions
Public values ignored à segmentation/segregation; parental hegemony
Manager-ialism
Experts set out-come targets / managers try to meet them
Reward suc-cess in hitting targets; punish failure
Tacit; intuitive to gifted local managers; difficult to teach
Target-setters lack local knowledge; too few gifted managers to replace weaker ones quickly
Profession-alism; Craft
Experts set broad standards/profes- sionals use discre-tion to meet them
Strict training; certification; professional standards
Tacit; intuitive to gifted professionals; passed on by observation at the ‘elbow’ of masters
Too few gifted profession-als; learning by appren-ticeship is slow, expensive; union contracts preclude
Institutional Learning
Center sets provi-sional goals / local units transparently ‘plan’ to meet them
Comparative benchmarking à race to top
Structured, transparent inquiry in local units makes learning faster, explicit, shareable
‘Continuous learning’ structures are complex and require a willingness to note failure and change
2

Design a K-12 Learning Organization 3
3
ENABLE
• Frequently assess student learning, strengths and weaknesses
• Provide data to educators and parents, with multiple diagnostic comparisons
• Train educators to work in teams to diagnose and cure instructional failure
• Distribute knowledge horizontally (small innovation) and conduct R&D (big innovation)
EMPOWER
• Devolve authority to principals, ending program mandates and categorical grants
• Distribute instructional leadership within schools • Fund schools per pupil, weighted to need • Administer schools thru self-affiliated networks • Replace supervisors with accountable
facilitators • Manage portfolio of schools
EVALUATE
• Rate schools and educators based on student learning, given student challenge (lagging)
• Qualitatively review schools and educators based on strategic use of available tools and instructional practice (leading)
• Survey parents/students/teachers on school’s learning conditions & central support (leading)
• Adjust evaluations with input from field to reflect best available knowledge and practice
ENFORCE CONSEQUENCES
• Compensate and reward schools, principals, teams and teachers based on student learning gains and strategic use of available resources
• Provide teachers with career latters and lattices • Close or redesign schools, deny tenure, and
counsel out experienced teachers based on evidence of chronic failure
• Align all measures of success and forms of recognition to evaluation measures

Motivate and Enable Better Learning 4
1. Where There’s a Will, There’s a Way 2. Leading and Lagging Indicators: evaluate schools based on student results and readiness to improve 3. Progress and Performance for All: evaluate schools based on student learning levels, with extra weight for gains by lower-performing students 4. Realistic, Criterion-Based Targets: use past performance of ‘peer’ (similar) and all schools to set success criteria, not zero-sum ‘curve’; all schools can get an ‘A’ 5. Diagnostic Results: be sure educators can reverse engineer metrics and use them diagnostically; no regressions 6. Population-Neutral Scores: define outcomes not driven by zip code
Average Proficiency by School Demographic Index
Progress Report Score by School Demographic Index

Use Multiple Weighted Criteria : Tests Plus 5
Elementary, Middle School
High School
Progress (60 points)
• Medium adjusted ELA, math growth percentiles – all and lowest 1/3rd of students (gr. 4-8)
• K-3 score = 3rd grade scores compared to predictions based on demographics
• % of all and lowest 1/3rd accumulating ≥ 10 credits in each of 1st 3 years
• Rate of completion of exit exams in ELA, math, science, global & US history
• Pass rates on exit exams compared to what 8th grade test scores predict
Performance (25 points)
• % at Level 3 or 4 in ELA, math – all, lowest 1/3rd of students
• % passing common core course (ELA, math, science, social studies)
• 4- and 6-year graduation rates • 4- and 6-year weighted diploma rates
(based on rigor of diploma)
Environment (15 points)
• Attendance rate (5%) • School (10%)
Achievement Gap Closure (up to 15 extra points)
• % SWD at Level 3 or 4 ELA, math • % ≥ 75th growth percentile for ELL,
SWD, lowest third citywide, black/Hisp. lowest third citywide
• 4-year graduation rate for ELL, SWD, lowest third citywide, black/Hispanics in lowest third citywide
• Diploma rate for same students

Use Test Scores to Predict Graduation 6
93%
80%
51%
1.0 2.0 3.0 4.0
Percent of Students Graduating from High School with a Regents Diploma in 4 Years by their Average Math & English 8th Grade Score on 2008 NYS tests
Note: Only includes students earning Regents diplomas. 2008 Progress Report graduation data; 2004 8th grade English scores. Scores are in proficiency ratings (a conversion of student’s scores used on NYC Progress Reports that identifies where student’s scores fall within performance levels 1, 2, 3, and 4.
Not Meeting Learning Standards (Level 1)
Partially Meeting Learning Standards (Level 2)
Meeting Learning Standards (Level 3)
Exceeding Learning Standards (Level 4)

Measure Progress with Growth %-iles 7
7 7
Growth percentiles control for how likely students are to make one year of progress given their starting proficiency
3.0
3.7 (90th percentile)
2.4 (10th percentile)
3.0 (35th percentile)
4.2
4.4 (90th percentile)
3.7 (10th percentile)
4.2 (50th percentile)
Going from a 3.0 to a 3.0 may be a 35th percentile outcome, while going from a 4.2 to a 4.2 may be a 50th percentile outcome. Viewing both students as making equal progress does not accurately compare their progress.

Adjust %-iles for Predictable Lower Gains 8
These adjustments reflect know average differences in growth compared to other students with the same starting proficiency level. The adjustments are made to students’ ending proficiency as follows:
The Progress Report evaluates a school based on its median adjusted growth percentile, the adjusted growth percentile of the middle student when all the students’ adjusted growth percentiles are listed from lowest to highest.

Measure What You Care About 9
Grade and Overall Score
College and Career
Readiness
Student Progress
Additional Credit
60 points 16 points Elementary Schools
Progress, Performance, School Environment, and High School/ College Readiness scores based on comparison to peer schools (75%) and City (25%)
Student Performance
School Environment
15 points
60 points 17 points K-8 Schools
25 points 15 points
55 points 16 points High Schools
15 points 10 points
25 points
20 points
60 points 17 points Middle Schools
25 points 15 points
New section

Develop College-Readiness Metrics 10
¨ College Preparatory Course Index: percentage of students in the 4-year cohort (all students who entered high school four years earlier) who: ¤ Scored 65+ on Algebra II, Chemistry, or Physics Regents exam; or 3+ on an Advanced
Placement (AP) exam; or 4+ on an International Baccalaureate (IB) exam, or ¤ Passed a course for college credit; or another course certified by the DOE as college- and
career-ready; or ¤ Earned a diploma with a Career and Technical Education (CTE) endorsement; or an Arts
endorsement, or ¤ Passed an industry-recognized technical assessment.
¨ College Readiness Index: percentage of students in 4- or 6-year cohort who met standards for passing out of remedial coursework at City University of NY (CUNY), by: ¤ graduating with a Regents diploma, and ¤ earning a 75 or higher on the English Regents, scoring 480 or higher on the Critical Reading
SAT, scoring 20 on the ACT English, or passing CUNY assessment tests in Reading and Writing. ¤ scoring an 80 or higher on one Math Regents and completing coursework in Algebra II /
Trigonometry or higher level, scoring 480 or higher on the Math SAT, scoring 20 on the ACT math, or passing the CUNY assessment test in math.
¨ College Enrollment Rate: percentage of students in the 4- or 6-year cohort who graduated and enrolled in a degree program at a two- or four-year college or university by the fall after their fourth or sixth year.

Measure What You Care About 11
Grade and Overall Score
College and Career
Readiness
Student Progress
Additional Credit
60 points 16 points Elementary Schools
Progress, Performance, School Environment, and High School/ College Readiness scores based on comparison to peer schools (75%) and City (25%)
Student Performance
School Environment
15 points
60 points 17 points K-8 Schools
25 points 15 points
55 points 16 points High Schools
15 points 10 points
25 points
20 points
60 points 17 points Middle Schools
25 points 15 points
New section

Compare School to its Peer, City Cohorts 12
Peer Comparison (75%)
• Each school’s performance is compared to the performance of schools in its peer group
• The “Peer Horizon” is the range of outcomes achieved by the peer group (i.e., the top and the bottom score in the peer group for each measure)
City Comparison (25%)
• Each school’s performance is also compared to the performance of all schools Citywide
• The “City Horizon” is the range of outcomes achieved by all schools Citywide (i.e., the top and the bottom score in the City for each measure)
§ Elementary and K-8 school peer groups are determined based on a comparison of student demographics across schools (currently: % free lunch, % black and Hispanic, % special education, % ELL; ideally, base on parents education level)
§ Middle and high school peer groups are based on a comparison of student performance on ELA and Math test scores, adjusted for SWD and over-age for grade
The system is criterion referenced. The “criterion” is the recent experience of peer and all schools. A peer group is a group of up to 40 schools with similar student populations that serve approximately the same grade levels. Each school is the middle one in its group.
The Peer Horizon scores count three times as much as the City Horizon scores

Base ‘Criteria’ on Actual Experience 13
Attendance
85% 95% 90%
50%
Measure Horizon Chart Horizon Score
50%
This school’s annual
attendance rate this year
The lowest annual
attendance rate in the peer group over three past years*
The highest annual
attendance rate in the peer group over three past years*
* To exclude outliers, the horizon minimum and maximum are equal to two standard deviations from the average.

Example: A Queens Middle School 14
This school has high student performance and a high level of parent, student, and teacher satisfaction . . .

Example: A Queens Middle School 15
…but its students are not making adequate progress compared to its peer schools and the city as a whole

Use School Surveys as Leading Metric 16
1. Academic Expectations
2. Communication
3. Engagement
4. Safety and Respect
School surveys evaluates the learning environment at each school. Survey results contribute 10 points to the Progress Report. Attendance contributes 5 more points.
School Community
Parents Teachers
Students (gr. 4-12)

Use Surveys to Engage Stakeholders 17
Get from Adina
Survey Respo
nse Ra
tes 65%
78% 80% 82% 83% 82%
44%
61% 73%
76% 82% 81%
41%
55% 59%
62% 64% 65%
26%
40%
45% 49%
52% 53%
0%
25%
50%
75%
100%
2007 2008 2009 2010 2011 2012
428,327 Students
62,115 Teachers
967,009 Total
476,567 Parents

Use Quality Review as a Leading . . . 18

. . . Measure of Readiness to Improve 19
Gather data Plan and set goals
Align instruction
Build and align capacity
Monitor and revise
Understand what each student knows and is able to do; monitor each student’s progress over time.
Plan and set goals for each student’s next learning steps and for improving each teacher’s, grade-level’s, and department’s outcomes
Align school instruc-tional activity and resources around plans and goals for accelerating student learning and improving teacher practice
Use leading and lagging indicators of success in accelerating student learning and improving teacher practice as basis for adjusting plans and goals
Align professional and youth development processes around plans and goals for accelerating student learning and improving teacher practice

Enable Schools, Enforce Consequences 20
Progress Reports, Quality Reviews and Surveys help . . . q Schools
q Gauge current and future student learning q Identify and learn from peer schools q Engage in team-based inquiry focused on improving teacher practice and
accelerating students learning
q Networks of Schools q Target schools, instructional areas, and student groups for extra support
q Central q Evaluate principals and make principal tenure decisions q Award bonuses to principals and assistant principals q Prioritize schools for targeted support, including more frequent Quality Reviews q Decide whether to change school leaders or phase out failing schools
Ø D, F, or 3 Cs in a row triggers evaluation based on these and other measures (historical performance, demand for seats in school, turnaround efforts), and conversations with school leaders and communities
Ø NYC has phased out ~15% of its schools since 2003

Leadership Change, Closure Process 21
Progress Report § Schools with D or F this year § Schools with C or lower for
three consecutive years Quality Review § Schools with U on the most
recent Quality Review New York State’s Persistently
Lowest-Achieving (PLA) List § Bottom 5% in New York State
this year based on NCLB criteria
§ High schools with graduation rates below 60% for 3 years in a row
Trig
gerin
g C
riter
ia
Add
ition
al D
ata
Fact
ors
Qua
litat
ive
Inve
stig
atio
n
School Performance § Historical Progress Report &
Quality Review results § ELA/Math tests/Regents exams § Graduation rates
Existing School Improvement Plans/Turnaround Initiatives
Demand for School’s Services § Application data § Survey data Structural Factors § Principal length of service § School size § Special population
concentration
Quality of Other Options § Number & quality of options
Review of School Information, Capacity, Leadership
§ Executive Team § Community Superintendents § Cluster CEOs § Networks § Office of Choices & Enrollment
Chancellor

22
Measure Change Over Time: Test Scores

Benchmark Change Against State 23
NYC is 73% Black/Hispanic, 84% low income; Rest of State is 23% Black/Hispanic, 31% low income
22%19% 18% 19%
16%19%
17%13%
38%43% 43%
46%51% 51%
58%
69%
0%
10%
20%
30%
40%
50%
60%
70%
80%
90%
2002 2003 2004 2005 2006 2007 2008 2009
41%
51%55%
59% 57%
65%
74%
82%
25%22% 20%
17%14% 12% 10%
7%
0%
10%
20%
30%
40%
50%
60%
70%
80%
90%
2002 2003 2004 2005 2006 2007 2008 2009
23
Percent of Students Proficient or Above in English Language Arts
Percent of Students Proficient or Above in Math
Gap with Rest of State Gap with Rest of State
Results reflect State tests in grades 4 and 8 from 2002-2005 and grades 3-8 from 2006-09. State tests were rescaled and expanded to include all grades 3-8 in 2006.

Benchmark Change Against Nation 24
Average Scale Score NAEP, 2007 to 2011
Math, Grade 4
Math, Grade 8
Reading, Grade 4
Reading, Grade 8
New York City - 2 + 2 + 3 + 5
Rest of State - 7 - 1 - 4 + 1
Nation + 1 + 3 + 0 + 1

Measure Change: 4-Year Graduation Rate 25
NY State Regents Diploma Rate
51 50 48 48 48 48
50 50 50 51 51 53 54
58 60
62
66 68
70 71 71
47 49
53
61 63
65 66 65
30
34
37
43
46
51
56
61
1992 1993 1994 1995 1996 1997 1998 1999 2000 2001 2002 2003 2004 2005 2006 2007 2008 2009 2010 2011 2012
2005-2012: +38% (State calculation)
2005-2012: +103% (Regents diploma rate)
Class of
1992-2001: +0% (City calculation)
June 2002- Aug 2012: +39% (City calculation)
Notes: NYC traditional calculation includes Local and Regents Diplomas, GEDs, Special Education diplomas, and August graduates. It does not include disabled students in self-contained classrooms or District 75 students. The NYS calculation, used since 2005, includes Local and Regents Diplomas and all disabled students. It does not include GEDs and Special Education diplomas.
NYC Calculation Method NY State Calculation Method

Measure Change: College Readiness
College Readiness % of Students in Cohort
Graduating College Ready*
AP Performance # of Students with Scores of
3 or Higher on Advanced Placement Exams**
CUNY Enrollment # of DOE Graduates***
Enrolling at CUNY as First-time Freshmen
Increase 2005-11: 9 pts. Increase 2002-11: 65% Increase 2002-10: 54%
CUNY Remediation % of DOE Graduates***
Enrolling at CUNY In Need of Remedial
Coursework****
Decrease 2002-10: 5 pts.
26
26
*According to the Progress Report College Readiness Index, which is defined as the percentage of students who met the 2012 standards for passing out of remedial coursework at CUNY. **2002 data are from the College Board’s 2004 College Bound Seniors Report. College Board updates their historic data annually to adjust for revised data on students. Data reported are the most recent comprehensive information available to NYCDOE; 2007-2011 data are from the College Board's 2011 College Bound Seniors Report ***Includes all students who report to CUNY that they have graduated from a NYC high school (at any point in time). Source: CUNY Office of Institutional Research and Assessment. ****Students in need of remedial coursework did not meet CUNY proficiency standards or pass the CUNY assessment tests. In 2008, CUNY instituted more rigorous requirements for requiring remediation.

Measure Score Inflation 27
Source: Daniel Koretz, Analysis for New York State Education Department 27

(What Score Inflation Looks Like) 28
Changes in mathematics scores on KIRIS and ACT tests

Change ‘Politics’ as Structure Changes . . . 29
K-12 reforms have made progress turning old-style bureaucracies that organized activity around one-size-fits-all inputs into learning organizations that flexibly mobilize resources to solve problems and improve outcomes.
For the new learning organizations to maintain public support and succeed, old-style politics focused on the competition over inputs must give way to new forms of public engagement focused on participatory problem-solving.
But the reforms have made little progress transforming politics and participation.
Absent new forms of participation, parents and communities perceive the changes taking place as losses that cannot be recouped quickly enough, or at all, through improved services and outcomes.
Effective strategies are available to involve parents and community-based organizations in public-problem-solving that enables them to understand, participate in and embrace the reforms.

. . . or Reforms Will be Felt as a Loss 30
Parents and community groups that are used to making schools and districts work for them through advocacy and negotiation over a “fair share” of inputs experience the reforms as a denial of influence and process.
Traditional Process and Result Reform Substitute
Interest group nominates (names) a principal Principals hired/fired based on performance
Parents lobby to get child in a ‘good’ school School placement aims to maximize results
A school is designated to serve and define a community
Schools are opened and closed based on student outcomes
Active parents use the PTA or SLT to negotiate a mix of the initiatives each prefers
Schools use data to drive concerted strategies for improving student learning
Power and participation are defined by votes, voice, negotiation; interests are fixed
Power and participation are defined by problem-solving and improved outcomes; goals evolve
Infrequent elections and a promise of long-term gains in outcomes, choice and service demand more trust and patience than parents have and deprive them of ways to understand the reforms and participate in them now.

Create a New Social Contract 31
The paramount goal is accelerated learning and better futures for all children.
Improved student outcomes replace bargained inputs as proof of success; deep public participation replaces horse trading as everyday politics.
Transparency and responsive public engagement in solving problems that impede learning are prioritized centrally and implemented locally.
All proposals and decisions are continuously improved based on information about how they may or do work and problems they present.
Parents and community members are a key source of that information and have a variety of ways to stay informed and participate in practical and realistic ways in proposing and making improvements.
Leaders make starting decision. Stakeholders implement conscientiously, then provide full and frank feedback. Leaders promptly make proposed changes that improve the strategy, report back on changes that were made and explain why other proposed changes were not made.
Back-up accountability is provided by school-board and/or mayoral elections (focused, e.g., on how problems are prioritized and fidelity to the social contract).

Engage Through Public Problem-Solving 32
Every reform component includes centrally prioritized and coordinated steps to ensure public understanding and participation.
Project leaders promote understanding to enhance participation and buy-in: • Every parent has a chance to hear in person as well as electronically and in writing from
leaders about each major project and how they can take part
Authentic participation is fostered through project-specific portfolios of problem-solving opportunities tailored to time and ability. For example: • Parents query project leaders, propose changes and get reports on changes made. • Parents have a role in school-level implementation (e.g., Quality Reviews, principal selection,
inquiry teams, response to annual School Survey). • One-shot parent focus groups vet proposed project components and changes. • Longer-term parent and CBO task forces help design project components (e.g., parent
surveys, parent communications, accountability metrics, new schools). • Trained full-time ambassadors (parent volunteers, CBOs) facilitate public understanding,
collect feedback, obtain project changes and report back. • Every project has a dedicated parent advisory group and parent spokesperson.
The strategy is honed by prioritizing and implementing it in a reform district and using the same feedback strategies to learn and improve.

33
Center for Public Research & Leadership
The Center for Public Research and Leadership mobilizes the full array of university resources to prepare exceptionally talented professional students for careers as K-12 managers, while providing affordable project support and research to agencies engaged in school reform.
CPRL Provides Public / Non-‐Profit K-‐12 Agencies Gain
Talent pipeline Ready access to pool of excep3onally capable and well-‐prepared professional school graduates
Student teams supervised by experienced managers
Affordable year-‐round consul3ng support
World-‐class policy-‐focused researchers
Research co-‐designed for immediate policy uses

Appendix 34

Evaluate Multiple Weighted Criteria 35
Grade and Overall Score
School Environment
15 points
Student Performance
25 points
Student Progress
60 points
Additional Credit
Up to 15 points
• School Survey results
• Attendance
• Student test scores in ELA and Math (average proficiency and % Level 3/4)
• Student progress on ELA and Math test scores (median growth percentiles)
• Graduation rates (4-year and 6-year)
• Weighted Graduation Rates (4-year and 6-year)
• Exemplary performance and/or progress on test scores with high need students
• Exemplary graduation and/or regents outcomes with high need students
• School Survey results
• Attendance
• Credit accumulation
• Regents completion and pass rates
Elementary, Middle, and K-8 Schools
High Schools
Based on comparison to peer schools (75%) and City (25%)

Present Results Intelligibly
36
§ provide a summary of a school’s Progress Report results,
§ help families interpret the Progress Report and understand information about school performance.
NYC Progress Report Overviews for each school:

37
Growth Percentiles for 4th Grade Math
4th Grade Proficiency
Percentile outcomes for students starting at a proficiency rating of 3.0 in third grade
Growth Percentile
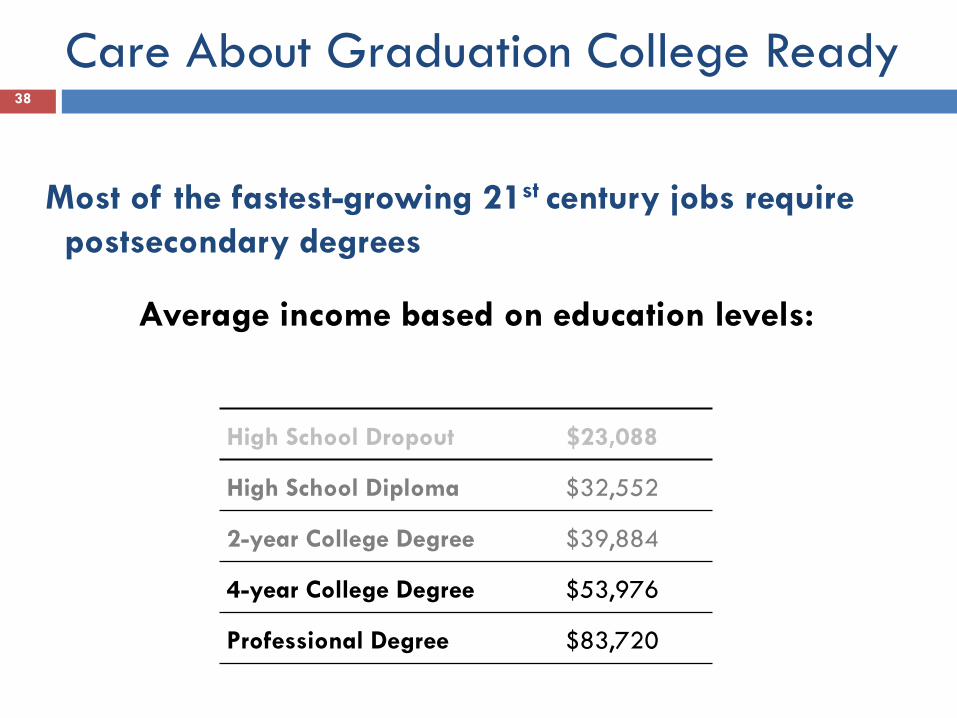
Most of the fastest-growing 21st century jobs require postsecondary degrees
Average income based on education levels:
High School Dropout $23,088
High School Diploma $32,552
2-year College Degree $39,884
4-year College Degree $53,976
Professional Degree $83,720
38
Care About Graduation College Ready
Source: U.S. Department of Labor, U.S. Bureau of Labor Statistics, 2011.

Measure Readiness to Improve 39
Quality Statement 1: Gather and analyze data on student and teacher success 1.1: School-level assessment of data
1.2: School-level alignment of assess-ments and curriculum
1.3: Data tools for decision-making
1.4: Family-engagement in decision-making
Quality Statement 2: Plan and set goals to boost student and teacher success 2.1: School-level theory of action and goals
2.2: Teacher team and classroom-level goals
2.3: Adjustment and feedback based on assessments
2.4: Communication of clear expectations to families
Quality Statement 3: Establish instructional strategy to achieve goals 3.1: Rigorous and engaging curriculum aligned to goals
3.2: Differentiated instruction aligned to individual needs
3.3: Aligned use of instructional resources
3.4: Positive learning environment
Quality Statement 4: Align capacity building to goals 4.1: Instructional focus, differentiated support for teachers
4.2: Teacher teams engaged in collaborative inquiry
4.3: Teacher leadership development
4.4: Child/youth development resources, support
Quality Statement 5: Continuously monitor success and adjust as needed
5.1: Monitor and revise data and assessments
5.2: Monitor and revise planning and goal setting
5.3: Monitor and revise instruction for coherence, alignment to need
5.4: Monitor and revise teacher, leadership, and child development

QR Systems by How they Use QR Findings
QR System Exit meeting with school staff directly after the
review
Action plan developed based
on findings
Findings tied to coaching
Report made public
UK X X X
New Zealand X X X X
Virginia X X X
Idaho X X
New York X X
New Haven X X
NYC X X
KIPP X X X
NSNO X
40

QR Systems by Evidence Collected QR System Self-
Evaluation Document
review Classroom
observations Leadership
conversations Teacher
conversations Parent
conversation Student
conversations Observations
of teams
UK X X X X X X X
New Zealand
X X X X X X X
Virginia X X X X X
Idaho X X X X X X X
New York X X X X X X X X
New Haven
X X X X X X X X
NYC X X X X X X X X
KIPP X X X X X X X
NSNO X X X
41

42
School Performance
1. Quality Review
Assesses how well each school supports student learning
2. Progress Report
Evaluates how well students at each school are performing
3. School Survey
Reports how parents, teachers, and students feel about their school
Outcome from Parent Perspective

Official Rewards and Consequences 43
Schools subject to structured academic planning and target setting or to leadership change, restructuring or closure. Latter consequences become more likely if a school continues in the D or F range for multiple years and fails improve its QR rating
Quality Review
Pro
gres
s R
epor
t
A
B
C
D
F
Well-Developed
Eligible to receive rewards No rewards or consequences
No rewards or consequences, unless a school receives a C for 3 consecutive years, in which case it is treated as a school that receives a
D for one year
Immediate leadership change or
closure
Proficient Undeveloped

Enable Inquiry into Barriers to Learning 44
44
Analyze
Monitor Progress
Identify school-wide focus: struggling students; weak instructional practices
Observe, interview, research; conduct root-cause analysis; generate hypothesis, responsive strategy, and learning targets
Implement the change strategy
Monitor progress to assess effectiveness of change strategy
Evaluate what did and didn’t work; reassess systems that produced the conditions of learning and the theory of change
Share knowledge within and across schools, via knowledge management platform, network facilitators, Quality Reviews
Fostering team-based innovation &
learning through the inquiry cycle

Accelerate Learning Through Inquiry 45
Comparable improvement in Math was gain of .11 on the same scale: ELA and Math gains translate into 3% and 6% higher probability of graduating on time with a Regents Diploma

Switch from Supervisors to Facilitators
46
59 Networks
Network Leader
10,000 Teachers, Teacher Leaders, APs, & Principals Citywide
Achievement Coach
On average, 25 Schools per Network
Achievement Coach
Special Education Instructional Coach
25 Schools x 1 Principal = 25
6-7 schools x 4 Lead Educators
6-7 schools x 4 Lead Educators
6-7 schools x 4 Lead Educators
6-7 schools x 4 Lead Educators
25 schools x 1 Teacher = 25
Achievement Coach
Achievement Coach
Citywide: 59 networks, ~1500 schools*
* Does not include District 75 (schools with all SWD), District 79 (transfer/alternative schools), or charter schools.
46

Enable with a Flexible Assessment Portfolio 47
Assessment Description Grades Predictive Assessments
(Acuity) Predict performance on NY State tests and Regents
exams in ELA and math 3-HS
Instructionally Targeted Assessments (Acuity) Aligned to common curricula in ELA and math 3-HS
Computer Adaptive Assessments
(Performance Series)
Assess students’ instructional level, independent of enrolled grade level, in ELA and math 3-HS
Teachers College Reading and Writing Project Assessments Track students’ ability to read increasingly difficult texts K-8
PSAT Data Pilot Uses the PSAT college-readiness test for instructional purposes 10 & 11
ELL Periodic Assessments Predict performance on the NY State English as a Second Language Achievement Test (NYSESLAT) 3-12
K-2 Assessments Assess early literacy skills K-2
Design Your Own (DYO) Periodic Assessments Schools design or select their own assessments K-12

Enable Progress with Access to Data 48

E.g., Benchmark Gains by County: NYC vs. Rest of State: 2002-2009
49
-‐15.0 -‐10.0 -‐5.0 0.0 5.0 10.0 15.0
Lewis (1463)Chenango (3097)Delaware (2253)Tompkins (3858)Franklin (2728)Broome (9758)
Columbia (2954)Westchester (42985)Washington (3212)
Yates (928)Livingston (3085)Rockland (12922)
Fulton (2877)Essex (1444)Tioga (2800)
Putnam (5226)Schenectady (7075)
Oneida (11596)Otsego (2966)Nassau (63948)
Rensselaer (6905)Madison (3622)Wyoming (1770)Genesee (3250)Albany (12490)Warren (3358)
Cattaraugus (4795)Clinton (4096)
Niagara (10560)St. Lawrence (5300)
Schoharie (1627)Cayuga (3533)Steuben (5352)
Montgomery (2385)Chautauqua (7109)Dutchess (15009)
Ontario (5743)Onondaga (23360)
Sullivan (3591)Erie (43037)Ulster (9017)
Hamilton (194)Saratoga (11000)
Wayne (5564)Chemung (4041)Seneca (1649)Suffolk (80120)Jefferson (5444)Herkimer (3314)Orange (20683)Allegany (2461)Orleans (2528)Oswego (7689)Greene (2395)
Monroe (37458)Cortland (2398)Schuyler (728)
Richmond (18113)Brooklyn (99196)Queens (80450)
Manhattan (41341)Bronx (66814)
NYC County County in NYS other than NYC
Combined average results on State ELA and math tests in grades 4 and 8 from 2002-2005 and grades 3-8 from 2006-09. NY State rescaled the tests in 2005-06, leading to reductions in average scale scores that year.
.

Measure College Readiness 50
College Readiness Index : Percentage of students in 2011 cohort who met the standards for passing out of remedial coursework at CUNY, by: § Graduating with a Regents
diploma, and § Earning a 75 or higher on the
English Regents or scoring 480 or higher on the Critical Reading SAT, and
§ Earning an 80 or higher on one math Regents and demonstrating completion of coursework in Algebra II/Trigonometry or a higher-level math subject, or scoring 480 or higher on the Math SAT
16.0% 17.4%19.0% 20.2%
22.0% 22.3%24.7%
32.0% 32.6% 34.1% 33.9% 35.3% 34.0%37.2%
2005 2006 2007 2008 2009 2010 2011
Percent of 4-year graduates graduating college ready
Percent of 4-year cohort graduating college ready

No Evidence of Score Inflation: ELA 51
Source: Daniel Koretz, Analysis for New York State Education Department