jackstraws: picking command and control...
TRANSCRIPT

JACKSTRAWS: Picking Command and Control Connections from Bot TrafficGregoire Jacob
University of California, Santa [email protected]
Ralf HundRuhr-University [email protected]
Christopher KruegelUniversity of California, Santa Barbara
Thorsten HolzRuhr-University [email protected]
Abstract
A distinguishing characteristic of bots is their abilityto establish a command and control (C&C) channel. Thetypical approach to build detection models for C&C traf-fic and to identify C&C endpoints (IP addresses and do-mains of C&C servers) is to execute a bot in a controlledenvironment and monitor its outgoing network connec-tions. Using the bot traffic, one can then craft signa-tures that match C&C connections or blacklist the IPaddresses or domains that the packets are sent to. Un-fortunately, this process is not as easy as it seems. Forexample, bots often open a large number of additionalconnections to legitimate sites (to perform click fraudor query for the current time), and bots can deliberatelyproduce “noise” – bogus connections that make the anal-ysis more difficult. Thus, before one can build a modelfor C&C traffic or blacklist IP addresses and domains,one first has to pick the C&C connections among all thenetwork traffic that a bot produces.
In this paper, we present JACKSTRAWS, a system thataccurately identifies C&C connections. To this end, weleverage host-based information that provides insightsinto which data is sent over each network connection aswell as the ways in which a bot processes the informa-tion that it receives. More precisely, we associate witheach network connection a behavior graph that capturesthe system calls that lead to this connection, as well asthe system calls that operate on data that is returned.By using machine learning techniques and a trainingset of graphs that are associated with known C&C con-nections, we automatically extract and generalize graphtemplates that capture the core of different types of C&Cactivity. Later, we use these C&C templates to matchagainst behavior graphs produced by other bots. Ourresults show that JACKSTRAWS can accurately detectC&C connections, even for novel bot families that werenot used for template generation.
1 IntroductionMalware is a significant threat and root cause for manysecurity problems on the Internet, such as spam, dis-
tributed denial of service attacks, data theft, or clickfraud. Arguably the most common type of malwaretoday are bots. Compared to other types of malware,the distinguishing characteristic of bots is their abil-ity to establish a command and control (C&C) channelthat allows an attacker to remotely control and update acompromised machine. A number of bot-infected ma-chines that are combined under the control of a singleentity (called the botmaster) are referred to as a bot-net [7, 8, 14, 37].
Researchers and security vendors have proposedmany different host-based or network-based techniquesto detect and mitigate botnets. Host-based detectorstreat bots like any other type of malware. These sys-tems (e.g., anti-virus tools) use signatures to scan pro-grams for the presence of well-known, malicious pat-terns [43], or they monitor operating system processesfor suspicious activity [26]. Unfortunately, current toolssuffer from low detection rates [4], and they often in-cur a non-negligible performance penalty on end users’machines. To complement host-based techniques, re-searchers have explored network-based detection ap-proaches [15–18, 34, 41, 45, 49]. Leveraging the insightthat bots need to communicate with their command andcontrol infrastructure, most network-based botnet detec-tors focus on identifying C&C communications.
Initially, models that match command and controltraffic were built manually [15, 17]. To improve andaccelerate this slow and tedious process, researchersproposed automated model (signature) generation tech-niques [34, 45]. These techniques share a similar workflow (a work flow that, interestingly, was already usedin previous systems to extract signatures for spreadingworms [25,27,29,31,39]): First, one has to collect tracesof malicious traffic, typically by running bot samplesin a controlled environment. Second, these traces arechecked for strings (or token sequences) that appear fre-quently, and can thus be transformed into signatures.
While previous systems have demonstrated some suc-cess with the automated generation of C&C detectorsbased on malicious network traces, they suffer from

three significant shortcomings: The first problem is thatbots do not only connect to their C&C infrastructure, butfrequently open many additional connections. Some ofthe additional connections are used to carry out mali-cious activity (e.g., scanning potential victims, sendingspam, or click fraud). However, in other cases, the trafficis not malicious per se. For example, consider a bot thatconnects to a popular site to check the Internet connec-tivity, or a bot that attempts to obtain the current time orits external IP address (e.g., local system settings are un-der the control of researchers who might try to trick mal-ware and trigger certain behaviors; they are thus unreli-able from the bot perspective [19, 35]). In most of thesecases, the malware traffic is basically identical to trafficproduced by a legitimate client. Of course, one can usesimple rules to discard some of the traffic (scans, spam),but other connections are much harder to filter; e.g., howto distinguish a HTTP-based C&C request from a re-quest for an item on a web site? Thus, there is a signif-icant risk that automated systems produce models thatcapture legitimate traffic. Unfortunately, a filtering stepcan remove such models only to a certain extent.
To highlight the difficulty of finding C&C connectionsin bot traffic, we report on the analysis of a database thatwas given to us by a security company. This databasecontains network traffic produced by malware samplesrun in a dynamic analysis environment. Over a periodof two months (Sept./Oct. 2010), this company ana-lyzed 153,991 malware samples that produced a totalof 593,012 connections, after removing all empty andscan-related traffic. A significant majority (87.9%) ofthis traffic was HTTP, followed by mail traffic (3.8%)and small amounts of a wide variety of other protocols(including IRC). The company used two sets of signa-tures to analyze their traffic: One set matches knownC&C traffic, the other set matches traffic that is knownto be harmless. This second set is used to quickly discardfrom further analysis connections that are known to beunrelated to any C&C activity. Such connections includeaccesses to ad networks, search engines, or games sites.Using these two signature sets, we found 109,600 mali-cious C&C connections (18.5%), but also 69,211 benignconnections (11.7%). The remaining 414,201 connec-tions (69.8%) were unknown; they did not match anysignature, and thus, likely consist of a mix of maliciousand harmless traffic. This demonstrates that it is chal-lenging to distinguish between harmless web requestsand HTTP-based C&C connections.
The second problem with existing techniques is thatattackers can confuse automated model (signature) gen-eration systems: previous research has presented “noiseinjection” attacks in which a malware crafts additionalconnections with the sole purpose to thwart signatureextraction techniques [10, 11, 33]. A real-world exam-
ple for such a behavior can be found in the Pushdo mal-ware family, where bots, in certain versions, create junkSSL connections to more than 300 different web sites toblend in with benign traffic [1].
The third problem is that existing techniques do notwork when the C&C traffic is encrypted. Clearly, it isnot possible to extract a content signature to model en-crypted traffic. However, even when the traffic is en-crypted, it would be desirable to add the C&C serverdestinations to a blacklist or to model alternative net-work properties that are not content-based. For this, it isnecessary to identify those encrypted malware connec-tions that go to the C&C infrastructure and distinguishthem from unrelated but possibly encrypted traffic, suchas legitimate, SSL-encrypted web traffic.
The root cause for the three shortcomings is that ex-isting approaches extract models directly from networktraces. Moreover, they do so at a purely syntactic level.That is, model generation systems simply select ele-ments that occur frequently in the analyzed network traf-fic. Unfortunately, they lack “understanding” of thepurpose of different network connections. As a result,such systems often generate models that match irrele-vant, non-C&C traffic, and they incorrectly consider de-coy connections. Moreover, in the case of encryptedtraffic, no frequent element can be found at all.
To solve the aforementioned problems, we propose anapproach to detect the network connections that a mal-ware program uses for command and control, and to dis-tinguish these connections from other, unrelated traffic.This allows us to immediately consider the destinationhosts/domains for inclusion in a blacklist, even when thecorresponding connections are encrypted. Moreover, wecan feed signature generation systems with only C&Ctraffic, discarding irrelevant connections and making itmuch more difficult for the attacker to inject noise.
We leverage the key observation that we can use host-based information to learn more about the semantics ofnetwork connections. More precisely, we monitor theexecution of a malware process while it communicatesover the network. This allows us to determine, for eachrequest, which data is sent over the network and wherethis data comes from. Moreover, we can determine howthe program uses data that it receives over the network.Using this information, we can build models that cap-ture the host-based activity associated with individualnetwork connections. Our models are behavior graphs,where the nodes are system calls and the edges representdata flows between system calls.
We use machine-learning to build graph-based modelsthat characterize malicious C&C connections (e.g., con-nections that download binary updates that the malwarelater executes, or connections in which the malware up-loads stolen data to a C&C server). More precisely, start-

ing from labeled sets of graphs that are related to bothknown C&C connections and other, irrelevant malwaretraffic, we identify those subgraphs that are most char-acteristic of C&C communication. In the next step, weabstract from these specific subgraphs and produce gen-eralized graph templates. Each graph template capturesthe core characteristics of a different type or implemen-tation of C&C communication. These graph templatescan be used to recognize C&C connections of bots thathave not been analyzed previously. Moreover, our tem-plates possess explanatory capabilities and can help ana-lysts to understand how a particular bot utilizes its C&Cchannel (e.g., for binary updates, configuration files, orinformation leakage).
Our experiments demonstrate that our system cangenerate C&C templates that recognize host-based ac-tivity associated with known, malicious traffic with highaccuracy and very few false positives. Moreover, weshow that our templates also generalize; that is, they de-tect C&C connections that were previously unknown.The contributions of this paper are the following:
• We present a novel approach to identify C&C com-munication in the large pool of network connec-tions that modern bots open. Our approach lever-ages host-based information and associates mod-els, which are based on system call graphs, with thedata that is exchanged over network connections.• We present a novel technique that generalizes sys-
tem call graphs to capture the “essence” of, orthe core activities related to, C&C communication.This generalization step extends previous work onsystem call graphs, and provides interesting in-sights into the purpose of C&C traffic.• We implemented these techniques in a tool called
JACKSTRAWS and evaluated it on 130,635 connec-tions produced by more than 37 thousands malwaresamples. Our results show that the generated tem-plates detect known C&C traffic with high accu-racy, and less than 0.2% false positives over harm-less traffic. Moreover, we found 9,464 previously-unknown C&C connections, improving the cover-age of hand-crafted network signatures by 60%.
2 System OverviewOur system monitors the execution of a malware pro-gram in a dynamic malware analysis environment (suchas Anubis [20], BitBlaze [40], CWSandbox [44], orEther [9]). The goal is to identify those network con-nections that are used for C&C communication. To thisend, we record the activities (in our case, system calls)on the host that are related to data that is sent over andreceived through each network connection. These activ-ities are modeled as behavior graphs, which are graphsthat capture system call invocations and data flows be-
network: connect
port: 80
network: send
arg: socket=Result
network: recv
arg: socket=Result
systemcall: NtQueryValueKey
Valuename: ProductId
arg: buf=KeyValueInformation
systemcall: NtOpenKey
Keyname: HKLM\SOFTWARE\Microsoft\Windows\CurrentVersion
arg: KeyHandle=KeyHandle
systemcall: NtOpenKey
Keyname: \REGISTRY\MACHINE
arg: ObjectAttributes=KeyHandle
GET /bot/doit.php?v=3&id=ec32632b-29981-349-398...
Figure 1: Example of behavior graph that shows infor-mation leakage. Underneath, the network log shows thatthe Windows ID was leaked via the GET parameter id.
tween system calls. In our setting, one graph is asso-ciated with each connection. As the next step, all be-havior graphs that are created during the execution of amalware sample are matched against templates that rep-resent different types of C&C communication. When agraph matches a template sufficiently closely, the corre-sponding connection is reported as C&C channel.
In the following paragraphs, we first discuss behaviorgraphs. We then provide an overview of the necessarysteps to generate the C&C templates.Behavior graphs. A behavior graph G is a graph wherenodes represent system calls. A directed edge e is in-troduced from node x to node y when the system callassociated with y uses as argument some output that isproduced by system call x. That is, an edge represents adata dependency between system calls x and y. Behav-ior graphs have been introduced in previous work as asuitable mechanism to model the host-based activity of(malware) programs [5,13,26]. The reason is that systemcalls capture the interactions of a program with its envi-ronment (e.g., the operating system or the network), anddata flows represent a natural dependence and orderedrelationship between two system calls where the outputof one call is directly used as the input to the other one.
Figure 1 shows an example of a behavior graph. Thisgraph captures the host-based activity of a bot that readsthe Windows serial number (ID) from the registry andsends it to its command and control server. Frequently,bots collect a wealth of information about the infected,local system, and they send this information to theirC&C servers. The graph shows the system calls that areinvoked to open and read the Windows ID key from theregistry. Then, the key is sent over a network connec-

tion (that was previously opened with connect). Ananswer is finally received from the server (recv node).
While behavior graphs are not novel per se, we usethem in a different context to solve a novel problem. Inprevious work, behavior graphs were used to distinguishbetween malicious and benign program executions. Inthis work, we link behavior graphs to network traffic andcombine these two views. That is, we use these graphsto identify command and control communication amidstall connections that are produced by a malware sample.C&C templates. As mentioned previously, the behav-ior graphs that are produced by our dynamic malwareanalysis system are matched against a set of C&C tem-plates. C&C templates share many similarities with be-havior graphs. In particular, nodes n carry informationabout system call names and arguments encoded as la-bels ln, and edges e represent data dependencies wherethe type of flow is encoded as labels le. The main differ-ence to behavior graphs is that the nodes of templates aredivided into two classes; core and optional nodes. Corenodes capture the necessary parts of a malicious activity,while optional nodes are only sometimes present.
To match a C&C template against a behavior graphG,we define a similarity function δ. This function takes asinput the behavior graph G and a C&C template T andproduces a score that indicates how well G matches thetemplate. All core nodes of a template must at least bepresent in G in order to declare a match.Template generation. Each C&C template representsa certain type of command and control activity. We usethe following four steps to generate C&C templates:
In the first step, we run malware executables in ourdynamic malware analysis environment, and extract thebehavior graphs for their network connections. Theseconnections can be benign or related to C&C traffic.
JACKSTRAWS requires that some of these connectionsare labeled as either malicious or benign (for training).In our current system, we apply a set of signatures toall connections to find (i) known C&C communicationand (ii) traffic that is known to be unrelated to C&C.Note that we have signatures that explicitly identify be-nign connections as such. The signatures were manuallyconstructed, and they were given to us by a network se-curity company. By matching the signatures against thenetwork traffic, we find a set of behavior graphs that areassociated with known C&C connections (called mali-cious graph set) and a set of behavior graphs associatedwith non-C&C traffic (called benign graph set). Thesesets serve as the basis for the subsequent steps.
It is important to observe that our general approachonly requires labeled connections, without consideringthe payload of network connections. Thus, we could useother means to generate the two graph sets. For exam-ple, we can add a graph to the malicious set if the net-
work connection corresponding to this graph contacteda known blacklisted C&C domain. This allows us tocreate suitable graph sets even for encrypted C&C con-nections. One could also manually label connections.
Of course, there are also graphs for which we do nothave a classification (that is, neither a C&C signature nora benign signature has matched). These unknown graphscould be related to either malicious or benign traffic, andwe do not consider them in the subsequent steps.
The second step uses the malicious and the benigngraph sets as inputs and performs graph mining. Moreprecisely, we use a graph mining technique, previouslypresented by Yan and Han [47,48], to identify subgraphsthat frequently appear in the malicious graph set. Thesefrequent subgraphs are likely to constitute the core activ-ity linked to C&C connections. Some post-processing isthen applied to compact the set of mined subgraphs. Fi-nally, the set difference is computed between the mined,malicious subgraphs and the benign graph set. Onlysubgraphs that never appear by subgraph isomorphismin the benign graph set are selected. The assumptionis that the selected subgraphs represent some host- andnetwork-level activity that is only characteristic of par-ticular C&C connections, but not benign traffic.
In [13], the authors used a similar approach to distin-guish between malware and harmless programs. To thisend, the authors used a leap mining technique presentedby Yan et al. [46] that selects subgraphs which maximizethe information gain between the malicious and benigngraph sets, that is to say subgraphs that maximally cover(detect) the entire collection of malicious graphs whileintroducing a very low number of false positives. How-ever, during the mining process, this technique tends toremove the graph parts that could be common to bothbenign and malicious graphs. In our present case, theseparts are critical to obtain complete C&C templates. Forexample, in the case of a download and execute com-mand, if the download part of the graph is observed inthe benign set, leap mining would only mine the executepart. For these reasons, we performed the set differencewith the benign graph set only as post-processing, oncecomplete malicious subgraphs have already been mined,without risk of losing parts of them.
In addition, the algorithm proposed in [13] does notattempt to synthesize any semantic information from themined behaviors; it does not produce a template thatcombines related behaviors and generalizes their com-mon core. In other words [13], “this synthesis step doesnot add new behaviors to the set, it only combines theones previously mined.” In this paper, we go further andintroduce two additional, novel steps to generalize theresults obtained during the graph mining step. This isimportant because we want to generalize from specificinstances of implementing a C&C connection and ab-

stract a core that characterizes the common and neces-sary operations for a particular type of command.
As a third step, we cluster the graphs previouslymined. The goal of this step is to group together graphsthat correspond to a similar type of command and con-trol activity. That is, when we have observed differ-ent instances of one particular behavior, we combinethe corresponding graphs into one cluster. As an ex-ample, consider different instances of a malware familywhere each sample downloads data from the network viaHTTP, decodes it in some way, stores the data on disk,and finally executes that file. All instances of this be-havior are examples for typical bot update mechanisms(download and execute), and we want to group all ofthem into one cluster. As a result of this step, we ob-tain different clusters, where each cluster contains a setof graphs that correspond to a particular C&C activity.
In the fourth step, we produce a single C&C templatefor each cluster. The goal of a template is to capture thecommon core of the graphs in a cluster; with the assump-tion that this common core represents the key activitiesfor a particular behavior. The C&C templates are gener-ated by iteratively computing the weighted minimal com-mon supergraph (WMCS) [3] between the graphs in acluster. The nodes and edges in the supergraph that arepresent in all individual graphs become part of the core.The remaining ones become optional.
At the end of this step, we have extracted templatesthat match the core of the program activities for differenttypes of commands, taking into account optional opera-tions that are frequently (but not always) present. Thisallows us to match variants of C&C traffic that might bedifferent (to a certain degree) from the exact graphs thatwe used to generate the C&C templates.
3 System DetailsIn this section, we provide an overview of the actual im-plementation of JACKSTRAWS and explain the differentanalysis steps in greater details.
3.1 Analysis EnvironmentWe use the dynamic malware analysis environment Anu-bis [20] as the basis for our implementation, and imple-mented several extensions according to our needs. Notethat the general approach and the concepts outlined inthis paper are independent of the actual analysis envi-ronment; we could have also used BitBlaze, Ether, orany other dynamic malware analysis environment.
As discussed in Section 2, behavior graphs are usedto capture and represent the host-based activity that mal-ware performs. To create such behavior graphs, weexecute a malware sample and record the system callsthat this sample invokes. In addition, we identify de-pendencies between different events of the execution
by making use of dynamic taint analysis [38], a tech-nique that allows us to asses whether a register or mem-ory value depends on the output of a certain operation.Anubis already comes with tainting propagation sup-port. By default, all output arguments of system callsfrom the native Windows API (e.g., NtCreateFile,NtCreateProcess, etc.) are marked with a uniquetaint label. Anubis then propagates the taint informationwhile the monitored system processes tainted data. Anu-bis also monitors if previously tainted data is used as aninput argument for another system call.
While Anubis propagates taint information for data inmemory, it does not track taint information on the filesystem. In other words, if tainted data is written to afile and subsequently read back into memory, the origi-nal taint labels are not restored. This shortcoming turnedout to be a significant drawback in our settings: For ex-ample, bots frequently download data from the C&C,decode it in memory, write this data to a file, and laterexecute it. Without taint tracking through the file system,we cannot identify the dependency between the data thatis downloaded and the file that is later executed. Anotherexample is the use of configuration data: Many malwaresamples retrieve configuration settings from their C&Cservers, such as URLs that should be monitored for sen-sitive data or address lists for spam purposes. Such con-figuration data is often written to a dedicated file beforeit is loaded and used later. Restoring the original taint la-bels when files are read ensures that the subsequent botactivity is linked to the initial network connection andimproves the completeness of the behavior graphs.
Finally, we improved the network logging abilitiesof Anubis by hooking directly into the Winsock APIcalls rather than considering only the abstract interface(NtDeviceIOControlFile) at the native systemcall level. This allows us to conveniently reconstructthe network flows, since send and receive operations arereadily visible at the higher-level APIs.
3.2 Behavior Graph GenerationWhen the sample and all of its child processes have ter-minated, or after a fixed timeout (currently set to 4 min-utes), JACKSTRAWS saves all monitored system calls,network-related data, and tainting information into a logfile. Unlike previous work that used behavior graphsfor distinguishing between malicious and legitimate pro-grams, we use these graphs to determine the purpose ofnetwork connections (and to detect C&C traffic). Thus,we are not interested in the entire activity of the mal-ware program. Instead, we only focus on actions relatedto network traffic. To this end, we first identify all sendand receive operations that operate on a successfully-established network connection. In this work, we fo-cus only on TCP traffic, and a connection is considered

successful when the three-way handshake has completedand at least one byte of user data was exchanged. Allsystem calls that are related to a single network con-nection are added to the behavior graph for this connec-tion. That is, for each network connection that a samplemakes, we obtain one behavior graph which captures thehost-based activities related to this connection.
For each send operation, we check whether the sentdata is tainted. If so, we add the corresponding systemcall that produced this data to the behavior graph andconnect both nodes with an edge. Likewise, for eachreceive operation, we taint the received data and checkif it is later used as input to a system call. If so, we alsoadd this system call to the graph and connect the nodes.
For each system call that is added to the graph in thisfashion, we also check backward dependencies (that is,whether the system call has tainted input arguments). Ifthis is the case, we continue to add the system call(s)that are responsible for this data. This process is re-peated recursively as long as there are system calls leftthat have tainted input arguments that are unaccountedfor. That is, for every node that is added to our behav-ior graph, we will also add all parent nodes that producedata that this node consumes. For example, if receiveddata is written to a local file, we will add the correspond-ing NtWriteFile system call to the graph. This writesystem call will use as one of its arguments a file han-dle. This file handle is likely tainted, because it wasproduced by a previous invocation of NtCreateFile.Thus, we also add the node that corresponds to this cre-ate system call and connect the two nodes with an edge.On the other hand, forward dependencies are not recur-sively followed to avoid an explosion in the graph size.
Graph labeling. Nodes and edges that are inserted intothe behavior graph are augmented with additional labelsthat capture more information about the nature of thesystem calls and the dependencies between nodes. Foredges, the label stores either the names of the input orthe output arguments of the system calls that are con-nected by a data dependency. For nodes, the label storesthe system call name and some additional informationthat depends on the specific type of call. The additionalinformation can store the type of the resource (files, reg-istry keys, ...) that a system call operates on as well asflags such as mode or permission bits. Note that someinformation is only stored as comment; this informationis ignored for the template generation and matching, butis saved for a human analyst who might want to examinea template.
One important additional piece of information storedfor system calls that manipulate files and registry keys isthe name of these files and keys. However, for these re-source names, it is not desirable to use the actual string.The reason is that labels are taken into account during
the matching process, and two nodes are considered thesame only when their labels match. Thus, some type ofabstraction is necessary for labels that represent resourcenames, otherwise, graphs become too specific. We gen-eralize file names based on the location of the file (usingthe path name) and its type (typically, based on the file’sextension). Registry key names are generalized by nor-malizing the key root (using abbreviations) and replac-ing random names by a generic format (typically, nu-merical values). More details about the labeling processand these abstractions can be found in Appendix A.Simplifying behavior graphs. One problem we facedduring the behavior graph generation was that certaingraphs grew very large (in terms of number of nodes),but the extra nodes only carried duplicate information.For example, consider a bot that downloads an exe-cutable file. When this file is large, the data will notbe read from the network connection by a single recvcall. Instead, the receive system call might be invokedmany times; in fact, we have observed samples that readnetwork data one byte at a time. Since every system callresults in a node being added to the behavior graph, thiscan increase the number of nodes significantly.
To reduce the number of (essentially duplicate) nodesin the graph, we introduce a post-processing step thatcollapses certain nodes. The purpose of this step isto combine multiple nodes, sharing the same label anddependencies. More precisely, for each pair of nodeswith an identical label in the behavior graph, we checkwhether (1) the two nodes share the same set of parentnodes, or (2) the sets of parents and children of one nodeare respective subsets of the other, or (3) one node is theonly parent of the other. If this is the case, we collapsethese nodes into a single node and add a special tag Is-Multiple to the label. Additional incoming and outgoingedges of the aggregated nodes are merged into the newnode. The process is repeated until no more collapsingis possible. As an example, consider the case where awrite file operation stores data that was previously readfrom the network by multiple receive calls. In this case,the write system call node will have many identical par-ent nodes (the receive operations), which all contributeto the buffer that is written. In the post-processing step,these nodes are all merged into a single system call. Abeneficial side-effect of node collapsing is that this doesnot only reduce the number of nodes, but also providessome level of abstraction from the concrete implementa-tion of the malware code and the number of times iden-tical functions are called (as part of a loop, for example).Summary. The output of the two previous steps is onebehavior graph for each network connection that a mal-ware sample makes. Behavior graphs can be used in twoways: First, we can match behavior graphs, producedby running unknown malware samples, against a set
of C&C templates that characterize malicious activity.When a template matches, the corresponding networkconnection can be labeled as command and control. Thismatching procedure is explained in Section 3.6.
The second use of behavior graphs is for C&C tem-plate generation. For this process, we assume that weknow some connections that are malicious and some thatare benign. We can then extract the subgraphs fromthe behavior graphs that are related to known maliciousC&C connections and subgraphs that represent benignactivity. These two sets of malicious and benign graphsform the input for the template generation process thatis described in the following three sections.
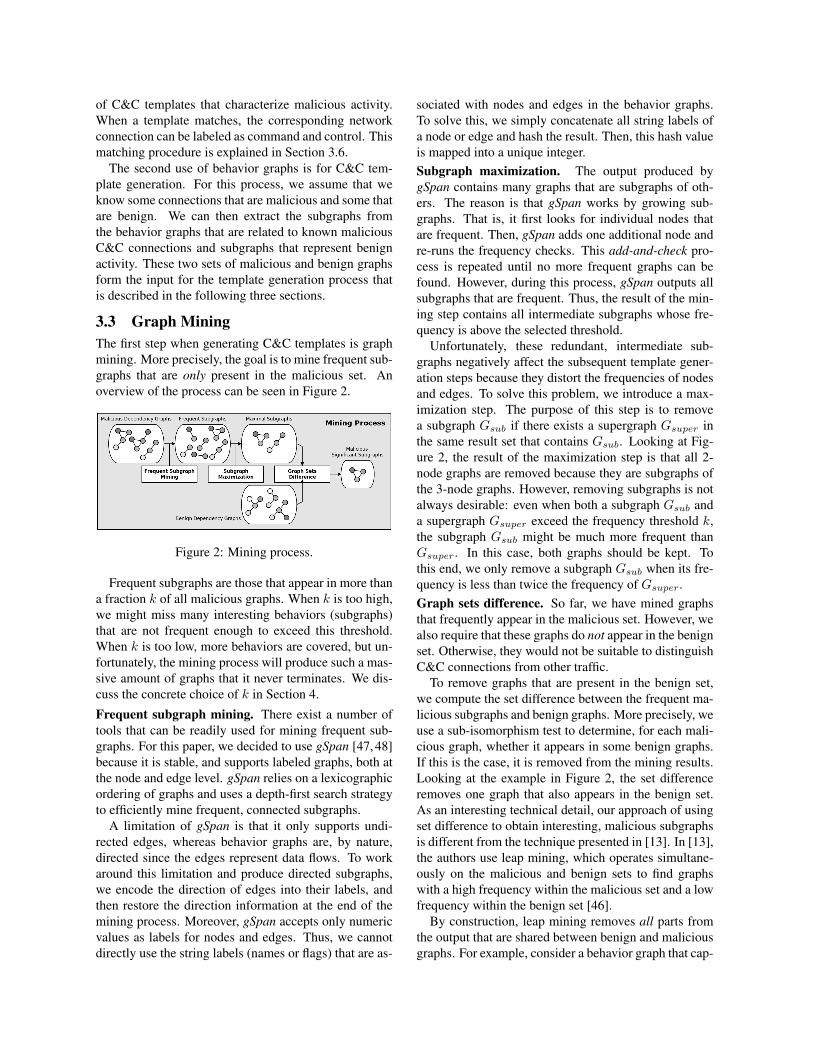
3.3 Graph MiningThe first step when generating C&C templates is graphmining. More precisely, the goal is to mine frequent sub-graphs that are only present in the malicious set. Anoverview of the process can be seen in Figure 2.
Figure 2: Mining process.
Frequent subgraphs are those that appear in more thana fraction k of all malicious graphs. When k is too high,we might miss many interesting behaviors (subgraphs)that are not frequent enough to exceed this threshold.When k is too low, more behaviors are covered, but un-fortunately, the mining process will produce such a mas-sive amount of graphs that it never terminates. We dis-cuss the concrete choice of k in Section 4.
Frequent subgraph mining. There exist a number oftools that can be readily used for mining frequent sub-graphs. For this paper, we decided to use gSpan [47, 48]because it is stable, and supports labeled graphs, both atthe node and edge level. gSpan relies on a lexicographicordering of graphs and uses a depth-first search strategyto efficiently mine frequent, connected subgraphs.
A limitation of gSpan is that it only supports undi-rected edges, whereas behavior graphs are, by nature,directed since the edges represent data flows. To workaround this limitation and produce directed subgraphs,we encode the direction of edges into their labels, andthen restore the direction information at the end of themining process. Moreover, gSpan accepts only numericvalues as labels for nodes and edges. Thus, we cannotdirectly use the string labels (names or flags) that are as-
sociated with nodes and edges in the behavior graphs.To solve this, we simply concatenate all string labels ofa node or edge and hash the result. Then, this hash valueis mapped into a unique integer.Subgraph maximization. The output produced bygSpan contains many graphs that are subgraphs of oth-ers. The reason is that gSpan works by growing sub-graphs. That is, it first looks for individual nodes thatare frequent. Then, gSpan adds one additional node andre-runs the frequency checks. This add-and-check pro-cess is repeated until no more frequent graphs can befound. However, during this process, gSpan outputs allsubgraphs that are frequent. Thus, the result of the min-ing step contains all intermediate subgraphs whose fre-quency is above the selected threshold.
Unfortunately, these redundant, intermediate sub-graphs negatively affect the subsequent template gener-ation steps because they distort the frequencies of nodesand edges. To solve this problem, we introduce a max-imization step. The purpose of this step is to removea subgraph Gsub if there exists a supergraph Gsuper inthe same result set that contains Gsub. Looking at Fig-ure 2, the result of the maximization step is that all 2-node graphs are removed because they are subgraphs ofthe 3-node graphs. However, removing subgraphs is notalways desirable: even when both a subgraph Gsub anda supergraph Gsuper exceed the frequency threshold k,the subgraph Gsub might be much more frequent thanGsuper. In this case, both graphs should be kept. Tothis end, we only remove a subgraph Gsub when its fre-quency is less than twice the frequency of Gsuper.Graph sets difference. So far, we have mined graphsthat frequently appear in the malicious set. However, wealso require that these graphs do not appear in the benignset. Otherwise, they would not be suitable to distinguishC&C connections from other traffic.
To remove graphs that are present in the benign set,we compute the set difference between the frequent ma-licious subgraphs and benign graphs. More precisely, weuse a sub-isomorphism test to determine, for each mali-cious graph, whether it appears in some benign graphs.If this is the case, it is removed from the mining results.Looking at the example in Figure 2, the set differenceremoves one graph that also appears in the benign set.As an interesting technical detail, our approach of usingset difference to obtain interesting, malicious subgraphsis different from the technique presented in [13]. In [13],the authors use leap mining, which operates simultane-ously on the malicious and benign sets to find graphswith a high frequency within the malicious set and a lowfrequency within the benign set [46].
By construction, leap mining removes all parts fromthe output that are shared between benign and maliciousgraphs. For example, consider a behavior graph that cap-

tures a command that downloads data, stores it to a file,and later executes this file. If the download part of thisgraph is also present in the benign set, which is likely tobe the case (since downloading data is not malicious perse), this part will be removed. Thus, the malicious graphwill only contain the part where the downloaded file isexecuted. That is, in this example, leap mining wouldproduce an incomplete graph that covers only part of therelevant, malicious activity. In our case, we first gener-ate the entire graph that captures both the download andthe execute. Then, the set difference algorithm checkswhether this entire graph occurs also in the benign set.Since no benign graph is presumably a supergraph of themalicious behavior, the entire graph is retained.
3.4 Graph ClusteringUsing as input the frequent, malicious subgraphs pro-duced by the previous mining step, the purpose of thisstep is to find clusters of similar graphs (see Figure 3).The graph mining step produces different graphs thatrepresent different types of behaviors. We now need tocluster these graphs to find groups, where each groupshares a common core of activities (system calls) typi-cal of a particular behavior. Graph clustering is used forthis purpose; generated clusters are later used to creategeneralized templates covering the graphs they contain.
Figure 3: Clustering and generalization processes.
A crucial component for every clustering algorithmis the proper choice of a similarity measure that com-putes the distances between graphs. In our system, thesimilarity measure between two graphs is based on theirnon-induced, maximum common subgraph (mcs). Themcs of two graphs is the maximal subgraph that is iso-morphic to both. The intuition behind the measure is thefollowing: We expect two graphs that represent the samemalware behavior to share a common core of nodes thatcapture this behavior. The mcs captures this core. Thus,the mcs will be large for similar graphs. From now on,all references to the mcs will refer to the non-inducedconstruction. The similarity measure is defined as:
d(G1, G2) =2× |edges(mcs(G1, G2)||edges(G1)|+ |edges(G2)|
(1)
To compute the mcs between two graphs, we use theMcGregor backtracking algorithm [6]. According to
benchmarking results [6], this algorithm performs wellon randomly-connected graphs with small density. Inour case, behavior graphs have no cycles and only a lim-ited number of dependencies; this is close to randomly-connected graphs rather than regular or irregular meshes.
As shown in Figure 3, we use the mcs similarity mea-sure to compute the one-to-one distance matrix betweenall mined graphs. We then use a tool, called Cluto [24],to find clusters of similar graphs. Cluto implements avariety of different clustering algorithms; we selectedclustering by repeated bisection. This algorithm worksas follows: All graphs are originally put into a singlecluster. This cluster is then iteratively split until the sim-ilarity in each sub-cluster is larger than a given similaritythreshold [24, 50]. At each step, the cluster to be split ischosen so that the similarity function between the ele-ments of that clusters is maximized. The advantage ofthis technique is that we do not need to define a fixednumber of clusters a priori. Moreover, one also does notneed to select initial graphs as center to build the clustersaround (as with k-means clustering). The output of thisstep is a set of clusters that contain similar graphs.
3.5 Graph Generalization and Templating
Based on the clusters of similar graphs, the final step inour template generation process is graph generalization(the rightmost step in Figure 3). The goal of the gen-eralization process is to construct a template graph thatabstracts from the individual graphs within a cluster. In-tuitively, we would expect that a template contains a coreof nodes, which are common to all graphs in a cluster.In addition, to capture small differences between thesegraphs, there will be optional nodes attached to the core.
The generalization algorithm computes the weightedminimal common supergraph (WMCS) of all the graphswithin a given cluster [3]. The WMCS is the minimalgraph such that all the graphs of the cluster are con-tained within it. To distinguish between core and op-tional nodes, we use weights. These weights capturehow frequent a node or an edge in the WMCS is presentin one of the individual graphs. For core edges and corenodes, we expect that they are present in all graphs of acluster (that is, their weight is n in the WMCS, assumingthat there are n graphs in the cluster). All other nodeswith a weight smaller than n become optional nodes.
The approach to compute a template is presented inAlgorithm 1. The WMCS is first initialized with the firstgraph G1 of the cluster, and the weights of all its nodesand edges are set to 1. The integration of an additionalgraph Gi is performed as follows: We first determinethe maximal common subgraph mcs between Gi and thecurrent WMCS. The nodes and edges in the WMCS thatare part of the mcs have their weight increased by 1. The

Algorithm 1 Weighted minimum common supergraphRequire: A graph set G1, ..., Gn
1: WMCS ← G1
2: ∀n ∈ nodes(T ) and e ∈ edges(T ) do wn := 1 and we := 13: for i = 2 to n do4: s := state exploration(�)5: mcs← maximum common subgraph(Gi,WMCS, s)6: ∀n ∈ nodes(mcs) do wn += 17: ∀e ∈ edges(mcs) do we += 18: ∀n ∈ nodes(Gi) and n 6∈ nodes(mcs),
do WMCS.add node(n) and wn := 19: ∀e ∈ edges(Gi) and e 6∈ edges(mcs),
do WMCS.add edge(e) and we := 110: end for11: return WMCS
nodes and edges in Gi that are not part of the mcs areadded to the WMCS, and their weight is set to 1.
To increase the generality of a template, the labels ofoptional nodes are further relaxed. More precisely, oursystem preserves the label that stores the name of thesystem call. However, all additional information is re-placed by a wild card that matches every possible, con-crete parameter later. Finally, we remove all templateswith a core of three or fewer nodes. The reason is thatthese templates are likely too small to accurately capturethe entire malicious activity and might lead to false pos-itives. In the example in Figure 3, core nodes and edgesare shown as dark elements, while the optional elementsare white. We generate one C&C template per cluster.
3.6 Template MatchingThe previous steps leveraged machine learning tech-niques and sets of known malicious and benign graphs toproduce a number of C&C templates. These templatesare graphs that represent host-based activity that is re-lated to command and control traffic. To find the C&Cconnections for a new malware sample, this sample isfirst executed in the sandbox, and our system extracts itsbehavior graphs (as discussed in Sections 3.1 and 3.2).Then, we match all C&C templates against the behaviorgraphs. Whenever a match is found, the correspondingconnection is detected as command and control traffic,and we can extract its endpoints (IPs and domains).
The matching technique is described in Algorithm 2.In a first step, we attempt to determine whether the coreof a template T is present in the behavior graph G. Tothis end, we simply use a subgraph isomorphism test.When the test fails, we know that the core nodes of Tare not part of the graph, and we can advance to tryingthe next template. If the core is found, we obtain themapping from the core nodes to the corresponding nodesin G. We then test the optional nodes. To this end, wecompute the mcs between T and G. For this, the fixedmapping provided by the previous isomorphism test isused to initialize the space exploration when building the
Algorithm 2 Template matchingRequire: A behavior graph G, A template T1: map← subgraph isomorphism(core(T ), G)2: if map = � then3: return false4: end if5: s := state exploration(map)6: mcs← maximum common subgraph(G,T, s)7: return true,mcs
mcs, significantly speeding up the process. Based on theresult of the mcs computation, we can directly see howmany optional nodes have matched, that is to say, arecovered by the mcs. Taking into account the fraction (orthe absolute number) of optional nodes that are found inG, we can declare a template match.
4 EvaluationExperiments were performed to evaluate JACKSTRAWSboth from a quantitative and qualitative perspective.This section describes the evaluation details and results.
4.1 Evaluation DatasetsFor the evaluation, our system analyzed a total of 37,572malware samples. The samples were provided to us bya network security company, who obtained the binariesfrom recent submission to a public malware analysissandbox. Moreover, we were only given samples thatshowed some kind of network activity when run in thesandbox. We were also provided with a set of 385 sig-natures specifically for known C&C traffic, as well as162 signatures that characterize known, benign traffic.As mentioned previously, the company uses signaturesfor benign traffic to be able to quickly discard harmlessconnections that bots frequently make.
To make sure that our sample set covers a wide vari-ety of different malware families, we labeled the entireset with six different anti-virus engines: Kaspersky, F-Secure, BitDefender, McAfee, NOD32, and F-Prot. Us-ing several sources for labeling allows us reduce the pos-sible limitations of a single engine. For every malwaresample, each engine returns a label (unless the samplesis considered benign) from which we extract the mal-ware family substring. For instance, if one anti-virusengine classifies a sample as Win32.Koobface.AZ, thenKoobface is extracted as the family name. The familythat is returned by a majority of the engines is used tolabel a sample. In case the engines do not agree (andthere is no majority for a label), we go through the out-put of the AV tools in the order that they were mentionedpreviously and pick the first, non-benign result.
Overall, we identified 745 different malware familiesfor the entire set. The most prevalent families wereGeneric (3756), EgroupDial (2009), Hotbar (1913),Palevo (1556), and Virut (1539). 4,096 samples re-

mained without label. Note that Generic is not a preciselabel; many different kinds of malware can be classifiedas such by AV engines. In summary, the results indicatethat our sample set has no significant bias towards a cer-tain malware family. As expected, it covers a rich anddiverse set of malware, currently active in the wild.
In a first step, we executed all samples in JACK-STRAWS. Each sample was executed for four minutes,which allows a sample to initialize and perform its nor-mal operations. This timeout is typically enough toestablish several network connections and send/receivedata via them. The execution of the 37,572 samplesproduced 150,030 network connections, each associatedwith a behavior graph. From these graphs, we removed19,395 connections in which the server responded withan error (e.g., an HTTP request with a 404 “Not Found”response). Thus, we used a total of 130,635 graphs pro-duced by a total of 33,572 samples for the evaluation.
In the next step, we applied our signatures to thenetwork connections. This resulted in 16,535 connec-tions that were labeled as malicious (known C&C traffic,12.7%) and 16,082 connections that were identified asbenign (12.3%). The malicious connections were pro-duced by 9,108 samples, while the benign connectionscorrespond to 7,031 samples. The remaining 98,018connections (75.0%) are unknown. The large fraction ofunknown connections is an indicator that it is very dif-ficult to develop a comprehensive set of signatures thatcover the majority of bot-related C&C traffic. In partic-ular, there was at least one unclassified connection for31,671 samples. Note that the numbers of samples thatproduced malicious, benign, and unknown traffic add upto more than the total number of samples. This is be-cause some samples produced both malicious and be-nign connections. This underlines that it is difficult topick the important C&C connections among bot traffic.
Of course, not all of the 385 malicious signatures pro-duced matches. In fact, we observed only hits from 78C&C signatures, and they were not evenly distributed.A closer examination revealed that the signature thatmatched the most number of network connections is re-lated to Palevo (4,583 matches), followed by Ramnit(3,896 matches) and Koobface (2,690 matches).
4.2 Template GenerationInitially, we put all 16,535 behavior graphs that corre-spond to known C&C connections into the maliciousgraphs set, while the 16,082 graphs corresponding to be-nign connections were added to the benign graphs set.To improve the quality of these sets, we removed graphsthat contained too few nodes, as well as graphs thatcontained only nodes that correspond to network-relatedsystem calls (and a few other house-keeping functionsthat are not security-relevant). Moreover, to maintain
a balanced training set, we kept at most three graphs(connections) for each distinct malware sample. Thispre-processing step reduced the number of graphs in themalicious set to 10,801, and to 12,367 in the benign set.
Both sets were then further split into a training set anda test set. To this end, we randomly picked a numberof graphs for the training set, while the remaining oneswere set aside as a test set. More precisely, for the mali-cious graphs, we kept 6,539 graphs (60.5%) for trainingand put 4,262 graphs (39.5%) into the test set. For thebenign graphs, we kept 8,267 graphs (66.8%) for train-ing and put 4,100 graphs (33.2%) into the test set. Weused these malicious and benign training sets as inputfor our template generation algorithm. This resulted in417 C&C templates that JACKSTRAWS produced. Theaverage number of nodes in a template was 11, where 6nodes were part of the core and 5 were optional.
For the mining process, we used a threshold k = 0.1.That is, the mining tool will pick subgraphs from thetraining sets only when they appear in more than 10%of all behavior graphs. The reason why we could oper-ate with a relatively large threshold of k = 0.1 is thatwe divided the behavior graphs into different bins, andmined on each bin individually. To divide graphs intobins, we observe that certain malware activity requiresthe execution of a particular set of system calls. For ex-ample, to start a new process, the malware needs to callNtCreateProcess, or to write to a file, it needs tocall NtWriteFile. Thus, we selected five security-relevant system activities (registry access; file systemaccess; process creation; queries to system information;and accesses to web-related resources, such as HTML orJS files) and assigned each to a different bin. Then, weput into each bin all behavior graphs that contain a nodewith the corresponding activity (system calls). Graphsthat did not fall into any of these bins were gathered ina miscellaneous bin. It is important to observe that thisstep merely allows us to mine with a higher threshold,and thus to accelerate the graph mining process consid-erably. We would have obtained the same set of tem-plates (and possibly more) when mining on the entiretraining set with a lower mining threshold.
For the clustering process, we iterated the bisectionoperation until the average similarity within the clus-ters was over 60% and the minimal similarity was over40%. Higher thresholds were discarded because they in-creased the number of clusters, making them too spe-cific.
Producing templates for the 14,806 graphs in thetraining set took about 21 hours on an Intel Xeon 4CPUs 2.67GHz server, equipped with 16GB of RAM.This time was divided into 16 hours for graph mining,4.5 hours for clustering, and 30 minutes for graph gen-eralization. This underlines that, despite the potentially

costly (NP-hard) graph algorithms, JACKSTRAWS is ableto efficiently produce results on a large, real-world in-put dataset. The mining process was the most time-consuming operation, but the number of mined sub-graphs was, in the end, five times smaller than the num-ber of graphs in input. Consequently, the clustering pro-cess, which is polynomial in function of the number ofgraphs in input, ran on a reduced set. For the templategeneration process, the resulting clusters only contained10 to 20 graphs on average, explaining the faster com-putations.
4.3 Detection AccuracyIn the next step, we wanted to assess whether the gen-erated templates can accurately detect activity relatedto command and control traffic without matching be-nign connections. To this end, we ran two experiments.First, we evaluated the templates on the graphs in thetest set (which correspond to known C&C connections).Then, we applied the templates to graphs associatedwith unknown connections. This allows us to deter-mine whether the extracted C&C templates are genericenough to allow detection of previously-unknown C&Ctraffic (for which no signature exists).
Experiment 1: Known C&C connections. For the firstexperiment, we made use of the test set that was pre-viously set aside. More precisely, we applied our 417templates to the behavior graphs in the test set. This testset contained 4,262 connections that matched C&C sig-natures and 8,267 benign connections.
Our results show that JACKSTRAWS is able to success-fully detect 3,476 of the 4,262 malicious connections(81.6%) as command and control traffic. Interestingly,the test set also contained malware families that wereabsent from the malicious training set. 51.7% of themalicious connections coming from these families weresuccessfully detected, accounting for 0.4% of all detec-tions. While the detection accuracy is high, we exploredfalse negatives (i.e., missed detections) in more detail.Overall, we found three reasons why certain connectionswere not correctly identified:
First, in about half of the cases, detection failed be-cause the bot did not complete its malicious action afterit received data from the C&C server. Incomplete be-havior graphs can be due to a timeout of the dynamicanalysis environment, or an invalid configuration of thehost to execute the received command properly.
Second, the test set contained a significant number ofAdware samples. The behavior graphs extracted fromthese samples are very similar to benign graphs; afterall, Adware is in a grey area different from maliciousbots. Thus, all graphs potentially covering these sam-ples are removed at the end of the mining process, whencompared to the benign training sets.
The third reason for missed detections are maliciousconnections that are only seen a few times (possibly onlyin the test set). According to the AV labels, our dataset covers 745 families (and an additional 4,096 samplesthat could not be labeled). Thus, certain families are rarein the data set. When a specific graph is only present afew times (or not at all) in the training set, it is possiblethat all of its subgraphs are below the mining threshold.In this case, we do not have a template that covers thisactivity.
JACKSTRAWS also reported 7 benign graphs as ma-licious out of 4,100 connections in the benign test set:a false positive rate of 0.2%. Upon closer examination,these false positives correspond to large graphs wheresome Internet caching activity is observed. These graphsaccidentally triggered four weaker templates with fewcore and many optional nodes.
Overall, our results demonstrate that the host-basedactivity learned from a set of known C&C connections issuccessful in detecting other C&C connections that wereproduced by a same set of malware families, but alsoin detecting five related families that were only presentin the test set. In a sense, this shows that C&C tem-plates have a similar detection capability as manually-generated, network-based signatures.
We also wanted to understand the impact of templategeneralization compared to previous work that used di-rectly the mined subgraphs [13]. For this, we used thegraphs mined from the malicious training set as signa-tures, without any generalization (this is the approachfollowed in previous work). Using a sub-isomorphismtest for detection over the 4,262 malicious graphs in thetest set, we found that the detection rate was 66%, 15.6%lower. This underlines that the novel template generationprocess provides significant benefits.
Experiment 2: Unknown connections. For the nextexperiment, we decided to apply our templates to thegraphs that correspond to unknown network traffic. Thisshould demonstrate the ability of JACKSTRAWS to detectnovel C&C connections within protocols not covered byany network-level signature.
When applying our templates to the 98,018 unknownconnections, we found 9,464 matches (9.7%). We manu-ally examined these connections in more detail to deter-mine whether the detection results are meaningful. Theanalysis showed that our approach is promising; the vastmajority of connections that we analyzed had clear indi-cations of C&C activity. With the help of the anti-viruslabels, we could identify 193 malware families whichwere not covered by the network signatures. The mostprevalent new families were Hotbar (1984), Pakes (871),Kazy (107), and LdPinch (67). Furthermore, we de-tected several new variants of known bots that we didnot detect previously because their network fingerprint

had changed and, thus, none of our signatures matched.Nevertheless, JACKSTRAWS was able to identify theseconnections due to matched templates. In addition, themanual analysis showed a low number of false positives.In fact, we only found 27 false positives out of the 9,464matches, all of them being HTTP connections.
When comparing the number of our matches with thetotal number of unknown connections, the results mayappear low at first glance. However, not all connec-tions in the unknown set are malicious. In fact, 10,524connections (10.7%) do not result in any relevant host-activity at all (the graphs only contain network-relayedsystem calls such as send or connect). For an-other 13,676 graphs (14.0%), the remote server did notsend any data. For more than 7,360 HTTP connec-tions (7.5%), the server responded with status code 302,meaning that the requested content had moved. In thiscase, we probably cannot see any interesting behaviorto match. In a few hundred cases, we also observed thatthe timeout of JACKSTRAWS interrupted the analysis tooearly (e.g., the connection downloaded a large file). Inthese cases, we usually miss some of the interesting be-havior. Thus, almost 30 thousand unknown connectionscan be immediately discarded as non-C&C traffic.
Furthermore, the detection results of 9,464 new C&Cconnections for JACKSTRAWS need to be compared withthe total number of 16,535 connections that the entiresignature set was able to detect.Our generalized tem-plates were able to detect almost 60% more connec-tions than hundreds of hand-crafted signatures. Notethat our C&C templates do not inspect network traffic atall. Thus, they can, by construction, detect C&C connec-tions regardless of whether the malware uses encryptionor not, something not possible with network signatures.
4.4 Template QualityThe previous section has shown that our C&C templatesare successful in identifying host-based activity relatedto both known and novel network connections. We alsomanually examined several templates in more detail todetermine whether they capture activity that a human an-alyst would consider malicious.
JACKSTRAWS was able to extract different kinds oftemplates. A few template examples are shown in Ap-pendix B. More precisely, out of the 417 templates,more than a hundred templates represent different formsof information leakage. The leaked information is origi-nally collected from dedicated registry keys or from spe-cific system calls (e.g., computer name, Windows ver-sion and identifier, Internet Explorer version, currentsystem time, volume ID of the hard disk, or processorinformation). About fifty templates represent executablefile downloads or updates of existing files. Additionaltemplates include process execution: downloaded data
that is injected into a process and then executed. Fivetemplates also represent complete download and exe-cute commands. The remaining templates cover vari-ous other malicious activities, including registry modi-fications ensuring that the sample is started on certainevents (e.g., replacing the default executable file handlerfor Windows Explorer) and for hiding malware activity(e.g., clearing the MUICache).
We also found 20 “weak” templates (out of 417).These templates contain a small number of nodes anddo not seem related to any obvious malicious activity.However, these templates did not trigger any false pos-itive in the benign test set. This indicates that they stillexhibit enough discriminative power with regards to ourmalicious and benign graph sets.
5 Related WorkGiven the importance and prevalence of malware, it isnot surprising that there exists a large body of workon techniques to detect and analyze this class of soft-ware. The different techniques can be broadly dividedinto host-based and network-based approaches, and webriefly describe the related work in the following.Host-based detection. Host-based detection techniquesinclude systems such as traditional anti-virus tools thatexamine programs for the presence of known mal-ware. Other techniques work by monitoring the execu-tion of a process for behaviors (e.g., patterns of systemcalls [12, 28, 32]) that indicate malicious activity. Host-based approaches have the advantage that they can col-lect a wealth of detailed information about a programand its execution. Unfortunately, collecting a lot of in-formation comes with a price; it incurs a significant per-formance penalty. Thus, detailed but costly monitoringis typically reserved for malware analysis, while detec-tion systems, which are deployed on end-user machines,resort to fast but imprecise techniques [43]. As a result,current anti-virus products show poor detection rates [4].
A suitable technique to model the host-based activ-ity of a program is a behavior graph. This approachhas been successfully used in the past [5, 13, 26] andwe also apply this technique. Recently, Fredrikson etal. introduced an approach to use graph mining on be-havior graphs in order to distinguish between maliciousand benign programs [13]. Graph mining itself is a well-known technique [46–48] that we use as a building blockof JACKSTRAWS. Compared to their work, we have an-other high-level goal: we want to learn which networkconnections are related to C&C traffic in an automatedway. Thus we do not only focus on host-level activities,but also take the network-level view into account andcorrelate both. Furthermore, we also cluster the graphsand perform a generalization step to extract templatesthat describe the characteristics of C&C connections.

From a technical point of view, we perform a more fine-grained analysis by applying taint analysis instead of thecoarse-grained analysis performed by [13].
BOTSWAT [41] analyzes how bots process networkdata by analyzing system calls and performing taintanalysis. The system matches the observed behavioragainst a set of 18 manually generated behavior patterns.In contrast, we use mining and machine learning tech-niques to automatically generate C&C templates. Froma technical point of view, BOTSWAT uses library-call-level taint analysis and, thus, might miss certain depen-dencies. In contrast, the data flow analysis support ofJACKSTRAWS enables a more fine grained analysis ofinformation flow dependency among system calls.
Network-based detection. To complement host-basedsystems and to provide an additional layer for defense-in-depth, researchers proposed network-based detectiontechniques [15–18, 45, 49]. Network-based approacheshave the advantage that they can cover a large num-ber of hosts without requiring these hosts to install anysoftware. This makes deployment easier and incurs noperformance penalty for end users. On the downside,network-based techniques have a more limited view(they can only examine network traffic and encryptionmakes detection challenging), and they do not work formalicious code that does not produce any network traffic(which is rarely the case for modern malware).
Initially, network-based detectors focused on the ar-tifacts produced by worms that spread autonomouslythrough the Internet. Researchers proposed techniquesto automatically generate payload-based signatures thatmatch the exploits that worms use to compromise remotehosts [25,27,29,31,39]. With the advent of botnets, mal-ware authors changed their modus operandi. In fact, botsrarely propagate by scanning for and exploiting vulnera-ble machines; instead, they are distributed through drive-by download exploits [36], spam emails [22], or filesharing networks [23]. However, bots do need to com-municate with a command and control infrastructure.The reason is that bots need to receive commands andupdates from their controller, and also upload stolen dataand status information. As a result, researchers shiftedtheir efforts to developing ways that can detect and dis-rupt malicious traffic between bots and their C&C infras-tructure. In particular, researchers proposed approachesto identify (and subsequently block) the IP addresses anddomains that host C&C infrastructures [42], techniquesto generate payload signatures that match C&C connec-tions [15, 17, 45], and anomaly-based systems to corre-late network flows that exhibit a behavior characteristicof C&C traffic [16, 18, 49]. In a paper related to ours,Perdisci et al. studied how network traces of malwarecan be clustered to identify families of bots that performsimilar C&C communication [34]. The clustering results
can be used to generate signatures, but their approachdoes not take into account that bots generate benign traf-fic or can even deliberately inject noise [1, 10, 11, 33].Our work is orthogonal to this approach since we canprecisely identify connections related to C&C traffic.
6 LimitationsWe aim at analyzing malicious software, which is a hardtask in itself. An attacker can use different techniques tointerfere with the analysis environment which is of con-cern for us. Our approach relies on actually observingthe network communication of the sample to build thecorresponding behavior graph. Thus, we need to con-sider attacks against the dynamic analysis environment,and, specifically, the taint analysis, since this componentallows us to analyze the interdependence of network andhost activities. Several techniques have been introducedin the past to enhance the analysis capabilities, for ex-ample, multi-path execution [30] or the analysis of VM-aware samples [2]. These and similar methods can beintegrated in JACKSTRAWS so that the dynamic analysisprocess produces more extensive analysis reports. Note,however, that the evaluation results demonstrate that wecan successfully, and in a large scale, analyze complex,real-world malware samples. This indicates that the pro-totype version of JACKSTRAWS already provides a ro-bust framework for performing our analysis
Of course, an attacker might develop techniques tothwart our analysis, for example, by interleaving unnec-essary system calls with the calls that represent the ac-tual, malicious activity. The resulting, additional nodesmight hinder the mining process and prevent the extrac-tion of a graph core. An attacker might also try to in-troduce duplicate nodes to launch complexity attacks,since most of the graph algorithms used in JACKSTRAWSare known to be NP-complete [6]. However, interleavedcalls have to share some data dependencies with relevantsystem calls, otherwise, they would be stripped fromthe behavior graph. Moreover, they must be specificallycrafted to escape the collapsing mechanism. Another ap-proach to disturb the analysis is to mutate the sequenceof system calls that implement a behavior, as discussedin [21]. A possible solution to this kind of attacks is tonormalize the behavior graphs in input using rewritingtechniques. That is, semantically equivalent graph pat-terns are rewritten into a canonical form before mining.
7 ConclusionIn this paper, we focused on the problem of identifyingactual C&C traffic when analyzing binary samples. Dur-ing a dynamic analysis run, bots do not only communi-cate with their C&C infrastructure, but they often openalso a large number of benign network connections. Weintroduced JACKSTRAWS, a tool that can identify C&C

traffic in a sound way. This is achieved by correlatingnetwork traffic with the associated host behavior.
With the help of experiments, we demonstrated thedifferent templates we extracted and showed that wecan even infer information about unknown bot familieswhich we did not recognize before. On the one hand, weshowed that our approach can be applied to proprietaryprotocols, which demonstrates that it is protocol agnos-tic. On the other hand, we also applied JACKSTRAWSto HTTP traffic, which is challenging since we need toreason about small differences between legitimate andmalicious usage of the Windows API. The results showthat we can still extract precise templates in this case.
8 AcknowledgmentsThis work was supported by the ONR under grantN000140911042, the National Science Foundation(NSF) under grants CNS-0845559 and CNS-0905537,and the Ministry of Economic Affairs and Energy ofthe State of North Rhine-Westphalia (grant 315-43-02/2-005-WFBO-009). We also thank the anonymous review-ers for their comments that helped to improve the paper,Xifeng Yan for his precious help on graph mining, andLuca Foschini for his help on graph algorithms.
References[1] S. Adair. Pushdo DDoS’ing or Blending In? http:
//www.shadowserver.org/wiki/pmwiki.php/Calendar/20100129, January 2010.
[2] D. Balzarotti, M. Cova, C. Karlberger, E. Kirda, C. Kruegel, andG. Vigna. Efficient Detection of Split Personalities in Malware.In Symp. Network & Distributed System Security (NDSS), 2010.
[3] H. Bunke, P. Foggia, C. Guidobaldi, and M. Vento. Graph Clus-tering Using the Weighted Minimum Common Supergraph. InGraph Based Representations in Pattern Recognition, 2003.
[4] M. Christodorescu and S. Jha. Testing Malware Detectors. InACM Int. Symp. on Software Testing & Analysis (ISSTA), 2004.
[5] M. Christodorescu, S. Jha, and C. Kruegel. Mining specificationsof malicious behavior. In Meeting of the European Software En-gineering Conf. & the SIGSOFT Symp. Foundations of SoftwareEngineering, 2007.
[6] D. Conte, P. Foggia, and M. Vento. Challenging complexityof maximum common subgraph detection algorithms: A perfor-mance analysis of three algorithms on a wide database of graphs.Journal of Graph Algorithms & Applications, 11(1), 2007.
[7] E. Cooke, F. Jahanian, and D. McPherson. The ZombieRoundup: Understanding, Detecting, and Disrupting Botnets. InUSENIX Workshop Steps to Reducing Unwanted Traffic on theInternet Workshop (SRUTI), 2005.
[8] D. Dagon, G. Gu, C. Lee, and W. Lee. A Taxonomy of Bot-net Structures. In Annual Computer Security Applications Conf.(ACSAC), 2007.
[9] A. Dinaburg, P. Royal, M. I. Sharif, and W. Lee. Ether: MalwareAnalysis Via Hardware Virtualization Extensions. In ACM Conf.Computer & Communications Security (CCS), 2008.
[10] P. Fogla and W. Lee. Evading Network Anomaly Detection Sys-tems: Formal Reasoning and Practical Techniques. In ACMConf. Computer & Communications Security (CCS), 2006.
[11] P. Fogla, M. I. Sharif, R. Perdisci, O. Kolesnikov, and W. Lee.Polymorphic Blending Attacks. In Usenix Security Symp., 2006.
[12] S. Forrest, S. Hofmeyr, A. Somayaji, and T. A. Longstaff. ASense of Self for Unix Processes. In IEEE Symp. Security &Privacy, 1996.
[13] M. Fredrikson, S. Jha, M. Christodorescu, R. Sailer, and X. Yan.Synthesizing near-optimal malware specifications from suspi-cious behaviors. In IEEE Symp. Security & Privacy, 2010.
[14] F. C. Freiling, T. Holz, and G. Wicherski. Botnet Tracking:Exploring a Root-Cause Methodology to Prevent DistributedDenial-of-Service Attacks. In European Symp. Research in Com-puter Security (ESORICS), 2005.
[15] J. Goebel and T. Holz. Rishi: Identify Bot Contaminated Hostsby IRC Nickname Evaluation. In USENIX Workshop Hot Topicsin Understanding Botnets (HotBots), 2007.
[16] G. Gu, R. Perdisci, J. Zhang, and W. Lee. BotMiner: Clus-tering Analysis of Network Traffic for Protocol- and Structure-Independent Botnet Detection. In USENIX Security Symp., 2008.
[17] G. Gu, P. Porras, V. Yegneswaran, M. Fong, and W. Lee. BotH-unter: Detecting Malware Infection Through IDS-Driven DialogCorrelation. In USENIX Security Symp., 2006.
[18] G. Gu, J. Zhang, and W. Lee. BotSniffer: Detecting Botnet Com-mand and Control Channels in Network Traffic. In Symp. Net-work & Distributed System Security (NDSS), 2008.
[19] T. Holz, M. Steiner, F. Dahl, E. Biersack, and F. C. Freiling.Measurements and Mitigation of Peer-to-Peer-based Botnets: ACase Study on Storm Worm. In Usenix Workshop Large-ScaleExploits & Emergent Threats (LEET), 2008.
[20] International Secure Systems Lab. Anubis: Analyzing UnknownBinaries. http://anubis.iseclab.org, 2011.
[21] G. Jacob, E. Filiol, and H. Debar. Functional polymorphic en-gines: formalisation, implementation and use cases. Journal inComputer Virology, 5(3):247–261, 2009.
[22] J. P. John, A. Moshchuk, S. D. Gribble, and A. Krishnamurthy.Studying Spamming Botnets Using Botlab. In USENIX Symp.Networked Systems Design & Implementation (NSDI), 2009.
[23] A. Kalafut, A. Acharya, and M. Gupta. A Study of Malwarein Peer-to-Peer Networks. In ACM SIGCOMM Conf. InternetMeasurement, 2006.
[24] G. Karypis. CLUTO - A Clustering Toolkit. Technical Report02-017, University of Minnesota, 2003.
[25] H.-A. Kim and B. Karp. Autograph: Toward Automated, Dis-tributed Worm Signature Detection. In USENIX Security Symp.,2004.
[26] C. Kolbitsch, P. Milani Comparetti, C. Kruegel, E. Kirda,X. Zhou, and X. Wang. Effective and Efficient Malware De-tection at the End Host. In USENIX Security Symp., 2009.
[27] C. Kreibich and J. Crowcroft. Honeycomb: Creating IntrusionDetection Signatures Using Honeypots. ACM SIGCOMM Com-puter Communication Review, 34(1), 2004.
[28] W. Lee, S. J. Stolfo, and K. W. Mok. A Data Mining Frameworkfor Building Intrusion Detection Models. In IEEE Symp. Security& Privacy, 1999.
[29] Z. Li, M. Sanghi, Y. Chen, M.-Y. Kao, and B. Chavez. Hamsa:Fast Signature Generation for Zero-day PolymorphicWorms withProvable Attack Resilience. In IEEE Symp. Security & Privacy,2006.
[30] A. Moser, C. Kruegel, and E. Kirda. Exploring Multiple Exe-cution Paths for Malware Analysis. In IEEE Symp. Security &Privacy, 2007.
[31] J. Newsom, B. Karp, and D. Song. Polygraph: AutomaticallyGenerating Signatures for Polymorphic Worms. In IEEE Symp.Security & Privacy, 2005.
[32] S. Peisert, M. Bishop, S. Karin, and K. Marzullo. Analysis ofComputer Intrusions Using Sequences of Function Calls. IEEETrans. Dependable Secur. Comput., 4(2), 2007.

[33] R. Perdisci, D. Dagon, W. Lee, P. Fogla, and M. I. Sharif. Mis-leading worm signature generators using deliberate noise injec-tion. In IEEE Symp. Security & Privacy, 2006.
[34] R. Perdisci, W. Lee, and N. Feamster. Behavioral Clusteringof HTTP-based Malware and Signature Generation Using Ma-licious Network Traces. In USENIX Symp. Networked SystemsDesign & Implementation (NSDI), 2010.
[35] P. Porras, H. Saıdi, and V. Yegneswaran. A Foray into ConfickersLogic and Rendezvous Points. In Usenix Workshop Large-ScaleExploits & Emergent Threats (LEET), 2009.
[36] N. Provos, P. Mavrommatis, M. A. Rajab, and F. Monrose. AllYour iFRAMEs Point to Us. In USENIX Security Symp., 2008.
[37] M. Rajab, J. Zarfoss, F. Monrose, and A. Terzis. A MultifacetedApproach to Understanding the Botnet Phenomenon. In InternetMeasurement Conference (IMC), 2006.
[38] E. J. Schwartz, T. Avgerinos, and D. Brumley. All You EverWanted to Know about Dynamic Taint Analysis and ForwardSymbolic Execution (but Might Have Been Afraid to Ask). InIEEE Symp. Security & Privacy, 2010.
[39] S. Singh, C. Estan, G. Varghese, and S. Savage. AutomatedWorm Fingerprinting. In USENIX Symp. Operating Systems De-sign & Implementation (OSDI), 2004.
[40] D. Song, D. Brumley, H. Yin, J. Caballero, I. Jager, M. G. Kang,Z. Liang, J. Newsome, P. Poosankam, and P. Saxena. BitBlaze:A New Approach to Computer Security via Binary Analysis. InInt. Conf. Information Systems Security (ICISS), 2008.
[41] E. Stinson and J. C. Mitchell. Characterizing Bots’ Remote Con-trol Behavior. In Conf. Detection of Intrusions and Malware &Vulnerability Assessment (DIMVA), 2007.
[42] B. Stone-Gross, A. Moser, C. Kruegel, and E. Kirda. FIRE: FInd-ing Rogue nEtworks. In Annual Computer Security ApplicationsConf. (ACSAC), 2009.
[43] P. Szor. The Art of Computer Virus Research and Defense. Ad-dison Wesley, 2005.
[44] C. Willems, T. Holz, and F. Freiling. CWSandbox: TowardsAutomated Dynamic Binary Analysis. IEEE Security & Privacy,5(2), 2007.
[45] P. Wurzinger, L. Bilge, T. Holz, J. Gobel, C. Kruegel, andE. Kirda. Automatically generating models for botnet detection.In European Symp. Research in Computer Security (ESORICS),2009.
[46] X. Yan, H. Cheng, J. Han, and P. S. Yu. Mining SignificantGraph Patterns by Leap Search. In ACM SIGMOD Int. Conf.Management of Data, 2008.
[47] X. Yan and J. Han. gSpan: Graph-Based Substructure PatternMining. In Int. Conf. Data Mining (ICDM), 2002.
[48] X. Yan and J. Han. CloseGraph: mining closed frequent graphpatterns. In ACM SIGKDD Int. Conf. Knowledge Discovery &Data Mining (KDD), 2003.
[49] T.-F. Yen and M. K. Reiter. Traffic Aggregation for MalwareDetection. In Conf. Detection of Intrusions and Malware, & Vul-nerability Assessment (DIMVA), 2008.
[50] Y. Zhao and G. Karypis. Evaluation of hierarchical clusteringalgorithms for document datasets. In ACM Conf. Information &Knowledge Management (CIKM), 2002.
A Graph Labeling and AbstractionNodes and edges that are inserted into the behaviorgraph are augmented with additional labels that capturemore information about the nature of the system callsand the dependencies between nodes. In the following,we describe this labeling in greater detail. For edges,
a label stores the names of the input and output argu-ments, respectively, of the system calls that are con-nected through a data dependency. In case of a node,the label stores the system call name and some optionalinformation that depends on the specific type of call.
As shown in Table 1, the additional information cancorrespond to the type of the resource (files, registrykeys, ...) that a system call operates on as well as flags(such as mode or permission bits for file operations).Note that some information is only stored as comments;this information is ignored for the template generationand matching, but is saved for a human analyst whomight want to examine a template.
Operations File Registry NetworkLabel Location, Type (Table 2), Key name, Port
Access, Attributes, Value nameCreateDisposition
Comment File name IP address
Table 1: Selected information for labels and comments.
One important additional piece of information storedfor system calls that manipulate files and registry keys isthe name of these files and keys. However, for these re-source names, it is not desirable to use the actual string.The reason is that labels are taken into account duringthe matching process, and two nodes are considered thesame only when their labels match. Thus, some type ofabstraction is necessary for labels that represent resourcenames, otherwise, graphs become too specific.
In the case of files, the name string is split into threeparts: the path representing the location of the file, theshort name of the file and its extension. Table 2 showshow the paths, short names and extensions are mappedto several generic classes of location and type, that arethen used for the file name label. Similarly, the registrykey names are split into two parts: the location of the keyand its short name. The location is first normalized usingthe standard registry abbreviations (HKLM, HKU, HKCU,HKCR). The short key name is then confronted to generictypes (number, path, url). If the name does not complywith any format, but still shows a high number of simi-lar close variations, a generic type random is attributed.Additional examples of this abstraction process can beobserved in the examples of template of the next section.
B Template ExamplesWe manually examined C&C templates to determinewhether they capture activity that a human analyst wouldconsider malicious. We now present two examples thatwere automatically generated by JACKSTRAWS.
Figure 4 shows a template we extracted from botsthat use a proprietary, binary protocol for communicat-ing with the C&C server. The behavior corresponds tosome kind of information leakage: the samples query the

Location File Path Type ExtensionInWindowsDirectory\ \Windows\ IsExecutable *.exeInSystemDirectory\ \Windows\System*\ IsDynamicLibrary *.dllInDocumentDirectory\ \Documents and Settings\ IsDriver *.sys, *.drvInStartupDirectory\ \Documents and Settings\*\Startup\ IsConfiguration *.ini, *.cfgInTemporaryDirectory\ \Documents and Settings\*\Local Settings\Temp\ IsWebPage *.htm, *.php, *.xmlInInternetDirectory\ \Documents and Settings\*\Local Settings\Temporary Internet Files\ IsScript *.js, *.vbsInProgramDirectory\ \Program Files\ IsCookie \Cookies\*@*.txt
IsDevice \Device\IsNetworkDevice \Device\AfdEndPoint
Table 2: File abstraction based on location and type.
systemcall: recv
network: connect
port: 443
#ip=193.23.126.55#ip=94.75.255.138
arg: ip=buf
systemcall: NtCreateFile
Filename: inProgramDirectory\isExecutableDesiredAccess: FileReadAttributes
Attributes: AttributeNormalCreateDisposition: FileSupersede
#Filename=\??\C:\Program Files\temp\ldr.exe
arg: ObjectAttributes=buf
systemcall: NtCreateFile
Filename: inProgramDirectory\isExecutableDesiredAccess: FileReadAttributes | FileWriteAttributes
Attributes: AttributeNormalCreateDisposition: FileSupersede
#Filename=\??\C:\Program Files\temp\ldr.exe
arg: ObjectAttributes=buf
network: recv
Collapse: isMultiple
arg: Socket=Socket
systemcall: NtAllocateVirtualMemory
*: *
arg: ObjectAttributes=RegionSize
systemcall: NtDeviceIoControlFile
*: *
arg: InputBuffer=buf
systemcall: NtWriteFile
*: *
arg: Buffer=buf arg: Length=buf
systemcall: NtSetInformationFile
Collapse: isMultiple
arg: FileInformation=buf
process: start
arg: buf=buf
arg: FileHandle=FileHandle
arg: FileHandle=FileHandle
Figure 5: Template that describes the download and execute functionality of a bot: an executable file is created, itscontent is downloaded from the network, decoded, written to disk, its information is modified before being executed.In the NtCreateFile node, the file name ldr.exe is only mentioned as a comment. Comments help a human analystwhen looking at a template, but they are ignored by the matching.
network: send
systemcall: NtQueryValueKey
Valuename: ComputerName
arg: buf=KeyValueInformation
systemcall: NtOpenKey
Keyname: hklm\system\currentcontrolset\control\computername\activecomputername
#Keyname: HKLM\System\CurrentControlSet\Control\ComputerName\ActiveComputerName
arg: KeyHandle=KeyHandle
systemcall: NtOpenKey
Keyname: hklm\system\currentcontrolset\control\computername
#Keyname: \Registry\Machine\System\CurrentControlSet\Control\ComputerName
arg: ObjectAttributes=KeyHandle
network: connect
port: *
Socket=Socket
Figure 4: Template that describes leaking of sensitivedata. Darker nodes constitute the template core, whereaslighter ones are optional.
registry for the computer name and send this informationvia the network to a server. We consider this a maliciousactivity, which is often used by bots to generate a uniqueidentifier for an infected machine. In the network trafficitself this activity cannot be easily identified, since thesamples use their own protocol.
As another example, consider the template shown inFigure 5. This template corresponds to the download &execute behavior, i.e., data is downloaded from the net-work, written to disk, and then executed. The templatedescribes this specific behavior in a generic way.