j251 fy 01 1p genfund - lausd.k12.ca.us angeles unified school district los angeles county ......
TRANSCRIPT
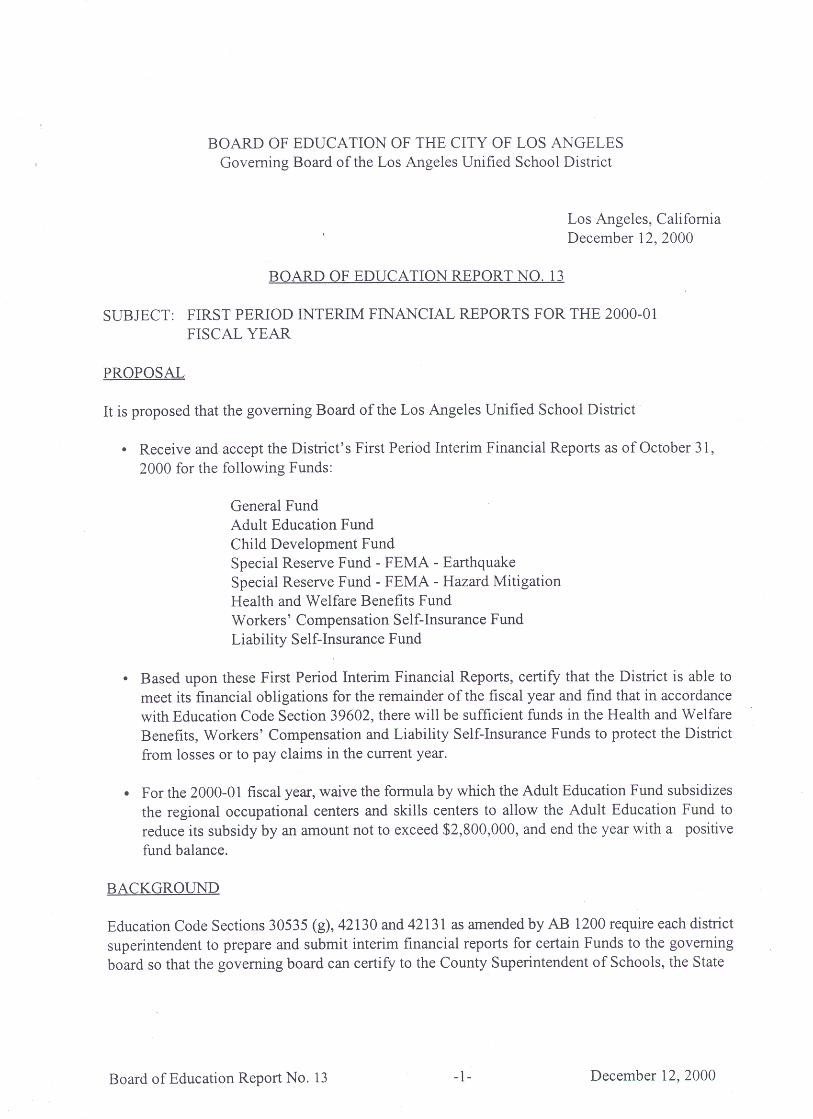


X First Interim 2000-01 INTERIM REPORT 19 | 64733 | J-251
Second Interim GENERAL FUND A CALIFORNIASUMMARY DEPARTMENT OF EDUCATION
Third Interim - End of Year Projection Form J-251 (Rev 01/95) REVENUES, EXPENDITURES AND CHANGES
IN FUND BALANCE
LOS ANGELES UNIFIED School District LOS ANGELES County=============================================================================================================================
Summary - Unrestricted/Restricted Original Board Approved Actuals Projected Difference % Diff Account Budget Operating Budget To Date Yr Totals (Col. B & D) (E / B)
Description Codes (A) (B) (C) (D) (E) (F)=============================================================================================================================
A. REVENUES
1) Revenue Limit Sources 8010-8099 + 3,051,244,919 + 3,051,244,919 + 785,013,456 + 3,063,180,266 11,935,347 0.39%
2) Federal Revenues 8100-8299 + 507,393,949 + 507,393,949 + 22,744,650 + 411,227,617 (96,166,332) -18.95%
3) Other State Revenues 8300-8599 + 1,985,969,035 + 1,986,369,035 + 206,975,707 + 1,833,297,972 (153,071,063) -7.71%
4) Other Local Revenues 8600-8799 + 85,437,955 + 79,673,244 + 15,696,284 + 97,409,249 17,736,005 22.26%
5) TOTAL, REVENUES = 5,630,045,858 = 5,624,681,147 = 1,030,430,097 = 5,405,115,104
=================================================================================================B. EXPENDITURES
1) Certificated Salaries 1000-1999 + 2,500,943,237 + 2,463,666,088 + 556,411,073 + 2,480,790,438 (17,124,350) -0.70%
2) Classified Salaries 2000-2999 + 729,699,698 + 741,910,430 + 216,601,136 + 786,856,023 (44,945,593) -6.06%
3) Employee Benefits 3000-3999 + 765,942,194 + 751,014,918 + 74,690,223 + 761,702,425 (10,687,507) -1.42%
4) Books and Supplies 4000-4999 + 481,301,938 + 498,783,681 + 69,028,498 + 372,988,203 125,795,478 25.22%
5) Services, Other Operating Expenses 5000-5999 + 540,213,500 + 556,358,385 + 80,774,060 + 510,157,603 46,200,782 8.30%
6) Capital Outlay 6000-6599 + 152,734,513 + 160,258,787 + 25,606,651 + 140,073,991 20,184,796 12.60%
7) Other Outgo 7100-7299 + 711,990,506 + 694,694,633 + 11,900,898 + 369,193,906 325,500,727 46.86%
8) Direct Support/Indirect Costs 7300-7399 + (5,527,166) + 5,244,959 + (97,403) + (5,280,716) 10,525,675 200.68%
9) TOTAL, EXPENDITURES = 5,877,298,420 = 5,871,931,881 = 1,034,915,136 = 5,416,481,873
==================================================================================================================================================================================================C. EXCESS (DEFICIENCY) OF REVENUES
OVER EXPENDITURES BEFORE OTHER FINANCING SOURCES AND USES (A5 - B9)= (247,252,562) = (247,250,734) = (4,485,039) = (11,366,769)
==================================================================================================================================================================================================D. OTHER FINANCING SOURCES/USES
1) Interfund Transfers a) Transfers In 8910-8929 + 0 + 0 + 0 + 0 0 0.00%
b) Transfers Out 7610-7629 - 254,099,515 - 254,099,515 - 21,054,941 - 270,549,446 (16,449,931) -6.47%
2) Other Sources/Uses a) Sources 8930-8979 + 160,000,000 + 160,000,000 + 0 + 170,482,627 10,482,627 6.55%
b) Uses 7630-7699 - 8,000,000 - 8,000,000 - 2,623,537 - 14,600,000 (6,600,000) -82.50%
3) Contributions to Restricted Programs 8980-8999 + 0 + 0 + 0 + 0 0 0.00%
4) TOTAL, OTHER FINANCING SOURCES/USES= (102,099,515) = (102,099,515) = (23,678,478) = (114,666,819)
=================================================================================================
12/08/00 01:36 PM
2000-01 INTERIM REPORT Form J-251 Page 2 GENERAL FUND
SUMMARY A REVENUES, EXPENDITURES AND CHANGES
IN FUND BALANCE
LOS ANGELES UNIFIED School District (19 - 64733 ) LOS ANGELES County==============================================================================================================================
Summary - Unrestricted/Restricted Original Board Approved Actuals Projected Difference % Diff Account Budget Operating Budget To Date Yr Totals (Col. B & D) (E / B)
Description Codes (A) (B) (C) (D) (E) (F)==============================================================================================================================E. NET INCREASE (DECREASE) IN FUND
BALANCE ( C + D4 ) = (349,352,077) = (349,350,249) = (28,163,517) = (126,033,588)
==================================================================================================================================================================================================F. FUND BALANCE, RESERVES
1) Beginning Balance a) As of July 1-Estimated + 600,686,767 + 600,686,767 + xxxxxxxxxxxxxxx + 600,686,767
b) Unaudited Actual Adj + 0 + 0 + xxxxxxxxxxxxxxx + 5,823,350 5,823,350 0.00%
c) As of July 1-Unaudited 9791 = 600,686,767 = 600,686,767 = xxxxxxxxxxxxxxx = 606,510,117
d) Audit Adj/Restatement 9792 - 9793 + 0 + 0 + xxxxxxxxxxxxxxx + (641,908) (641,908) 0.00%
e) Net Beginning Balance = 600,686,767 = 600,686,767 = xxxxxxxxxxxxxxx = 605,868,209
2) Ending Balance, June 30 ( E + F 1e ) = 251,334,690 = 251,336,518 = xxxxxxxxxxxxxxx = 479,834,621
================================================================================================= =================================================================================================
Components of Ending Fund Balance a) Reserved Amounts Revolving Cash 9611 - 2,571,514 - 2,517,266 - xxxxxxxxxxxxxxx - 2,547,775 (30,509) -1.21%
Stores 9612 - 9,322,953 - 9,322,953 - xxxxxxxxxxxxxxx - 9,322,953 0 0.00%
Prepaid Expenditures 9613 - 1,531,569 - 1,478,146 - xxxxxxxxxxxxxxx - 1,556,005 (77,859) -5.27%
Other 9619 - 0 - 407,328 - xxxxxxxxxxxxxxx - 407,328 0 0.00%
General Reserve (EC 42124) 9630 - 300,657 - 1,000 - xxxxxxxxxxxxxxx - 681,623 (680,623) -68062.30%
Legally Restricted Balances 9640 - xxxxxxxxxxxxxxxx - xxxxxxxxxxxxxxxx - xxxxxxxxxxxxxxx - 227,933,744 (227,933,744) 0.00%
b) Designated Amounts Designated for Economic Uncertainties 9710 - 61,600,000 - 61,600,000 - xxxxxxxxxxxxxxx - 76,100,000 (14,500,000) -23.54% Designated for 9720-9789
Potential Liab - 14,500,000 - 14,500,000 - xxxxxxxxxxxxxxx - 0 14,500,000 100.00%
Non-reimb. Earthqk Ex - 3,479,316 - 3,479,316 - xxxxxxxxxxxxxxx - 3,479,316 0 0.00%
Prog Aug/Compensation - 146,000,000 - 146,000,000 - xxxxxxxxxxxxxxx - 0 146,000,000 100.00%
Escutia Match - 9,900,000 - 9,900,000 - xxxxxxxxxxxxxxx - 0 9,900,000 100.00%
Opening of New Schools - 2,105,407 - 2,105,407 - xxxxxxxxxxxxxxx - 2,105,407 0 0.00%
Tuition for Non-Resident - 23,274 - 23,274 - xxxxxxxxxxxxxxx - 23,274 0 0.00%
Contingencies - 0 - 1,828 - xxxxxxxxxxxxxxx - 1,828 0 0.00%
Carryovers - 0 - 0 - xxxxxxxxxxxxxxx - 126,262,844 (126,262,844) 0.00%
Charter Carryovers - 0 - 0 - xxxxxxxxxxxxxxx 14,027,861
c) Undesignated Amounts 9790 = xxxxxxxxxxxxxxx = xxxxxxxxxxxxxxx = xxxxxxxxxxxxxxx = 15,384,663 d) Unappropriated Amounts 9790 = 0 = 0 = xxxxxxxxxxxxxxx = xxxxxxxxxxxxxxxxx
=================================================================================================
12/08/00 01:36 PM

2000-01 INTERIM REPORT Form J-251 Page 3
GENERAL FUND-REGULAR PROGRAM
SUMMARY - UNRESTRICTED/RESTRICTED B
REVENUES, EXPENDITURES AND CHANGES IN FUND BALANCE
LOS ANGELES UNIFIED School District (19 - 64733 ) LOS ANGELES County=============================================================================================================================
Summary - Regular - Unrestricted/Restricted
Original Board Approved Actuals Projected Difference % Diff Account Budget Operating Budget To Date Yr Totals (Col. B & D) (E / B)
Description Codes (A) (B) (C) (D) (E) (F)=============================================================================================================================
A. REVENUES
1) Revenue Limit Sources 8010-8099 + 3,031,316,204 + 3,031,316,204 + 779,831,991 + 3,043,251,551 11,935,347 0.39%
2) Federal Revenues 8100-8299 + 74,243,892 + 74,243,892 + 4,848,124 + 71,600,730 (2,643,162) -3.56%
3) Other State Revenues 8300-8599 + 1,636,037,589 + 1,636,437,589 + 150,560,842 + 1,637,849,367 1,411,778 0.09%
4) Other Local Revenues 8600-8799 + 64,137,557 + 58,372,846 + 1,207,334 + 80,930,153 22,557,307 38.64%
5) TOTAL, REVENUES = 4,805,735,242 = 4,800,370,531 = 936,448,291 = 4,833,631,801
================================================================================================= B. EXPENDITURES
1) Certificated Salaries 1000-1999 + 2,237,458,427 + 2,205,060,250 + 506,155,573 + 2,250,675,292 (45,615,042) -2.07%
2) Classified Salaries 2000-2999 + 632,364,433 + 637,987,623 + 197,287,552 + 706,779,826 (68,792,203) -10.78%
3) Employee Benefits 3000-3999 + 697,542,465 + 696,837,484 + 69,132,973 + 713,715,638 (16,878,154) -2.42%
4) Books and Supplies 4000-4999 + 353,381,974 + 372,845,320 + 58,607,751 + 268,911,705 103,933,615 27.88%
5) Services, Other Operating Expenses 5000-5999 + 463,112,957 + 483,126,537 + 75,633,355 + 453,906,651 29,219,886 6.05%
6) Capital Outlay 6000-6599 + 91,640,227 + 95,648,314 + 18,924,070 + 107,639,895 (11,991,581) -12.54%
7) Other Outgo 7100-7299 + 601,674,692 + 580,303,108 + 11,900,898 + 367,973,985 212,329,123 36.59%
8) Direct Support/Indirect Costs 7300-7399 + (24,187,371) + (24,187,371) + (108,329) + (24,604,422) 417,051 -1.72%
9) TOTAL, EXPENDITURES = 5,052,987,804 = 5,047,621,265 = 937,533,843 = 4,844,998,570
================================================================================================= ================================================================================================= C. EXCESS (DEFICIENCY) OF REVENUES
OVER EXPENDITURES BEFORE OTHER FINANCING SOURCES AND USES (A5 - B9)= (247,252,562) = (247,250,734) = (1,085,552) = (11,366,769)
================================================================================================= ================================================================================================= D. OTHER FINANCING SOURCES/USES
1) Interfund Transfers a) Transfers In 8910-8929 + 0 + 0 + 0 + 0 0 0.00%
b) Transfers Out 7610-7629 - 254,099,515 - 254,099,515 - 21,054,941 - 270,549,446 (16,449,931) -6.47%
2) Other Sources/Uses a) Sources 8930-8979 + 160,000,000 + 160,000,000 + 0 + 170,482,627 10,482,627 6.55%
b) Uses 7630-7699 - 8,000,000 - 8,000,000 - 2,623,537 - 14,600,000 (6,600,000) -82.50%
3) Contributions to Restricted Programs 8980-8999 + 0 + 0 + 0 + 0 0 0.00%
4) TOTAL, OTHER FINANCING SOURCES/USES= (102,099,515) = (102,099,515) = (23,678,478) = (114,666,819)
=================================================================================================
12/08/00 01:36 PM

2000-01 INTERIM REPORT Form J-251 Page 4
GENERAL FUND-REGULAR PROGRAM B SUMMARY - UNRESTRICTED/RESTRICTED
REVENUES, EXPENDITURES AND CHANGES IN FUND BALANCE
LOS ANGELES UNIFIED School District (19 - 64733 ) LOS ANGELES County=============================================================================================================================
Summary - Regular - Unrestricted/Restricted
Original Board Approved Actuals Projected Difference % Diff Account Budget Operating Budget To Date Yr Totals (Col. B & D) (E / B)
Description Codes (A) (B) (C) (D) (E) (F)=============================================================================================================================E. NET INCREASE (DECREASE) IN FUND
BALANCE ( C + D4 ) = (349,352,077) = (349,350,249) = (24,764,030) = (126,033,588)
================================================================================================= ================================================================================================= F. FUND BALANCE, RESERVES
1) Beginning Balance a) As of July 1-Estimated + 600,686,767 + 600,686,767 + xxxxxxxxxxxxxxx + 600,686,767
b) Unaudited Actual Adj + 0 + 0 + xxxxxxxxxxxxxxx + 5,823,350 5,823,350 0.00%
c) As of July 1-Unaudited 9791 = 600,686,767 = 600,686,767 = xxxxxxxxxxxxxxx = 606,510,117
d) Audit Adj/Restatement 9792 - 9793 + 0 + 0 + xxxxxxxxxxxxxxx + (641,908) (641,908) 0.00%
e) Net Beginning Balance = 600,686,767 = 600,686,767 = xxxxxxxxxxxxxxx = 605,868,209
2) Ending Balance, June 30 ( E + F1e ) = 251,334,690 = 251,336,518 = xxxxxxxxxxxxxxx = 479,834,621
================================================================================================= =================================================================================================
Components of Ending Fund Balance a) Reserved Amounts Revolving Cash 9611 - 2,571,514 - 2,517,266 - xxxxxxxxxxxxxxx - 2,547,775 (30,509) -1.21%
Stores 9612 - 9,322,953 - 9,322,953 - xxxxxxxxxxxxxxx - 9,322,953 0 0.00%
Prepaid Expenditures 9613 - 1,531,569 - 1,478,146 - xxxxxxxxxxxxxxx - 1,556,005 (77,859) -5.27%
Other 9619 - 0 - 407,328 - xxxxxxxxxxxxxxx - 407,328 0 0.00%
General Reserve (EC 42124) 9630 - 300,657 - 1,000 - xxxxxxxxxxxxxxx - 681,623 (680,623) -68062.30%
Legally Restricted Balances 9640 - 0 - 0 - xxxxxxxxxxxxxxx - 227,933,744 (227,933,744) 0.00%
b) Designated Amounts Designated for Economic Uncertainties 9710 - 61,600,000 - 61,600,000 - xxxxxxxxxxxxxxx - 76,100,000 (14,500,000) -23.54% Designated for 9720-9789
Potential Liab - 14,500,000 - 14,500,000 - xxxxxxxxxxxxxxx - 0 14,500,000 100.00%
Non-reimb. Earthqk Ex - 3,479,316 - 3,479,316 - xxxxxxxxxxxxxxx - 3,479,316 0 0.00%
Prog Aug/Compensation - 146,000,000 - 146,000,000 - xxxxxxxxxxxxxxx - 0 146,000,000 100.00%
Escutia Match - 9,900,000 - 9,900,000 - xxxxxxxxxxxxxxx - 0 9,900,000 100.00%
Opening of New Schools - 2,105,407 - 2,105,407 - xxxxxxxxxxxxxxx - 2,105,407 0 0.00%
Tuition for Non-Resident - 23,274 - 23,274 - xxxxxxxxxxxxxxx - 23,274 0 0.00%
Contingencies - 0 - 1,828 - xxxxxxxxxxxxxxx - 1,828 0 0.00%
Carryovers - 0 - 0 - xxxxxxxxxxxxxxx - 126,262,844 (126,262,844) 0.00%
Charter Carryovers - 0 - 0 xxxxxxxxxxxxxxx 14,027,861
c) Undesignated Amounts 9790 = xxxxxxxxxxxxxxxx = xxxxxxxxxxxxxxxx = xxxxxxxxxxxxxxx = 15,384,663 d) Unappropriated Amounts 9790 = 0 = 0 = xxxxxxxxxxxxxxx = xxxxxxxxxxxxxxxx
=================================================================================================
12/08/00 01:36 PM

2000-01 INTERIM REPORT Form J-251 Page 5
GENERAL FUND-REGULAR & SPECIALLY FUNDED PROGRAMS
SUMMARY - RESTRICTED C
REVENUES, EXPENDITURES AND CHANGES IN FUND BALANCE
LOS ANGELES UNIFIED School District (19 - 64733 ) LOS ANGELES County=============================================================================================================================
Summary - Restricted
Original Board Approved Actuals Projected Difference % Diff Account Budget Operating Budget To Date Yr Totals (Col. B & D) (E / B)
Description Codes (A) (B) (C) (D) (E) (F)=============================================================================================================================
A. REVENUES
1) Revenue Limit Sources 8010-8099 + 188,476,526 + 188,476,526 + 49,003,898 + 188,807,848 331,322 0.18%
2) Federal Revenues 8100-8299 + 506,121,949 + 506,121,949 + 21,032,095 + 409,954,586 (96,167,363) -19.00%
3) Other State Revenues 8300-8599 + 1,485,261,391 + 1,490,897,511 + 203,400,028 + 1,314,399,654 (176,497,857) -11.84%
4) Other Local Revenues 8600-8799 + 25,850,398 + 25,850,398 + 14,800,880 + 24,508,988 (1,341,410) -5.19%
5) TOTAL, REVENUES = 2,205,710,264 = 2,211,346,384 = 288,236,901 = 1,937,671,076
================================================================================================= B. EXPENDITURES
1) Certificated Salaries 1000-1999 + 929,356,320 + 914,602,193 + 173,957,960 + 921,639,149 (7,036,956) -0.77%
2) Classified Salaries 2000-2999 + 413,102,813 + 420,984,077 + 111,501,693 + 453,650,517 (32,666,440) -7.76%
3) Employee Benefits 3000-3999 + 313,322,751 + 299,346,085 + 28,128,331 + 297,091,587 2,254,498 0.75%
4) Books and Supplies 4000-4999 + 332,495,001 + 331,378,324 + 47,826,828 + 255,556,560 75,821,764 22.88%
5) Services, Other Operating Expenses 5000-5999 + 337,624,998 + 340,826,536 + 39,506,877 + 294,138,733 46,687,803 13.70%
6) Capital Outlay 6000-6599 + 110,641,074 + 115,203,760 + 15,479,399 + 68,815,453 46,388,307 40.27%
7) Other Outgo 7100-7299 + 294,952,825 + 305,852,798 + 4,421,537 + 25,660,167 280,192,631 91.61%
8) Direct Support/Indirect Costs 7300-7399 + 119,889,162 + 130,661,287 + 10,926 + 126,203,733 4,457,554 3.41%
9) TOTAL, EXPENDITURES = 2,851,384,944 = 2,858,855,060 = 420,833,551 = 2,442,755,899
================================================================================================= ================================================================================================= C. EXCESS (DEFICIENCY) OF REVENUES
OVER EXPENDITURES BEFORE OTHER FINANCING SOURCES AND USES (A5 - B9)= (645,674,680) = (647,508,676) = (132,596,650) = (505,084,823)
================================================================================================= ================================================================================================= D. OTHER FINANCING SOURCES/USES
1) Interfund Transfers a) Transfers In 8910-8929 + 0 + 0 + 0 + 0 0 0.00%
b) Transfers Out 7610-7629 - 210,492,255 - 218,492,255 - 8,009,033 - 256,812,525 (38,320,270) -17.54%
2) Other Sources/Uses a) Sources 8930-8979 + 160,000,000 + 160,000,000 + 0 + 170,482,627 10,482,627 6.55%
b) Uses 7630-7699 - 0 - 0 - 0 - 0 0 0.00%
3) Contributions to Restricted Programs 8980-8999 + 490,397,606 + 500,231,602 + 92,172,780 + 622,874,990 122,643,388 24.52%
4) TOTAL, OTHER FINANCING SOURCES/USES= 439,905,351 = 441,739,347 = 84,163,747 = 536,545,092
=================================================================================================
12/08/00 01:36 PM
2000-01 INTERIM REPORT Form J-251 Page 6 GENERAL FUND-REGULAR & SPECIALLY FUNDED PROGRAMS
SUMMARY - RESTRICTED C REVENUES, EXPENDITURES AND CHANGES IN FUND BALANCE
LOS ANGELES UNIFIED School District (19 - 64733 ) LOS ANGELES County=============================================================================================================================
Summary - Restricted
Original Board Approved Actuals Projected Difference % Diff Account Budget Operating Budget To Date Yr Totals (Col. B & D) (E / B)
Description Codes (A) (B) (C) (D) (E) (F)=============================================================================================================================E. NET INCREASE (DECREASE) IN FUND
BALANCE ( C + D4 ) = (205,769,329) = (205,769,329) = (48,432,903) = 31,460,269
================================================================================================= ================================================================================================= F. FUND BALANCE, RESERVES
1) Beginning Balance a) As of July 1-Estimated + 207,283,683 + 207,283,683 + xxxxxxxxxxxxxxx + 207,283,683
b) Unaudited Actual Adj + 0 + 0 + xxxxxxxxxxxxxxx + 0 0 0.00%
c) As of July 1-Unaudited 9791 = 207,283,683 = 207,283,683 = xxxxxxxxxxxxxxx = 207,283,683
d) Audit Adj/Restatement 9792 - 9793 + 0 + 0 + xxxxxxxxxxxxxxx + (12,500) (12,500) 0.00%
e) Net Beginning Balance = 207,283,683 = 207,283,683 = xxxxxxxxxxxxxxx = 207,271,183
2) Ending Balance, June 30 ( E + F 1e ) = 1,514,354 = 1,514,354 = xxxxxxxxxxxxxxx = 238,731,452
================================================================================================= =================================================================================================
Components of Ending Fund Balance a) Reserved Amounts Revolving Cash 9611 - 0 - 0 - xxxxxxxxxxxxxxx - 0 xxxxxxxxxxxxxxx xxxxxxxxxxxxxxxx
Stores 9612 - 336,842 - 336,842 - xxxxxxxxxxxxxxx - 336,842 0 0.00%
Prepaid Expenditures 9613 - 1,177,512 - 1,177,512 - xxxxxxxxxxxxxxx - 1,177,512 0 0.00%
Other 9619 - 0 - 0 - xxxxxxxxxxxxxxx - 0 0 0.00%
General Reserve (EC 42124) 9630 - xxxxxxxxxxxxxxxx - xxxxxxxxxxxxxxxx - xxxxxxxxxxxxxxx - xxxxxxxxxxxxxxxx xxxxxxxxxxxxxxx xxxxxxxxxxxxxxxx
Legally Restricted Balances 9640 - xxxxxxxxxxxxxxxx - xxxxxxxxxxxxxxxx - xxxxxxxxxxxxxxx - 227,933,744 xxxxxxxxxxxxxxx xxxxxxxxxxxxxxxx
b) Designated Amounts Designated for Economic Uncertainties 9710 - 0 - 0 - xxxxxxxxxxxxxxx - 0 0 0.00% Designated for 9720-9789
Potential Liab - 0 - 0 - xxxxxxxxxxxxxxx - 0 0 0.00%
Non-reimb. Earthqk Ex - 0 - 0 - xxxxxxxxxxxxxxx - 0 0 0.00%
Prog Aug/Compensation - 0 - 0 - xxxxxxxxxxxxxxx - 0 0 0.00%
Escutia Match - 0 - 0 - xxxxxxxxxxxxxxx - 0 0 0.00%
Opening of New Schools - 0 - 0 - xxxxxxxxxxxxxxx - 0 0 0.00%
Tuition for Non-Resident - 0 - 0 - xxxxxxxxxxxxxxx - 0 0 0.00%
Contingencies - 0 - 0 - xxxxxxxxxxxxxxx - 0 0 0.00%
Carryovers - 0 - 0 - xxxxxxxxxxxxxxx - 9,283,354 (9,283,354) 0.00%
- xxxxxxxxxxxxxxx
c) Undesignated Amounts 9790 = xxxxxxxxxxxxxxxx = xxxxxxxxxxxxxxxx = xxxxxxxxxxxxxxx = 0 d) Unappropriated Amounts 9790 = 0 = 0 = xxxxxxxxxxxxxxx = xxxxxxxxxxxxxxxx
=================================================================================================
12/08/00 01:36 PM
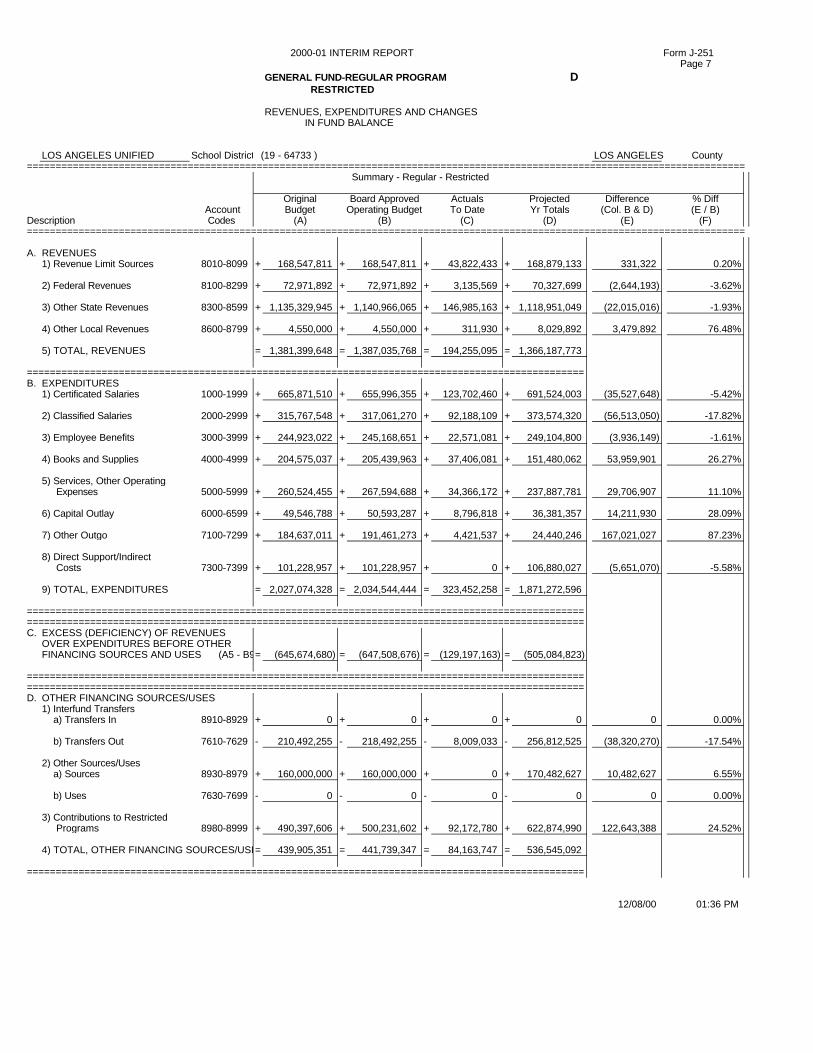
2000-01 INTERIM REPORT Form J-251 Page 7
GENERAL FUND-REGULAR PROGRAM D RESTRICTED
REVENUES, EXPENDITURES AND CHANGES IN FUND BALANCE
LOS ANGELES UNIFIED School District (19 - 64733 ) LOS ANGELES County=============================================================================================================================
Summary - Regular - Restricted
Original Board Approved Actuals Projected Difference % Diff Account Budget Operating Budget To Date Yr Totals (Col. B & D) (E / B)
Description Codes (A) (B) (C) (D) (E) (F)=============================================================================================================================
A. REVENUES
1) Revenue Limit Sources 8010-8099 + 168,547,811 + 168,547,811 + 43,822,433 + 168,879,133 331,322 0.20%
2) Federal Revenues 8100-8299 + 72,971,892 + 72,971,892 + 3,135,569 + 70,327,699 (2,644,193) -3.62%
3) Other State Revenues 8300-8599 + 1,135,329,945 + 1,140,966,065 + 146,985,163 + 1,118,951,049 (22,015,016) -1.93%
4) Other Local Revenues 8600-8799 + 4,550,000 + 4,550,000 + 311,930 + 8,029,892 3,479,892 76.48%
5) TOTAL, REVENUES = 1,381,399,648 = 1,387,035,768 = 194,255,095 = 1,366,187,773
================================================================================================= B. EXPENDITURES
1) Certificated Salaries 1000-1999 + 665,871,510 + 655,996,355 + 123,702,460 + 691,524,003 (35,527,648) -5.42%
2) Classified Salaries 2000-2999 + 315,767,548 + 317,061,270 + 92,188,109 + 373,574,320 (56,513,050) -17.82%
3) Employee Benefits 3000-3999 + 244,923,022 + 245,168,651 + 22,571,081 + 249,104,800 (3,936,149) -1.61%
4) Books and Supplies 4000-4999 + 204,575,037 + 205,439,963 + 37,406,081 + 151,480,062 53,959,901 26.27%
5) Services, Other Operating Expenses 5000-5999 + 260,524,455 + 267,594,688 + 34,366,172 + 237,887,781 29,706,907 11.10%
6) Capital Outlay 6000-6599 + 49,546,788 + 50,593,287 + 8,796,818 + 36,381,357 14,211,930 28.09%
7) Other Outgo 7100-7299 + 184,637,011 + 191,461,273 + 4,421,537 + 24,440,246 167,021,027 87.23%
8) Direct Support/Indirect Costs 7300-7399 + 101,228,957 + 101,228,957 + 0 + 106,880,027 (5,651,070) -5.58%
9) TOTAL, EXPENDITURES = 2,027,074,328 = 2,034,544,444 = 323,452,258 = 1,871,272,596
================================================================================================= ================================================================================================= C. EXCESS (DEFICIENCY) OF REVENUES
OVER EXPENDITURES BEFORE OTHER FINANCING SOURCES AND USES (A5 - B9)= (645,674,680) = (647,508,676) = (129,197,163) = (505,084,823)
================================================================================================= ================================================================================================= D. OTHER FINANCING SOURCES/USES
1) Interfund Transfers a) Transfers In 8910-8929 + 0 + 0 + 0 + 0 0 0.00%
b) Transfers Out 7610-7629 - 210,492,255 - 218,492,255 - 8,009,033 - 256,812,525 (38,320,270) -17.54%
2) Other Sources/Uses a) Sources 8930-8979 + 160,000,000 + 160,000,000 + 0 + 170,482,627 10,482,627 6.55%
b) Uses 7630-7699 - 0 - 0 - 0 - 0 0 0.00%
3) Contributions to Restricted Programs 8980-8999 + 490,397,606 + 500,231,602 + 92,172,780 + 622,874,990 122,643,388 24.52%
4) TOTAL, OTHER FINANCING SOURCES/USES= 439,905,351 = 441,739,347 = 84,163,747 = 536,545,092
=================================================================================================
12/08/00 01:36 PM

2000-01 INTERIM REPORT Form J-251 Page 8 GENERAL FUND-REGULAR PROGRAM RESTRICTED D
REVENUES, EXPENDITURES AND CHANGES IN FUND BALANCE
LOS ANGELES UNIFIED School District (19 - 64733 ) LOS ANGELES County=============================================================================================================================
Summary - Regular - Restricted
Original Board Approved Actuals Projected Difference % Diff Account Budget Operating Budget To Date Yr Totals (Col. B & D) (E / B)
Description Codes (A) (B) (C) (D) (E) (F)=============================================================================================================================E. NET INCREASE (DECREASE) IN FUND
BALANCE ( C + D4 ) = (205,769,329) = (205,769,329) = (45,033,416) = 31,460,269
================================================================================================= ================================================================================================= F. FUND BALANCE, RESERVES
1) Beginning Balance a) As of July 1-Estimated + 207,283,683 + 207,283,683 + xxxxxxxxxxxxxxx + 207,283,683
b) Unaudited Actual Adj + 0 + 0 + xxxxxxxxxxxxxxx + 0 0 0.00%
c) As of July 1-Unaudited 9791 = 207,283,683 = 207,283,683 = xxxxxxxxxxxxxxx = 207,283,683
d) Audit Adj/Restatement 9792 - 9793 + 0 + 0 + xxxxxxxxxxxxxxx + (12,500) (12,500) 0.00%
e) Net Beginning Balance = 207,283,683 = 207,283,683 = xxxxxxxxxxxxxxx = 207,271,183
2) Ending Balance, June 30 ( E + F 1e ) = 1,514,354 = 1,514,354 = xxxxxxxxxxxxxxx = 238,731,452
================================================================================================= =================================================================================================
Components of Ending Fund Balance a) Reserved Amounts Revolving Cash 9611 - 0 - 0 - xxxxxxxxxxxxxxx - 0 0 0.00%
Stores 9612 - 336,842 - 336,842 - xxxxxxxxxxxxxxx - 336,842 0 0.00%
Prepaid Expenditures 9613 - 1,177,512 - 1,177,512 - xxxxxxxxxxxxxxx - 1,177,512 0 0.00%
Other 9619 - 0 - 0 - xxxxxxxxxxxxxxx - 0 0 0.00%
General Reserve (EC 42124) 9630 - 0 - 0 - xxxxxxxxxxxxxxx - 0 0 0.00%
Legally Restricted Balances 9640 - xxxxxxxxxxxxxxxx - xxxxxxxxxxxxxxxx - xxxxxxxxxxxxxxx - 227,933,744 xxxxxxxxxxxxxxx xxxxxxxxxxxxxxxx
b) Designated Amounts Designated for Economic Uncertainties 9710 - 0 - 0 - xxxxxxxxxxxxxxx - 0 0 0.00% Designated for 9720-9789
Potential Liab - 0 - 0 - xxxxxxxxxxxxxxx - 0 0 0.00%
Non-reimb. Earthqk Ex - 0 - 0 - xxxxxxxxxxxxxxx - 0 0 0.00%
Prog Aug/Compensation - 0 - 0 - xxxxxxxxxxxxxxx - 0 0 0.00%
Escutia Match - 0 - 0 - xxxxxxxxxxxxxxx - 0 0 0.00%
Opening of New Schools - 0 - 0 - xxxxxxxxxxxxxxx - 0 0 0.00%
Tuition for Non-Resident - 0 - 0 - xxxxxxxxxxxxxxx - 0 0 0.00%
Contingencies - 0 - 0 - xxxxxxxxxxxxxxx - 0 0 0.00%
Carryovers - 0 - 0 - xxxxxxxxxxxxxxx - 9,283,354 (9,283,354) 0.00%
xxxxxxxxxxxxxxxx c) Undesignated Amounts 9790 = xxxxxxxxxxxxxxxx = xxxxxxxxxxxxxxxx = xxxxxxxxxxxxxxx = 0 d) Unappropriated Amounts 9790 = 0 = 0 = xxxxxxxxxxxxxxx = xxxxxxxxxxxxxxxx
=================================================================================================
12/08/00 01:36 PM
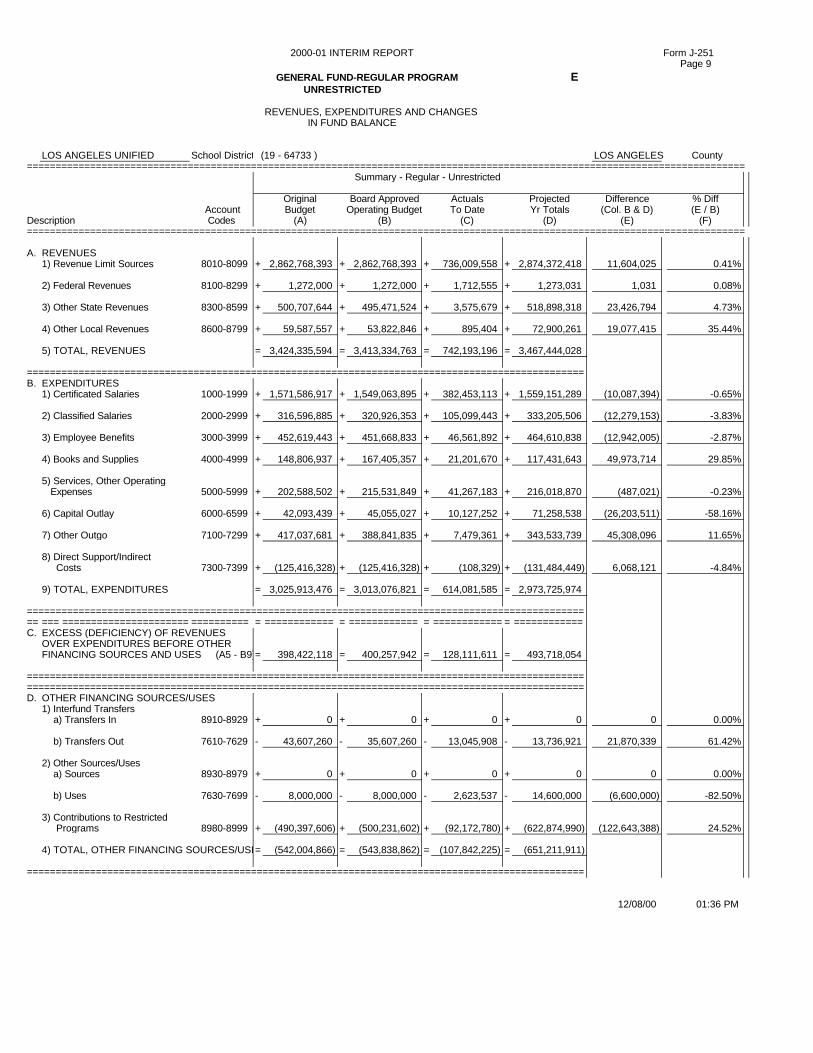
2000-01 INTERIM REPORT Form J-251 Page 9
GENERAL FUND-REGULAR PROGRAM E UNRESTRICTED
REVENUES, EXPENDITURES AND CHANGES IN FUND BALANCE
LOS ANGELES UNIFIED School District (19 - 64733 ) LOS ANGELES County=============================================================================================================================
Summary - Regular - Unrestricted
Original Board Approved Actuals Projected Difference % Diff Account Budget Operating Budget To Date Yr Totals (Col. B & D) (E / B)
Description Codes (A) (B) (C) (D) (E) (F)=============================================================================================================================
A. REVENUES
1) Revenue Limit Sources 8010-8099 + 2,862,768,393 + 2,862,768,393 + 736,009,558 + 2,874,372,418 11,604,025 0.41%
2) Federal Revenues 8100-8299 + 1,272,000 + 1,272,000 + 1,712,555 + 1,273,031 1,031 0.08%
3) Other State Revenues 8300-8599 + 500,707,644 + 495,471,524 + 3,575,679 + 518,898,318 23,426,794 4.73%
4) Other Local Revenues 8600-8799 + 59,587,557 + 53,822,846 + 895,404 + 72,900,261 19,077,415 35.44%
5) TOTAL, REVENUES = 3,424,335,594 = 3,413,334,763 = 742,193,196 = 3,467,444,028
================================================================================================= B. EXPENDITURES
1) Certificated Salaries 1000-1999 + 1,571,586,917 + 1,549,063,895 + 382,453,113 + 1,559,151,289 (10,087,394) -0.65%
2) Classified Salaries 2000-2999 + 316,596,885 + 320,926,353 + 105,099,443 + 333,205,506 (12,279,153) -3.83%
3) Employee Benefits 3000-3999 + 452,619,443 + 451,668,833 + 46,561,892 + 464,610,838 (12,942,005) -2.87%
4) Books and Supplies 4000-4999 + 148,806,937 + 167,405,357 + 21,201,670 + 117,431,643 49,973,714 29.85%
5) Services, Other Operating Expenses 5000-5999 + 202,588,502 + 215,531,849 + 41,267,183 + 216,018,870 (487,021) -0.23%
6) Capital Outlay 6000-6599 + 42,093,439 + 45,055,027 + 10,127,252 + 71,258,538 (26,203,511) -58.16%
7) Other Outgo 7100-7299 + 417,037,681 + 388,841,835 + 7,479,361 + 343,533,739 45,308,096 11.65%
8) Direct Support/Indirect Costs 7300-7399 + (125,416,328) + (125,416,328) + (108,329) + (131,484,449) 6,068,121 -4.84%
9) TOTAL, EXPENDITURES = 3,025,913,476 = 3,013,076,821 = 614,081,585 = 2,973,725,974
================================================================================================= == === ====================== ========== = ============ = ============ = ============ = ============ C. EXCESS (DEFICIENCY) OF REVENUES
OVER EXPENDITURES BEFORE OTHER FINANCING SOURCES AND USES (A5 - B9)= 398,422,118 = 400,257,942 = 128,111,611 = 493,718,054
================================================================================================= ================================================================================================= D. OTHER FINANCING SOURCES/USES
1) Interfund Transfers a) Transfers In 8910-8929 + 0 + 0 + 0 + 0 0 0.00%
b) Transfers Out 7610-7629 - 43,607,260 - 35,607,260 - 13,045,908 - 13,736,921 21,870,339 61.42%
2) Other Sources/Uses a) Sources 8930-8979 + 0 + 0 + 0 + 0 0 0.00%
b) Uses 7630-7699 - 8,000,000 - 8,000,000 - 2,623,537 - 14,600,000 (6,600,000) -82.50%
3) Contributions to Restricted Programs 8980-8999 + (490,397,606) + (500,231,602) + (92,172,780) + (622,874,990) (122,643,388) 24.52%
4) TOTAL, OTHER FINANCING SOURCES/USES= (542,004,866) = (543,838,862) = (107,842,225) = (651,211,911)
=================================================================================================
12/08/00 01:36 PM
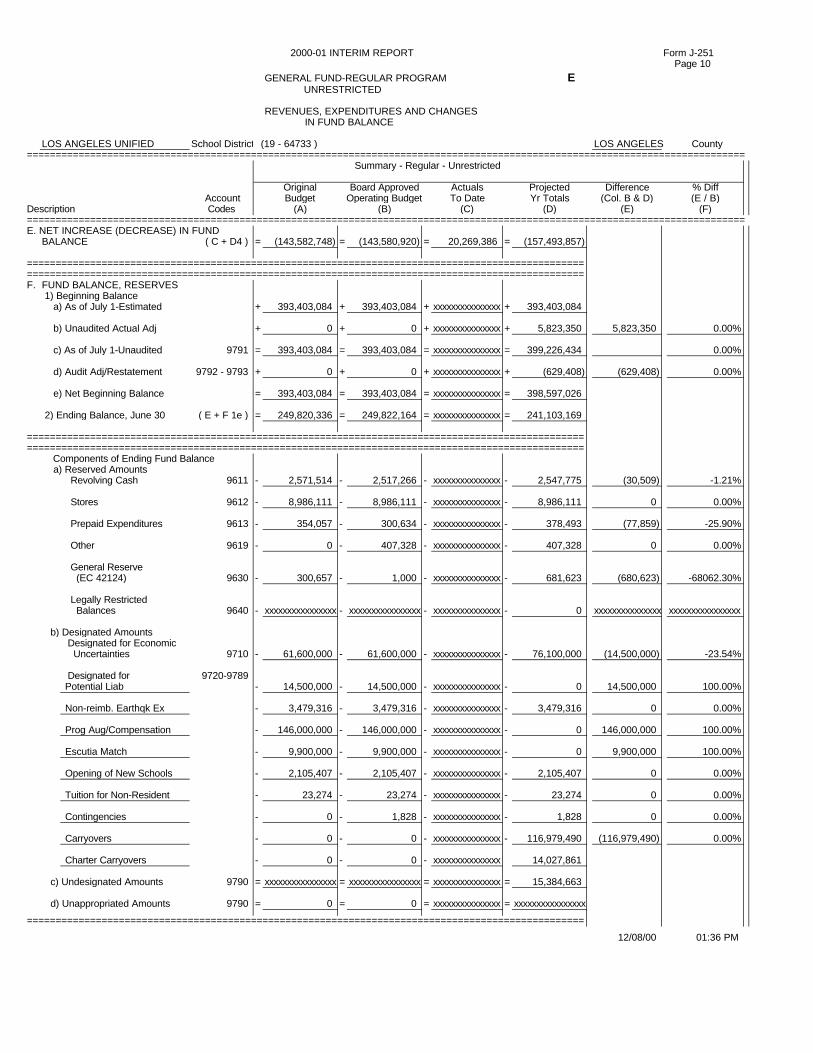
2000-01 INTERIM REPORT Form J-251 Page 10
GENERAL FUND-REGULAR PROGRAM E UNRESTRICTED
REVENUES, EXPENDITURES AND CHANGES IN FUND BALANCE
LOS ANGELES UNIFIED School District (19 - 64733 ) LOS ANGELES County=============================================================================================================================
Summary - Regular - Unrestricted
Original Board Approved Actuals Projected Difference % Diff Account Budget Operating Budget To Date Yr Totals (Col. B & D) (E / B)
Description Codes (A) (B) (C) (D) (E) (F)=============================================================================================================================E. NET INCREASE (DECREASE) IN FUND
BALANCE ( C + D4 ) = (143,582,748) = (143,580,920) = 20,269,386 = (157,493,857)
================================================================================================= ================================================================================================= F. FUND BALANCE, RESERVES
1) Beginning Balance a) As of July 1-Estimated + 393,403,084 + 393,403,084 + xxxxxxxxxxxxxxx + 393,403,084
b) Unaudited Actual Adj + 0 + 0 + xxxxxxxxxxxxxxx + 5,823,350 5,823,350 0.00%
c) As of July 1-Unaudited 9791 = 393,403,084 = 393,403,084 = xxxxxxxxxxxxxxx = 399,226,434 0.00%
d) Audit Adj/Restatement 9792 - 9793 + 0 + 0 + xxxxxxxxxxxxxxx + (629,408) (629,408) 0.00%
e) Net Beginning Balance = 393,403,084 = 393,403,084 = xxxxxxxxxxxxxxx = 398,597,026
2) Ending Balance, June 30 ( E + F 1e ) = 249,820,336 = 249,822,164 = xxxxxxxxxxxxxxx = 241,103,169
================================================================================================= =================================================================================================
Components of Ending Fund Balance a) Reserved Amounts Revolving Cash 9611 - 2,571,514 - 2,517,266 - xxxxxxxxxxxxxxx - 2,547,775 (30,509) -1.21%
Stores 9612 - 8,986,111 - 8,986,111 - xxxxxxxxxxxxxxx - 8,986,111 0 0.00%
Prepaid Expenditures 9613 - 354,057 - 300,634 - xxxxxxxxxxxxxxx - 378,493 (77,859) -25.90%
Other 9619 - 0 - 407,328 - xxxxxxxxxxxxxxx - 407,328 0 0.00%
General Reserve (EC 42124) 9630 - 300,657 - 1,000 - xxxxxxxxxxxxxxx - 681,623 (680,623) -68062.30%
Legally Restricted Balances 9640 - xxxxxxxxxxxxxxxx - xxxxxxxxxxxxxxxx - xxxxxxxxxxxxxxx - 0 xxxxxxxxxxxxxxx xxxxxxxxxxxxxxxx
b) Designated Amounts Designated for Economic Uncertainties 9710 - 61,600,000 - 61,600,000 - xxxxxxxxxxxxxxx - 76,100,000 (14,500,000) -23.54% Designated for 9720-9789
Potential Liab - 14,500,000 - 14,500,000 - xxxxxxxxxxxxxxx - 0 14,500,000 100.00%
Non-reimb. Earthqk Ex - 3,479,316 - 3,479,316 - xxxxxxxxxxxxxxx - 3,479,316 0 0.00%
Prog Aug/Compensation - 146,000,000 - 146,000,000 - xxxxxxxxxxxxxxx - 0 146,000,000 100.00%
Escutia Match - 9,900,000 - 9,900,000 - xxxxxxxxxxxxxxx - 0 9,900,000 100.00%
Opening of New Schools - 2,105,407 - 2,105,407 - xxxxxxxxxxxxxxx - 2,105,407 0 0.00%
Tuition for Non-Resident - 23,274 - 23,274 - xxxxxxxxxxxxxxx - 23,274 0 0.00%
Contingencies - 0 - 1,828 - xxxxxxxxxxxxxxx - 1,828 0 0.00%
Carryovers - 0 - 0 - xxxxxxxxxxxxxxx - 116,979,490 (116,979,490) 0.00%
Charter Carryovers - 0 - 0 - xxxxxxxxxxxxxxx 14,027,861
c) Undesignated Amounts 9790 = xxxxxxxxxxxxxxxx = xxxxxxxxxxxxxxxx = xxxxxxxxxxxxxxx = 15,384,663 d) Unappropriated Amounts 9790 = 0 = 0 = xxxxxxxxxxxxxxx = xxxxxxxxxxxxxxxx
=================================================================================================
12/08/00 01:36 PM
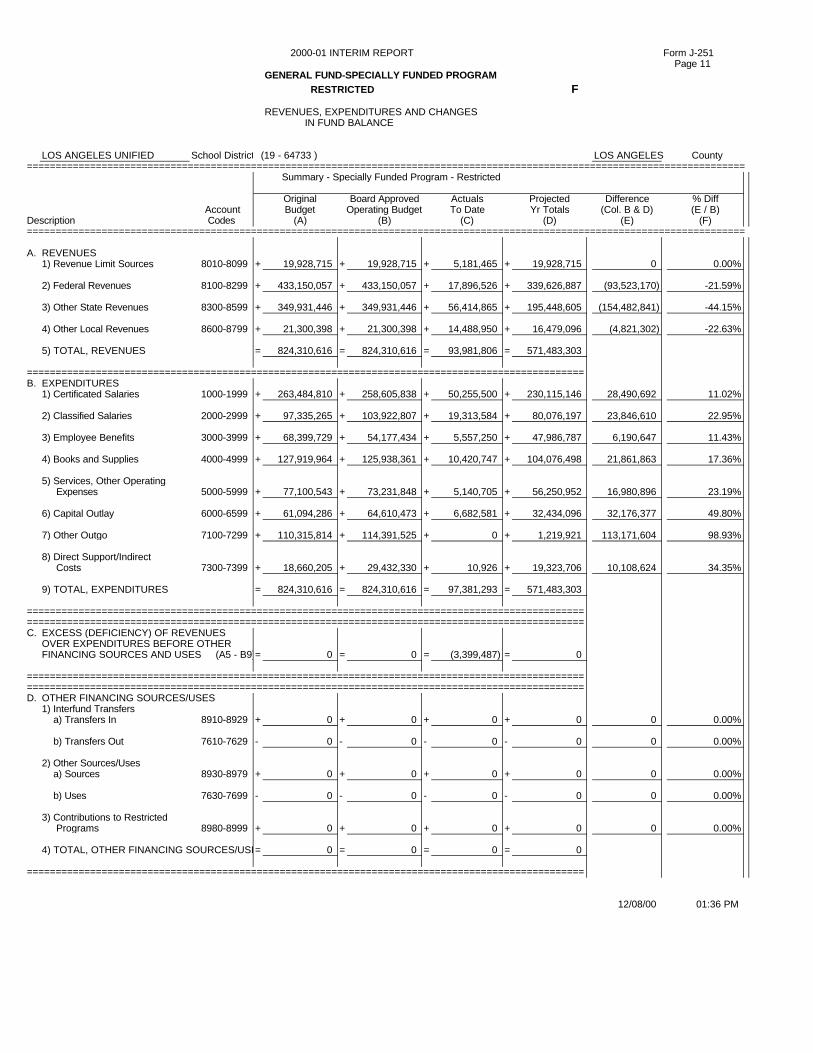
2000-01 INTERIM REPORT Form J-251 Page 11
GENERAL FUND-SPECIALLY FUNDED PROGRAM
RESTRICTED F
REVENUES, EXPENDITURES AND CHANGES IN FUND BALANCE
LOS ANGELES UNIFIED School District (19 - 64733 ) LOS ANGELES County=============================================================================================================================
Summary - Specially Funded Program - Restricted
Original Board Approved Actuals Projected Difference % Diff Account Budget Operating Budget To Date Yr Totals (Col. B & D) (E / B)
Description Codes (A) (B) (C) (D) (E) (F)=============================================================================================================================
A. REVENUES
1) Revenue Limit Sources 8010-8099 + 19,928,715 + 19,928,715 + 5,181,465 + 19,928,715 0 0.00%
2) Federal Revenues 8100-8299 + 433,150,057 + 433,150,057 + 17,896,526 + 339,626,887 (93,523,170) -21.59%
3) Other State Revenues 8300-8599 + 349,931,446 + 349,931,446 + 56,414,865 + 195,448,605 (154,482,841) -44.15%
4) Other Local Revenues 8600-8799 + 21,300,398 + 21,300,398 + 14,488,950 + 16,479,096 (4,821,302) -22.63%
5) TOTAL, REVENUES = 824,310,616 = 824,310,616 = 93,981,806 = 571,483,303
================================================================================================= B. EXPENDITURES
1) Certificated Salaries 1000-1999 + 263,484,810 + 258,605,838 + 50,255,500 + 230,115,146 28,490,692 11.02%
2) Classified Salaries 2000-2999 + 97,335,265 + 103,922,807 + 19,313,584 + 80,076,197 23,846,610 22.95%
3) Employee Benefits 3000-3999 + 68,399,729 + 54,177,434 + 5,557,250 + 47,986,787 6,190,647 11.43%
4) Books and Supplies 4000-4999 + 127,919,964 + 125,938,361 + 10,420,747 + 104,076,498 21,861,863 17.36%
5) Services, Other Operating Expenses 5000-5999 + 77,100,543 + 73,231,848 + 5,140,705 + 56,250,952 16,980,896 23.19%
6) Capital Outlay 6000-6599 + 61,094,286 + 64,610,473 + 6,682,581 + 32,434,096 32,176,377 49.80%
7) Other Outgo 7100-7299 + 110,315,814 + 114,391,525 + 0 + 1,219,921 113,171,604 98.93%
8) Direct Support/Indirect Costs 7300-7399 + 18,660,205 + 29,432,330 + 10,926 + 19,323,706 10,108,624 34.35%
9) TOTAL, EXPENDITURES = 824,310,616 = 824,310,616 = 97,381,293 = 571,483,303
================================================================================================= ================================================================================================= C. EXCESS (DEFICIENCY) OF REVENUES
OVER EXPENDITURES BEFORE OTHER FINANCING SOURCES AND USES (A5 - B9)= 0 = 0 = (3,399,487) = 0
================================================================================================= ================================================================================================= D. OTHER FINANCING SOURCES/USES
1) Interfund Transfers a) Transfers In 8910-8929 + 0 + 0 + 0 + 0 0 0.00%
b) Transfers Out 7610-7629 - 0 - 0 - 0 - 0 0 0.00%
2) Other Sources/Uses a) Sources 8930-8979 + 0 + 0 + 0 + 0 0 0.00%
b) Uses 7630-7699 - 0 - 0 - 0 - 0 0 0.00%
3) Contributions to Restricted Programs 8980-8999 + 0 + 0 + 0 + 0 0 0.00%
4) TOTAL, OTHER FINANCING SOURCES/USES= 0 = 0 = 0 = 0
=================================================================================================
12/08/00 01:36 PM
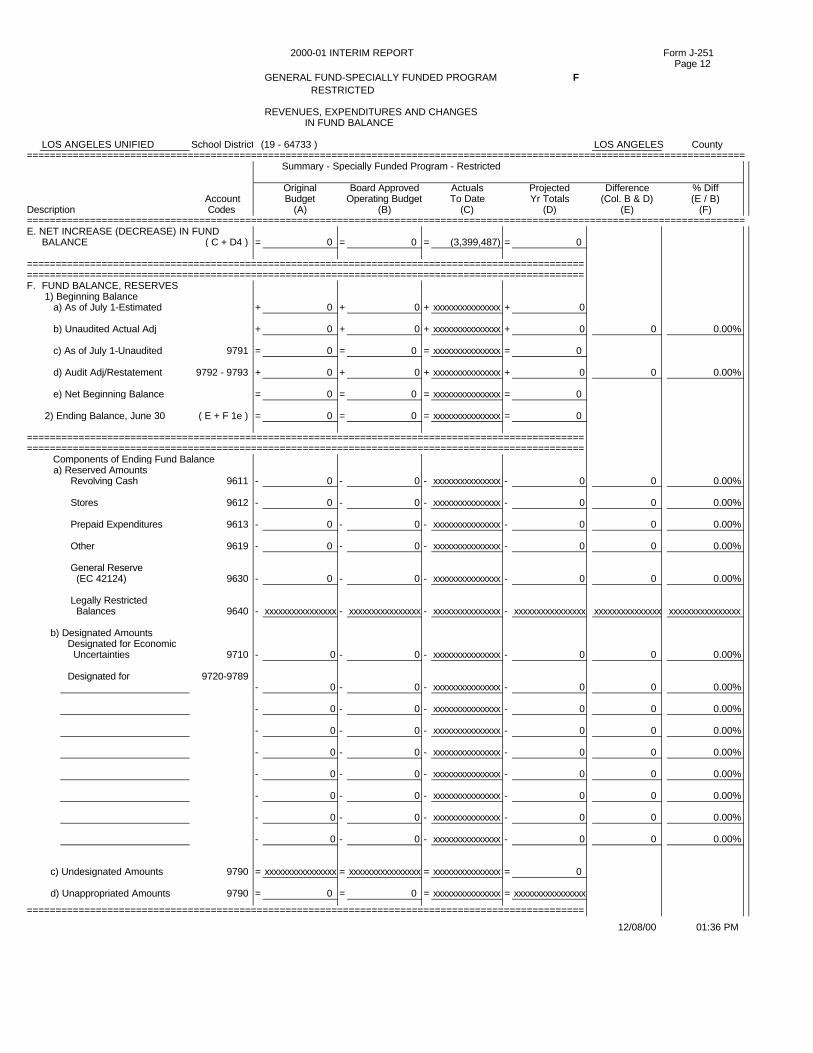
2000-01 INTERIM REPORT Form J-251 Page 12 GENERAL FUND-SPECIALLY FUNDED PROGRAM F RESTRICTED
REVENUES, EXPENDITURES AND CHANGES IN FUND BALANCE
LOS ANGELES UNIFIED School District (19 - 64733 ) LOS ANGELES County=============================================================================================================================
Summary - Specially Funded Program - Restricted
Original Board Approved Actuals Projected Difference % Diff Account Budget Operating Budget To Date Yr Totals (Col. B & D) (E / B)
Description Codes (A) (B) (C) (D) (E) (F)=============================================================================================================================E. NET INCREASE (DECREASE) IN FUND
BALANCE ( C + D4 ) = 0 = 0 = (3,399,487) = 0
================================================================================================= ================================================================================================= F. FUND BALANCE, RESERVES
1) Beginning Balance a) As of July 1-Estimated + 0 + 0 + xxxxxxxxxxxxxxx + 0
b) Unaudited Actual Adj + 0 + 0 + xxxxxxxxxxxxxxx + 0 0 0.00%
c) As of July 1-Unaudited 9791 = 0 = 0 = xxxxxxxxxxxxxxx = 0
d) Audit Adj/Restatement 9792 - 9793 + 0 + 0 + xxxxxxxxxxxxxxx + 0 0 0.00%
e) Net Beginning Balance = 0 = 0 = xxxxxxxxxxxxxxx = 0
2) Ending Balance, June 30 ( E + F 1e ) = 0 = 0 = xxxxxxxxxxxxxxx = 0
================================================================================================= =================================================================================================
Components of Ending Fund Balance a) Reserved Amounts Revolving Cash 9611 - 0 - 0 - xxxxxxxxxxxxxxx - 0 0 0.00%
Stores 9612 - 0 - 0 - xxxxxxxxxxxxxxx - 0 0 0.00%
Prepaid Expenditures 9613 - 0 - 0 - xxxxxxxxxxxxxxx - 0 0 0.00%
Other 9619 - 0 - 0 - xxxxxxxxxxxxxxx - 0 0 0.00%
General Reserve (EC 42124) 9630 - 0 - 0 - xxxxxxxxxxxxxxx - 0 0 0.00%
Legally Restricted Balances 9640 - xxxxxxxxxxxxxxxx - xxxxxxxxxxxxxxxx - xxxxxxxxxxxxxxx - xxxxxxxxxxxxxxxx xxxxxxxxxxxxxxx xxxxxxxxxxxxxxxx
b) Designated Amounts Designated for Economic Uncertainties 9710 - 0 - 0 - xxxxxxxxxxxxxxx - 0 0 0.00% Designated for 9720-9789
- 0 - 0 - xxxxxxxxxxxxxxx - 0 0 0.00%
- 0 - 0 - xxxxxxxxxxxxxxx - 0 0 0.00%
- 0 - 0 - xxxxxxxxxxxxxxx - 0 0 0.00%
- 0 - 0 - xxxxxxxxxxxxxxx - 0 0 0.00%
- 0 - 0 - xxxxxxxxxxxxxxx - 0 0 0.00%
- 0 - 0 - xxxxxxxxxxxxxxx - 0 0 0.00%
- 0 - 0 - xxxxxxxxxxxxxxx - 0 0 0.00%
- 0 - 0 - xxxxxxxxxxxxxxx - 0 0 0.00%
c) Undesignated Amounts 9790 = xxxxxxxxxxxxxxxx = xxxxxxxxxxxxxxxx = xxxxxxxxxxxxxxx = 0 d) Unappropriated Amounts 9790 = 0 = 0 = xxxxxxxxxxxxxxx = xxxxxxxxxxxxxxxx
=================================================================================================
12/08/00 01:36 PM
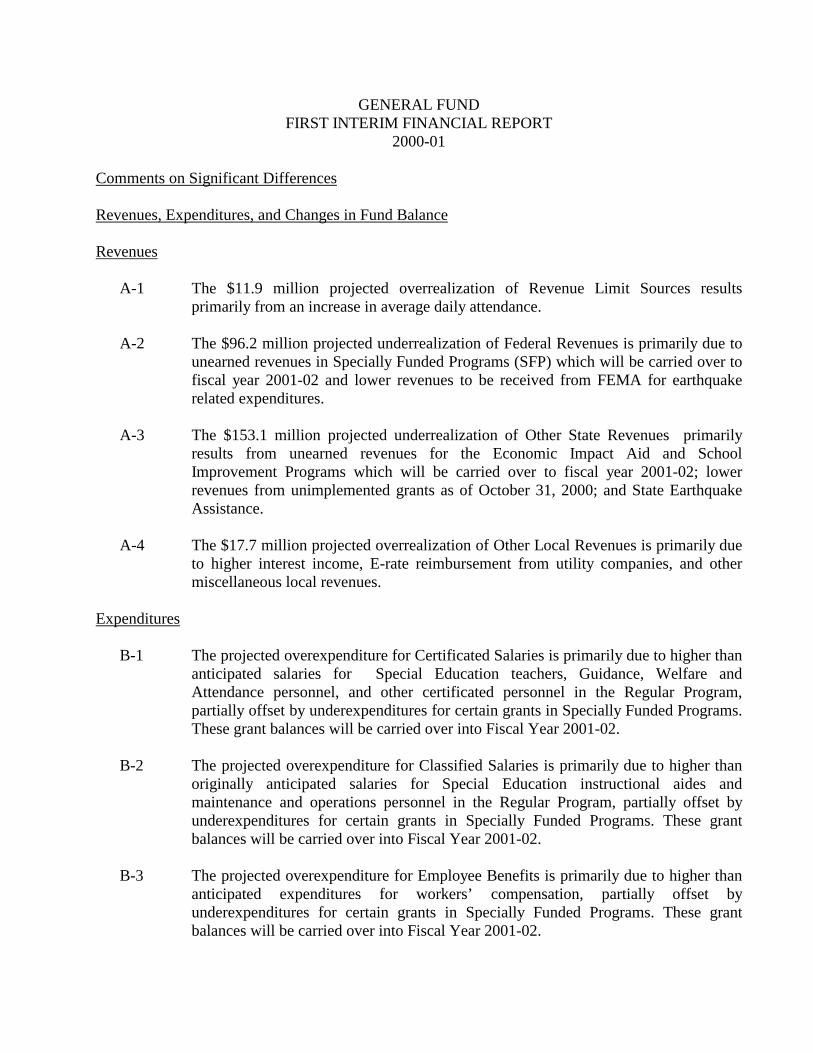
GENERAL FUND FIRST INTERIM FINANCIAL REPORT
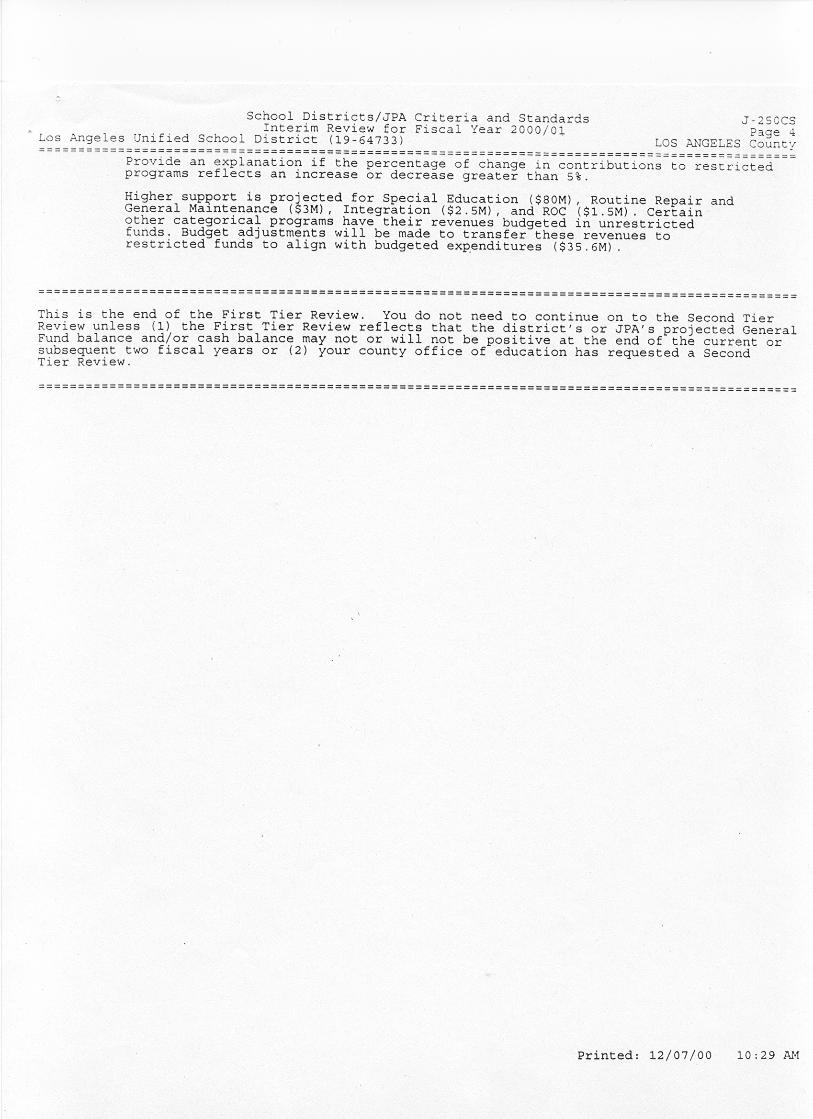
2000-01 Comments on Significant Differences Revenues, Expenditures, and Changes in Fund Balance Revenues A-1 The $11.9 million projected overrealization of Revenue Limit Sources results
primarily from an increase in average daily attendance. A-2 The $96.2 million projected underrealization of Federal Revenues is primarily due to
unearned revenues in Specially Funded Programs (SFP) which will be carried over to fiscal year 2001-02 and lower revenues to be received from FEMA for earthquake related expenditures.
A-3 The $153.1 million projected underrealization of Other State Revenues primarily
results from unearned revenues for the Economic Impact Aid and School Improvement Programs which will be carried over to fiscal year 2001-02; lower revenues from unimplemented grants as of October 31, 2000; and State Earthquake Assistance.
A-4 The $17.7 million projected overrealization of Other Local Revenues is primarily due
to higher interest income, E-rate reimbursement from utility companies, and other miscellaneous local revenues.
Expenditures B-1 The projected overexpenditure for Certificated Salaries is primarily due to higher than
anticipated salaries for Special Education teachers, Guidance, Welfare and Attendance personnel, and other certificated personnel in the Regular Program, partially offset by underexpenditures for certain grants in Specially Funded Programs. These grant balances will be carried over into Fiscal Year 2001-02.
B-2 The projected overexpenditure for Classified Salaries is primarily due to higher than
originally anticipated salaries for Special Education instructional aides and maintenance and operations personnel in the Regular Program, partially offset by underexpenditures for certain grants in Specially Funded Programs. These grant balances will be carried over into Fiscal Year 2001-02.
B-3 The projected overexpenditure for Employee Benefits is primarily due to higher than
anticipated expenditures for workers’ compensation, partially offset by underexpenditures for certain grants in Specially Funded Programs. These grant balances will be carried over into Fiscal Year 2001-02.
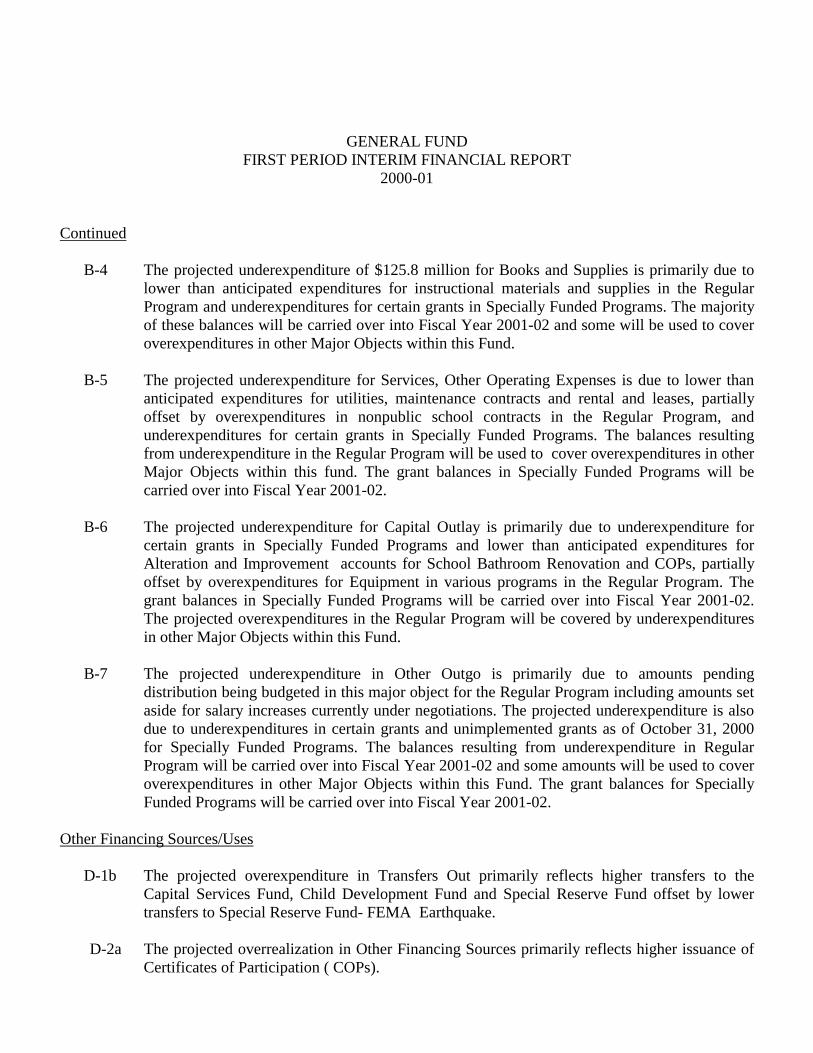
GENERAL FUND FIRST PERIOD INTERIM FINANCIAL REPORT
2000-01 Continued B-4 The projected underexpenditure of $125.8 million for Books and Supplies is primarily due to
lower than anticipated expenditures for instructional materials and supplies in the Regular Program and underexpenditures for certain grants in Specially Funded Programs. The majority of these balances will be carried over into Fiscal Year 2001-02 and some will be used to cover overexpenditures in other Major Objects within this Fund.
B-5 The projected underexpenditure for Services, Other Operating Expenses is due to lower than
anticipated expenditures for utilities, maintenance contracts and rental and leases, partially offset by overexpenditures in nonpublic school contracts in the Regular Program, and underexpenditures for certain grants in Specially Funded Programs. The balances resulting from underexpenditure in the Regular Program will be used to cover overexpenditures in other Major Objects within this fund. The grant balances in Specially Funded Programs will be carried over into Fiscal Year 2001-02.
B-6 The projected underexpenditure for Capital Outlay is primarily due to underexpenditure for
certain grants in Specially Funded Programs and lower than anticipated expenditures for Alteration and Improvement accounts for School Bathroom Renovation and COPs, partially offset by overexpenditures for Equipment in various programs in the Regular Program. The grant balances in Specially Funded Programs will be carried over into Fiscal Year 2001-02. The projected overexpenditures in the Regular Program will be covered by underexpenditures in other Major Objects within this Fund.
B-7 The projected underexpenditure in Other Outgo is primarily due to amounts pending
distribution being budgeted in this major object for the Regular Program including amounts set aside for salary increases currently under negotiations. The projected underexpenditure is also due to underexpenditures in certain grants and unimplemented grants as of October 31, 2000 for Specially Funded Programs. The balances resulting from underexpenditure in Regular Program will be carried over into Fiscal Year 2001-02 and some amounts will be used to cover overexpenditures in other Major Objects within this Fund. The grant balances for Specially Funded Programs will be carried over into Fiscal Year 2001-02.
Other Financing Sources/Uses D-1b The projected overexpenditure in Transfers Out primarily reflects higher transfers to the
Capital Services Fund, Child Development Fund and Special Reserve Fund offset by lower transfers to Special Reserve Fund- FEMA Earthquake.
D-2a The projected overrealization in Other Financing Sources primarily reflects higher issuance of
Certificates of Participation ( COPs).

Class Size Reduction Funding – General Comments Funds are included in the State Budget package for the continuing implementation/operation of
the class size reduction program for grades K-3. The District’s 2000-01 Final Budget reflects the cost of implementing this program in grades K-3. State funding is provided at the rate of $871 per student for a full school day in qualifying classrooms. It is anticipated that state funding will not be sufficient to cover the cost of this program, requiring District General Fund support.

LOS ANGELES UNIFIED SCHOOL DISTRICT ASSUMPTIONS ON WHICH THE 2000-01 FIRST PERIOD INTERIM
FINANCIAL REPORTS WERE BASED CATEGORICAL PROGRAMS The 2000-01 Budget Act provided for a statutory COLA of 3.17 percent and an average increase for growth estimated at 1.45 percent for the categorical programs. The District did not reallocate these funds within the Mega-Item programs, and projected the Mega-Item block grant at $12.18 per ADA to support the Integration Program. The Special Education funding model established in accordance with AB602 and AB598 was used in both the Budget and Interim Projections. Funding was calculated based on Special Education Local Plan Area (SELPA) total K-12 actual average daily attendance (ADA), excluding excused absences. RESERVE FOR ECONOMIC UNCERTAINTIES A reserve of at least one percent (1%) of the District’s total expenditures, transfers out and other uses was provided in both the 2000-01 Budget and in the Interim Projections. CLASS SIZE REDUCTION PROGRAMS There is no significant change in the District’s financial plan for participating in the State Class Size Reduction program for 2000-01, 2001-02 and 2002-03 fiscal years. For the Federal Class Size Reduction Program, $26.6 million in income is anticipated and included in the Interim Projections of the specially funded programs. No funding for Class Size Reduction Facilities from the State is included in the General Fund and Special Reserve Fund Interim Projections. The District will continue to support these programs beyond the amounts funded by the State or Federal, as necessary.

First Period Interim ACTUAL AND PROJECTED MONTHLY CASH FLOWS | 19 | 64733 | 250-CASH |As of October 31 FISCAL YEAR 2000/01 ======================
GENERAL FUND DEPT OF EDUCATION (IN THOUSANDS) Form J-250-Cash (Rev 01/95)
Los Angeles Unified School District LOS ANGELES County======================================================================================================================== ACTUALS THRU MONTH OF OCTOBER========================================================================================================================
July August September October November December January============================================================================================================================A. BEGINNING CASH 1,011,525 1,119,176 1,171,832 972,430 872,498 685,862 832,054
--------------------- --------------------- --------------------- --------------------- --------------------- --------------------- ----------------------============================================================================================================================B. RECEIPTS:
Revenue LimitProperty Tax 851 81,530 (39) 5,225 7,176 333,925 84,386
--------------------- --------------------- --------------------- --------------------- --------------------- --------------------- ----------------------State Aid 145,262 293,291 193,040 192,919 193,925 192,836 192,803
--------------------- --------------------- --------------------- --------------------- --------------------- --------------------- ----------------------Other 0 0 0 0 0 0 0
--------------------- --------------------- --------------------- --------------------- --------------------- --------------------- ----------------------Federal Revenues 2,332 6,737 5,945 9,648 9,969 12,675 84,385
--------------------- --------------------- --------------------- --------------------- --------------------- --------------------- ----------------------Other State Revenues 34,902 4,635 29,540 46,028 83,872 92,878 127,306
--------------------- --------------------- --------------------- --------------------- --------------------- --------------------- ----------------------Other Local Revenues 9,595 7,550 20,178 4,787 13,913 13,980 16,761
--------------------- --------------------- --------------------- --------------------- --------------------- --------------------- ----------------------Interfund Transfers In 14,946 94,829 7,574 45,911 223,255 129,615 109,541
--------------------- --------------------- --------------------- --------------------- --------------------- --------------------- ----------------------All Other Financing Sources 0 0 0 0 0
--------------------- --------------------- --------------------- --------------------- --------------------- --------------------- ----------------------Other Receipts/Non-Revenue 280,500 0 0 0 0
---------------------------------------------------------------------------------------------------------------------------------------------------------------TOTAL RECEIPTS 488,388 488,572 256,238 304,518 532,110 775,909 615,182
---------------------------------------------------------------------------------------------------------------------------------------------------------------============================================================================================================================C. DISBURSEMENTS
Certificated Salaries 281,086 228,241 313,413 248,742 305,967 297,388 275,670--------------------- --------------------- --------------------- --------------------- --------------------- --------------------- ----------------------
Classified Salaries--------------------- --------------------- --------------------- --------------------- --------------------- --------------------- ----------------------
Employee Benefits--------------------- --------------------- --------------------- --------------------- --------------------- --------------------- ----------------------
Supplies and Services 88,099 77,056 79,110 90,898 95,817 116,495 66,468--------------------- --------------------- --------------------- --------------------- --------------------- --------------------- ----------------------
Capital Outlays--------------------- --------------------- --------------------- --------------------- --------------------- --------------------- ----------------------
Other Outgo--------------------- --------------------- --------------------- --------------------- --------------------- --------------------- ----------------------
Interfund Transfers Out 11,552 130,619 63,117 64,810 316,962 117,659 83,108--------------------- --------------------- --------------------- --------------------- --------------------- --------------------- ----------------------
All Other Financing Uses 0--------------------- --------------------- --------------------- --------------------- --------------------- --------------------- ----------------------
Other Disbursements/ Non-Expenditures 0 0 0 0 98,175 0
---------------------------------------------------------------------------------------------------------------------------------------------------------------TOTAL DISBURSEMENTS 380,737 435,916 455,640 404,450 718,746 629,717 425,246
---------------------------------------------------------------------------------------------------------------------------------------------------------------============================================================================================================================D. PRIOR YEAR TRANSACTIONS
Accounts Receivable (Note A) 0 0 0 0 0 0 0---------------------------------------------------------------------------------------------------------------------------------------------------------------
Accounts Payable (Note B) 0 0 0 0 0 0 0---------------------------------------------------------------------------------------------------------------------------------------------------------------
TOTAL PRIOR YEAR TRANSACTIONS 0 0 0 0 0 0 0
---------------------------------------------------------------------------------------------------------------------------------------------------------------============================================================================================================================E. NET INCREASE/DECREASE
(B - C + D) 107,651 52,656 (199,402) (99,932) (186,636) 146,192 189,936---------------------------------------------------------------------------------------------------------------------------------------------------------------
========================================================================================================================================================================================================================================================F. ENDING CASH (A + E) 1,119,176 1,171,832 972,430 872,498 685,862 832,054 1,021,990
---------------------------------------------------------------------------------------------------------------------------------------------------------------========================================================================================================================================================================================================================================================G. ENDING CASH, PLUS ACCRUALSxxxxxxxxxxxxxxx xxxxxxxxxxxxxxx xxxxxxxxxxxxxxx xxxxxxxxxxxxxxx xxxxxxxxxxxxxxx xxxxxxxxxxxxxxx xxxxxxxxxxxxxxx
---------------------------------------------------------------------------------------------------------------------------------------------------------------========================================================================================================================================================================================================================================================
Note A: Accounts Receivable is included under B. Receipts.Note B: Accounts Payable is included under C. Disbursements. 12/08/00 03:04 PM
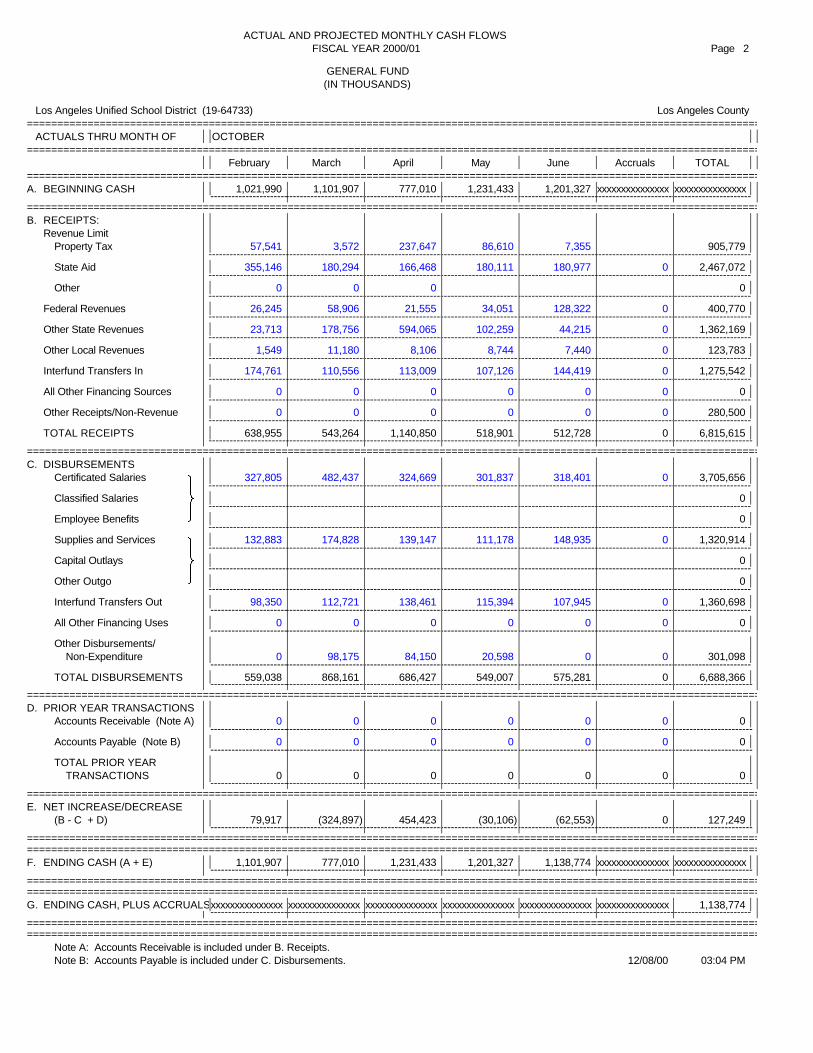
ACTUAL AND PROJECTED MONTHLY CASH FLOWS FISCAL YEAR 2000/01 Page 2
GENERAL FUND (IN THOUSANDS)
Los Angeles Unified School District (19-64733) Los Angeles County============================================================================================================================ ACTUALS THRU MONTH OF OCTOBER============================================================================================================================
February March April May June Accruals TOTAL============================================================================================================================A. BEGINNING CASH 1,021,990 1,101,907 777,010 1,231,433 1,201,327 xxxxxxxxxxxxxxx xxxxxxxxxxxxxxx
---------------------------------------------------------------------------------------------------------------------------------------------------------------============================================================================================================================B. RECEIPTS:
Revenue LimitProperty Tax 57,541 3,572 237,647 86,610 7,355 905,779
----------------------------------------------------------------------------------------------------------------------------------------------------------------State Aid 355,146 180,294 166,468 180,111 180,977 0 2,467,072
----------------------------------------------------------------------------------------------------------------------------------------------------------------Other 0 0 0 0
----------------------------------------------------------------------------------------------------------------------------------------------------------------Federal Revenues 26,245 58,906 21,555 34,051 128,322 0 400,770
----------------------------------------------------------------------------------------------------------------------------------------------------------------Other State Revenues 23,713 178,756 594,065 102,259 44,215 0 1,362,169
----------------------------------------------------------------------------------------------------------------------------------------------------------------Other Local Revenues 1,549 11,180 8,106 8,744 7,440 0 123,783
----------------------------------------------------------------------------------------------------------------------------------------------------------------Interfund Transfers In 174,761 110,556 113,009 107,126 144,419 0 1,275,542
----------------------------------------------------------------------------------------------------------------------------------------------------------------All Other Financing Sources 0 0 0 0 0 0 0
----------------------------------------------------------------------------------------------------------------------------------------------------------------Other Receipts/Non-Revenue 0 0 0 0 0 0 280,500
----------------------------------------------------------------------------------------------------------------------------------------------------------------TOTAL RECEIPTS 638,955 543,264 1,140,850 518,901 512,728 0 6,815,615
-----------------------------------------------------------------------------------------------------------------------------------------------------------------============================================================================================================================C. DISBURSEMENTS
Certificated Salaries 327,805 482,437 324,669 301,837 318,401 0 3,705,656----------------------------------------------------------------------------------------------------------------------------------------------------------------
Classified Salaries 0----------------------------------------------------------------------------------------------------------------------------------------------------------------
Employee Benefits 0----------------------------------------------------------------------------------------------------------------------------------------------------------------
Supplies and Services 132,883 174,828 139,147 111,178 148,935 0 1,320,914----------------------------------------------------------------------------------------------------------------------------------------------------------------
Capital Outlays 0----------------------------------------------------------------------------------------------------------------------------------------------------------------
Other Outgo 0----------------------------------------------------------------------------------------------------------------------------------------------------------------
Interfund Transfers Out 98,350 112,721 138,461 115,394 107,945 0 1,360,698---------------------------------------------------------------------------------------------------------------------------------------------------------------
All Other Financing Uses 0 0 0 0 0 0 0---------------------------------------------------------------------------------------------------------------------------------------------------------------
Other Disbursements/ Non-Expenditure 0 98,175 84,150 20,598 0 0 301,098
---------------------------------------------------------------------------------------------------------------------------------------------------------------TOTAL DISBURSEMENTS 559,038 868,161 686,427 549,007 575,281 0 6,688,366
----------------------------------------------------------------------------------------------------------------------------------------------------------------============================================================================================================================D. PRIOR YEAR TRANSACTIONS
Accounts Receivable (Note A) 0 0 0 0 0 0 0----------------------------------------------------------------------------------------------------------------------------------------------------------------
Accounts Payable (Note B) 0 0 0 0 0 0 0----------------------------------------------------------------------------------------------------------------------------------------------------------------
TOTAL PRIOR YEAR TRANSACTIONS 0 0 0 0 0 0 0
----------------------------------------------------------------------------------------------------------------------------------------------------------------============================================================================================================================E. NET INCREASE/DECREASE
(B - C + D) 79,917 (324,897) 454,423 (30,106) (62,553) 0 127,249----------------------------------------------------------------------------------------------------------------------------------------------------------------
========================================================================================================================================================================================================================================================F. ENDING CASH (A + E) 1,101,907 777,010 1,231,433 1,201,327 1,138,774 xxxxxxxxxxxxxxx xxxxxxxxxxxxxxx
----------------------------------------------------------------------------------------------------------------------------------------------------------------========================================================================================================================================================================================================================================================G. ENDING CASH, PLUS ACCRUALSxxxxxxxxxxxxxxx xxxxxxxxxxxxxxx xxxxxxxxxxxxxxx xxxxxxxxxxxxxxx xxxxxxxxxxxxxxx xxxxxxxxxxxxxxx 1,138,774
----------------------------------------------------------------------------------------------------------------------------------------------------------========================================================================================================================================================================================================================================================
Note A: Accounts Receivable is included under B. Receipts.Note B: Accounts Payable is included under C. Disbursements. 12/08/00 03:04 PM
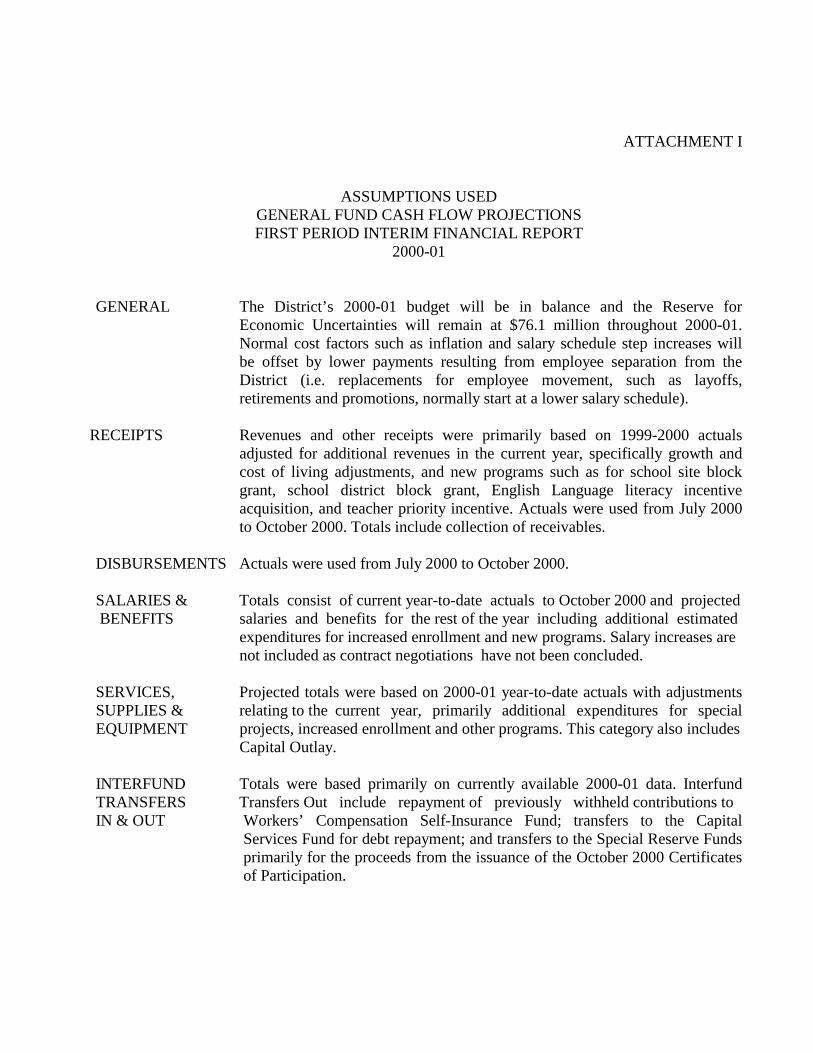
ATTACHMENT I
ASSUMPTIONS USED GENERAL FUND CASH FLOW PROJECTIONS FIRST PERIOD INTERIM FINANCIAL REPORT
2000-01
GENERAL The District’s 2000-01 budget will be in balance and the Reserve for
Economic Uncertainties will remain at $76.1 million throughout 2000-01. Normal cost factors such as inflation and salary schedule step increases will be offset by lower payments resulting from employee separation from the District (i.e. replacements for employee movement, such as layoffs, retirements and promotions, normally start at a lower salary schedule).
RECEIPTS Revenues and other receipts were primarily based on 1999-2000 actuals
adjusted for additional revenues in the current year, specifically growth and cost of living adjustments, and new programs such as for school site block grant, school district block grant, English Language literacy incentive acquisition, and teacher priority incentive. Actuals were used from July 2000 to October 2000. Totals include collection of receivables.
DISBURSEMENTS Actuals were used from July 2000 to October 2000. SALARIES & Totals consist of current year-to-date actuals to October 2000 and projected BENEFITS salaries and benefits for the rest of the year including additional estimated
expenditures for increased enrollment and new programs. Salary increases are not included as contract negotiations have not been concluded. SERVICES, Projected totals were based on 2000-01 year-to-date actuals with adjustments SUPPLIES & relating to the current year, primarily additional expenditures for special EQUIPMENT projects, increased enrollment and other programs. This category also includes Capital Outlay. INTERFUND Totals were based primarily on currently available 2000-01 data. Interfund TRANSFERS Transfers Out include repayment of previously withheld contributions to IN & OUT Workers’ Compensation Self-Insurance Fund; transfers to the Capital
Services Fund for debt repayment; and transfers to the Special Reserve Funds primarily for the proceeds from the issuance of the October 2000 Certificates of Participation.
LOS ANGELES UNIFIED SCHOOL DISTRICT FIRST PERIOD INTERIM FINANCIAL REPORT
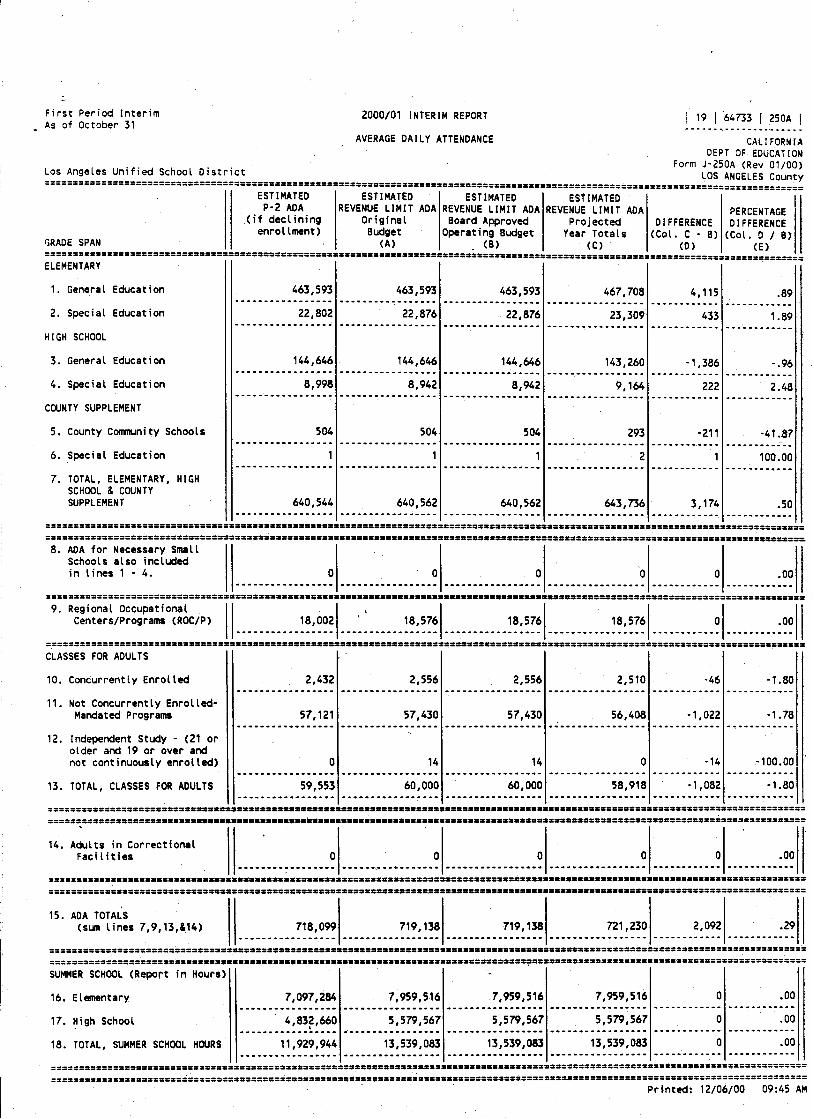
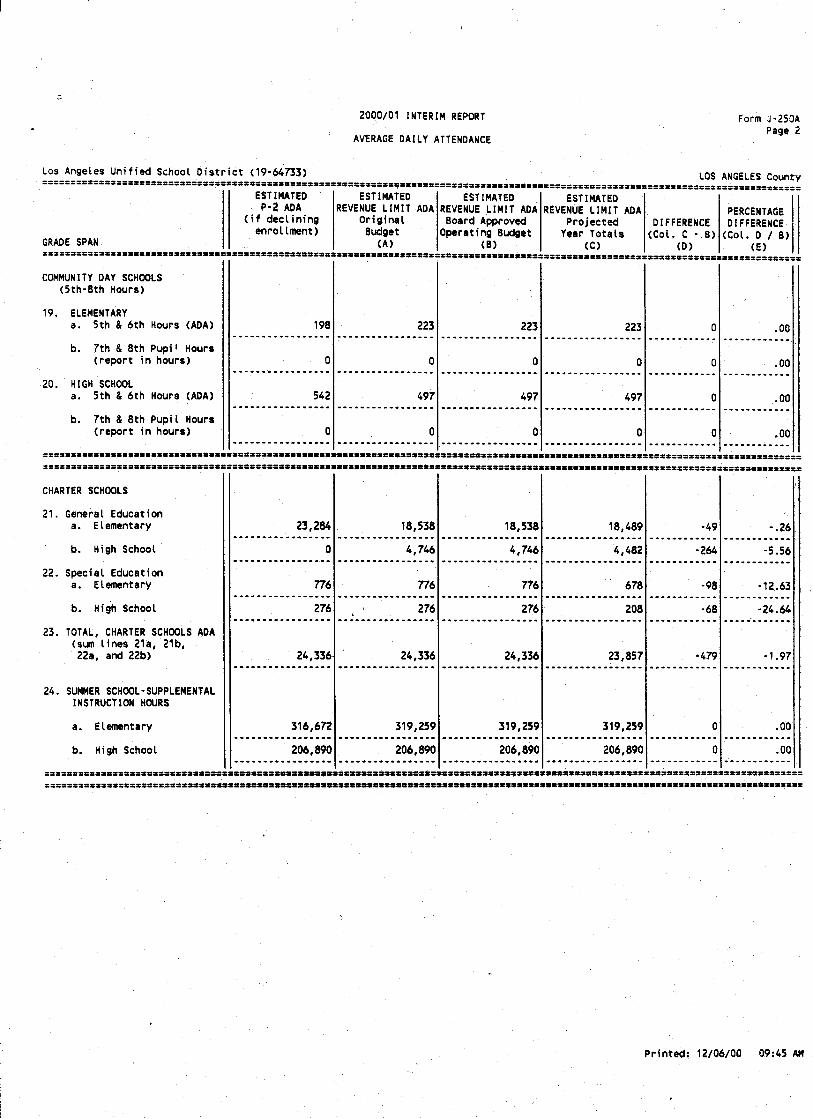
AVERAGE DAILY ATTENDANCE 2000-01
Assumptions Used in Average Daily Attendance Projections The October 2000 norm date data reflected an increase in enrollment of 11,540 compared to 1999-2000 norm actuals. The average daily attendance is computed pursuant to the provisions of Education Code Section 42238.5.a1 and projections were based on this October 2000 norm day enrollment data. The Summer School programs renamed as “ Supplemental Instructional” programs are now funded at the same rate of $ 3.25 per hour for all programs: Core Academic, Deficiency Program for Grades 2-6, Elementary Intensive Reading Program for Grades K-4, Algebra Academy Program for Grades 7-8, and the Remedial Grades 2-12 Programs. The estimated pupil hours of attendance in these programs are based on currently available program data.
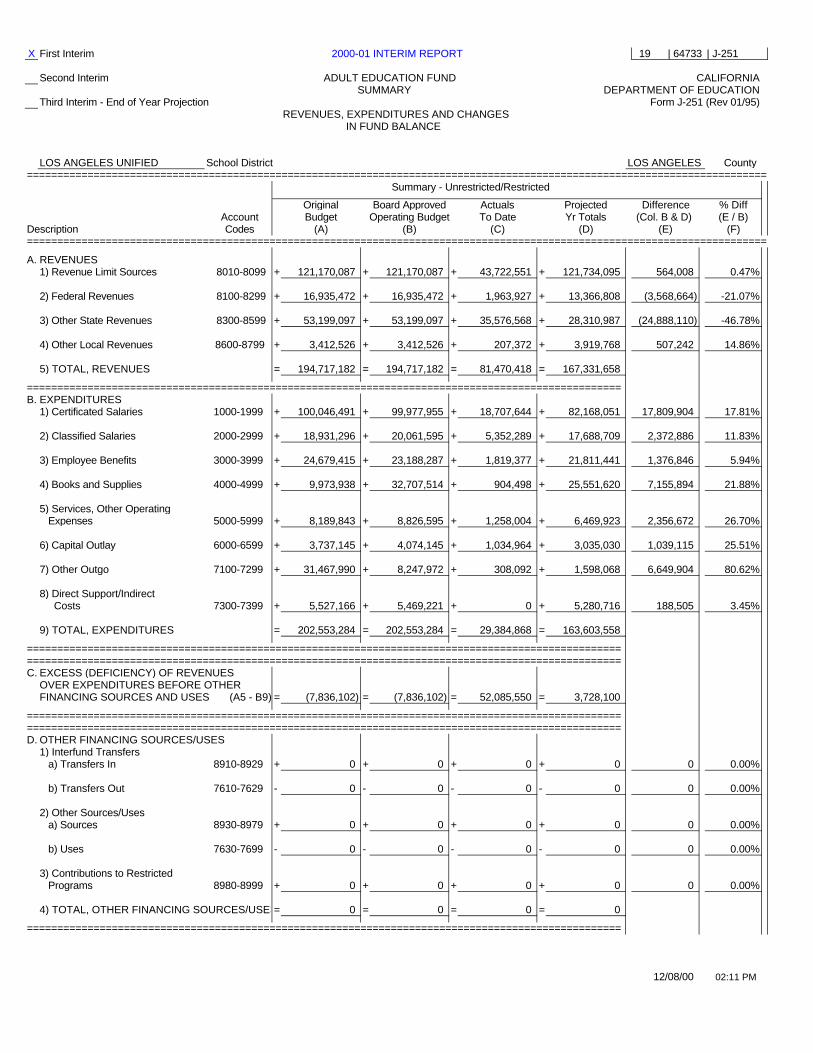
X First Interim 2000-01 INTERIM REPORT 19 | 64733 | J-251
Second Interim ADULT EDUCATION FUND CALIFORNIA SUMMARY DEPARTMENT OF EDUCATION
Third Interim - End of Year Projection Form J-251 (Rev 01/95)REVENUES, EXPENDITURES AND CHANGES
IN FUND BALANCE
LOS ANGELES UNIFIED School District LOS ANGELES County==========================================================================================================================
Summary - Unrestricted/Restricted Original Board Approved Actuals Projected Difference % Diff Account Budget Operating Budget To Date Yr Totals (Col. B & D) (E / B)
Description Codes (A) (B) (C) (D) (E) (F)==========================================================================================================================
A. REVENUES
1) Revenue Limit Sources 8010-8099 + 121,170,087 + 121,170,087 + 43,722,551 + 121,734,095 564,008 0.47%
2) Federal Revenues 8100-8299 + 16,935,472 + 16,935,472 + 1,963,927 + 13,366,808 (3,568,664) -21.07%
3) Other State Revenues 8300-8599 + 53,199,097 + 53,199,097 + 35,576,568 + 28,310,987 (24,888,110) -46.78%
4) Other Local Revenues 8600-8799 + 3,412,526 + 3,412,526 + 207,372 + 3,919,768 507,242 14.86%
5) TOTAL, REVENUES = 194,717,182 = 194,717,182 = 81,470,418 = 167,331,658
================================================================================================== B. EXPENDITURES
1) Certificated Salaries 1000-1999 + 100,046,491 + 99,977,955 + 18,707,644 + 82,168,051 17,809,904 17.81%
2) Classified Salaries 2000-2999 + 18,931,296 + 20,061,595 + 5,352,289 + 17,688,709 2,372,886 11.83%
3) Employee Benefits 3000-3999 + 24,679,415 + 23,188,287 + 1,819,377 + 21,811,441 1,376,846 5.94%
4) Books and Supplies 4000-4999 + 9,973,938 + 32,707,514 + 904,498 + 25,551,620 7,155,894 21.88%
5) Services, Other Operating Expenses 5000-5999 + 8,189,843 + 8,826,595 + 1,258,004 + 6,469,923 2,356,672 26.70%
6) Capital Outlay 6000-6599 + 3,737,145 + 4,074,145 + 1,034,964 + 3,035,030 1,039,115 25.51%
7) Other Outgo 7100-7299 + 31,467,990 + 8,247,972 + 308,092 + 1,598,068 6,649,904 80.62%
8) Direct Support/Indirect Costs 7300-7399 + 5,527,166 + 5,469,221 + 0 + 5,280,716 188,505 3.45%
9) TOTAL, EXPENDITURES = 202,553,284 = 202,553,284 = 29,384,868 = 163,603,558
================================================================================================== ================================================================================================== C. EXCESS (DEFICIENCY) OF REVENUES
OVER EXPENDITURES BEFORE OTHER FINANCING SOURCES AND USES (A5 - B9) = (7,836,102) = (7,836,102) = 52,085,550 = 3,728,100
================================================================================================== ================================================================================================== D. OTHER FINANCING SOURCES/USES
1) Interfund Transfers a) Transfers In 8910-8929 + 0 + 0 + 0 + 0 0 0.00%
b) Transfers Out 7610-7629 - 0 - 0 - 0 - 0 0 0.00%
2) Other Sources/Uses a) Sources 8930-8979 + 0 + 0 + 0 + 0 0 0.00%
b) Uses 7630-7699 - 0 - 0 - 0 - 0 0 0.00%
3) Contributions to Restricted Programs 8980-8999 + 0 + 0 + 0 + 0 0 0.00%
4) TOTAL, OTHER FINANCING SOURCES/USES= 0 = 0 = 0 = 0
==================================================================================================
12/08/00 02:11 PM

2000-01 INTERIM REPORT Form J-251 Page 2 ADULT EDUCATION FUND
SUMMARY REVENUES, EXPENDITURES AND CHANGES
IN FUND BALANCE
LOS ANGELES UNIFIED School District ( 19 - 64733 ) LOS ANGELES County==========================================================================================================================
Summary - Unrestricted/Restricted Original Board Approved Actuals Projected Difference % Diff Account Budget Operating Budget To Date Yr Totals (Col. B & D) (E / B)
Description Codes (A) (B) (C) (D) (E) (F)==========================================================================================================================E. NET INCREASE (DECREASE) IN FUND
BALANCE ( C + D4 ) = (7,836,102) = (7,836,102) = 52,085,550 = 3,728,100
================================================================================================== ================================================================================================== F. FUND BALANCE, RESERVES
1) Beginning Balance a) As of July 1-Estimated + 8,061,822 + 8,061,822 + xxxxxxxxxxxxxxx + 8,061,822
b) Unaudited Actual Adj. + 0 + 0 + xxxxxxxxxxxxxxx + 0 0 0.00%
c) As of July 1-Unaudited 9791 = 8,061,822 = 8,061,822 = xxxxxxxxxxxxxxx = 8,061,822
d) Audit Adj/Restatement 9792-9793 + 0 + 0 + xxxxxxxxxxxxxxx + 0 0 0.00%
e) Net Beginning Balance = 8,061,822 = 8,061,822 = xxxxxxxxxxxxxxx = 8,061,822
2) Ending Balance, June 30 ( E + F1e ) = 225,720 = 225,720 = xxxxxxxxxxxxxxx = 11,789,922
================================================================================================== ==================================================================================================
Components of Ending Fund Balance a) Reserved Amounts Revolving Cash 9611 - 117,733 - 117,733 -xxxxxxxxxxxxxxxxx - 117,733 0 0.00%
Stores 9612 - 107,987 - 107,987 -xxxxxxxxxxxxxxxxx - 107,987 0 0.00%
Prepaid Expenditures 9613 - 0 - 0 -xxxxxxxxxxxxxxxxx - 0 0 0.00%
Other 9619 - 0 - 0 -xxxxxxxxxxxxxxxxx - 0 0 0.00%
General Reserve (EC 42124) 9630 - 0 - 0 -xxxxxxxxxxxxxxxxx - 0 0 0.00%
Legally Restricted Balances 9640 - xxxxxxxxxxxxxxxx - xxxxxxxxxxxxxxxx -xxxxxxxxxxxxxxxxx - 0 xxxxxxxxxxxxx xxxxxxxxxxx
b) Designated Amounts Designated for Economic Uncertainties 9710 - 0 - 0 -xxxxxxxxxxxxxxxxx - 0 0 0.00% Designated for 9720-9789
Compensation - 0 - 0 -xxxxxxxxxxxxxxxxx - 6,908,431 (6,908,431) 0.00%
Carryovers - 0 - 0 -xxxxxxxxxxxxxxxxx - 4,655,771 (4,655,771) 0.00%
0 - 0 -xxxxxxxxxxxxxxxxx - 0 0 0.00%
0 - 0 -xxxxxxxxxxxxxxxxx - 0 0 0.00%
0 - 0 -xxxxxxxxxxxxxxxxx - 0 0 0.00%
- 0 - 0 -xxxxxxxxxxxxxxxxx - 0 0 0.00%
c) Undesignated Amounts 9790 =xxxxxxxxxxxxxxxxx =xxxxxxxxxxxxxxxxx =xxxxxxxxxxxxxxxxx = 0 d) Unappropriated Amounts 9790 = 0 = 0 =xxxxxxxxxxxxxxxxx =xxxxxxxxxxxxxxxxx
==================================================================================================
12/08/00 02:11 PM

2000-01 INTERIM REPORT Form J-251Page 3
ADULT EDUCATION FUND-REGULAR PROGRAM SUMMARY
REVENUES, EXPENDITURES AND CHANGES IN FUND BALANCE
LOS ANGELES UNIFIED School District ( 19 - 64733 ) LOS ANGELES County==========================================================================================================================
Summary - Unrestricted/Restricted
Original Board Approved Actuals Projected Difference % Diff Account Budget Operating Budget To Date Yr Totals (Col. B & D) (E / B)
Description Codes (A) (B) (C) (D) (E) (F)==========================================================================================================================
A. REVENUES
1) Revenue Limit Sources 8010-8099 + 119,787,152 + 119,787,152 + 43,722,551 + 120,351,160 564,008 0.47%
2) Federal Revenues 8100-8299 + 0 + 0 + 0 + 0 0 0.00%
3) Other State Revenues 8300-8599 + 3,993,869 + 3,993,869 + 0 + 3,993,869 0 0.00%
4) Other Local Revenues 8600-8799 + 2,615,000 + 2,615,000 + 127,344 + 3,645,000 1,030,000 39.39%
5) TOTAL, REVENUES = 126,396,021 = 126,396,021 = 43,849,895 = 127,990,029
================================================================================================== B. EXPENDITURES
1) Certificated Salaries 1000-1999 + 79,511,109 + 79,511,109 + 16,637,870 + 75,508,803 4,002,306 5.03%
2) Classified Salaries 2000-2999 + 15,261,455 + 15,242,946 + 4,520,892 + 15,036,523 206,423 1.35%
3) Employee Benefits 3000-3999 + 19,751,156 + 19,745,719 + 1,614,996 + 19,449,944 295,775 1.50%
4) Books and Supplies 4000-4999 + 5,132,034 + 5,128,629 + 539,675 + 2,030,915 3,097,714 60.40%
5) Services, Other Operating Expenses 5000-5999 + 5,579,341 + 5,748,529 + 1,126,760 + 4,904,440 844,089 14.68%
6) Capital Outlay 6000-6599 + 1,043,184 + 1,043,184 + 142,504 + 730,037 313,147 30.02%
7) Other Outgo 7100-7299 + 2,767,990 + 2,795,341 + 308,092 + 1,598,068 1,197,273 42.83%
8) Direct Support/Indirect Costs 7300-7399 + 5,185,854 + 5,016,666 + 0 + 5,003,199 13,467 0.27%
9) TOTAL, EXPENDITURES = 134,232,123 = 134,232,123 = 24,890,789 = 124,261,929
================================================================================================== ================================================================================================== C. EXCESS (DEFICIENCY) OF REVENUES
OVER EXPENDITURES BEFORE OTHER FINANCING SOURCES AND USES (A5 - B9) = (7,836,102) = (7,836,102) = 18,959,106 = 3,728,100
================================================================================================== ================================================================================================== D. OTHER FINANCING SOURCES/USES
1) Interfund Transfers a) Transfers In 8910-8929 + 0 + 0 + 0 + 0 0 0.00%
b) Transfers Out 7610-7629 - 0 - 0 - 0 - 0 0.00%
2) Other Sources/Uses a) Sources 8930-8979 + 0 + 0 + 0 + 0 0 0.00%
b) Uses 7630-7699 - 0 - 0 - 0 - 0 0 0.00%
3) Contributions to Restricted Programs 8980-8999 + 0 + 0 + 0 + 0 0 0.00%
4) TOTAL, OTHER FINANCING SOURCES/USES= 0 = 0 = 0 = 0
==================================================================================================
12/08/00 02:11 PM

2000-01 INTERIM REPORT Form J-251 Page 4 ADULT EDUCATION FUND-REGULAR PROGRAM SUMMARY
REVENUES, EXPENDITURES AND CHANGES IN FUND BALANCE
LOS ANGELES UNIFIED School District ( 19 - 64733 ) LOS ANGELES County
========================================================================================================================== Summary - Unrestricted/Restricted
Original Board Approved Actuals Projected Difference % Diff Account Budget Operating Budget To Date Yr Totals (Col. B & D) (E / B)
Description Codes (A) (B) (C) (D) (E) (F)==========================================================================================================================E. NET INCREASE (DECREASE) IN FUND
BALANCE ( C + D4 ) = (7,836,102) = (7,836,102) = 18,959,106 = 3,728,100
================================================================================================== ================================================================================================== F. FUND BALANCE, RESERVES
1) Beginning Balance a) As of July 1-Estimated + 8,061,822 + 8,061,822 + xxxxxxxxxxxxxxx + 8,061,822
b) Unaudited Actual Adj. + 0 + 0 + xxxxxxxxxxxxxxx + 0 0 0.00%
c) As of July 1-Unaudited 9791 = 8,061,822 = 8,061,822 = xxxxxxxxxxxxxxx = 8,061,822
d) Audit Adj/Restatement 9792-9793 + 0 + 0 + xxxxxxxxxxxxxxx + 0 0 0.00%
e) Net Beginning Balance = 8,061,822 = 8,061,822 = xxxxxxxxxxxxxxx = 8,061,822
2) Ending Balance, June 30 ( E + F1e ) = 225,720 = 225,720 = xxxxxxxxxxxxxxx = 11,789,922
================================================================================================== ==================================================================================================
Components of Ending Fund Balance a) Reserved Amounts Revolving Cash 9611 - 117,733 - 117,733 - xxxxxxxxxxxxxxxx - 117,733 0 0.00%
Stores 9612 - 107,987 - 107,987 - xxxxxxxxxxxxxxxx - 107,987 0 0.00%
Prepaid Expenditures 9613 - 0 - 0 - xxxxxxxxxxxxxxxx - 0 0 0.00%
Other 9619 - 0 - 0 - xxxxxxxxxxxxxxxx - 0 0 0.00%
General Reserve (EC 42124) 9630 - 0 - 0 - xxxxxxxxxxxxxxxx - 0 0 0.00%
Legally Restricted Balances 9640 - xxxxxxxxxxxxxxxx - xxxxxxxxxxxxxxxx - xxxxxxxxxxxxxxxx - xxxxxxxxxxxxxxxx xxxxxxxxxxxxx xxxxxxxxxxx
b) Designated Amounts Designated for Economic Uncertainties 9710 - 0 - 0 - xxxxxxxxxxxxxxxx - 0 0 0.00% Designated for 9720-9789
Compensation - - - xxxxxxxxxxxxxxxx - 6,908,431 (6,908,431) 0.00%
Carryovers - - - xxxxxxxxxxxxxxxx - 4,655,771 (4,655,771) 0.00%
xxxxxxxxxxxxxxxx
- - - xxxxxxxxxxxxxxxx - 0 0.00%
- - 0 - xxxxxxxxxxxxxxxx - 0 0.00%
- - 0 - xxxxxxxxxxxxxxxx - 0 0 0.00%
c) Undesignated Amounts 9790 = xxxxxxxxxxxxxxxx = xxxxxxxxxxxxxxxx = xxxxxxxxxxxxxxxx = 0 d) Unappropriated Amounts 9790 = 0 = 0 = xxxxxxxxxxxxxxxx = xxxxxxxxxxxxxxxx
==================================================================================================
12/08/00 02:11 PM
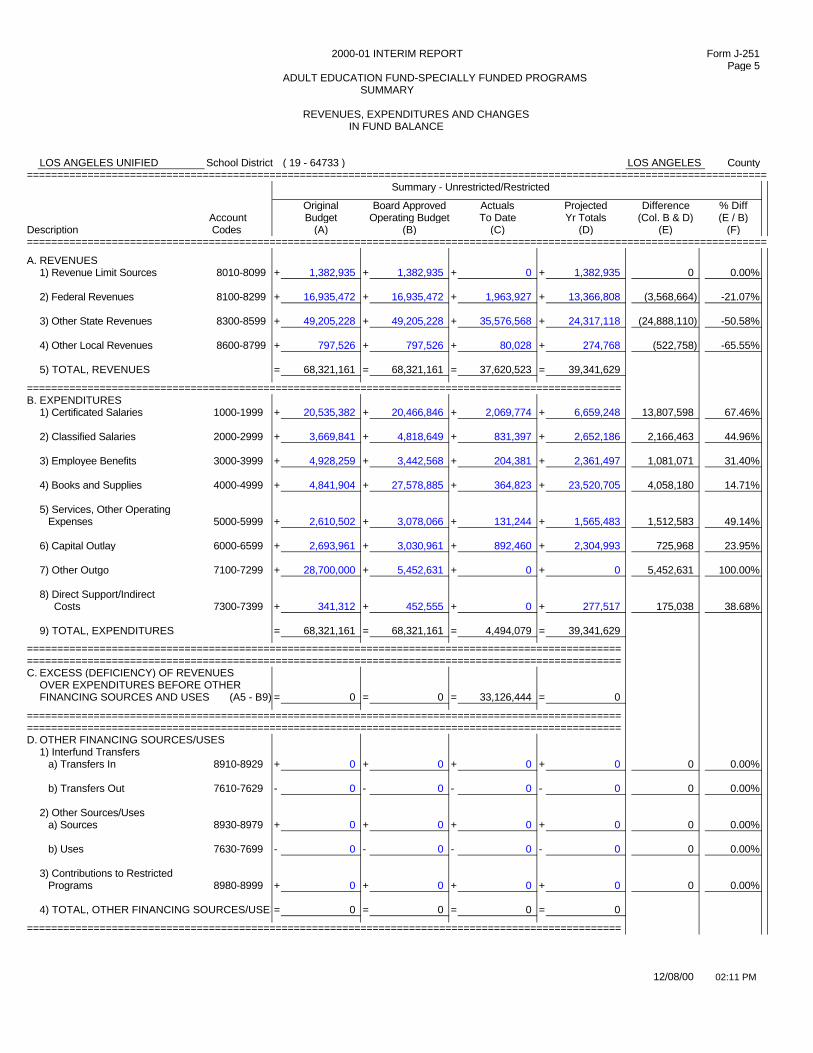
2000-01 INTERIM REPORT Form J-251Page 5
ADULT EDUCATION FUND-SPECIALLY FUNDED PROGRAMS SUMMARY
REVENUES, EXPENDITURES AND CHANGES IN FUND BALANCE
LOS ANGELES UNIFIED School District ( 19 - 64733 ) LOS ANGELES County==========================================================================================================================
Summary - Unrestricted/Restricted
Original Board Approved Actuals Projected Difference % Diff Account Budget Operating Budget To Date Yr Totals (Col. B & D) (E / B)
Description Codes (A) (B) (C) (D) (E) (F)==========================================================================================================================
A. REVENUES
1) Revenue Limit Sources 8010-8099 + 1,382,935 + 1,382,935 + 0 + 1,382,935 0 0.00%
2) Federal Revenues 8100-8299 + 16,935,472 + 16,935,472 + 1,963,927 + 13,366,808 (3,568,664) -21.07%
3) Other State Revenues 8300-8599 + 49,205,228 + 49,205,228 + 35,576,568 + 24,317,118 (24,888,110) -50.58%
4) Other Local Revenues 8600-8799 + 797,526 + 797,526 + 80,028 + 274,768 (522,758) -65.55%
5) TOTAL, REVENUES = 68,321,161 = 68,321,161 = 37,620,523 = 39,341,629
================================================================================================== B. EXPENDITURES
1) Certificated Salaries 1000-1999 + 20,535,382 + 20,466,846 + 2,069,774 + 6,659,248 13,807,598 67.46%
2) Classified Salaries 2000-2999 + 3,669,841 + 4,818,649 + 831,397 + 2,652,186 2,166,463 44.96%
3) Employee Benefits 3000-3999 + 4,928,259 + 3,442,568 + 204,381 + 2,361,497 1,081,071 31.40%
4) Books and Supplies 4000-4999 + 4,841,904 + 27,578,885 + 364,823 + 23,520,705 4,058,180 14.71%
5) Services, Other Operating Expenses 5000-5999 + 2,610,502 + 3,078,066 + 131,244 + 1,565,483 1,512,583 49.14%
6) Capital Outlay 6000-6599 + 2,693,961 + 3,030,961 + 892,460 + 2,304,993 725,968 23.95%
7) Other Outgo 7100-7299 + 28,700,000 + 5,452,631 + 0 + 0 5,452,631 100.00%
8) Direct Support/Indirect Costs 7300-7399 + 341,312 + 452,555 + 0 + 277,517 175,038 38.68%
9) TOTAL, EXPENDITURES = 68,321,161 = 68,321,161 = 4,494,079 = 39,341,629 ================================================================================================== ================================================================================================== C. EXCESS (DEFICIENCY) OF REVENUES
OVER EXPENDITURES BEFORE OTHER FINANCING SOURCES AND USES (A5 - B9) = 0 = 0 = 33,126,444 = 0
================================================================================================== ================================================================================================== D. OTHER FINANCING SOURCES/USES
1) Interfund Transfers a) Transfers In 8910-8929 + 0 + 0 + 0 + 0 0 0.00%
b) Transfers Out 7610-7629 - 0 - 0 - 0 - 0 0 0.00%
2) Other Sources/Uses a) Sources 8930-8979 + 0 + 0 + 0 + 0 0 0.00%
b) Uses 7630-7699 - 0 - 0 - 0 - 0 0 0.00%
3) Contributions to Restricted Programs 8980-8999 + 0 + 0 + 0 + 0 0 0.00%
4) TOTAL, OTHER FINANCING SOURCES/USES= 0 = 0 = 0 = 0
==================================================================================================
12/08/00 02:11 PM
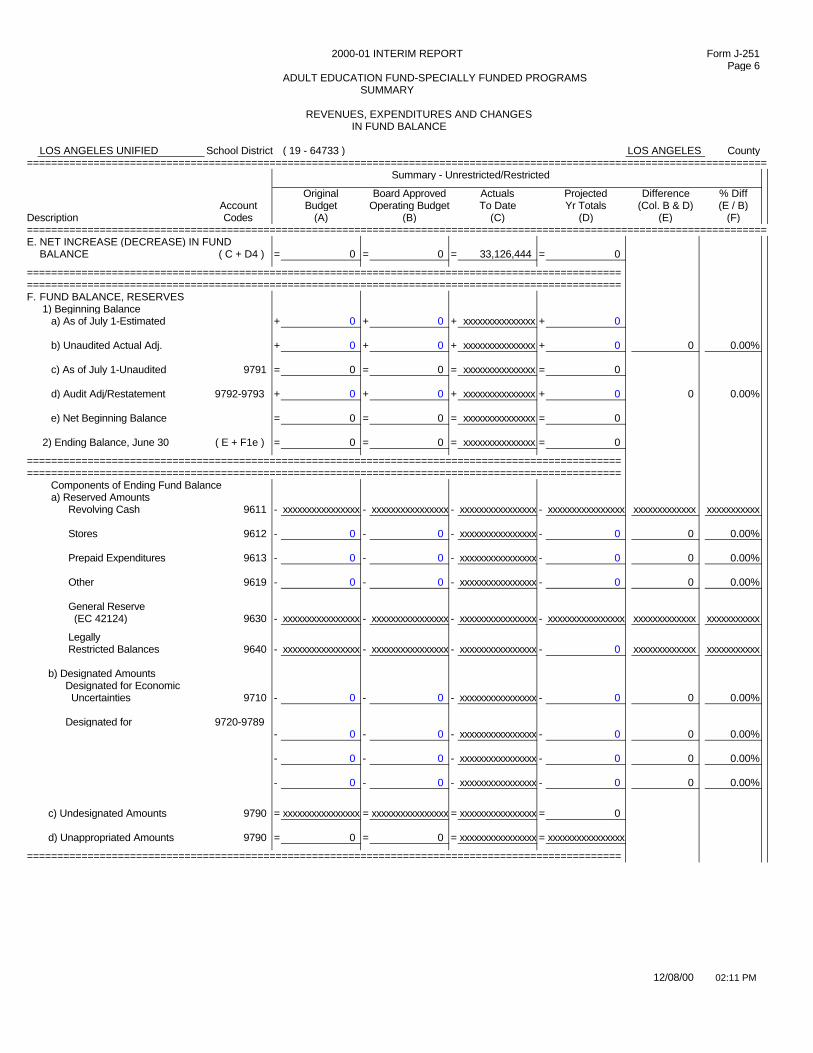
2000-01 INTERIM REPORT Form J-251 Page 6 ADULT EDUCATION FUND-SPECIALLY FUNDED PROGRAMS
SUMMARY REVENUES, EXPENDITURES AND CHANGES IN FUND BALANCE
LOS ANGELES UNIFIED School District ( 19 - 64733 ) LOS ANGELES County
========================================================================================================================== Summary - Unrestricted/Restricted
Original Board Approved Actuals Projected Difference % Diff Account Budget Operating Budget To Date Yr Totals (Col. B & D) (E / B)
Description Codes (A) (B) (C) (D) (E) (F)==========================================================================================================================E. NET INCREASE (DECREASE) IN FUND
BALANCE ( C + D4 ) = 0 = 0 = 33,126,444 = 0
================================================================================================== ================================================================================================== F. FUND BALANCE, RESERVES
1) Beginning Balance a) As of July 1-Estimated + 0 + 0 + xxxxxxxxxxxxxxx + 0
b) Unaudited Actual Adj. + 0 + 0 + xxxxxxxxxxxxxxx + 0 0 0.00%
c) As of July 1-Unaudited 9791 = 0 = 0 = xxxxxxxxxxxxxxx = 0
d) Audit Adj/Restatement 9792-9793 + 0 + 0 + xxxxxxxxxxxxxxx + 0 0 0.00%
e) Net Beginning Balance = 0 = 0 = xxxxxxxxxxxxxxx = 0
2) Ending Balance, June 30 ( E + F1e ) = 0 = 0 = xxxxxxxxxxxxxxx = 0
================================================================================================== ==================================================================================================
Components of Ending Fund Balance a) Reserved Amounts Revolving Cash 9611 - xxxxxxxxxxxxxxxx - xxxxxxxxxxxxxxxx - xxxxxxxxxxxxxxxx - xxxxxxxxxxxxxxxx xxxxxxxxxxxxx xxxxxxxxxxx
Stores 9612 - 0 - 0 - xxxxxxxxxxxxxxxx - 0 0 0.00%
Prepaid Expenditures 9613 - 0 - 0 - xxxxxxxxxxxxxxxx - 0 0 0.00%
Other 9619 - 0 - 0 - xxxxxxxxxxxxxxxx - 0 0 0.00%
General Reserve (EC 42124) 9630 - xxxxxxxxxxxxxxxx - xxxxxxxxxxxxxxxx - xxxxxxxxxxxxxxxx - xxxxxxxxxxxxxxxx xxxxxxxxxxxxx xxxxxxxxxxx
Legally Restricted Balances 9640 - xxxxxxxxxxxxxxxx - xxxxxxxxxxxxxxxx - xxxxxxxxxxxxxxxx - 0 xxxxxxxxxxxxx xxxxxxxxxxx
b) Designated Amounts Designated for Economic Uncertainties 9710 - 0 - 0 - xxxxxxxxxxxxxxxx - 0 0 0.00% Designated for 9720-9789
- 0 - 0 - xxxxxxxxxxxxxxxx - 0 0 0.00%
- 0 - 0 - xxxxxxxxxxxxxxxx - 0 0 0.00%
- 0 - 0 - xxxxxxxxxxxxxxxx - 0 0 0.00%
c) Undesignated Amounts 9790 = xxxxxxxxxxxxxxxx = xxxxxxxxxxxxxxxx = xxxxxxxxxxxxxxxx = 0 d) Unappropriated Amounts 9790 = 0 = 0 = xxxxxxxxxxxxxxxx = xxxxxxxxxxxxxxxx
==================================================================================================
12/08/00 02:11 PM
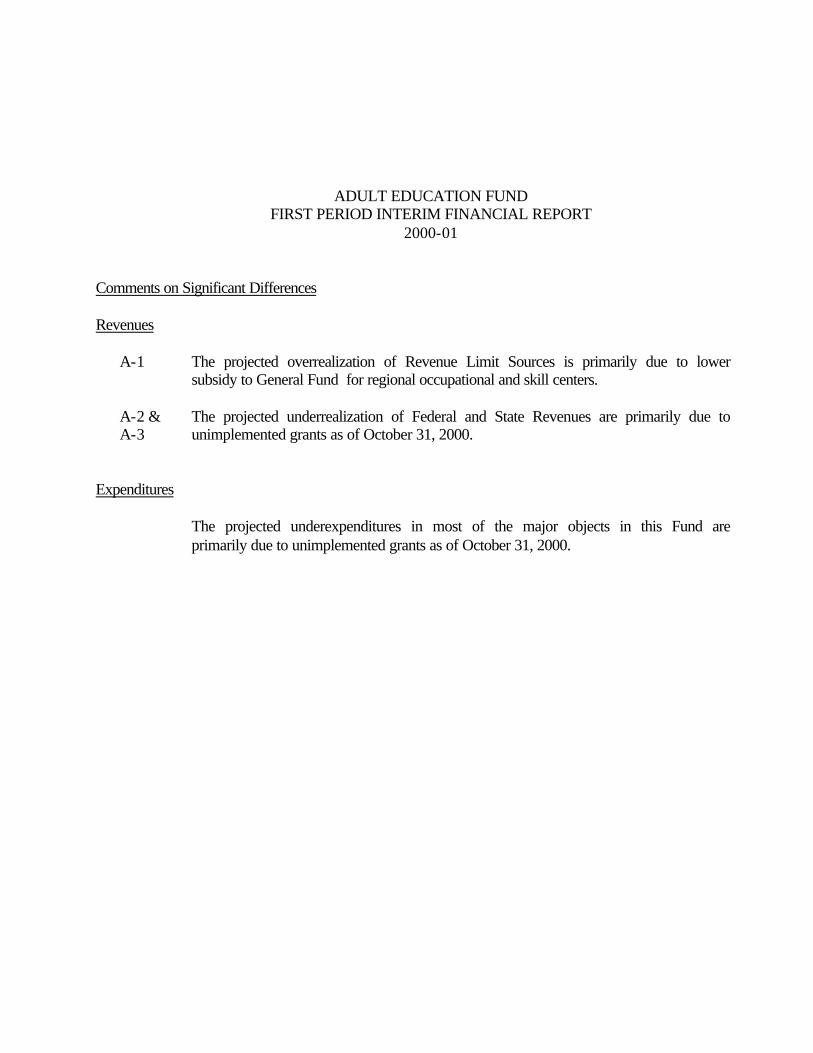
ADULT EDUCATION FUND FIRST PERIOD INTERIM FINANCIAL REPORT
2000-01 Comments on Significant Differences Revenues A-1 The projected overrealization of Revenue Limit Sources is primarily due to lower
subsidy to General Fund for regional occupational and skill centers. A-2 & The projected underrealization of Federal and State Revenues are primarily due to
A-3 unimplemented grants as of October 31, 2000. Expenditures The projected underexpenditures in most of the major objects in this Fund are
primarily due to unimplemented grants as of October 31, 2000.
X First Interim 2000-01 INTERIM REPORT 19 | 64733 | J-251
Second Interim CHILD DEVELOPMENT FUND CALIFORNIA SUMMARY DEPARTMENT OF EDUCATION
Third Interim - End of Year Projection Form J-251 (Rev 01/95)REVENUES, EXPENDITURES AND CHANGES
IN FUND BALANCE
LOS ANGELES UNIFIED School District LOS ANGELES County==========================================================================================================================
Summary - Unrestricted/Restricted Original Board Approved Actuals Projected Difference % Diff Account Budget Operating Budget To Date Yr Totals (Col. B & D) (E / B)
Description Codes (A) (B) (C) (D) (E) (F)==========================================================================================================================
A. REVENUES
1) Revenue Limit Sources 8010-8099 + 0 + 0 + 0 + 0 0 0.00%
2) Federal Revenues 8100-8299 + 22,820,902 + 22,820,902 + 9,582,064 + 20,544,730 (2,276,172) -9.97%
3) Other State Revenues 8300-8599 + 65,438,519 + 65,438,519 + 30,427,454 + 59,466,050 (5,972,469) -9.13%
4) Other Local Revenues 8600-8799 + 2,625,767 + 2,625,767 + 693,775 + 2,191,267 (434,500) -16.55%
5) TOTAL, REVENUES = 90,885,188 = 90,885,188 = 40,703,293 = 82,202,047
================================================================================================== B. EXPENDITURES
1) Certificated Salaries 1000-1999 + 31,528,801 + 31,870,279 + 7,908,914 + 29,905,102 1,965,177 6.17%
2) Classified Salaries 2000-2999 + 33,697,930 + 33,028,167 + 9,137,956 + 32,079,523 948,644 2.87%
3) Employee Benefits 3000-3999 + 16,020,545 + 15,683,172 + 2,306,911 + 14,845,273 837,899 5.34%
4) Books and Supplies 4000-4999 + 4,831,647 + 5,250,557 + 349,530 + 3,974,222 1,276,335 24.31%
5) Services, Other Operating Expenses 5000-5999 + 4,139,339 + 4,149,839 + 383,307 + 3,168,026 981,813 23.66%
6) Capital Outlay 6000-6599 + 4,545,608 + 3,604,746 + 376,167 + 2,573,892 1,030,854 28.60%
7) Other Outgo 7100-7299 + 3,656,519 + 4,390,063 + 431,909 + 2,389,076 2,000,987 45.58%
8) Direct Support/Indirect Costs 7300-7399 + 0 + 443,566 + 2,210 + 0 443,566 100.00%
9) TOTAL, EXPENDITURES = 98,420,389 = 98,420,389 = 20,896,904 = 88,935,114
================================================================================================== ================================================================================================== C. EXCESS (DEFICIENCY) OF REVENUES
OVER EXPENDITURES BEFORE OTHER FINANCING SOURCES AND USES (A5 - B9) = (7,535,201) = (7,535,201) = 19,806,389 = (6,733,067)
================================================================================================== ================================================================================================== D. OTHER FINANCING SOURCES/USES
1) Interfund Transfers a) Transfers In 8910-8929 + 6,396,411 + 6,396,411 + 0 + 10,603,958 4,207,547 65.78%
b) Transfers Out 7610-7629 - 0 - 0 - 0 - 0 0 0.00%
2) Other Sources/Uses a) Sources 8930-8979 + 0 + 0 + 0 + 0 0 0.00%
b) Uses 7630-7699 - 0 - 0 - 0 - 0 0 0.00%
3) Contributions to Restricted Programs 8980-8999 + 0 + 0 + 0 + 0 0 0.00%
4) TOTAL, OTHER FINANCING SOURCES/USES= 6,396,411 = 6,396,411 = 0 = 10,603,958
==================================================================================================
12/08/00 02:11 PM

2000-01 INTERIM REPORT Form J-251 Page 2 CHILD DEVELOPMENT FUND
SUMMARY REVENUES, EXPENDITURES AND CHANGES
IN FUND BALANCE
LOS ANGELES UNIFIED School District (19 - 64733) LOS ANGELES County==========================================================================================================================
Summary - Unrestricted/Restricted Original Board Approved Actuals Projected Difference % Diff Account Budget Operating Budget To Date Yr Totals (Col. B & D) (E / B)
Description Codes (A) (B) (C) (D) (E) (F)==========================================================================================================================E. NET INCREASE (DECREASE) IN FUND
BALANCE ( C + D4 ) = (1,138,790) = (1,138,790) = 19,806,389 = 3,870,891
================================================================================================== ================================================================================================== F. FUND BALANCE, RESERVES
1) Beginning Balance a) As of July 1-Estimated + 1,298,980 + 1,298,980 + xxxxxxxxxxxxxxx + 1,298,980
b) Unaudited Actual Adj. + 0 + 0 + xxxxxxxxxxxxxxx + 0 0 0.00%
c) As of July 1-Unaudited 9791 = 1,298,980 = 1,298,980 = xxxxxxxxxxxxxxx = 1,298,980
d) Audit Adj/Restatement 9792-9793 + 0 + 0 + xxxxxxxxxxxxxxx + 0 0 0.00%
e) Net Beginning Balance = 1,298,980 = 1,298,980 = xxxxxxxxxxxxxxx = 1,298,980
2) Ending Balance, June 30 ( E + F1e ) = 160,190 = 160,190 = xxxxxxxxxxxxxxx = 5,169,871
================================================================================================== ==================================================================================================
Components of Ending Fund Balance a) Reserved Amounts Revolving Cash 9611 - 60,880 - 60,880 - xxxxxxxxxxxxxxx - 60,001 879 1.44%
Stores 9612 - 99,310 - 99,310 - xxxxxxxxxxxxxxx - 100,000 (690) -0.69%
Prepaid Expenditures 9613 - 0 - 0 - xxxxxxxxxxxxxxx - 0 0 0.00%
Other 9619 - 0 - 0 - xxxxxxxxxxxxxxx - 0 0 0.00%
General Reserve (EC 42124) 9630 - 0 - 0 - xxxxxxxxxxxxxxx - 0 0 0.00%
Legally Restricted Balances 9640 - xxxxxxxxxxxxxxxx - xxxxxxxxxxxxxxxx - xxxxxxxxxxxxxxx - 0 xxxxxxxxxxxxxx xxxxxxxxxxx
b) Designated Amounts Designated for Economic Uncertainties 9710 - 0 - 0 - xxxxxxxxxxxxxxx - 0 0 0.00% Designated for 9720-9789
Donations - 0 - 0 - xxxxxxxxxxxxxxx - 66,078 (66,078) 0.00%
A & I Child Development - 0 - 0 - xxxxxxxxxxxxxxx - 51,017 (51,017) 0.00%
SDEP-Film, Photo, Other - 0 - 0 - xxxxxxxxxxxxxxx - 694 (694) 0.00%
Repayment Revolving A & I Fund - 0 - 0 - xxxxxxxxxxxxxxx - 147,000 (147,000) 0.00%
CD-Dist. Admin - Others - 0 - 0 - xxxxxxxxxxxxxxx - 499,196 (499,196) 0.00%
Compensation - 0 - 0 - xxxxxxxxxxxxxxx - 4,245,885 (4,245,885) 0.00%
c) Undesignated Amounts 9790 = xxxxxxxxxxxxxxxx = xxxxxxxxxxxxxxxx = xxxxxxxxxxxxxxx = 0 d) Unappropriated Amounts 9790 = 0 = 0 = xxxxxxxxxxxxxxx = xxxxxxxxxxxxxxxx
==================================================================================================
12/08/00 02:11 PM
2000-01 INTERIM REPORT Form J-251Page 3
CHILD DEVELOPMENT FUND-REGULAR PROGRAM SUMMARY
REVENUES, EXPENDITURES AND CHANGES IN FUND BALANCE
LOS ANGELES UNIFIED School District (19 - 64733) LOS ANGELES County==========================================================================================================================
Summary - Unrestricted/Restricted
Original Board Approved Actuals Projected Difference % Diff Account Budget Operating Budget To Date Yr Totals (Col. B & D) (E / B)
Description Codes (A) (B) (C) (D) (E) (F)==========================================================================================================================
A. REVENUES
1) Revenue Limit Sources 8010-8099 + 0 + 0 + 0 + 0 0.00%
2) Federal Revenues 8100-8299 + 22,820,902 + 22,820,902 + 9,582,064 + 20,544,730 (2,276,172) -9.97%
3) Other State Revenues 8300-8599 + 48,410,555 + 48,410,555 + 24,619,745 + 48,242,405 (168,150) -0.35%
4) Other Local Revenues 8600-8799 + 810,000 + 810,000 + 352,136 + 1,020,000 210,000 25.93%
5) TOTAL, REVENUES = 72,041,457 = 72,041,457 = 34,553,945 = 69,807,135
================================================================================================== B. EXPENDITURES
1) Certificated Salaries 1000-1999 + 26,361,625 + 26,361,625 + 7,229,279 + 26,073,223 288,402 1.09%
2) Classified Salaries 2000-2999 + 28,409,953 + 28,418,569 + 8,437,339 + 28,386,219 32,350 0.11%
3) Employee Benefits 3000-3999 + 13,884,425 + 13,885,439 + 2,196,465 + 13,304,645 580,794 4.18%
4) Books and Supplies 4000-4999 + 4,086,533 + 4,076,903 + 300,103 + 3,064,249 1,012,654 24.84%
5) Services, Other Operating Expenses 5000-5999 + 3,959,793 + 3,959,793 + 377,446 + 3,081,398 878,395 22.18%
6) Capital Outlay 6000-6599 + 90,785 + 90,785 + 143,336 + 985,023 (894,238) -985.01%
7) Other Outgo 7100-7299 + 3,122,350 + 3,122,350 + 431,909 + 2,074,650 1,047,700 33.55%
8) Direct Support/Indirect Costs 7300-7399 + (338,806) + (338,806) + (737) + (429,205) 90,399 -26.68%
9) TOTAL, EXPENDITURES = 79,576,658 = 79,576,658 = 19,115,140 = 76,540,202
================================================================================================== ================================================================================================== C. EXCESS (DEFICIENCY) OF REVENUES
OVER EXPENDITURES BEFORE OTHER FINANCING SOURCES AND USES (A5 - B9) = (7,535,201) = (7,535,201) = 15,438,805 = (6,733,067)
================================================================================================== ================================================================================================== D. OTHER FINANCING SOURCES/USES
1) Interfund Transfers a) Transfers In 8910-8929 + 6,396,411 + 6,396,411 + 0 + 10,603,958 4,207,547 65.78%
b) Transfers Out 7610-7629 - 0 - 0 - 0 - 0 0 0.00%
2) Other Sources/Uses a) Sources 8930-8979 + 0 + 0 + 0 + 0 0 0.00%
b) Uses 7630-7699 - 0 - 0 - 0 - 0 0 0.00%
3) Contributions to Restricted Programs 8980-8999 + 0 + 0 + 0 + 0 0 0.00%
4) TOTAL, OTHER FINANCING SOURCES/USES= 6,396,411 = 6,396,411 = 0 = 10,603,958
==================================================================================================
12/08/00 02:11 PM

2000-01 INTERIM REPORT Form J-251 Page 4 CHILD DEVELOPMENT FUND-REGULAR PROGRAM SUMMARY
REVENUES, EXPENDITURES AND CHANGES IN FUND BALANCE
LOS ANGELES UNIFIED School District (19 - 64733) LOS ANGELES County
========================================================================================================================== Summary - Unrestricted/Restricted
Original Board Approved Actuals Projected Difference % Diff Account Budget Operating Budget To Date Yr Totals (Col. B & D) (E / B)
Description Codes (A) (B) (C) (D) (E) (F)==========================================================================================================================E. NET INCREASE (DECREASE) IN FUND
BALANCE ( C + D4 ) = (1,138,790) = (1,138,790) = 15,438,805 = 3,870,891
================================================================================================== ================================================================================================== F. FUND BALANCE, RESERVES
1) Beginning Balance a) As of July 1- Estimated + 1,298,980 + 1,298,980 + xxxxxxxxxxxxxxx + 1,298,980
b) Unaudited Actual Adj. + 0 + + xxxxxxxxxxxxxxx + 0 0 0.00%
c) As of July 1-Unaudited 9791 = 1,298,980 = 1,298,980 = xxxxxxxxxxxxxxx = 1,298,980
d) Audit Adj/Restatement 9792-9793 + 0 + + xxxxxxxxxxxxxxx + 0 0 0.00%
e) Net Beginning Balance = 1,298,980 = 1,298,980 = xxxxxxxxxxxxxxx = 1,298,980
2) Ending Balance, June 30 ( E + F1e ) = 160,190 = 160,190 = xxxxxxxxxxxxxxx = 5,169,871
================================================================================================== ==================================================================================================
Components of Ending Fund Balance a) Reserved Amounts Revolving Cash 9611 - 60,880 - 60,880 - xxxxxxxxxxxxxxxx - 60,001 879 1.44%
Stores 9612 - 99,310 - 99,310 - xxxxxxxxxxxxxxxx - 100,000 (690) -0.69%
Prepaid Expenditures 9613 - - - xxxxxxxxxxxxxxxx - 0 0.00%
Other 9619 - - - xxxxxxxxxxxxxxxx - 0 0.00%
General Reserve (EC 42124) 9630 - - - xxxxxxxxxxxxxxxx - 0 0.00%
Legally Restricted Balances 9640 - xxxxxxxxxxxxxxxx - xxxxxxxxxxxxxxxx - xxxxxxxxxxxxxxxx - xxxxxxxxxxxxxxxx xxxxxxxxxxxxxx xxxxxxxxxxx
b) Designated Amounts Designated for Economic Uncertainties 9710 - - - xxxxxxxxxxxxxxxx - 0 0.00% Designated for 9720-9789
Donations - - - xxxxxxxxxxxxxxxx - 66,078 (66,078) 0.00%
A & I Child Development - - - xxxxxxxxxxxxxxxx - 51,017 (51,017) 0.00%
SDEP-Film, Photo, Other - - - xxxxxxxxxxxxxxxx - 694 (694) 0.00%
Repayment Revolving A & I Fund - - - xxxxxxxxxxxxxxxx - 147,000 (147,000) 0.00%
CD-Dist. Admin - Others - - - xxxxxxxxxxxxxxxx - 499,196 (499,196) 0.00%
Compensation - - - xxxxxxxxxxxxxxxx - 4,245,885 (4,245,885) 0.00%
c) Undesignated Amounts 9790 = xxxxxxxxxxxxxxxx = xxxxxxxxxxxxxxxx =xxxxxxxxxxxxxxxx = 0 d) Unappropriated Amounts 9790 = 0 = 0 =xxxxxxxxxxxxxxxx = xxxxxxxxxxxxxxxx
==================================================================================================
12/08/00 02:11 PM
2000-01 INTERIM REPORT Form J-251Page 5
CHILD DEVELOPMENT FUND-SPECIALLY FUNDED PROGRAMS SUMMARY
REVENUES, EXPENDITURES AND CHANGES IN FUND BALANCE
LOS ANGELES UNIFIED School District (19 - 64733) LOS ANGELES County==========================================================================================================================
Summary - Unrestricted/Restricted
Original Board Approved Actuals Projected Difference % Diff Account Budget Operating Budget To Date Yr Totals (Col. B & D) (E / B)
Description Codes (A) (B) (C) (D) (E) (F)==========================================================================================================================
A. REVENUES
1) Revenue Limit Sources 8010-8099 + 0 + 0 + 0 + 0 0 0.00%
2) Federal Revenues 8100-8299 + 0 + 0 + 0 + 0 0 0.00%
3) Other State Revenues 8300-8599 + 17,027,964 + 17,027,964 + 5,807,709 + 11,223,645 (5,804,319) -34.09%
4) Other Local Revenues 8600-8799 + 1,815,767 + 1,815,767 + 341,639 + 1,171,267 (644,500) -35.49%
5) TOTAL, REVENUES = 18,843,731 = 18,843,731 = 6,149,348 = 12,394,912
================================================================================================== B. EXPENDITURES
1) Certificated Salaries 1000-1999 + 5,167,176 + 5,508,654 + 679,635 + 3,831,879 1,676,775 30.44%
2) Classified Salaries 2000-2999 + 5,287,977 + 4,609,598 + 700,617 + 3,693,304 916,294 19.88%
3) Employee Benefits 3000-3999 + 2,136,120 + 1,797,733 + 110,446 + 1,540,628 257,105 14.30%
4) Books and Supplies 4000-4999 + 745,114 + 1,173,654 + 49,427 + 909,973 263,681 22.47%
5) Services, Other Operating Expenses 5000-5999 + 179,546 + 190,046 + 5,861 + 86,628 103,418 54.42%
6) Capital Outlay 6000-6599 + 4,454,823 + 3,513,961 + 232,831 + 1,588,869 1,925,092 54.78%
7) Other Outgo 7100-7299 + 534,169 + 1,267,713 + 0 + 314,426 953,287 75.20%
8) Direct Support/Indirect Costs 7300-7399 + 338,806 + 782,372 + 2,947 + 429,205 353,167 45.14%
9) TOTAL, EXPENDITURES = 18,843,731 = 18,843,731 = 1,781,764 = 12,394,912
================================================================================================== ================================================================================================== C. EXCESS (DEFICIENCY) OF REVENUES
OVER EXPENDITURES BEFORE OTHER FINANCING SOURCES AND USES (A5 - B9) = 0 = 0 = 4,367,584 = 0
================================================================================================== ================================================================================================== D. OTHER FINANCING SOURCES/USES
1) Interfund Transfers a) Transfers In 8910-8929 + 0 + 0 + 0 + 0 0 0.00%
b) Transfers Out 7610-7629 - 0 - 0 - 0 - 0 0 0.00%
2) Other Sources/Uses a) Sources 8930-8979 + 0 + 0 + 0 + 0 0 0.00%
b) Uses 7630-7699 - 0 - 0 - 0 - 0 0 0.00%
3) Contributions to Restricted Programs 8980-8999 + 0 + 0 + 0 + 0 0 0.00%
4) TOTAL, OTHER FINANCING SOURCES/USES= 0 = 0 = 0 = 0
==================================================================================================
12/08/00 02:11 PM
2000-01 INTERIM REPORT Form J-251 Page 6 CHILD DEVELOPMENT FUND-SPECIALLY FUNDED PROGRAMS
SUMMARY REVENUES, EXPENDITURES AND CHANGES IN FUND BALANCE
LOS ANGELES UNIFIED School District (19 - 64733) LOS ANGELES County
========================================================================================================================== Summary - Unrestricted/Restricted
Original Board Approved Actuals Projected Difference % Diff Account Budget Operating Budget To Date Yr Totals (Col. B & D) (E / B)
Description Codes (A) (B) (C) (D) (E) (F)==========================================================================================================================E. NET INCREASE (DECREASE) IN FUND
BALANCE ( C + D4 ) = 0 = 0 = 4,367,584 = 0
================================================================================================== ================================================================================================== F. FUND BALANCE, RESERVES
1) Beginning Balance a) As of July 1-Estimated + 0 + 0 + xxxxxxxxxxxxxxx + 0
b) Unaudited Actual Adj. + 0 + 0 + xxxxxxxxxxxxxxx + 0 0 0.00%
c) As of July 1-Unaudited 9791 = 0 = 0 = xxxxxxxxxxxxxxx = 0
d) Audit Adj/Restatement 9792-9793 + 0 + 0 + xxxxxxxxxxxxxxx + 0 0 0.00%
e) Net Beginning Balance = 0 = 0 = xxxxxxxxxxxxxxx = 0
2) Ending Balance, June 30 ( E + F1e ) = 0 = 0 = xxxxxxxxxxxxxxx = 0
================================================================================================== ==================================================================================================
Components of Ending Fund Balance a) Reserved Amounts Revolving Cash 9611 - xxxxxxxxxxxxxxxx - xxxxxxxxxxxxxxxx - xxxxxxxxxxxxxxxx - xxxxxxxxxxxxxxxx xxxxxxxxxxxxxx xxxxxxxxxxx
Stores 9612 - 0 - 0 - xxxxxxxxxxxxxxxx - 0 0 0.00%
Prepaid Expenditures 9613 - 0 - 0 - xxxxxxxxxxxxxxxx - 0 0 0.00%
Other 9619 - 0 - 0 - xxxxxxxxxxxxxxxx - 0 0 0.00%
General Reserve (EC 42124) 9630 - xxxxxxxxxxxxxxxx - xxxxxxxxxxxxxxxx - xxxxxxxxxxxxxxxx - xxxxxxxxxxxxxxxx xxxxxxxxxxxxxx xxxxxxxxxxx
Legally Restricted Balances 9640 - xxxxxxxxxxxxxxxx - xxxxxxxxxxxxxxxx - xxxxxxxxxxxxxxxx - 0 xxxxxxxxxxxxxx xxxxxxxxxxx
b) Designated Amounts Designated for Economic Uncertainties 9710 - 0 - 0 - xxxxxxxxxxxxxxxx - 0 0 0.00% Designated for 9720-9789
- 0 - 0 - xxxxxxxxxxxxxxxx - 0 0 0.00%
- 0 - 0 - xxxxxxxxxxxxxxxx - 0 0 0.00%
- 0 - 0 - xxxxxxxxxxxxxxxx - 0 0 0.00%
c) Undesignated Amounts 9790 = xxxxxxxxxxxxxxxx = xxxxxxxxxxxxxxxx =xxxxxxxxxxxxxxxx = 0 d) Unappropriated Amounts 9790 = 0 = 0 =xxxxxxxxxxxxxxxx = xxxxxxxxxxxxxxxx
==================================================================================================
12/08/00 02:11 PM
CHILD DEVELOPMENT FUND FIRST PERIOD INTERIM FINANCIAL REPORT
2000-01 Comments on Significant Differences Revenues A-2 The projected underrealization of Federal Revenues is primarily due to a contract
change that will transfer $2.0 million to Other State Revenues. A-3 The projected underrealization of Other State Revenues is primarily due to
unimplemented Specially Funded Program (SFP) grants as of October 31, 2000, ($4.3 million), unearned SFP revenues ($1.5 million), and unearned Regular Program revenues due to unfinished sites ($1.4 million); partially offset by the $2.0 million transfer from Federal Revenues.
A-4 The projected underrealization of Other Local Revenues is primarily due to
unimplemented grants as of October 31, 2000. Expenditures
B-1 to B-3 The projected underexpenditures in these Major Objects are primarily due to unimplemented grants of October 31, 2000.
B-4 to B-6 The projected underexpenditures in these Major Objects are primarily due to
unimplemented grants as of October 31, 2000, and partially due to balances which will be carried over to the next fiscal year or will be spent in other Major Objects.
B-7 The projected underexpenditure in this Major Object is due to unimplemented
grants as of October 31, 2000, and lower projected expenditures for PERS Savings Recapture.
Other Financing Sources/Uses 1) a) The projected overrealization of Interfund Transfers In is primarily due to a $ 4.2 million Fund Balance designation for a 7% compensation increase currently being negotiated.
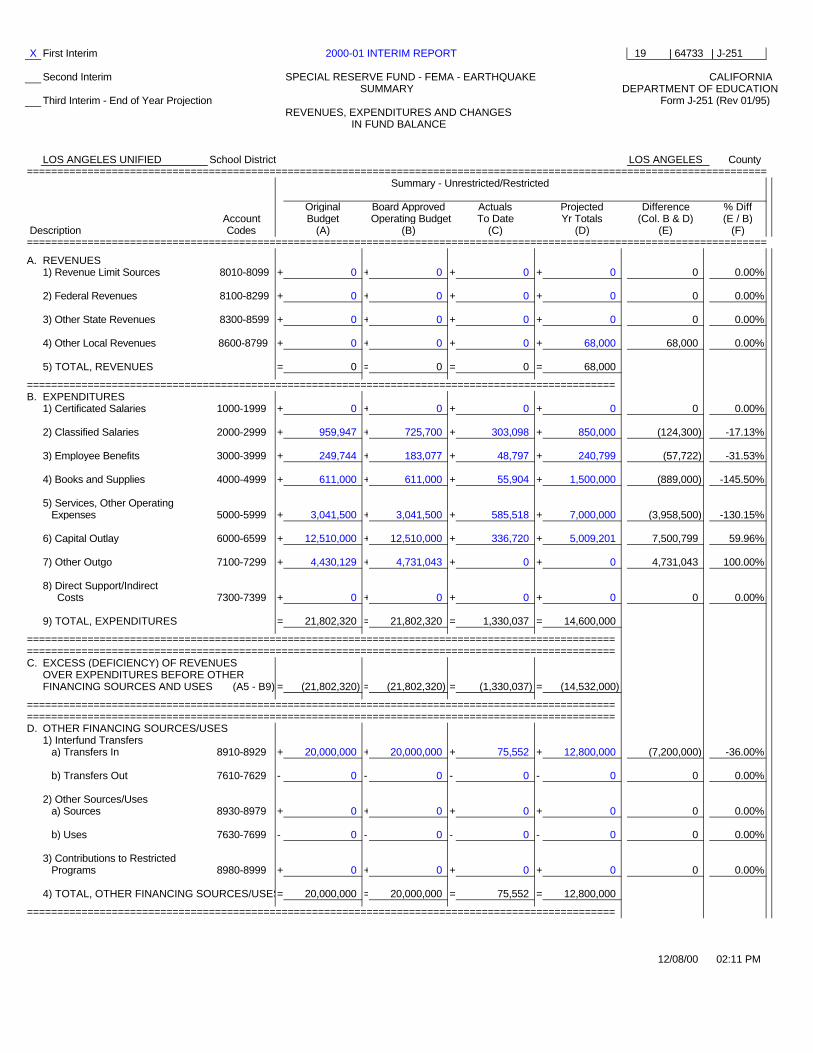
X First Interim 2000-01 INTERIM REPORT 19 | 64733 | J-251
Second Interim SPECIAL RESERVE FUND - FEMA - EARTHQUAKE CALIFORNIA SUMMARY DEPARTMENT OF EDUCATIONThird Interim - End of Year Projection Form J-251 (Rev 01/95)
REVENUES, EXPENDITURES AND CHANGES IN FUND BALANCE
LOS ANGELES UNIFIED School District LOS ANGELES County==========================================================================================================================
Summary - Unrestricted/Restricted Original Board Approved Actuals Projected Difference % Diff Account Budget Operating Budget To Date Yr Totals (Col. B & D) (E / B)
Description Codes (A) (B) (C) (D) (E) (F)==========================================================================================================================
A. REVENUES
1) Revenue Limit Sources 8010-8099 + 0 + 0 + 0 + 0 0 0.00%
2) Federal Revenues 8100-8299 + 0 + 0 + 0 + 0 0 0.00%
3) Other State Revenues 8300-8599 + 0 + 0 + 0 + 0 0 0.00%
4) Other Local Revenues 8600-8799 + 0 + 0 + 0 + 68,000 68,000 0.00%
5) TOTAL, REVENUES = 0 = 0 = 0 = 68,000
================================================================================================= B. EXPENDITURES
1) Certificated Salaries 1000-1999 + 0 + 0 + 0 + 0 0 0.00%
2) Classified Salaries 2000-2999 + 959,947 + 725,700 + 303,098 + 850,000 (124,300) -17.13%
3) Employee Benefits 3000-3999 + 249,744 + 183,077 + 48,797 + 240,799 (57,722) -31.53%
4) Books and Supplies 4000-4999 + 611,000 + 611,000 + 55,904 + 1,500,000 (889,000) -145.50%
5) Services, Other Operating Expenses 5000-5999 + 3,041,500 + 3,041,500 + 585,518 + 7,000,000 (3,958,500) -130.15%
6) Capital Outlay 6000-6599 + 12,510,000 + 12,510,000 + 336,720 + 5,009,201 7,500,799 59.96%
7) Other Outgo 7100-7299 + 4,430,129 + 4,731,043 + 0 + 0 4,731,043 100.00%
8) Direct Support/Indirect Costs 7300-7399 + 0 + 0 + 0 + 0 0 0.00%
9) TOTAL, EXPENDITURES = 21,802,320 = 21,802,320 = 1,330,037 = 14,600,000
================================================================================================= ================================================================================================= C. EXCESS (DEFICIENCY) OF REVENUES
OVER EXPENDITURES BEFORE OTHER FINANCING SOURCES AND USES (A5 - B9) = (21,802,320) = (21,802,320) = (1,330,037) = (14,532,000)
================================================================================================= ================================================================================================= D. OTHER FINANCING SOURCES/USES
1) Interfund Transfers a) Transfers In 8910-8929 + 20,000,000 + 20,000,000 + 75,552 + 12,800,000 (7,200,000) -36.00%
b) Transfers Out 7610-7629 - 0 - 0 - 0 - 0 0 0.00%
2) Other Sources/Uses a) Sources 8930-8979 + 0 + 0 + 0 + 0 0 0.00%
b) Uses 7630-7699 - 0 - 0 - 0 - 0 0 0.00%
3) Contributions to Restricted Programs 8980-8999 + 0 + 0 + 0 + 0 0 0.00%
4) TOTAL, OTHER FINANCING SOURCES/USES= 20,000,000 = 20,000,000 = 75,552 = 12,800,000
=================================================================================================
12/08/00 02:11 PM

2000-01 INTERIM REPORT Form J-251 Page 2 SPECIAL RESERVE FUND - FEMA - EARTHQUAKE
SUMMARY REVENUES, EXPENDITURES AND CHANGES
IN FUND BALANCE
LOS ANGELES UNIFIED School District ( 19 - 64733 ) LOS ANGELES County==========================================================================================================================
Summary - Unrestricted/Restricted Original Board Approved Actuals Projected Difference % Diff Account Budget Operating Budget To Date Yr Totals (Col. B & D) (E / B)
Description Codes (A) (B) (C) (D) (E) (F)==========================================================================================================================E. NET INCREASE (DECREASE) IN FUND
BALANCE ( C + D4 ) = (1,802,320) = (1,802,320) = (1,254,485) = (1,732,000)
================================================================================================= ================================================================================================= F. FUND BALANCE, RESERVES
1) Beginning Balance a) As of July 1-Estimated + 1,802,320 + 1,802,320 + xxxxxxxxxxxxxxx + 1,802,320
b) Unaudited Actual Adj. + 0 + 0 + xxxxxxxxxxxxxxx + 0 0 0.00%
c) As of July 1-Unaudited 9791 = 1,802,320 = 1,802,320 = xxxxxxxxxxxxxxx = 1,802,320
d) Audit Adj/Restatement 9792-9793 + 0 + 0 + xxxxxxxxxxxxxxx + 0 0 0.00%
e) Net Beginning Balance = 1,802,320 = 1,802,320 = xxxxxxxxxxxxxxx = 1,802,320
2) Ending Balance, June 30 ( E + F1e ) = 0 = 0 = xxxxxxxxxxxxxxx = 70,320
================================================================================================= =================================================================================================
Components of Ending Fund Balance a) Reserved Amounts Revolving Cash 9611 - 0 - 0 - xxxxxxxxxxxxxxx - 0 0 0.00%
Stores 9612 - 0 - 0 - xxxxxxxxxxxxxxx - 0 0 0.00%
Prepaid Expenditures 9613 - 0 - 0 - xxxxxxxxxxxxxxx - 0 0 0.00%
Other 9619 - 0 - 0 - xxxxxxxxxxxxxxx - 0 0 0.00%
General Reserve (EC 42124) 9630 - 0 - 0 - xxxxxxxxxxxxxxx - 0 0 0.00%
Legally Restricted Balances 9640 - xxxxxxxxxxxxxxx - xxxxxxxxxxxxxxx - xxxxxxxxxxxxxxx - xxxxxxxxxxxxxxx xxxxxxxxxxxxxxx xxxxxxxxxxx
b) Designated Amounts Designated for Economic Uncertainties 9710 - 0 - 0 - xxxxxxxxxxxxxxx - 0 0 0.00% Designated for 9720-9789
Carryover - - 0 - xxxxxxxxxxxxxxx - 2,057 (2,057) 0.00%
Compensation - 0 - 0 - xxxxxxxxxxxxxxx - 68,263 (68,263) 0.00%
- 0 - 0 - xxxxxxxxxxxxxxx - 0 0 0.00%
c) Undesignated Amounts 9790 = xxxxxxxxxxxxxxx =xxxxxxxxxxxxxxx = xxxxxxxxxxxxxxx = 0 d) Unappropriated Amounts 9790 = 0 = 0 = xxxxxxxxxxxxxxx = xxxxxxxxxxxxxxx
=================================================================================================
12/08/00 02:11 PM

SPECIAL RESERVE FUND – FEMA – EARTHQUAKE FIRST PERIOD INTERIM FINANCIAL REPORT
2000-01
General Comments Revenues from Federal and State Sources for the 1994 Northridge Earthquake
expenditures are initially recorded in the General Fund – Regular Program and later transferred as Interfund Transfers In to this Fund.
Since 1994, the District has recognized $110.1 million from the Federal Emergency
Management Agency (FEMA) and $13.4 million from the State for a total of $123.5 million as eligible for claims reimbursements out of the $148.1 million in recorded expenditures. It is anticipated that $14.6 million additional expenditures will be incurred in 2000-01, and that reimbursements from Federal and State for these expenditures are estimated at $11.8 million and $1.0 million respectively. The balance of $1.8 million will be paid by the District.
Comments on Significant Diferrences Expenditures B-2 to B-5 The projected overexpenditures are due to earthquake repair/maintenance projects
being started this fiscal year rather than the following year as planned. In-house personnel and contract services are being utilized for most of the projects and more special job cost materials are needed this year. The projected overexpenditures in these major objects will be covered by budget transfers from Capital Outlay and Other Outgo ( Pending Distribution).
B-6 The projected underexpenditures in this major object is due to fewer than
anticipated projects this fiscal year.
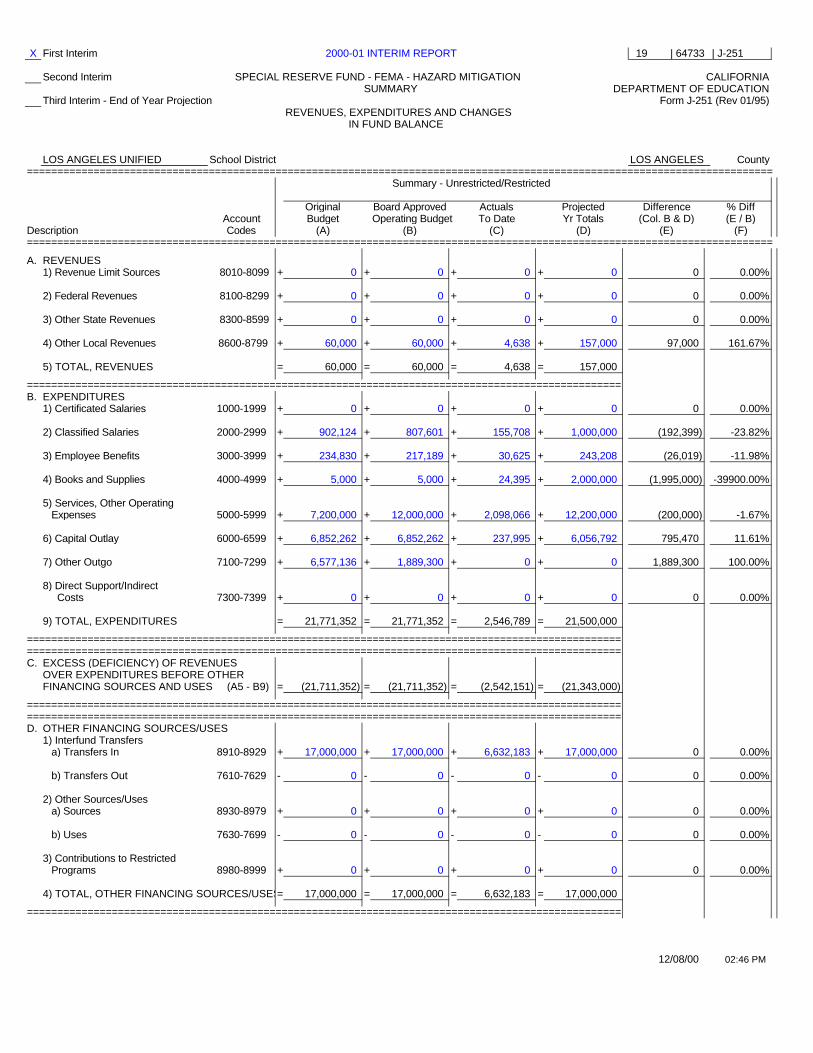
X First Interim 2000-01 INTERIM REPORT 19 | 64733 | J-251
Second Interim SPECIAL RESERVE FUND - FEMA - HAZARD MITIGATION CALIFORNIA SUMMARY DEPARTMENT OF EDUCATIONThird Interim - End of Year Projection Form J-251 (Rev 01/95)
REVENUES, EXPENDITURES AND CHANGES IN FUND BALANCE
LOS ANGELES UNIFIED School District LOS ANGELES County===========================================================================================================================
Summary - Unrestricted/Restricted Original Board Approved Actuals Projected Difference % Diff Account Budget Operating Budget To Date Yr Totals (Col. B & D) (E / B)
Description Codes (A) (B) (C) (D) (E) (F)===========================================================================================================================
A. REVENUES
1) Revenue Limit Sources 8010-8099 + 0 + 0 + 0 + 0 0 0.00%
2) Federal Revenues 8100-8299 + 0 + 0 + 0 + 0 0 0.00%
3) Other State Revenues 8300-8599 + 0 + 0 + 0 + 0 0 0.00%
4) Other Local Revenues 8600-8799 + 60,000 + 60,000 + 4,638 + 157,000 97,000 161.67%
5) TOTAL, REVENUES = 60,000 = 60,000 = 4,638 = 157,000
================================================================================================== B. EXPENDITURES
1) Certificated Salaries 1000-1999 + 0 + 0 + 0 + 0 0 0.00%
2) Classified Salaries 2000-2999 + 902,124 + 807,601 + 155,708 + 1,000,000 (192,399) -23.82%
3) Employee Benefits 3000-3999 + 234,830 + 217,189 + 30,625 + 243,208 (26,019) -11.98%
4) Books and Supplies 4000-4999 + 5,000 + 5,000 + 24,395 + 2,000,000 (1,995,000) -39900.00%
5) Services, Other Operating Expenses 5000-5999 + 7,200,000 + 12,000,000 + 2,098,066 + 12,200,000 (200,000) -1.67%
6) Capital Outlay 6000-6599 + 6,852,262 + 6,852,262 + 237,995 + 6,056,792 795,470 11.61%
7) Other Outgo 7100-7299 + 6,577,136 + 1,889,300 + 0 + 0 1,889,300 100.00%
8) Direct Support/Indirect Costs 7300-7399 + 0 + 0 + 0 + 0 0 0.00%
9) TOTAL, EXPENDITURES = 21,771,352 = 21,771,352 = 2,546,789 = 21,500,000
================================================================================================== ================================================================================================== C. EXCESS (DEFICIENCY) OF REVENUES
OVER EXPENDITURES BEFORE OTHER FINANCING SOURCES AND USES (A5 - B9) = (21,711,352) = (21,711,352) = (2,542,151) = (21,343,000)
================================================================================================== ================================================================================================== D. OTHER FINANCING SOURCES/USES
1) Interfund Transfers a) Transfers In 8910-8929 + 17,000,000 + 17,000,000 + 6,632,183 + 17,000,000 0 0.00%
b) Transfers Out 7610-7629 - 0 - 0 - 0 - 0 0 0.00%
2) Other Sources/Uses a) Sources 8930-8979 + 0 + 0 + 0 + 0 0 0.00%
b) Uses 7630-7699 - 0 - 0 - 0 - 0 0 0.00%
3) Contributions to Restricted Programs 8980-8999 + 0 + 0 + 0 + 0 0 0.00%
4) TOTAL, OTHER FINANCING SOURCES/USES= 17,000,000 = 17,000,000 = 6,632,183 = 17,000,000
==================================================================================================
12/08/00 02:46 PM
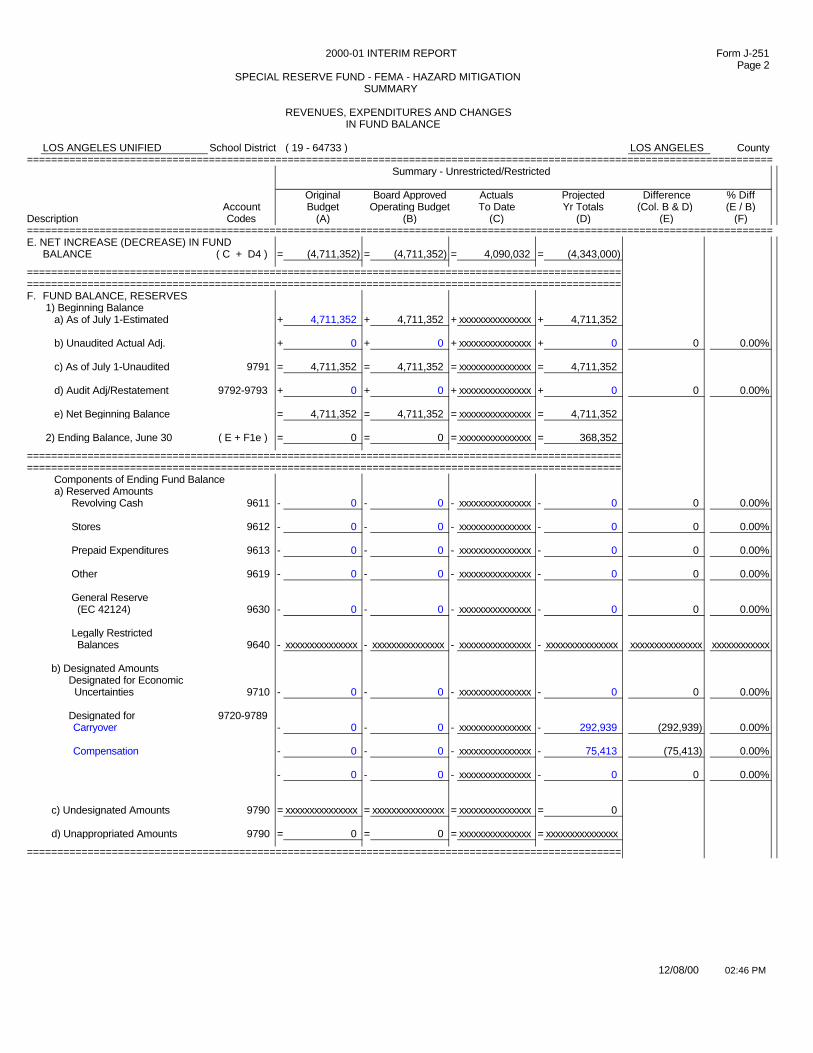
2000-01 INTERIM REPORT Form J-251 Page 2 SPECIAL RESERVE FUND - FEMA - HAZARD MITIGATION
SUMMARY REVENUES, EXPENDITURES AND CHANGES
IN FUND BALANCE
LOS ANGELES UNIFIED School District ( 19 - 64733 ) LOS ANGELES County===========================================================================================================================
Summary - Unrestricted/Restricted Original Board Approved Actuals Projected Difference % Diff Account Budget Operating Budget To Date Yr Totals (Col. B & D) (E / B)
Description Codes (A) (B) (C) (D) (E) (F)===========================================================================================================================E. NET INCREASE (DECREASE) IN FUND
BALANCE ( C + D4 ) = (4,711,352) = (4,711,352) = 4,090,032 = (4,343,000)
================================================================================================== ================================================================================================== F. FUND BALANCE, RESERVES
1) Beginning Balance a) As of July 1-Estimated + 4,711,352 + 4,711,352 + xxxxxxxxxxxxxxx + 4,711,352
b) Unaudited Actual Adj. + 0 + 0 + xxxxxxxxxxxxxxx + 0 0 0.00%
c) As of July 1-Unaudited 9791 = 4,711,352 = 4,711,352 = xxxxxxxxxxxxxxx = 4,711,352
d) Audit Adj/Restatement 9792-9793 + 0 + 0 + xxxxxxxxxxxxxxx + 0 0 0.00%
e) Net Beginning Balance = 4,711,352 = 4,711,352 = xxxxxxxxxxxxxxx = 4,711,352
2) Ending Balance, June 30 ( E + F1e ) = 0 = 0 = xxxxxxxxxxxxxxx = 368,352
================================================================================================== ==================================================================================================
Components of Ending Fund Balance a) Reserved Amounts Revolving Cash 9611 - 0 - 0 - xxxxxxxxxxxxxxx - 0 0 0.00%
Stores 9612 - 0 - 0 - xxxxxxxxxxxxxxx - 0 0 0.00%
Prepaid Expenditures 9613 - 0 - 0 - xxxxxxxxxxxxxxx - 0 0 0.00%
Other 9619 - 0 - 0 - xxxxxxxxxxxxxxx - 0 0 0.00%
General Reserve (EC 42124) 9630 - 0 - 0 - xxxxxxxxxxxxxxx - 0 0 0.00%
Legally Restricted Balances 9640 - xxxxxxxxxxxxxxx - xxxxxxxxxxxxxxx - xxxxxxxxxxxxxxx - xxxxxxxxxxxxxxx xxxxxxxxxxxxxxx xxxxxxxxxxxx
b) Designated Amounts Designated for Economic Uncertainties 9710 - 0 - 0 - xxxxxxxxxxxxxxx - 0 0 0.00% Designated for 9720-9789
Carryover - 0 - 0 - xxxxxxxxxxxxxxx - 292,939 (292,939) 0.00%
Compensation - 0 - 0 - xxxxxxxxxxxxxxx - 75,413 (75,413) 0.00%
- 0 - 0 - xxxxxxxxxxxxxxx - 0 0 0.00%
c) Undesignated Amounts 9790 = xxxxxxxxxxxxxxx = xxxxxxxxxxxxxxx = xxxxxxxxxxxxxxx = 0 d) Unappropriated Amounts 9790 = 0 = 0 = xxxxxxxxxxxxxxx = xxxxxxxxxxxxxxx
==================================================================================================
12/08/00 02:46 PM
SPECIAL RESERVE – FEMA – HAZARD MITIGATION FIRST PERIOD INTERIM FINANCIAL REPORT
2000-01 Comments on Significant Differences Expenditures B-2 to B-5 The projected overexpenditures are due to hazard mitigation projects being started
this fiscal year rather than the following year as planned. In-house personnel were utilized for most of the projects. The projected overexpenditures in these major objects will be covered by fund transfers from B.6 and B.7.
B-6 to B-7 The projected underexpenditures in these major objects are due to fewer than
anticipated hazard mitigation projects expected to be completed this fiscal year. Other Financing Sources/Uses D-1a Reimbursements from FEMA are initially recorded in the General Fund and later
transferred as “Interfund Transfers In” to this Fund. Reimbursements are only received when projects are completed and reimbursement claims are filed and approved by FEMA.

X First Interim 2000-01 INTERIM REPORT 19 | 64733 | J-251
Second Interim HEALTH & WELFARE BENEFITS FUND CALIFORNIA SUMMARY DEPARTMENT OF EDUCATIONThird Interim - End of Year Projection Form J-251 (Rev 01/95)
REVENUES, EXPENDITURES AND CHANGES IN FUND BALANCE
LOS ANGELES UNIFIED School District LOS ANGELES County=========================================================================================================================
Summary - Unrestricted/Restricted Original Board Approved Actuals Projected Difference % Diff Account Budget Operating Budget To Date Yr Totals (Col. B & D) (E / B)
Description Codes (A) (B) (C) (D) (E) (F)=========================================================================================================================
A. REVENUES
1) Revenue Limit Sources 8010-8099 + 0 + 0 + 0 + 0 0 0.00%
2) Federal Revenues 8100-8299 + 0 + 0 + 0 + 0 0 0.00%
3) Other State Revenues 8300-8599 + 0 + 0 + 0 + 0 0 0.00%
4) Other Local Revenues 8600-8799 + 404,329,821 + 429,092,506 + 136,353,780 + 431,638,628 2,546,122 0.59%
5) TOTAL, REVENUES = 404,329,821 = 429,092,506 = 136,353,780 = 431,638,628
================================================================================================== B. EXPENDITURES
1) Certificated Salaries 1000-1999 + 0 + 0 + 0 + 0 0 0.00%
2) Classified Salaries 2000-2999 + 711,353 + 711,353 + 199,730 + 747,047 (35,694) -5.02%
3) Employee Benefits 3000-3999 + 191,623 + 191,623 + 36,433 + 269,787 (78,164) -40.79%
4) Books and Supplies 4000-4999 + 401,101 + 401,101 + 4,400 + 88,644 312,457 77.90%
5) Services, Other Operating Expenses 5000-5999 + 403,254,166 + 428,016,851 + 121,430,555 + 430,383,395 (2,366,544) -0.55%
6) Capital Outlay 6000-6599 + 0 + 0 + 0 + 0 0 0.00%
7) Other Outgo 7100-7299 + 70,290 + 70,290 + 16,686 + 77,900 (7,610) -10.83%
8) Direct Support/Indirect Costs 7300-7399 + 0 + 0 + 0 + 0 0 0.00%
9) TOTAL, EXPENDITURES = 404,628,533 = 429,391,218 = 121,687,804 = 431,566,773
================================================================================================== ================================================================================================== C. EXCESS (DEFICIENCY) OF REVENUES
OVER EXPENDITURES BEFORE OTHER FINANCING SOURCES AND USES (A5 - B9) = (298,712) = (298,712) = 14,665,976 = 71,855
================================================================================================== ================================================================================================== D. OTHER FINANCING SOURCES/USES
1) Interfund Transfers a) Transfers In 8910-8929 + 0 + 0 + 0 + 0 0 0.00%
b) Transfers Out 7610-7629 - 0 - 0 - 0 - 0 0 0.00%
2) Other Sources/Uses a) Sources 8930-8979 + 0 + 0 + 0 + 0 0 0.00%
b) Uses 7630-7699 - 0 - 0 - 0 - 0 0 0.00%
3) Contributions to Restricted Programs 8980-8999 + 0 + 0 + 0 + 0 0 0.00%
4) TOTAL, OTHER FINANCING SOURCES/USES= 0 = 0 = 0 = 0
==================================================================================================
12/08/00 01:52 PM
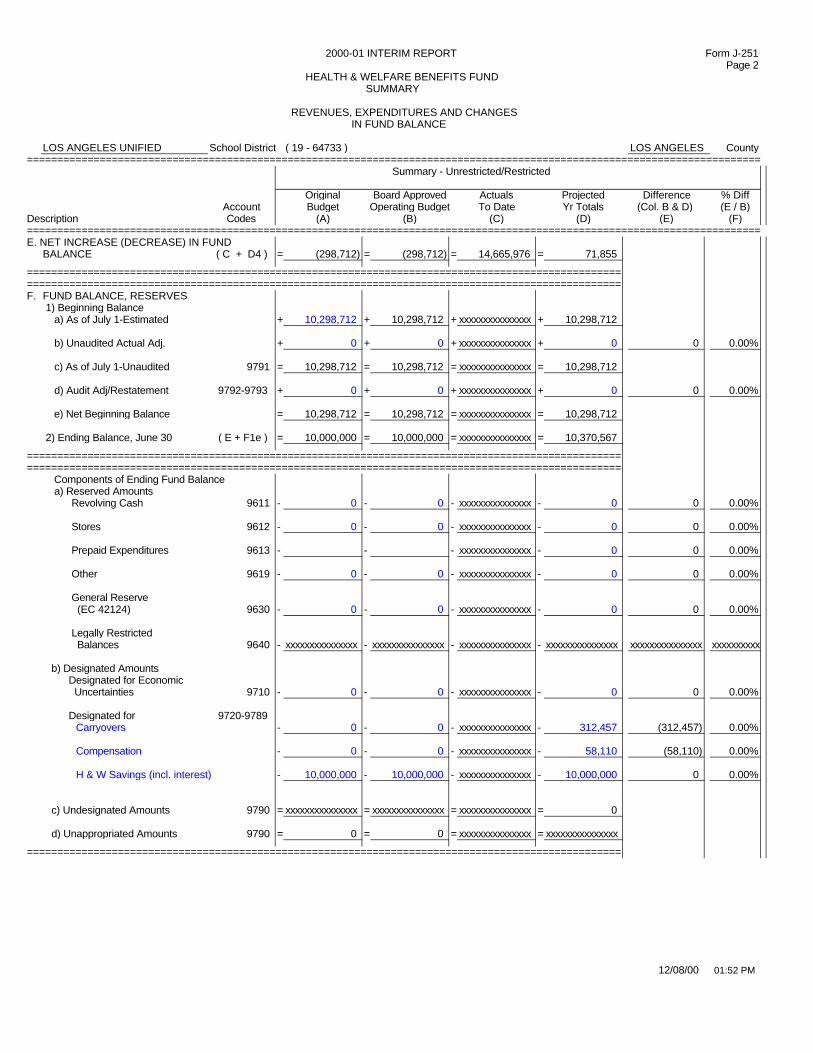
2000-01 INTERIM REPORT Form J-251 Page 2 HEALTH & WELFARE BENEFITS FUND
SUMMARY REVENUES, EXPENDITURES AND CHANGES
IN FUND BALANCE
LOS ANGELES UNIFIED School District ( 19 - 64733 ) LOS ANGELES County=========================================================================================================================
Summary - Unrestricted/Restricted Original Board Approved Actuals Projected Difference % Diff Account Budget Operating Budget To Date Yr Totals (Col. B & D) (E / B)
Description Codes (A) (B) (C) (D) (E) (F)=========================================================================================================================E. NET INCREASE (DECREASE) IN FUND
BALANCE ( C + D4 ) = (298,712) = (298,712) = 14,665,976 = 71,855
================================================================================================== ================================================================================================== F. FUND BALANCE, RESERVES
1) Beginning Balance a) As of July 1-Estimated + 10,298,712 + 10,298,712 + xxxxxxxxxxxxxxx + 10,298,712
b) Unaudited Actual Adj. + 0 + 0 + xxxxxxxxxxxxxxx + 0 0 0.00%
c) As of July 1-Unaudited 9791 = 10,298,712 = 10,298,712 = xxxxxxxxxxxxxxx = 10,298,712
d) Audit Adj/Restatement 9792-9793 + 0 + 0 + xxxxxxxxxxxxxxx + 0 0 0.00%
e) Net Beginning Balance = 10,298,712 = 10,298,712 = xxxxxxxxxxxxxxx = 10,298,712
2) Ending Balance, June 30 ( E + F1e ) = 10,000,000 = 10,000,000 = xxxxxxxxxxxxxxx = 10,370,567
================================================================================================== ==================================================================================================
Components of Ending Fund Balance a) Reserved Amounts Revolving Cash 9611 - 0 - 0 - xxxxxxxxxxxxxxx - 0 0 0.00%
Stores 9612 - 0 - 0 - xxxxxxxxxxxxxxx - 0 0 0.00%
Prepaid Expenditures 9613 - - - xxxxxxxxxxxxxxx - 0 0 0.00%
Other 9619 - 0 - 0 - xxxxxxxxxxxxxxx - 0 0 0.00%
General Reserve (EC 42124) 9630 - 0 - 0 - xxxxxxxxxxxxxxx - 0 0 0.00%
Legally Restricted Balances 9640 - xxxxxxxxxxxxxxx - xxxxxxxxxxxxxxx - xxxxxxxxxxxxxxx - xxxxxxxxxxxxxxx xxxxxxxxxxxxxxx xxxxxxxxxx
b) Designated Amounts Designated for Economic Uncertainties 9710 - 0 - 0 - xxxxxxxxxxxxxxx - 0 0 0.00% Designated for 9720-9789
Carryovers - 0 - 0 - xxxxxxxxxxxxxxx - 312,457 (312,457) 0.00%
Compensation - 0 - 0 - xxxxxxxxxxxxxxx - 58,110 (58,110) 0.00%
H & W Savings (incl. interest) - 10,000,000 - 10,000,000 - xxxxxxxxxxxxxxx - 10,000,000 0 0.00%
c) Undesignated Amounts 9790 = xxxxxxxxxxxxxxx = xxxxxxxxxxxxxxx = xxxxxxxxxxxxxxx = 0 d) Unappropriated Amounts 9790 = 0 = 0 = xxxxxxxxxxxxxxx = xxxxxxxxxxxxxxx
==================================================================================================
12/08/00 01:52 PM
HEALTH AND WELFARE BENEFITS FUND FIRST PERIOD INTERIM FINANCIAL REPORT
2000-01 Comments on Significant Differences Revenues, Expenditures, and Changes in Fund Balance Revenues A-4 The projected overrealization of local revenue results from higher expenditures than
budgeted which require additional contributions from user funds. Expenditures B-2 to B-7 The overexpenditures in these Major Objects will be covered by additional billings
to user Funds. Fund Balance, Reserves F-2b $10.0 million of the projected Fund Balance will remain as a reserve in this Fund in
accordance with collective bargaining agreements.
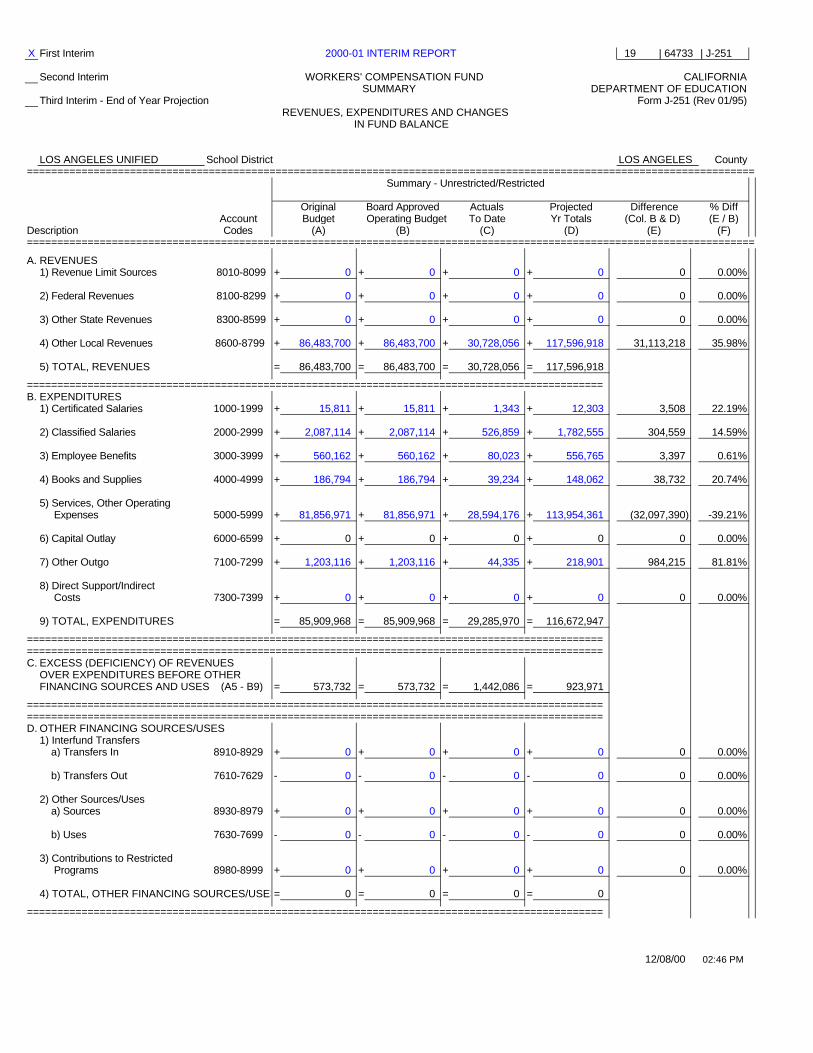
X First Interim 2000-01 INTERIM REPORT 19 | 64733 | J-251
Second Interim WORKERS' COMPENSATION FUND CALIFORNIA SUMMARY DEPARTMENT OF EDUCATIONThird Interim - End of Year Projection Form J-251 (Rev 01/95)
REVENUES, EXPENDITURES AND CHANGES IN FUND BALANCE
LOS ANGELES UNIFIED School District LOS ANGELES County========================================================================================================================
Summary - Unrestricted/Restricted Original Board Approved Actuals Projected Difference % Diff Account Budget Operating Budget To Date Yr Totals (Col. B & D) (E / B)
Description Codes (A) (B) (C) (D) (E) (F)========================================================================================================================
A. REVENUES
1) Revenue Limit Sources 8010-8099 + 0 + 0 + 0 + 0 0 0.00%
2) Federal Revenues 8100-8299 + 0 + 0 + 0 + 0 0 0.00%
3) Other State Revenues 8300-8599 + 0 + 0 + 0 + 0 0 0.00%
4) Other Local Revenues 8600-8799 + 86,483,700 + 86,483,700 + 30,728,056 + 117,596,918 31,113,218 35.98%
5) TOTAL, REVENUES = 86,483,700 = 86,483,700 = 30,728,056 = 117,596,918
=============================================================================================== B. EXPENDITURES
1) Certificated Salaries 1000-1999 + 15,811 + 15,811 + 1,343 + 12,303 3,508 22.19%
2) Classified Salaries 2000-2999 + 2,087,114 + 2,087,114 + 526,859 + 1,782,555 304,559 14.59%
3) Employee Benefits 3000-3999 + 560,162 + 560,162 + 80,023 + 556,765 3,397 0.61%
4) Books and Supplies 4000-4999 + 186,794 + 186,794 + 39,234 + 148,062 38,732 20.74%
5) Services, Other Operating Expenses 5000-5999 + 81,856,971 + 81,856,971 + 28,594,176 + 113,954,361 (32,097,390) -39.21%
6) Capital Outlay 6000-6599 + 0 + 0 + 0 + 0 0 0.00%
7) Other Outgo 7100-7299 + 1,203,116 + 1,203,116 + 44,335 + 218,901 984,215 81.81%
8) Direct Support/Indirect Costs 7300-7399 + 0 + 0 + 0 + 0 0 0.00%
9) TOTAL, EXPENDITURES = 85,909,968 = 85,909,968 = 29,285,970 = 116,672,947
=============================================================================================== =============================================================================================== C. EXCESS (DEFICIENCY) OF REVENUES
OVER EXPENDITURES BEFORE OTHER FINANCING SOURCES AND USES (A5 - B9) = 573,732 = 573,732 = 1,442,086 = 923,971
=============================================================================================== =============================================================================================== D. OTHER FINANCING SOURCES/USES
1) Interfund Transfers a) Transfers In 8910-8929 + 0 + 0 + 0 + 0 0 0.00%
b) Transfers Out 7610-7629 - 0 - 0 - 0 - 0 0 0.00%
2) Other Sources/Uses a) Sources 8930-8979 + 0 + 0 + 0 + 0 0 0.00%
b) Uses 7630-7699 - 0 - 0 - 0 - 0 0 0.00%
3) Contributions to Restricted Programs 8980-8999 + 0 + 0 + 0 + 0 0 0.00%
4) TOTAL, OTHER FINANCING SOURCES/USES= 0 = 0 = 0 = 0
===============================================================================================
12/08/00 02:46 PM

2000-01 INTERIM REPORT Form J-251 Page 2 WORKERS' COMPENSATION FUND
SUMMARY REVENUES, EXPENDITURES AND CHANGES
IN FUND BALANCE
LOS ANGELES UNIFIED School District ( 19 - 64733 ) LOS ANGELES County========================================================================================================================
Summary - Unrestricted/Restricted Original Board Approved Actuals Projected Difference % Diff Account Budget Operating Budget To Date Yr Totals (Col. B & D) (E / B)
Description Codes (A) (B) (C) (D) (E) (F)========================================================================================================================E. NET INCREASE (DECREASE) IN FUND
BALANCE ( C + D4 ) = 573,732 = 573,732 = 1,442,086 = 923,971
=============================================================================================== =============================================================================================== F. FUND BALANCE, RESERVES
1) Beginning Balance a) As of July 1-Estimated + 626,268 + 626,268 + xxxxxxxxxxxxxxx + 626,268
b) Unaudited Actual Adj + 0 + 0 + xxxxxxxxxxxxxxx + 0 0 0.00%
c) As of July 1-Unaudited 9791 = 626,268 = 626,268 = xxxxxxxxxxxxxxx = 626,268
d) Audit Adj/Restatement 9792 - 9793 + 0 + 0 + xxxxxxxxxxxxxxx + 0 0 0.00%
e) Net Beginning Balance = 626,268 = 626,268 = xxxxxxxxxxxxxxx = 626,268
2) Ending Balance, June 30 (E + F1e ) = 1,200,000 = 1,200,000 = xxxxxxxxxxxxxxx = 1,550,239
=============================================================================================== ===============================================================================================
Components of Ending Fund Balance a) Reserved Amounts Revolving Cash 9611 - 1,200,000 - 1,200,000 - xxxxxxxxxxxxxxx - 1,200,000 0 0.00%
Stores 9612 - 0 - 0 - xxxxxxxxxxxxxxx - 0 0 0.00%
Prepaid Expenditures 9613 - 0 - 0 - xxxxxxxxxxxxxxx - 0 0 0.00%
Other 9619 - 0 - 0 - xxxxxxxxxxxxxxx - 0 0 0.00%
General Reserve (EC 42124) 9630 - 0 - 0 - xxxxxxxxxxxxxxx - 0 0 0.00%
Legally Restricted Balances 9640 - xxxxxxxxxxxxxxx - xxxxxxxxxxxxxxx - xxxxxxxxxxxxxxx - xxxxxxxxxxxxxxx xxxxxxxxxxxxxxx xxxxxxxxxx
b) Designated Amounts Designated for Economic Uncertainties 9710 - 0 - 0 - xxxxxxxxxxxxxxx - 0 0 0.00% Designated for 9720-9789
Carryover - - - xxxxxxxxxxxxxxx - 209,812 (209,812) 0.00%
Compensation - 0 - 0 - xxxxxxxxxxxxxxx - 140,427 (140,427) 0.00%
- 0 - 0 - xxxxxxxxxxxxxxx - 0 0.00%
c) Undesignated Amounts 9790 = xxxxxxxxxxxxxxx = xxxxxxxxxxxxxxx = xxxxxxxxxxxxxxx = 0 d) Unappropriated Amounts 9790 = 0 = 0 = xxxxxxxxxxxxxxx = xxxxxxxxxxxxxxx
===============================================================================================
12/08/00 02:46 PM
WORKERS’ COMPENSATION SELF-INSURANCE FUND FIRST INTERIM FINANCIAL REPORT
2000-01 Comments on Significant Differences General Comments This report reflects the repayment of $5.2 million of the $21.4 million remaining as of
June 30, 2000 of the contributions withheld by the General Fund-Regular Program (except Integration Program), Adult Education-Regular Program and the Child Development Fund-Regular Program. The original amount of the withheld contributions was $59.7 million of which $5.2 million is being paid yearly starting in 1993-94. The withheld contributions resulted from the District receiving less than anticipated funding from the State of California in 1990-91 and 1991-92. Due to these withheld contributions, the year-end liability which is recorded based on amounts funded will be less than the estimated present value of the claims liability. Although generally accepted accounting principles require that such liability be recorded based on total estimated claims liability, the District will be unable to comply with this requirement in 2000-01.
Revenues A-4 The projected overrealization in Other Local Revenues results from additional
billings to user funds due to higher projected claims expense. Expenditures B-5 The projected overexpenditure in this Major Object represents estimated claims
expense for workers’ compensation, which is greater than previously anticipated. This will result in additional billings to user Funds.
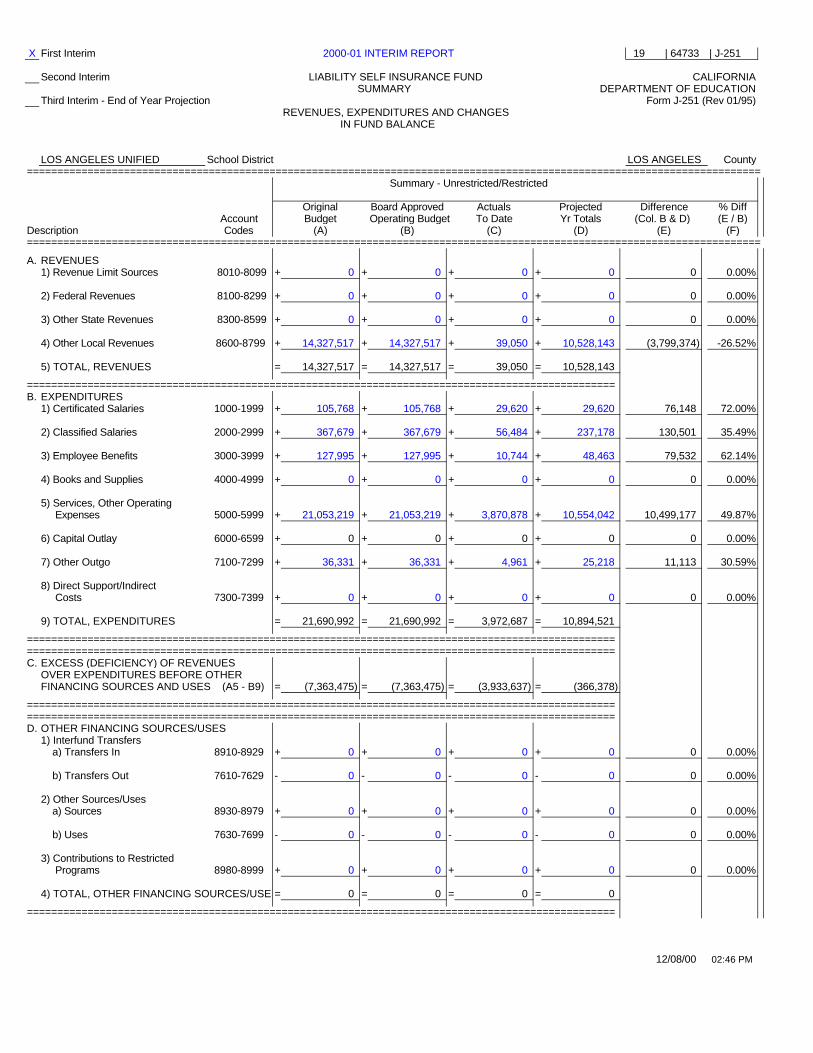
X First Interim 2000-01 INTERIM REPORT 19 | 64733 | J-251
Second Interim LIABILITY SELF INSURANCE FUND CALIFORNIA SUMMARY DEPARTMENT OF EDUCATIONThird Interim - End of Year Projection Form J-251 (Rev 01/95)
REVENUES, EXPENDITURES AND CHANGES IN FUND BALANCE
LOS ANGELES UNIFIED School District LOS ANGELES County=========================================================================================================================
Summary - Unrestricted/Restricted Original Board Approved Actuals Projected Difference % Diff Account Budget Operating Budget To Date Yr Totals (Col. B & D) (E / B)
Description Codes (A) (B) (C) (D) (E) (F)=========================================================================================================================
A. REVENUES
1) Revenue Limit Sources 8010-8099 + 0 + 0 + 0 + 0 0 0.00%
2) Federal Revenues 8100-8299 + 0 + 0 + 0 + 0 0 0.00%
3) Other State Revenues 8300-8599 + 0 + 0 + 0 + 0 0 0.00%
4) Other Local Revenues 8600-8799 + 14,327,517 + 14,327,517 + 39,050 + 10,528,143 (3,799,374) -26.52%
5) TOTAL, REVENUES = 14,327,517 = 14,327,517 = 39,050 = 10,528,143
================================================================================================= B. EXPENDITURES
1) Certificated Salaries 1000-1999 + 105,768 + 105,768 + 29,620 + 29,620 76,148 72.00%
2) Classified Salaries 2000-2999 + 367,679 + 367,679 + 56,484 + 237,178 130,501 35.49%
3) Employee Benefits 3000-3999 + 127,995 + 127,995 + 10,744 + 48,463 79,532 62.14%
4) Books and Supplies 4000-4999 + 0 + 0 + 0 + 0 0 0.00%
5) Services, Other Operating Expenses 5000-5999 + 21,053,219 + 21,053,219 + 3,870,878 + 10,554,042 10,499,177 49.87%
6) Capital Outlay 6000-6599 + 0 + 0 + 0 + 0 0 0.00%
7) Other Outgo 7100-7299 + 36,331 + 36,331 + 4,961 + 25,218 11,113 30.59%
8) Direct Support/Indirect Costs 7300-7399 + 0 + 0 + 0 + 0 0 0.00%
9) TOTAL, EXPENDITURES = 21,690,992 = 21,690,992 = 3,972,687 = 10,894,521
================================================================================================= ================================================================================================= C. EXCESS (DEFICIENCY) OF REVENUES
OVER EXPENDITURES BEFORE OTHER FINANCING SOURCES AND USES (A5 - B9) = (7,363,475) = (7,363,475) = (3,933,637) = (366,378)
================================================================================================= ================================================================================================= D. OTHER FINANCING SOURCES/USES
1) Interfund Transfers a) Transfers In 8910-8929 + 0 + 0 + 0 + 0 0 0.00%
b) Transfers Out 7610-7629 - 0 - 0 - 0 - 0 0 0.00%
2) Other Sources/Uses a) Sources 8930-8979 + 0 + 0 + 0 + 0 0 0.00%
b) Uses 7630-7699 - 0 - 0 - 0 - 0 0 0.00%
3) Contributions to Restricted Programs 8980-8999 + 0 + 0 + 0 + 0 0 0.00%
4) TOTAL, OTHER FINANCING SOURCES/USES= 0 = 0 = 0 = 0
=================================================================================================
12/08/00 02:46 PM
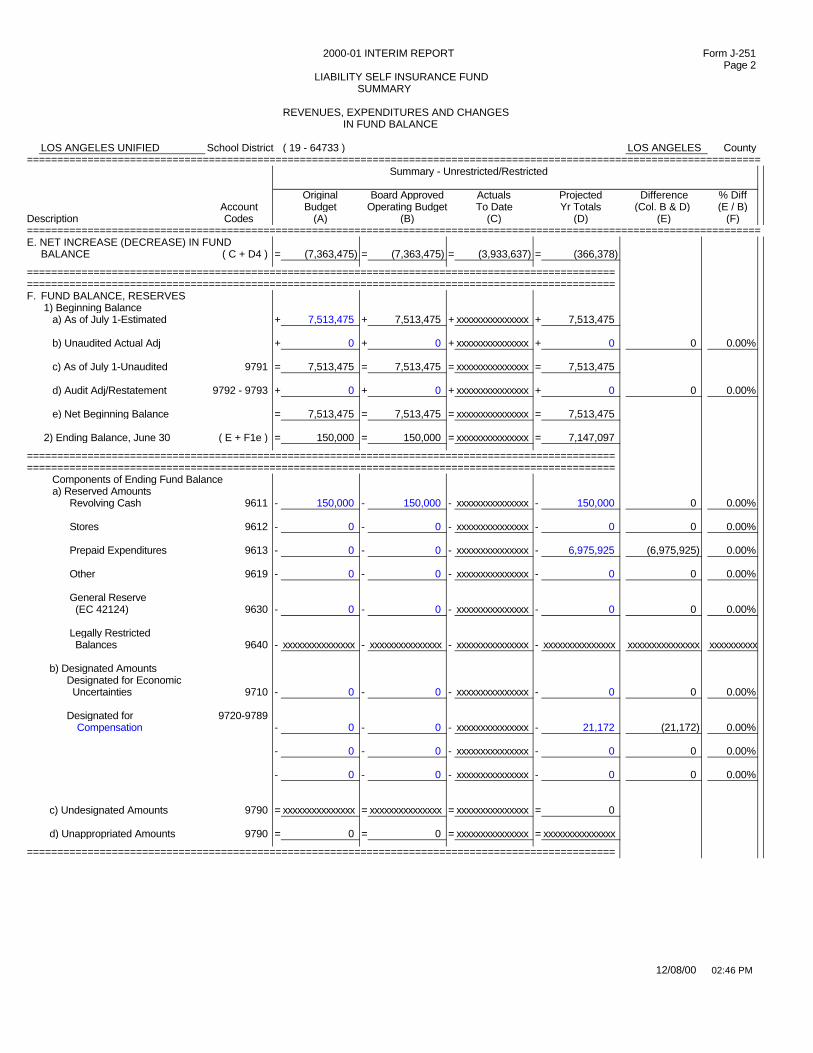
2000-01 INTERIM REPORT Form J-251 Page 2 LIABILITY SELF INSURANCE FUND
SUMMARY REVENUES, EXPENDITURES AND CHANGES
IN FUND BALANCE
LOS ANGELES UNIFIED School District ( 19 - 64733 ) LOS ANGELES County=========================================================================================================================
Summary - Unrestricted/Restricted Original Board Approved Actuals Projected Difference % Diff Account Budget Operating Budget To Date Yr Totals (Col. B & D) (E / B)
Description Codes (A) (B) (C) (D) (E) (F)=========================================================================================================================E. NET INCREASE (DECREASE) IN FUND
BALANCE ( C + D4 ) = (7,363,475) = (7,363,475) = (3,933,637) = (366,378)
================================================================================================= ================================================================================================= F. FUND BALANCE, RESERVES
1) Beginning Balance a) As of July 1-Estimated + 7,513,475 + 7,513,475 + xxxxxxxxxxxxxxx + 7,513,475
b) Unaudited Actual Adj + 0 + 0 + xxxxxxxxxxxxxxx + 0 0 0.00%
c) As of July 1-Unaudited 9791 = 7,513,475 = 7,513,475 = xxxxxxxxxxxxxxx = 7,513,475
d) Audit Adj/Restatement 9792 - 9793 + 0 + 0 + xxxxxxxxxxxxxxx + 0 0 0.00%
e) Net Beginning Balance = 7,513,475 = 7,513,475 = xxxxxxxxxxxxxxx = 7,513,475
2) Ending Balance, June 30 ( E + F1e ) = 150,000 = 150,000 = xxxxxxxxxxxxxxx = 7,147,097
================================================================================================= =================================================================================================
Components of Ending Fund Balance a) Reserved Amounts Revolving Cash 9611 - 150,000 - 150,000 - xxxxxxxxxxxxxxx - 150,000 0 0.00%
Stores 9612 - 0 - 0 - xxxxxxxxxxxxxxx - 0 0 0.00%
Prepaid Expenditures 9613 - 0 - 0 - xxxxxxxxxxxxxxx - 6,975,925 (6,975,925) 0.00%
Other 9619 - 0 - 0 - xxxxxxxxxxxxxxx - 0 0 0.00%
General Reserve (EC 42124) 9630 - 0 - 0 - xxxxxxxxxxxxxxx - 0 0 0.00%
Legally Restricted Balances 9640 - xxxxxxxxxxxxxxx - xxxxxxxxxxxxxxx - xxxxxxxxxxxxxxx - xxxxxxxxxxxxxxx xxxxxxxxxxxxxxx xxxxxxxxxx
b) Designated Amounts Designated for Economic Uncertainties 9710 - 0 - 0 - xxxxxxxxxxxxxxx - 0 0 0.00% Designated for 9720-9789
Compensation - 0 - 0 - xxxxxxxxxxxxxxx - 21,172 (21,172) 0.00%
- 0 - 0 - xxxxxxxxxxxxxxx - 0 0 0.00%
- 0 - 0 - xxxxxxxxxxxxxxx - 0 0 0.00%
c) Undesignated Amounts 9790 = xxxxxxxxxxxxxxx = xxxxxxxxxxxxxxx = xxxxxxxxxxxxxxx = 0 d) Unappropriated Amounts 9790 = 0 = 0 = xxxxxxxxxxxxxxx = xxxxxxxxxxxxxxx
=================================================================================================
12/08/00 02:46 PM
LIABILITY SELF-INSURANCE FUND FIRST PERIOD INTERIM FINANCIAL REPORT
2000-01 Comments on Significant Differences Revenues A-4 The projected underrealization of Other Local Revenues results primarily from
lower than anticipated billings to user funds. Expenditures B-5 The projected underexpenditure in this Major Object primarily results from the
inclusion of budget for environmental insurance premium prepaid in the prior fiscal year.
2001/02 & 2002/03
PROJECTIONS
FOR GENERAL FUND
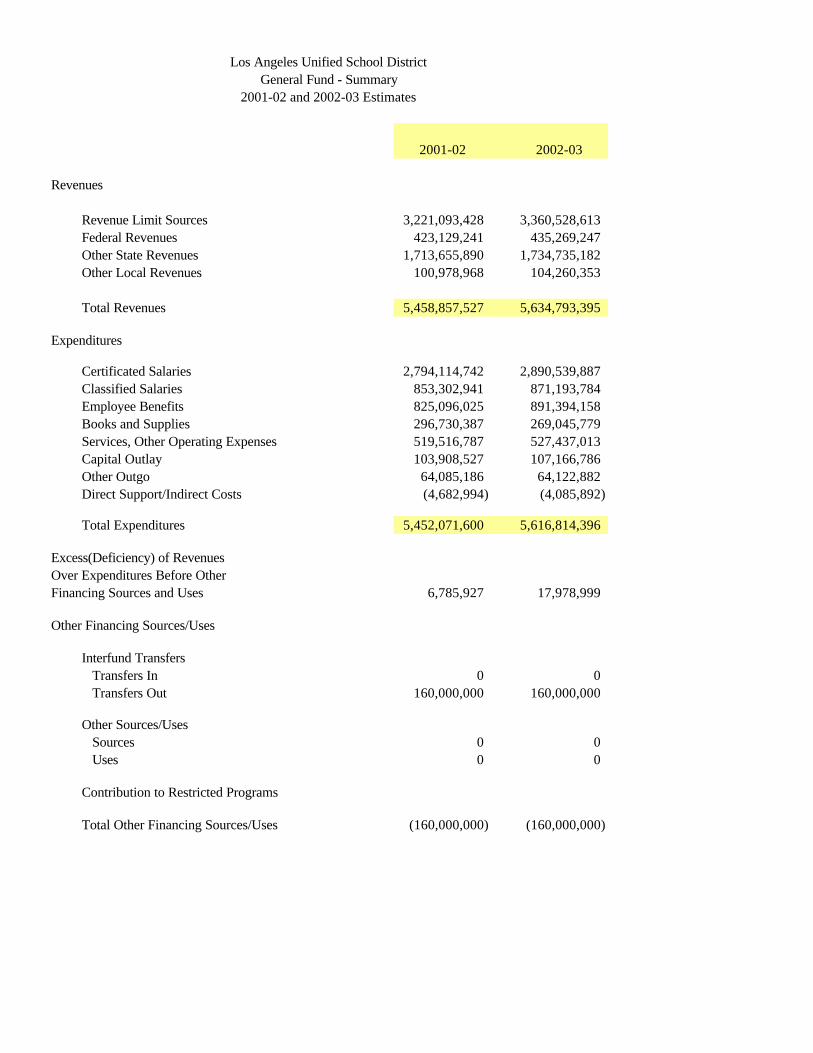
Los Angeles Unified School DistrictGeneral Fund - Summary
2001-02 and 2002-03 Estimates
2001-02 2002-03
Revenues
Revenue Limit Sources 3,221,093,428 3,360,528,613Federal Revenues 423,129,241 435,269,247Other State Revenues 1,713,655,890 1,734,735,182Other Local Revenues 100,978,968 104,260,353
Total Revenues 5,458,857,527 5,634,793,395
Expenditures
Certificated Salaries 2,794,114,742 2,890,539,887Classified Salaries 853,302,941 871,193,784Employee Benefits 825,096,025 891,394,158Books and Supplies 296,730,387 269,045,779Services, Other Operating Expenses 519,516,787 527,437,013Capital Outlay 103,908,527 107,166,786Other Outgo 64,085,186 64,122,882Direct Support/Indirect Costs (4,682,994) (4,085,892)
Total Expenditures 5,452,071,600 5,616,814,396
Excess(Deficiency) of RevenuesOver Expenditures Before OtherFinancing Sources and Uses 6,785,927 17,978,999
Other Financing Sources/Uses
Interfund Transfers Transfers In 0 0 Transfers Out 160,000,000 160,000,000
Other Sources/Uses Sources 0 0 Uses 0 0
Contribution to Restricted Programs
Total Other Financing Sources/Uses (160,000,000) (160,000,000)
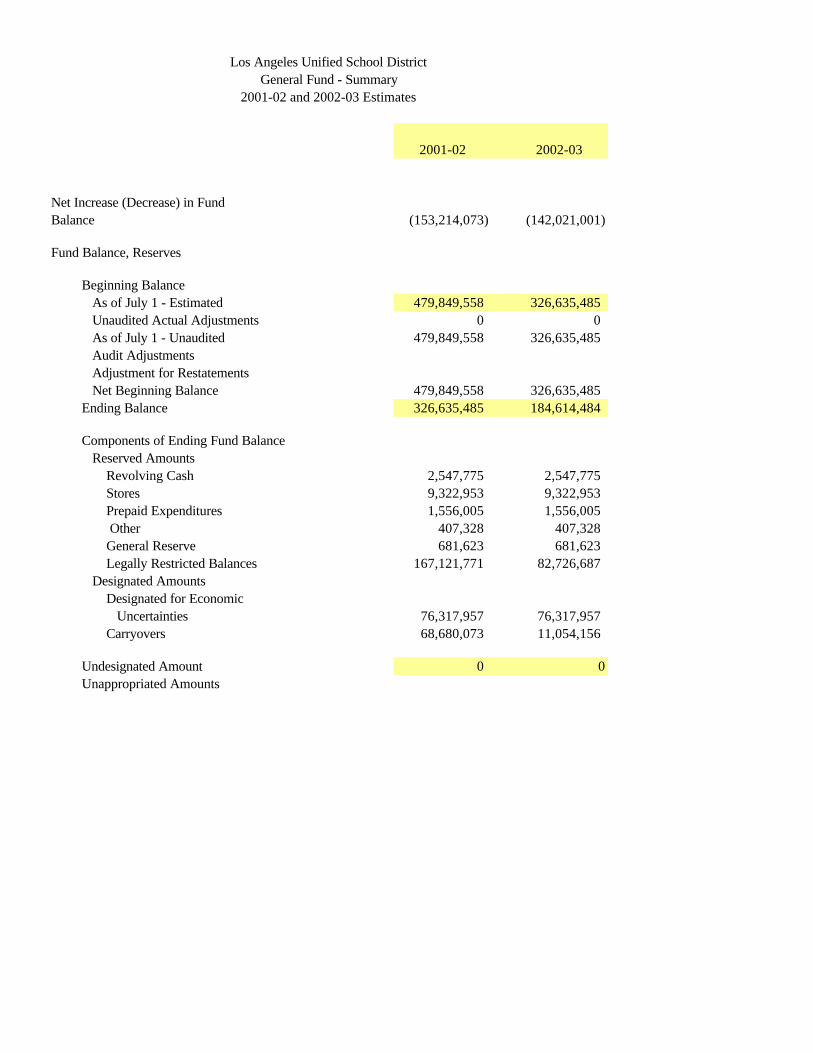
Los Angeles Unified School DistrictGeneral Fund - Summary
2001-02 and 2002-03 Estimates
2001-02 2002-03
Net Increase (Decrease) in Fund Balance (153,214,073) (142,021,001)
Fund Balance, Reserves
Beginning Balance As of July 1 - Estimated 479,849,558 326,635,485 Unaudited Actual Adjustments 0 0 As of July 1 - Unaudited 479,849,558 326,635,485 Audit Adjustments Adjustment for Restatements Net Beginning Balance 479,849,558 326,635,485Ending Balance 326,635,485 184,614,484
Components of Ending Fund Balance Reserved Amounts Revolving Cash 2,547,775 2,547,775 Stores 9,322,953 9,322,953 Prepaid Expenditures 1,556,005 1,556,005 Other 407,328 407,328 General Reserve 681,623 681,623 Legally Restricted Balances 167,121,771 82,726,687 Designated Amounts Designated for Economic Uncertainties 76,317,957 76,317,957 Carryovers 68,680,073 11,054,156
Undesignated Amount 0 0Unappropriated Amounts

First Interim 2001/02 & 2002/03 INTERIM REPORT | 19 | 64733 | 250A |As of October 31, 2000
AVERAGE DAILY ATTENDANCE CALIFORNIA DEPT OF EDUCATION Form J-250A (Rev 01/95)
Los Angeles Unified School District Los Angeles CountyESTIMATED ESTIMATED
REVENUE LIMIT ADA REVENUE LIMIT ADAProjected Projected
Year Totals Year TotalsGRADE SPAN 2001-02 2002-03
ELEMENTARY
1. General Education 474,396 479,710
2. Special Education 23,642 23,907
HIGH SCHOOL
3. General Education 145,309 146,936
4. Special Education 9,295 9,399
REPORTED BY COUNTY OFFICES
5. Special Education 2 2
6. County Community Schools 293 293
INDEPENDENT STUDY
7. Students 21 and over andcontinuously enrolledsince 18 0 0
8. TOTAL ELEMENTARY, HIGHSCHOOL REPORT BY COUNTYOFFICE, & INDEP STUDY 652,937 660,247
9. Regional Occupational(ROC/P) 18,576 18,576
CLASSES FOR ADULTS
10. Concurrently Enrolled 2,510 2,510
11. Not Concurrently Enrolled-Mandated 56,408 56,408
12. Adults in CorrectionalFacilities 0 0
13. Independent Study(19 or over not continuously enrolled) 0 0
14. TOTAL CLASSES FOR ADULTS 58,918 58,918
15. ADA TOTALS(Sum of lines 8, 9 and 14) 730,431 737,741
SUMMER SCHOOL (Report in Hours)
16. Elementary 8,073,337 8,163,758
17. High School 5,659,355 5,722,740
18. TOTAL SUMMER SCHOOL 13,732,692 13,886,498
12/11/00 3:59 PM
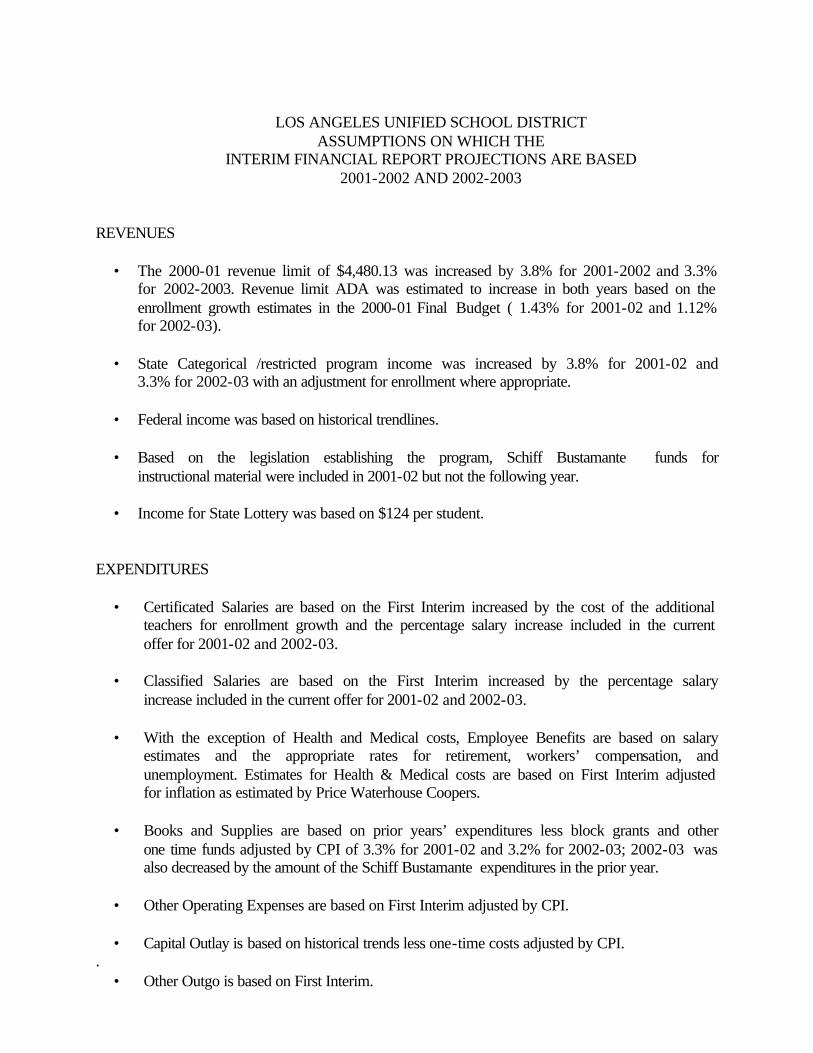
LOS ANGELES UNIFIED SCHOOL DISTRICT
ASSUMPTIONS ON WHICH THE INTERIM FINANCIAL REPORT PROJECTIONS ARE BASED
2001-2002 AND 2002-2003 REVENUES
• The 2000-01 revenue limit of $4,480.13 was increased by 3.8% for 2001-2002 and 3.3% for 2002-2003. Revenue limit ADA was estimated to increase in both years based on the enrollment growth estimates in the 2000-01 Final Budget ( 1.43% for 2001-02 and 1.12% for 2002-03).
• State Categorical /restricted program income was increased by 3.8% for 2001-02 and
3.3% for 2002-03 with an adjustment for enrollment where appropriate. • Federal income was based on historical trendlines. • Based on the legislation establishing the program, Schiff Bustamante funds for
instructional material were included in 2001-02 but not the following year. • Income for State Lottery was based on $124 per student. EXPENDITURES • Certificated Salaries are based on the First Interim increased by the cost of the additional
teachers for enrollment growth and the percentage salary increase included in the current offer for 2001-02 and 2002-03.
• Classified Salaries are based on the First Interim increased by the percentage salary
increase included in the current offer for 2001-02 and 2002-03. • With the exception of Health and Medical costs, Employee Benefits are based on salary
estimates and the appropriate rates for retirement, workers’ compensation, and unemployment. Estimates for Health & Medical costs are based on First Interim adjusted for inflation as estimated by Price Waterhouse Coopers.
• Books and Supplies are based on prior years’ expenditures less block grants and other
one time funds adjusted by CPI of 3.3% for 2001-02 and 3.2% for 2002-03; 2002-03 was also decreased by the amount of the Schiff Bustamante expenditures in the prior year.
• Other Operating Expenses are based on First Interim adjusted by CPI. • Capital Outlay is based on historical trends less one-time costs adjusted by CPI. . • Other Outgo is based on First Interim.