j= , the , and charm - hitoshi murayamahitoshi.berkeley.edu/129a/cahn-goldhaber/chapter9.pdf · the...
TRANSCRIPT

9
The J/ψ, the τ , and charm
New forms of matter, 1974–1976
In November 1974, Burton Richter at SLAC and Samuel Ting at Brookhavenwere leading two very different experiments, one studying e+e− annihilation, theother the e+e− pairs produced in proton–beryllium collisions. Their simultaneousdiscovery of a new resonance with a mass of 3.1 GeV so profoundly altered particlephysics that the period is often referred to as the “November Revolution.” Word ofthe discoveries spread throughout the high energy physics community on November11 and soon much of its research was directed towards the new particles.
Ting led a group from MIT and Brookhaven measuring the rate of productionof e+e− pairs in collisions of protons on a beryllium target. The experiment wasable to measure quite accurately the invariant mass of the e+e− pair. This madethe experiment much more sensitive than an earlier one at Brookhaven led by LeonLederman. That experiment differed in that µ+µ− pairs were observed rather thane+e− pairs. Both these experiments investigated the Drell–Yan process whosemotivation lay in the quark–parton model.
The Drell–Yan process is the production of e+e− or µ+µ− pairs in hadroniccollisions. Within the parton model, this can be understood as the annihilation of aquark from one hadron with an antiquark from the other to form a virtual photon.The virtual photon materializes some fraction of the time as a charged-lepton pair.
The e-pair and µ-pair approaches to measuring lepton-pair production eachhave advantages and disadvantages. Because high-energy muons are more pene-trating than high-energy hadrons, muon pairs can be studied by placing absorbingmaterial directly behind the interaction region. The absorbing material stops thestrongly interacting π s, K s, and protons, but not the muons. This technique per-mits a very high counting rate since the muons can be separated from the hadronsover a large solid angle if enough absorber is available. The momenta of the muonscan be determined by measuring their ranges. Together with the angle betweenthe muons, this yields the invariant mass of the pair. Of course, the muons aresubject to multiple Coulomb scattering in the absorber, so the resolution of the
257

technique is limited by this effect. The spectrum observed by Lederman’s groupfell with increasing invariant mass of the lepton pair. There was, however, a shoul-der in the spectrum between 3 and 4 GeV that attracted some notice, but whosereal significance was obscured by the inadequate resolution.
By contrast, electrons can be separated from hadrons by the nature of theshowers they cause or by measuring directly their velocity (using Cerenkov coun-ters), which is much nearer the speed of light than that of a hadron of comparablemomentum. The Cerenkov-counter approach is very effective in rejecting hadrons,but can be implemented easily only over a small solid angle. As a result, thecounting rate is reduced. Ting’s experiment used two magnetic spectrometers tomeasure separately the e+ and e−. The beryllium target was selected to mini-mize multiple Coulomb scattering. The achieved resolution was about 20 MeV forthe e+e− pair, a great improvement over the earlier µ-pair experiment. The elec-trons and positrons were, in fact, identified using Cerenkov counters, time-of-flightinformation, and pulse height measurements.
In the early 1970s Richter, together with his co-workers, fulfilled his long-timeambition of constructing an e+e− ring, SPEAR, at SLAC to study collisions in the2.5 to 7.5 GeV center-of-mass energy region. Lower energy machines had alreadybeen built at Novosibirsk, Orsay, Frascati, and Cambridge, Mass. Richter himselfhad worked as early as 1958 with Gerard O’Neill and others on the pioneeringe−e− colliding-ring experiments at Stanford.
To exploit the new ring, SPEAR, the SLAC team, led by Richter and MartinPerl, and their LBL collaborators, led by William Chinowsky, Gerson Goldhaber,and George Trilling built a multipurpose large-solid-angle magnetic detector, theSLAC-LBL Mark I. The heart of this detector was a cylindrical magnetostrictivespark chamber inside a solenoidal magnet of 4.6 kG. This was surrounded by time-of-flight counters for particle velocity measurements, shower counters for photondetection and electron identification, and by proportional counters embedded iniron absorber slabs for muon identification.
What could the Mark I Collaboration expect to find in e+e− annihilations?In the quark-parton model, since interactions between the quarks are ignored, theprocess e+e− → qq is precisely analogous to e+e−→µ+µ−, except that the chargeof the quarks is either 2/3 or −1/3 and that the quarks come in three colors, as morefully discussed in Chapter 10. Thus the ratio of the cross section for annihilationinto hadrons to the cross section for the annihilation into muon pairs should simplybe three times the sum of the squares of the charges of the quarks. This ratio,conventionally called R, was in 1974 expected to be 3[(−1/3)2+(2/3)2+(−1/3)2] =2 counting the u, d, and s quarks. In fact, measurements made at the CambridgeElectron Accelerator (CEA) found that R was not constant in the center-of-massregion to be studied at SPEAR, but instead seemed to grow to a rather large value,perhaps 6. The first results from the Mark I detector confirmed this puzzling result.
In 1974, Ting, Ulrich Becker, Min Chen and co-workers were taking data

with their pair spectrometer at the Brookhaven AGS. By October of that yearthey found an e+e− spectrum consistent with expectations, except for a possiblepeak at 3.1 GeV. In view of the as-yet-untested nature of their new equipment,they proceeded to check and recheck this effect under a variety of experimentalconditions and to collect more data.
During this same period, the Mark I experiment continued measurements ofthe annihilation cross section into hadrons with an energy scan with steps of 200MeV. Since no abrupt structure was anticipated, these steps seemed small enough.The data confirming and extending the CEA results were presented at the LondonConference in June 1974.
The data seemed to show a constant cross section rather than the 1/s behavioranticipated. (In the quark-parton model, there is no dimensionful constant, so thetotal cross section should vary as 1/s on dimensional grounds.) In addition, thevalue at center-of-mass energy 3.2 GeV appeared to be a little high. It was decidedin June 1974 to check this by taking additional data at 3.1 and 3.3 GeV. Furtherirregularities at 3.1 GeV made it imperative in early November, 1974, before across section paper could be published, to remeasure this region. Scanning thisregion in very small energy steps revealed an enormous, narrow resonance. Theincrease in the cross section noticed at 3.2 GeV was the due to the tail of theresonance and the anomalies at 3.1 GeV were caused by variations in the preciseenergy of the beam near the lower edge of the resonance, where the cross sectionwas rising rapidly.
By Monday, November 11 (at which time the first draft of the ψ paper wasalready written) Richter learned from Sam Ting (who too had a draft of a paperannouncing the new particle) about the MIT-BNL results on the resonance (namedJ by Ting ), and vice versa. Clearly, both experiments had observed the sameresonance. Word quickly reached Frascati, where Giorgio Bellettini and co-workersmanaged to push the storage ring beyond the designed maximum of 3 GeV andconfirmed the discovery. Papers reporting the results at Brookhaven, SLAC, andFrascati all appeared in the same issue of Physical Review Letters (Refs. 9.1,9.2, 9.3).
That the resonance was extremely narrow was apparent from the e+e− data,which showed an experimental width of 2 MeV. This was not the intrinsic width,but the result of the spread in energy of the electron and positron beams due tosynchrotron radiation in the SPEAR ring. Additionally, the shape was spreadasymmetrically by radiative corrections. If the natural width is much less than thebeam spread, the area under the cross section curve
Area =
∫
dE σ
is nearly the same as it would be in the absence of the beam spread and radiativecorrections. The intrinsic resonance cross section is of the usual Breit–Wigner formgiven in Chapter 5

σ =2J + 1
(2S1 + 1)(2S2 + 1)
π
p2cm
ΓinΓout(E −E0)2 + Γ2
tot/4
where the incident particles have spin S1, S2 = 1/2 and momentumpcm ≈ Mψ/2 = E0/2. If the observed cross section is that for annihilation intohadrons, then Γout = Γhad, the partial width for the resonance to decay intohadrons, while Γin = Γee is the electronic width. Assuming that the observedresonance has spin J = 1, we find by integrating the above,
Area =6π2ΓeeΓhadM2ψΓtot
The area under of the resonance curve measured at SPEAR is about10 nb GeV. If we assume Γhad ≈ Γtot and use the measured mass, Mψ = 3.1GeV, we find Γee ≈ 4.2 keV. The accepted value is 4.7 keV. Subsequent measure-ments of the branching ratio into electron pairs (≈ 7%) led to a determinationof the total width of between 60 and 70 keV, an astonishingly small value for aparticle with a mass of 3 GeV.
Spurred by these results and theoretical predictions of a series of excited stateslike those in atomic physics, the SLAC–LBL Mark I group began a methodicalsearch for other narrow states. It turned out to be feasible to modify the machineoperation of SPEAR so that the energy could be stepped up by 1 MeV everyminute. Ten days after the first discovery, a second narrow resonance was found(Ref. 9.4). The search continued, but no comparable resonances were found upto the maximum SPEAR energy of 7.4 GeV. The next such discovery had to waituntil Lederman’s group, this time at Fermilab and with much-improved resolution,continued their study of muon pairs into the 10 GeV region, as discussed in Chapter11.
The discovery of the ψ(3096) and its partner, ψ ′ or ψ(3685) was the beginningof a period of intense spectroscopic work, which still continues. The spin and parityof the ψ s were established to be JP = 1− by observing the interference betweenthe ψ and the virtual photon intermediate states in e+e− → µ+µ−. The G-paritywas found to be odd when the predominance of states with odd numbers of pionswas demonstrated. Since C was known to be odd from the photon interference, theisospin had to be even and was shown to be nearly certainly I = 0. Two remarkabledecays were observed quite soon after, ψ ′ → ψππ and ψ′ → ψη. Figure 9.30 showsa particularly clean ψ′ → ψππ decay with ψ → e+e−.
Prior to the announcement of the ψ, Tom Appelquist and David Politzer wereinvestigating theoretically the binding of a charmed and an anticharmed quark,which is described later in the chapter. They found that QCD predicted thatthere would be a series of bound states with very small widths, analogous tothe e+e− bound states known as positronium. The cc bound states immediatelybecame the leading explanation for the ψ and this interpretation was strengthened

Figure 9.30: An example of the decayψ′ → ψπ+π− observed by the SLAC–LBL Mark I Collaboration. Thecrosses indicate spark chamber hits.The outer dark rectangles show hits inthe time-of-flight counters. Ref. 9.5.
by the discovery of the ψ′. The ψ was seen as the lowest s-wave state with totalspin equal to one. In spectroscopic notation it was the 13S1. The ψ′ was the nextlowest spin-triplet, the s-wave state 23S1.
The analogy between the cc bound states and positronium was striking. Thetwo lowest energy states of positronium are the 3S1 and the 1S0. The formerhas C = −1 and the latter C = +1. It is this difference that first enabled Mar-tin Deutsch to find experimental evidence for positronium in 1951. Because thetriplet state has odd charge conjugation, it cannot decay into two photons likethe charge-conjugation-even singlet state. As a consequence it decays into threephotons and has a much longer lifetime. With detailed lifetime studies, Deutschwas able to find evidence for a long-lived species. QCD required that the tripletstate of cc decay into three gluons, the quanta that bind the quarks together, whilethe singlet state could decay into two gluons. Again, this meant that the tripletstate should be longer lived, that is, should have a narrow width.
In the nonrelativistic approximation, we can describe the cc system by a wavefunction, φ(r), satisfying a Schrodinger equation for some appropriate potential.The partial width, Γ(ψ → e+e−), is related to the wave function at zero separation,φ(0). The relation is obtained from the general prescription for a reaction rate,Γ = σρv, where Γ is the reaction rate, σ the cross section, v is the relative velocityof the colliding particles and ρ is the target density. In this application ρ = |φ(0)|2.For the cross section we use the low energy limit of the process cc→ e+e−,
σ = 3 ×2πα2e2qβs

where α is the fine-structure constant (≈ 1/137), β is the velocity of the quarkor antiquark in the center-of-mass frame, s is the center-of-mass energy squared(≈M2
ψ), and eq is the charge of the quark measured in units of the proton’s charge.A factor of 3 has been included to account for the three colors. The above crosssection is averaged over the quark spins. The ψ is in fact a spin-triplet. Thespin-singlet state has C = +1 and cannot annihilate through a virtual photon intoe+e−. Since the cross section in the spin-singlet state is zero, the cross section inthe spin-triplet state is actually 4/3 times the spin-averaged cross section. Notingthat the relative velocity, v, is 2β, we have
Γ(ψ → e+e−) =4
3× 3 ×
2πα2e2qβM2
ψ
· 2β|φ(0)|2
=16πα2e2qM2ψ
|φ(0)|2
The nonrelativistic model predicted that between the s-wave ψ and ψ ′ therewould be a set of p-wave states. The spin-triplet states, 3P , would have totalangular momentum J =2, 1, or 0. The spin-singlet state, 1P , would have totalangular momentum J = 1. For a fermion–antifermion system the charge conju-gation quantum number is C = (−1)L+S , while the parity is P = (−1)L+1. Thusthe 3P2,1,0 states would have JPC = 2++, 1++, 0++, while the 1P1 state wouldhave JPC = 1+−. The ψ′ was expected to decay radiatively to the C-even states,which are now denoted χ (thus ψ′ → γχ). Such a transition was first observed atthe PETRA storage ring at DESY in Hamburg by the Double Arm Spectrometer(DASP) group (Ref. 9.6). Evidence for all three χ states was then observedby the SLAC–LBL group with the Mark I detector, both by measuring the twophotons in ψ′ → χγ, χ → ψγ and by detecting the first photon and a subsequenthadronic decay of the χ that was fully reconstructed.
The complete unraveling of these states took several years and was culminatedin the definitive work of the Crystal Ball Collaboration, led by Elliott Bloom (Ref9.7). Their detector was designed to provide high spatial and energy resolution forphotons using 672 NaI crystals. A particularly difficult problem was the detectionof the anticipated s-wave, spin singlet states, 11S0 and 21S0 (denoted ηc and η′c)that were expected to lie just below the corresponding spin-triplet states, 13S1
and 23S1. Since these states have C = +1 and J = 0, they cannot be produceddirectly by e+e− annihilation through a virtual photon. Instead, they must beobserved in the same way as the χ states, through radiative decays of the ψ andψ′. The transitions are suppressed by kinematical and dynamical factors. Theywere identified only after a long effort.
In the simplest nonrelativistic model for the interaction between the charmedand anticharmed quarks, the potential is taken to be spin independent. In this
approximation, the four p-states are degenerate, with identical radial wave func-tions. The E1 transitions, ψ′ → γχ thus would occur with rates proportional tothe statistical weights of the final states, 3P0,1,2, i.e., 1 : 3 : 5. In fact, as a resultof spin-dependent forces, the splittings between the p-states are significant, so abetter approximation is obtained by noting that the E1 rates are proportional toω3, where ω is the photon energy in the ψ ′ rest frame,
ω =M2ψ′ −M2
χ
2Mψ′
If, for the masses of the ψ′ , χ2, χ1, χ0 we take the measured values, 3.686,3.556, 3.510, and 3.415 GeV, respectively, we find ω2 = 0.128 GeV, ω1 = 0.172GeV, and ω0 = 0.261 GeV and the ratios
5 × (0.128)3 : 3 × (0.172)3 : 1 × (0.261)3 = 1 : 1.46 : 1.70
The 1988 edition of the Review of Particle Properties gives branching ratiosfor ψ′ → γχ2,1,0 of 7.8 ± 0.8%, 8.7 ± 0.8%, and 9.3 ± 0.8%, in fair agreement withthe above estimates.
It was during the exciting period of investigation of the ψ,ψ ′, and χ statesthat Martin Perl and co-workers of the SLAC–LBL group made a discovery nearlyas dramatic as that of the ψ. Carefully sifting through 35,000 events, they found24 with a µ and an opposite sign e, and no additional hadrons or photons. Theyinterpreted these events as the pair production of a new lepton, τ , followed byits leptonic decay (Ref. 9.8). The leptonic decays were τ → eνν and τ → µνν.Figure 9.31 shows results obtained by the DASP Collaboration, using a double armspectrometer, and by the DESY-Heidelberg Collaboration at the DORIS storagering at DESY. Figure 9.32 show results from DELCO, the Direct Electron Counterat SPEAR. These established the spin and mass of the τ .
The decay τ → eνν is exactly analogous to the decay µ → eνν. In bothcases we can ignore the mass of the final state leptons. The decay rate for theµ is proportional to the square of the Fermi constant, G2
F , which has dimension[mass]−4. The decay rate for the µ must then be proportional to m5
µ. We concludethat
Γ(τ → eνν) = (mτ/mµ)5Γ(µ→ eνν) = 6 × 10¹¹ s−1
The measured lifetime of the τ is about 3.0× 10⁻¹³ s and the branching ratio intoeνν is near 18%. Combining these gives a partial rate for τ → eνν of roughly6 × 1011 s−1, in good agreement with the expectation.
Within a very short time, two new fundamental fermions had been discov-ered. The interpretation of the ψ as a bound state of a charmed quark andan charmed antiquark was backed by strong circumstantial evidence. What was

Figure 9.31: Left: The cross section from e+e− annihilation into candidates for τ leptons,as a function of center-of-mass energy, as measured by the DASP Collaboration. Thethreshold was determined to be very near 2× 1800 MeV, that is, below the ψ(3685) (Ref.9.9). Right: Similar results from the DESY-Heidelberg group which give 1787+10
−18 MeV forthe mass of the τ . The curves shown are for a spin-1/2 particle [W. Bartel et al., Phys.Lett. B77, 331 (1978)].
Figure 9.32: The production of anomalous two-prong events as a function of the center-of-mass energy, as determined by DELCO. These candidates for τ s yielded a thresholdof 3564+4
−14 MeV, i.e. a mass of 1782+2−7. The threshold behavior confirmed the spin-1/2
assignment. (Ref. 9.10)
������������������������
������������������������
������������������������
������������������������
d
s
d
s
µ−
µ+
µ−
µ+
W−
W+
W−
W+
u
c
νµ
νµ
cos θc
sin θc
− sin θc
cos θc
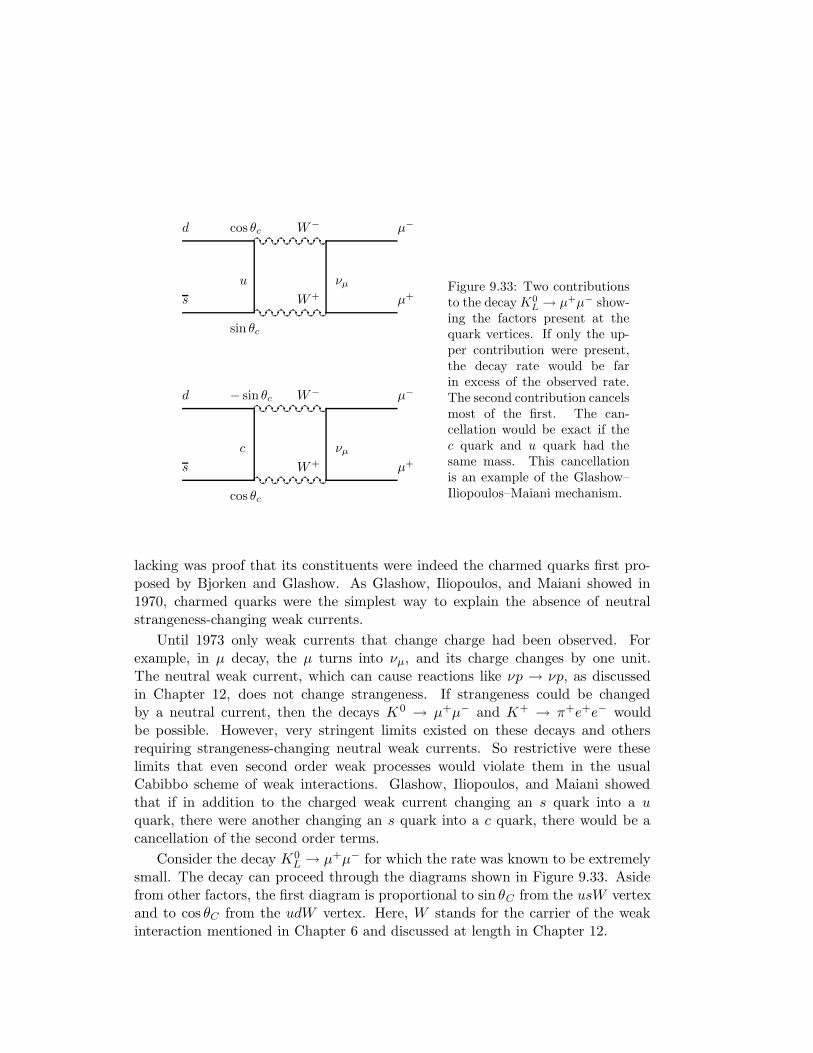
Figure 9.33: Two contributionsto the decayK0
L → µ+µ− show-ing the factors present at thequark vertices. If only the up-per contribution were present,the decay rate would be farin excess of the observed rate.The second contribution cancelsmost of the first. The can-cellation would be exact if thec quark and u quark had thesame mass. This cancellationis an example of the Glashow–Iliopoulos–Maiani mechanism.
lacking was proof that its constituents were indeed the charmed quarks first pro-posed by Bjorken and Glashow. As Glashow, Iliopoulos, and Maiani showed in1970, charmed quarks were the simplest way to explain the absence of neutralstrangeness-changing weak currents.
Until 1973 only weak currents that change charge had been observed. Forexample, in µ decay, the µ turns into νµ, and its charge changes by one unit.The neutral weak current, which can cause reactions like νp → νp, as discussedin Chapter 12, does not change strangeness. If strangeness could be changedby a neutral current, then the decays K0 → µ+µ− and K+ → π+e+e− wouldbe possible. However, very stringent limits existed on these decays and othersrequiring strangeness-changing neutral weak currents. So restrictive were theselimits that even second order weak processes would violate them in the usualCabibbo scheme of weak interactions. Glashow, Iliopoulos, and Maiani showedthat if in addition to the charged weak current changing an s quark into a uquark, there were another changing an s quark into a c quark, there would be acancellation of the second order terms.
Consider the decay K0L → µ+µ− for which the rate was known to be extremely
small. The decay can proceed through the diagrams shown in Figure 9.33. Asidefrom other factors, the first diagram is proportional to sin θC from the usW vertexand to cos θC from the udW vertex. Here, W stands for the carrier of the weakinteraction mentioned in Chapter 6 and discussed at length in Chapter 12.
The result given by this diagram alone would imply a decay rate that is notsuppressed relative to normal K decay, in gross violation of the experimental facts.The proposal of Glashow, Iliopoulos, and Maiani was to add a fourth quark andcorrespondingly a second contribution to the charged weak current, which wouldbecome, symbolically,
u(cos θCd+sin θCs)+c(−sin θCd+cos θCs) =(
u c)
(
cos θC sin θC−sin θC cos θC
)(
ds
)
Thus the Cabibbo angle would be simply a rotation, mixing the quarks d and s.Now when the K0
L → µ+µ− is calculated, there is a second diagram in which a cquark appears in place of the u quark. This amplitude has a term proportional to−sin θCcos θC , just cancelling the previous term. The surviving amplitude is higherorder in GF and does not conflict with experiment. The seminal quantitativetreatment of this and related processes was given by M. K. Gaillard and B. W.Lee, who predicted the mass of the charmed quark to be about 1.5 - 2 GeV, inadvance of the discovery of the ψ!
As is described in Chapter 12, the discovery of strangeness non-changing neu-tral weak currents in 1973 made much more compelling the case for a unified theoryof electromagnetism and weak interactions. The charmed quark was essential tothis theoretical structure and the properties of the new quark were well specifiedby the theory. If the ψ was a bound state of a charmed quark and a charmedantiquark, there would have to be mesons with the composition cu and cd, etc.,that were stable against strong decays. The weak decay of a particle containing ac quark would yield an s quark. Thus the decay of a D+ (= cd) could produce aK− (= su) but not a K+ (= su).
There were a number of hints of charm already in the literature. K. Niu andcollaborators working in Japan observed several cosmic ray events in emulsion inwhich a secondary vertex was observed 10 to 100 µm from the primary vertex.These may have been decays of a particle with a lifetime in the 10−12 to 10−13 srange, just the lifetime expected for charmed particles. Nicolas Samios and RobertPalmer and co-workers, in a neutrino exposure of a hydrogen bubble chamber atBrookhaven, observed a single event that could have been a charmed baryon. SeeFigure 9.34. In other neutrino experiments, events with a pair of muons in the finalstate had been observed (Figure 9.35). These would be expected from processesin which the incident neutrino changed into a muon through the usual chargedweak current and a strange quark was transformed into a charmed quark, again bythe charged weak current. For that fraction in which the charmed particle decayproduced a muon, two muons would be observed in the final state, and they wouldhave opposite charges. The evidence for a new phenomenon, perhaps charm, wasaccumulating.
The SLAC-LBL Mark I detector at SPEAR and the corresponding

Figure 9.34: The event obtained in a neutrino exposure of the 7-ft hydrogen bubble cham-ber at Brookhaven that gave evidence for a charmed baryon. The overall reaction wasmost likely νp → µ−Λ0π+π+π+π−. The most probable assignments are shown in thesketch on the right. This violates the ∆S = ∆Q rule. Such a violation can be understoodif the process were really νp → Σ++
c µ−, followed by the strong decay Σ++c → Λ+
c π+. In
the quark model Σ++c = uuc and Λ+
c = udc. The decay of the Λ+c to Λ0π+π+π− accounts
for the violation of the ∆S = ∆Q rule and is in accord with the pattern expected forcharm decay. The mass of the Σ++
c was measured to be 2426± 12 MeV. There were threepossible choices for the pions to be joined to the Λ0. Of these, one gave a mass splittingbetween the Σ++
c and the Λ+c of about 166 MeV, which agreed with the theoretical expec-
tations [E. G. Cazzoli et al., Phys. Rev. Lett. 34, 1125 (1975), Figure courtesy N. Samios,Brookhaven National Laboratory].

Figure 9.35: Early evidence for charm from opposite-sign dileptons observed in neutrinoexperiments at Fermilab. Left, one of fourteen events observed by the Harvard-Penn-Wisconsin Collaboration [A. Benvenuti et al., Phys. Rev. Lett. 34, 419 (1975)]. Right,a similar event, one of eight seen by the Caltech-Fermilab Collaboration [B. C. Barishet al., Phys. Rev. Lett. 36, 939 (1976)]. In addition, four events containing µ−e+K0
S
were observed in the 15-ft bubble chamber at Fermilab [J. von Krogh et al., Phys. Rev.Lett. 36, 710 (1976)] and two such events were seen in the Gargamelle bubble chamber atCERN [J. Blietschau et al., Phys. Lett. 60B, 207 (1976)].
PLUTO and DASP at DESY were the leading candidates to produce convinc-ing evidence for charmed particles. The rise in the e+e− annihilation cross sectionnear a center-of-mass energy of 4 GeV strongly suggested that the threshold mustbe in that vicinity. The narrowness of the ψ ′ indicated that the threshold must beabove that mass since the ψ′ would be expected to decay rapidly into states likecu and uc if that were kinematically possible.
Despite advance knowledge of the approximate mass of the charmed particlesand their likely decay characteristics, it took nearly two years before irrefutableevidence for them was obtained. The task turned out to be quite difficult becausethere were many different decay modes, with each having a branching ratio of justa few percent.
Ultimately, the SLAC-LBL Mark I group did succeed in isolating decays likeD0 → K−π+ and D0 → K−π−π+π+ (Ref. 9.11), and soon after,D+ → K−π+π+ (Ref. 9.12). See Figure 9.36. Overwhelming evidence wasamassed identifying these new particles with the proposed charmed particles. Theirmasses were large enough to forbid the decay of the ψ ′ into a DD pair. The par-

Figure 9.36: Invariant mass spectrafor (a) K∓π±π± and (b) K∓π+π−.Only the former figure shows a peak,in agreement with the prediction thatD+ decays to K−π+π+, but notK+π−π+. (Ref 9.12)
ticles came in two doublets, (D+, D0) and (D0, D−), corresponding to cd, cu and
cu, cd. The decay mode D+ → K−π+π+ was seen, but D+ → K+π−π+ was not.It was possible to infer decay widths of less than 2 MeV, indicating that the decayswere unlikely to be strong. The D s shared some properties of the K s. They werepair-produced with a particle of equal or greater mass, indicating the existence ofa quantum number conserved in strong and electromagnetic interactions. In addi-tion, their decays were shown to violate parity. Both nonleptonic and semileptonicdecays were observed. The Cabibbo mixing in the four-quark model called fordecays c → d, suppressed by a factor roughly sin2 θc ≈ 5%. These, too, wereobserved in D0 → π+π− and D0 → K+K−. See Figure 9.37.
Further discoveries conformed to the charmed quark hypothesis. A set of part-ners about 140 MeV above the first states was found, with decays likeD∗+ → D0π+
(Ref. 9.13). See Figure 9.38. These decays were strong, the analogs of K ∗ → Kπ.Moreover, the spins of the D and D∗ were consistent with the expected assign-ments, pseudoscalar and vector, respectively. Detailed studies of the charmedmesons were aided enormously by the discovery by the Lead Glass Wall collabo-ration of a resonance just above the charm threshold (Ref. 9.14), shown in Fig-ure 9.39. The resonance, ψ(3772), is primarily a d-wave bound state of cc withsome mixture of 3S1. The bound state decays entirely to DD. The ψ(3772) is thus

Figure 9.37: Examples of Cabibbo-suppressed decay modes of charmed mesons observedat the ψ′′. Left: D0 → π+π− and D0 → K+K− as well as the Cabibbo-allowed decay toK∓π±. The data are from the Mark II experiment [G. S. Abrams et al., Phys. Rev. Lett.
43, 481 (1979)]. Right: D+ → K0K+ as well as the Cabibbo-allowed mode D+ → Kπ+
from the Mark III experiment [R. M. Baltrusaitis et al., Phys. Rev. Lett. 55, 150 (1985)].For the suppressed modes, two peaks are observed. The one near 1865 MeV is the signalwhile the other is due to K/π misidentification.
a D-meson “factory” and has been the basis for a continuing study of charmedmesons.
The quark model requires that in addition to charmed mesons, there must becharmed baryons, in which one or more of the first three quarks are replaced bycharmed quarks. Evidence for charmed baryons accumulated from a variety ofexperiments including neutrino bubble chamber experiments at Brookhaven andFermilab, a photoproduction experiment at Fermilab, a spectrometer experimentat the CERN Intersecting Storage Ring (ISR), and the work of the Mark II group atSPEAR. The lowest mass charmed baryon has the composition udc and is denotedΛ+c . It has been identified in decays to Λπ+π+π−,Λπ+, pK0
S , and pK−π+. Inagreement with the results for meson decays, the decay of the charmed baryonyielded negative strangeness.

Figure 9.38: Data for D0π+ withD0 → K−π+. The abscissa isthe difference between the Dπ massand the D mass. There is a clearenhancement near 145 MeV (G. J.Feldman et al. Ref. 9.13). Thevery small Q value for the D∗+ de-cay, 5.88 ± 0.07 MeV, has becomean important means of identifyingthe presence of a D∗+ in high en-ergy interactions. The data for
D0π+, a combination with the wrong
quantum numbers to be a quark–antiquark state, show no enhance-ment.
The strange-charmed meson with quark composition cs was even harder tofind than the D. At first called the F+ and now indicated D+
s , it was observedby the CLEO detector at Cornell, by the ARGUS detector at DORIS (located atDESY), and by the TPC and HRS at PEP (located at SLAC). Evidence for thisparticle is shown in Figure 9.40. The F ∗ or D∗s was also identified by TASSOat PETRA and the TPC, as well as the Mark III detector at SPEAR. It decayselectromagnetically, D∗s → Dsγ. While the mass splitting is possibly large enoughto permit D∗s → Dsπ
0, this decay is forbidden by isospin conservation.
The lifetimes of the charmed mesons D0, D+, and D+s as well as the charmed
baryon Λc and the τ lepton are all in the region 10−13 s to 10−12 s and hencesusceptible to direct measurement. The earliest measurements used photographicemulsions, with cosmic rays or beams at Fermilab or CERN providing the incidentparticles. This ‘ancient’ technique is well suited to the few micron scale dictatedby the small lifetimes. Studies were also conducted using special high resolutionbubble chambers at CERN and SLAC. The required resolution was also achievedwith electronic detectors at e+e− machines with the development of high precisionvertex chambers pioneered by Mark II and later by MAC and DELCO at PEP,and TASSO, CELLO, and JADE at PETRA. The latest stage of development

Figure 9.39: The ψ(3772) resonance isbroader than the ψ(3096) and ψ(3684)because it can decay into DD. P. A.Rapidis et al., (Ref. 9.14).
returned the focus to hadronic machines where the production rate of charmedparticles far exceeds that possible at e+e− machines. The detection with therequisite precision is achieved with silicon microstrips. Experiments carried out atCERN and Fermilab have achieved remarkable results, which required the analysisof 108 events in order to isolate several thousand charm decays.
Some of the lifetime measurements have relied on reconstructed vertices, otherson impact parameters of individual tracks, as first employed in π0 lifetime studies(Ref. 2.7). Figure 9.41 shows the photoproduction of a pair of charmed mesonsfrom the SLAC Hybrid Facility Photon Collaboration. Both decay vertices areplainly visible. In the same figure a computer reconstruction of a digitized bubblechamber picture from LEBC at CERN, with an exaggerated transverse magnifi-cation, is shown. Again, pair production of charmed particles is demonstrated.Exponential decay distributions for charmed mesons obtained using a tagged pho-ton beam at Fermilab are displayed in Figure 9.42.
The discoveries of the ψ, τ, and charm were pivotal events. They establishedthe reality of the quark structure of matter and provided enormous circumstantialevidence for the theoretical view dubbed “The Standard Model,” to be discussedin Chapter 12. The τ pointed the way to the third generation of matter, which isdiscussed in Chapter 11.
Figure 9.40: On the left, observation of the decay D+s → φπ+ by CLEO. In (a) only events
in which the K+K− invariant mass is consistent with the mass of the φ are plotted. In(b) only K+K−π events not containing a φ are shown [A. Chen et al., Phys. Rev. Lett.,51, 634 (1983)]. On the right, observation of the decay D+
s → K∗0K+ by ARGUS. In (a)only events with K−π+ in the K∗0 band are shown. In (b) only events without a K∗0 areshown [ARGUS Collaboration, Phys. Lett. 179B, 398 (1986)].

Figure 9.41: Left: A bubble chamber picture of the production and decay of a chargedcharmed particle and a neutral charmed particle. The charged particle decays into threetracks at 0.86 mm and the neutral decays after 1.8 mm. The quantities dmax and d2, thelargest and second largest impact distances were used in the lifetime calculations. Theincident photon beam (Emax = 20 GeV) was obtained by Compton scattering of laserlight off high energy electrons at SLAC [K. Abe et al., Phys. Rev. Lett. 48, 1526 (1982)].Right: A computer reconstruction of a digitized bubble chamber picture. The transversescale is exaggerated. The production vertex is at A. A charged charmed particle decays atC3 and a neutral charmed particle at V 2. The picture was obtained with LEBC (LexanBubble Chamber) at CERN using a 360-GeV π− beam [M. Aguilar-Benitez et al., Zeit.Phys. C31, 491 (1986)].

Figure 9.42: Proper time distributions for D0, D+, and D+s mesons and Λc baryons
from the Tagged Photon Spectrometer Collaboration at Fermilab, using silicon microstripdetectors [J. R. Raab et al., Phys. Rev. D37, 2391 (1988), J. C. Anjos et al., Phys. Rev.Lett. 60, 1379 (1988)]. For the D0, a corresponds to D∗+ → D0π+, D0 → K−π+, b toD∗+ → D0π+, D0 → K−π+π+π−, and c to D0 → K−π+. For the D+, the decay mode
is D+ → K−π+π+. For the D+s , a corresponds to D+
s → φπ+ and b to D+s → K
∗0K+,
K∗0 → K−π+. The observed lifetimes are τD0 = (0.422 ± 0.008 ± 0.010) × 10−12 s,
τD+ = (1.090 ± 0.030 ± 0.025) × 10−12 s, τDs= (0.47 ± 0.04 ± 0.02) × 10−12 s and τΛc
=0.22± 0.03± 0.02× 10⁻¹² s.
EXERCISES
9.1 Estimate the lifetime of theD-meson. Do you expect the neutral and chargedD’s to have the same lifetime? What do the data say?
9.2 Describe the baryons containing one or more charmed quarks that extend thelowest lying multiplets, the octet and decuplet. How many of these particleshave been found? Compare with Review of Particle Properties. What doyou expect their decay modes to be?
9.3 How have the most precise measurements of the mass of the ψ been made?See Ref.(9.15).
9.4 * Calculate the branching ratio for τ → πν. See Y. S. Tsai, Phys. Rev. D4,2821 (1971); M. L. Perl, Ann. Rev. Nucl. Part. Sci. 30, 229 (1980).
9.5 * Calculate the expected widths for ψ ′ → γχ2,1,0 in terms of the s- and p-statewave functions. Evaluate the results for a harmonic oscillator potential withthe charmed quark mass set to 1.5 GeV and the spring constant adjusted togive the level splitting between the ψ and ψ ′ correctly. Calculate the partialwidth for ψ → γηc. Why is the transition ψ′ → γηc suppressed? Compareyour results with the data given in the Review of Particle Properties. [Seethe lecture by J. D. Jackson listed in the Bibliography.]
9.6 * Show that the ψs produced in e+e− annihilation have their spins’ compo-nents along the beam axis equal either to +1 or −1, but not 0. (Use thecoupling of the ψ to e+e− : eγµeψ
µ)
9.7 * What is the angular distribution of the γ’s relative to the beam directionin e+e−→ ψ′ → γχ0? What is the answer for χ1 and χ2 assuming that thetransitions are pure E1? ( See E. Eichten et al., Phys. Rev. Lett. 34, 369(1975); G. J. Feldman and F. J. Gilman, Phys. Rev. D12, 2161 (1975); L.S. Brown and R. N. Cahn, Phys. Rev. D13, 1195 (1975).)
BIBLIOGRAPHY
e+e− Annihilation: New Quarks and Leptons, Benjamin/Cummings, Menlo Park,CA 1984, R. N. Cahn, ed. ( A collection of articles from Annual Review ofNuclear and Particle Science.)
J. D. Jackson, “Lectures on the New Particles” in Proc. of Summer Institute onParticle Physics, Stanford, CA, Aug. 2-13, 1976, M. Zipf, ed.
G. J. Feldman and M. L. Perl, “Electron-Positron Annihilation above 2 GeV andthe New Particles,”Phys. Rep. 19, 233 (1975) and 33, 285 (1977).

G. H. Trilling, “The Properties of Charmed Particles,” Phys. Rep. 75, 57 (1981).
S. C. C. Ting, “Discovery of the J Particle: a Personal Recollection,” Rev. Mod.Phys. 44(2), 235 (1977).
B. Richter, “From the Psi to Charm: the Experiments of 1975 and 1976,” Rev.Mod. Phys. 44(2), 251 (1977).
A popular account of much of the historical material in the chapter is containedin contributions by S. C. C. Ting, G. Goldhaber, and B. Richter in Adven-tures in Experimental Physics, ε, B. Maglich ed., World Science Education,Princeton, N.J., 1976. See also M. Riordan The Hunting of the Quark, Simon& Schuster, 1987.
REFERENCES
9.1 J. J. Aubert et al., “Experimental observation of a heavy particle J.” Phys.Rev. Lett., 33, 1404 (1974).
9.2 J.-E. Augustin et al., “Discovery of a narrow resonance in e+e− annihilation.”Phys. Rev. Lett., 33, 1406 (1974).
9.3 C. Bacci et al., “Preliminary result of Frascati (ADONE) on the nature ofa new 3.1 GeV Particle Produced in e+e− Annihilation.” Phys. Rev. Lett.,33, 1408 (1974).
9.4 G. S. Abrams et al., “Discovery of a Second Narrow Resonance in e+e−
Annihilation.” Phys. Rev. Lett., 33, 1453 (1974).
9.5 G. S. Abrams et al., “Decay of ψ(3684) into ψ(3095).” Phys. Rev. Lett., 34,1181 (1974).
9.6 W. Braunschweig et al., “Observation of the Two Photon Cascade 3.7 →3.1 + γγ via an Intermediate State Pc.” Phys. Lett., B57, 407 (1975).
9.7 R. Partridge et al., “Observation of an ηc Candidate State with Mass 2978±9MeV.” Phys. Rev. Lett., 45, 1150 (1980).; See also E. D. Bloom and C. W.Peck, Ann. Rev. Nucl. Part. Sci. 30, 229 (1983). “Physics with theCrystal Ball Detector” and J. E. Gaiser et al., “Charmonium Spectroscopyfrom Inclusive ψ′ and J/ψ Radiative Decays.” Phys. Rev., D34, 711 (1986).
9.8 M. L. Perl et al., “Evidence for Anomalous Lepton Production in e+e− An-nihilation.” Phys. Rev. Lett., 35, 1489 (1975).
9.9 R. Brandelik et al., “Measurements of Tau Decay Modes and a Precise De-termination of the Mass.” Phys. Lett., 73B, 109 (1978).

9.10 W. Bacino et al., “Measurement of the threshold Behavior of τ+τ− Produc-tion in e+e− Annihilation.” Phys. Rev. Lett., 41, 13 (1978).
9.11 G. Goldhaber et al., “Observation in e+e− Annihilation of a Narrow Stateat 1865 Mev/c2 Decaying to Kπ and Kπππ.” Phys. Rev. Lett., 37, 255(1976).
9.12 I. Peruzzi et al., “Observation of a Narrow Charged State at 1876 MeV/c2
Decaying to an Exotic Combination of Kππ.” Phys. Rev. Lett., 37, 569(1976).
9.13 G. J. Feldman et al., “Observation of the Decay D∗+ → D0π+.” Phys. Rev.Lett., 38, 1313 (1977).
9.14 P. A. Rapidis et al., “Observation of a Resonance in e+e− Annihilation Justabove Charm Threshold.” Phys. Rev. Lett., 39, 526 (1977).
9.15 A. A. Zholentz et al., “High Precision Measurement of the ψ and ψ ′ MesonMasses.” Phys. Lett., 96B, 214 (1980).