[j. res. natl. inst. stand. technol. 107 effect of loading ... · of the metal to local indentation...
TRANSCRIPT
Volume 107, Number 3, May–June 2002Journal of Research of the National Institute of Standards and Technology
[J. Res. Natl. Inst. Stand. Technol. 107, 299–306 (2002)]
Effect of Loading Rate Upon ConventionalCeramic Microindentation Hardness
Volume 107 Number 3 May–June 2002
George D. Quinn
National Institute of Standards andTechnology,Gaithersburg, MD 20899-8521
Parimal J. Patel
Weapons and Material Directorate,Army Research Laboratory,Aberdeen, MD 21005
and
Isabel Lloyd
Department of Materials andNuclear Engineering,University of Maryland,College Park, MD 21742
The world standards for conventionalceramic hardness have varying require-ments for control of loading rate during theindentation cycle. A literature reviewsuggests that loading rate may affectmeasured hardness in some instances. Inview of the uncertainty over this issue,new experiments over a range of indenta-tion loading rates were performed on asteel, sintered silicon carbide, and analuminum oxynitride. There was negligibleeffect upon Vickers hardness when load-ing rate was varied by almost four ordersof magnitude from approximately 0.03N/s to 10 N/s.
Key words: aluminum oxynitride;hardness; loading rate; silicon carbide.
Accepted: April 19, 2002
Available online: http://www.nist.gov/jres
1. Introduction
The majority of conventional microindentationhardness data is collected under quasi-static conditions.Indenter penetration rate is set to a nominal indentervelocity or loading rate. Usually the rate is slow enoughto avoid impact, yet fast enough that test cycle times arepractical. Impact causes underestimates of hardness iftransient load spikes create oversized indentations.Many conventional hardness machines have dashpots,solenoids, or other mechanisms to apply load smoothlyand avoid impact. Researchers have either focused onminimizing rate effects as sources of experimental errorin measuring static hardness, or alternatively, have
studied whether there is a genuine rate effect in thematerial’s hardness response. A short review follows.
Tabor’s 1951 seminal work [1] included a chapteron dynamic hardness that was defined as the resistanceof the metal to local indentation produced by arapidly moving indenter. The discussion was limited todropped-ball impact hardness testing. The dynamiccontact pressure at yielding was considered a dynamicharness number. Contact pressures could be estimatedby comparing the kinetic energy of the impacting inden-ter (less the rebound energy) to the energy to producethe indentation volume. This energy or work per unit
299
Volume 107, Number 3, May–June 2002Journal of Research of the National Institute of Standards and Technology
volume is analogous to hardness; hardness has unitsof force per area and multiplying the numerator anddenominator by the depth of penetration convertshardness to units of energy per volume. An alternativeanalysis using rebound height measurements could alsoestimate the yield pressure and dynamic hardness. Taborrecognized that the forces, displacements, and timehistory during impact indentation could be quite compli-cated and he had to begin with some simplifyingassumptions. His first model assumed that dynamicyield pressure was constant throughout the process ofimpact. This ignored dynamic effects that increase thepressure during the initial stage of impact. Elastic wavesset up in the indenter and the metal specimen wereassumed to absorb negligible energy. Temperatureincreases in the specimen were assumed to be negli-gible. With these assumptions, the rebound heightanalysis indicated that dynamic hardness was closeto static hardness values. The kinetic energy analysisproduced dynamic hardness values that were higherthan the static hardness. The difference, which wasat least a few percent (but could be greater in softermaterials) was attributed to additional forces associatedwith viscous flow of the metal around the indentation.Tabor added a cautionary remark about testing ingeneral: “If therefore, in static hardness measurements,there is any jolt or impact while the load is being appliedthe indentation will be larger than it should be and thededuced static hardness will be lower than the truevalue. It is thus evident that for satisfactory statichardness measurements the load must be applied veryslowly and smoothly.”
Mott [2], in his comprehensive 1956 survey of inden-tation testing, reviewed the effects of indenter inertiaand impact errors on measured hardness. Errors due toinertia effects were shown to be proportional to thekinetic energy of the indenter mechanism normalized bythe indentation load times the diagonal size. Largererrors occur for lower loads and faster indenters.McHolm [3] similarly showed that the kinetic energy ofa moving indenter adds to the available work that other-wise would be imparted to the test piece by quasi-staticloading. For an assumed indenter mass of 100 g and atest force of 1.96 N, kinetic energy could cause a 5 %decrease in effective Vickers hardness if indentervelocities exceed 150 �m/s. Early work suggestedindenter velocities of 10 �m/s to 15 �m/s were prudent,although Knoop et al. [4] found that speeds of up to300 �m/s were satisfactory. Knoop’s early apparatuswas commercialized in 1940 but a dashpot was soonadded to slow the indenter [5].
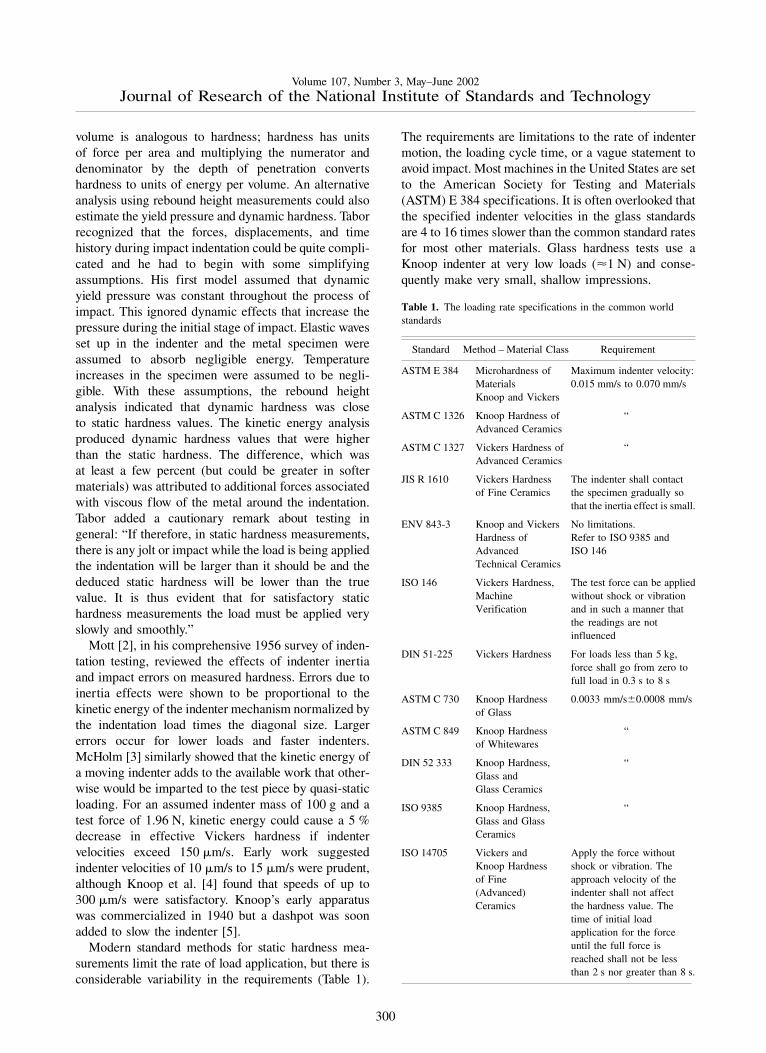
Modern standard methods for static hardness mea-surements limit the rate of load application, but there isconsiderable variability in the requirements (Table 1).
The requirements are limitations to the rate of indentermotion, the loading cycle time, or a vague statement toavoid impact. Most machines in the United States are setto the American Society for Testing and Materials(ASTM) E 384 specifications. It is often overlooked thatthe specified indenter velocities in the glass standardsare 4 to 16 times slower than the common standard ratesfor most other materials. Glass hardness tests use aKnoop indenter at very low loads (�1 N) and conse-quently make very small, shallow impressions.
Table 1. The loading rate specifications in the common worldstandards
Standard Method – Material Class Requirement
ASTM E 384 Microhardness of Maximum indenter velocity:Materials 0.015 mm/s to 0.070 mm/sKnoop and Vickers
ASTM C 1326 Knoop Hardness of “Advanced Ceramics
ASTM C 1327 Vickers Hardness of “Advanced Ceramics
JIS R 1610 Vickers Hardness The indenter shall contactof Fine Ceramics the specimen gradually so
that the inertia effect is small.
ENV 843-3 Knoop and Vickers No limitations.Hardness of Refer to ISO 9385 andAdvanced ISO 146Technical Ceramics
ISO 146 Vickers Hardness, The test force can be appliedMachine without shock or vibrationVerification and in such a manner that
the readings are notinfluenced
DIN 51-225 Vickers Hardness For loads less than 5 kg,force shall go from zero tofull load in 0.3 s to 8 s
ASTM C 730 Knoop Hardness 0.0033 mm/s�0.0008 mm/sof Glass
ASTM C 849 Knoop Hardness “of Whitewares
DIN 52 333 Knoop Hardness, “Glass andGlass Ceramics
ISO 9385 Knoop Hardness, “Glass and GlassCeramics
ISO 14705 Vickers and Apply the force withoutKnoop Hardness shock or vibration. Theof Fine approach velocity of the(Advanced) indenter shall not affectCeramics the hardness value. The
time of initial loadapplication for the forceuntil the full force isreached shall not be lessthan 2 s nor greater than 8 s.
300
Volume 107, Number 3, May–June 2002Journal of Research of the National Institute of Standards and Technology
In some instances, a material’s response to penetra-tion under fast dynamic conditions is of interest. Theextent of plastic deformation and dislocation movement,densification, micro fissuring, shear faulting, twinning,or crushing may be rate sensitive. In metals, the extentof strain hardening is affected by the loading rate. Theliterature has mixed results on the effect of loading rateupon ceramic hardness. Some work shows negligibleeffect of rate upon hardness while others show dramatichardness increases with faster loading rates. There isat least one report of decreased hardness with fasterloading rates.
Early dynamic hardness testing featured a“Scleroscope,” a machine invented in 1906 byA. Shore that dropped a diamond-tipped hammer250 mm onto a test piece [6,7]. Hardness was related tothe height of the rebound of the hammer. This method,which is only used nowadays for very large specimenssuch as steel forgings or rolls, is considered an indenta-tion hardness test since the hammer penetrates thespecimen, albeit with both elastic and plastic deforma-tion components. The Leeb portable hardness machinealso operates on a rebound principal with a spring-loaded tungsten carbide ball or diamond. An electronicinduction coil measures the velocity of the indenterbefore and after impact and hardness is computed fromthe ratio of the velocities [7].
Modern dynamic hardness tests include high strainrate apparatus such as split Hopkinson pressure bardevices [8,9,10], or balls or indenters fired by gas guns[11,12,13]. A dilemma in projectile indenter testing isthat the load history may be very complicated. The peakload and the load-time-displacement response of thematerial are difficult to analyze and depend upon theindenter and specimen properties. Crucial assumptionsabout the specimen and indenter interaction must beinvoked to solve the problems. For example, it is oftenassumed that deformation occurs at a constant strain rateor that the specimen offers a constant resistive pressuresimilar to Tabor’s assumptions [1]. A recent adaptationof the split Hopkinson bar device includes a load cellmounted directly under the test piece so that directreadings of the load cycle can be obtained withoutrecourse to modeling analysis [8-10]. Other dynamictesting utilizes conventional hardness machines that areset to faster than normal loading conditions. Someresearchers have used large capacity universal testingmachines that are adapted to simulate hardness testers.This is very risky since universal testing machines arenotoriously difficult to control precisely, especially ifthey are used in displacement control mode, and loadovershoots are common. Overshoots will generate largerindentations and lead to underestimates of dynamichardness.
Seshadri et al. [14] evaluated the effect of Vickersindenter impact velocity on the conventional hardness ofsintered alpha SiC and a glass ceramic. They used ahardness testing machine described as having a dead-weight system counterbalanced by a dashpot, althoughthe machine had a rather fast standard rate of 0.3 mm/s.Their work showed a negligible effect of indentervelocity over the range of 0.1 mm/s to 1.0 mm/s for aload of 49 N. A slight trend of decreasing hardness withincreasing rate may have existed, but was within theuncertainty (scatter bars) of the experiments. The yieldof usable indents decreased as the impact velocityincreased. Unusable indentations had excessive crackingthat hampered measurements of the diagonal lengths orhad indentation tips that fell on large pores. The crack-ing is not surprising since 49 N is a high load for sucha brittle material.
Yoshioka and Yoshioka [15] constructed an apparatusfor Vickers indentation of soda lime glass with indentervelocities of 0 mm/s to 2.8 mm/s and with dead weightloads of 3.5 N to 13.3 N. A camera monitored the sizeof the growing impression during the loading cycle.Strong nonlinear effects were attributed to a visco-elastic material response. The fastest growth in indenta-tion size occurred on initial loading and the initialpenetration rate was typically 0.2 times the collisionvelocity. Indentation growth decelerated until theimpression asymptotically reached its final size.Dynamic hardness was slightly reduced at faster rates.Adiabatic heating in the immediate locale of the impres-sion was suggested as a cause of the reduced hardnessat faster rates, a finding that agrees with earlier work onglass that also showed an inverse relationship betweenhardness and loading rate [16,17].
Hohne and Ullner [18] measured the instrumentedVickers hardness of steel, silicon nitride, and boro-silicate crown glass. In this modification of the tradi-tional Vickers hardness test, both load and displacementwere monitored during the indentation cycle. Severalindices of hardness were computed on the basis ofthe forces and the depths of penetration (as opposed tothe diagonal size). Peak load was 10 N and indentervelocities of 0.01 �m/s, 1 �m/s, and 40 �m/s wereused. Hardness was essentially independent of loadingrate at the two slower rates. Small hardness deviations atthe fastest rate were related to metrological problems indetermining the initial indenter contact point.
Evans and Wilshaw [12] reported the static Vickershardness of ZnS at 30 �C and –196 �C. At 30 �C,dynamic hardness increased from 2.0 GPa to 2.4 GPa asdisplacement rates increased from 2 �m/s to 2 �m/s.Unfortunately, the indentation load was not reported.Most ceramics exhibit a strong indentation size effectwhereby hardness varies with indentation load. It was
301
Volume 107, Number 3, May–June 2002Journal of Research of the National Institute of Standards and Technology
also not clear what type of testing machine was used.Although they reported these Vickers hardnesses, theirstudy was primarily concerned with dynamic sphereimpact testing at very high velocities (130 m/s to1000 m/s). Two different models for the force-timehistory were derived. One model used the laws ofmotion to correlate the projectile momentum to targetpenetration. A second model analyzed the transientcontact in terms of the projectile velocity and targetshock wave velocities and pressures. The former modelseemed to correlate to the observed sphere impactdamage patterns at velocities up to 160 m/s, whereas thelatter approach was better at velocities greater than400 m/s.
Chaudhri et al. [11] used a gas gun with glass andtungsten carbide balls fired at velocities up to 250 m/s tomeasure the dynamic hardness of MgO, LiF, and NaCl.Strain rates were estimated to be 0.6 � 105/s to4.8 � 105/s. Dynamic hardness was calculated by arebound analysis whereby a photo electronic circuitmonitored the incoming and rebound velocities of theimpactor. Following a similar analysis to Tabor’s, thekinetic energy of the ball less a fraction of the reboundkinetic energy was normalized by the volume of theindentation impression. The dynamic hardness of theMgO was much greater than the quasi-static hardnessthat was measured using a screw driven universal testingmachine at a 0.5 mm/min crosshead rate. LiF had somerate sensitivity, whereas NaCl had almost none. Dis-location motion as well as cracking contributed to therate sensitivities [11,19].
Marshall et al. [13] impacted ZnS with a cylindricalsapphire projectile with 136� facets cut on one end,simulating a Vickers diamond pyramid. The 1 mmdiameter by 1.3 mm long projectile (�0.004 g mass)was fired by an air gun at velocities from 1 m/s to40 m/s. Results were compared to static indentationsmade at 100 �m/s with a conventional indenter attachedto the crosshead of a testing machine. An analyticalmodel estimated the force and contact pressure historiesand the rate of deformation of the target as the projectiledecelerated. With their model, the dynamic hardnessvalue (�5.0 GPa) estimate was much greater than thestatic value of 1.9 GPa. Static indentation loads were notreported but may be deduced from the indentation sizesto have ranged from 6 N to 86 N.
Subhash and associates [8-10] recently used amodified split Hopkinson bar apparatus with a Vickersindenter at strain rates up to 2.2 � 103/s. A majoradvantage of their experimental methodology was that aload cell was able to continuously monitor load versustime. A special momentum trap was used to eliminatemultiple impacts. Dynamic hardness values for six
ceramics were greater than the static hardness values.The indenter velocity was 1.5 m/s based upon readoutsfrom a special strain gage transducer mounted on theindenter. A borosilicate glass showed the greatestrelative hardness increase, 25 %, at loads up to 30 N.Alumina, two aluminum nitrides, and two zirconias hada dynamic hardness from 9 % to 19 % greater than thestatic hardness at loads up to 600 N.
At very slow loading rates, indentation creep becomesan issue. Some studies have evaluated the effect ofdwell time upon conventional hardness at room[14,20,21,22,23,24] or elevated temperatures [25,26].Hardness either remains constant or decreases graduallywith longer dwell time. Anelastic deformation, viscouscreep, slow crack growth and other time dependentphenomena accounted for indentation growth.
In view of the conflicting results reviewed above,there is a concern that the rather large range of loadingrates permitted in the hardness standards (Table 1) mightcontribute to uncertainty to the measured values ofhardness. The present study was undertaken to ascertainwhether the general specifications in the world’shardness standards methods are adequate and to deter-mine whether a change in hardness could be detectedover a range of nearly three decades of loading rate(approximately 0.01 N/s to 1 N/s). Three significantlydifferent materials were tested at a single indentationload.
2. Experimental Procedure
A modern conventional hardness tester that couldvary loading rates over a broad range was employed[27].1 Load was applied by a screw-driven crossheadthat was controlled by a closed-loop feedback circuitconnected to a built-in 300 N load cell. The indenterwas mounted directly on the load cell. Loading rate wasprogrammed by choosing a ramp time from a 1 s mini-mum to a 1000 s maximum. Displacement control wasused until the specimen was contacted, then the machineshifted to load control to achieve the desired loadingramp rate. The machine cycle was programmed to slowthe rate just before peak load was reached in order toavoid overshoot [28]. A constant dwell time of 10 s
1 Certain commercial equipment, instruments, or materials are identi-fied in this paper to foster understanding. Such identification does notimply recommendation or endorsement by the National Institute ofStandards and Technology or the Army Research Laboratory, nor doesit imply that the materials or equipment identified are necessarily thebest available for the purpose.
302
Volume 107, Number 3, May–June 2002Journal of Research of the National Institute of Standards and Technology
was used for all experiments. The timing cycle wasmonitored with a stopwatch. The observed dwell timesat full load agreed with the programmed values, but theobserved ramp times were typically only 63 % of theprogrammed values for all settings from 1 s to 300 s.The discrepancy may have been due to a softwareproblem in this particular testing machine. The loadingrates reported in this paper are nominal valuescalculated as full load divided by the experimentallyobserved ramp time.
Indentation diagonal sizes were measured with thebuilt-in microscope using a 50� objective lens, 10�eyepieces, and either a green or blue filter. Field andaperture diaphragms were adjusted to obtain optimumindentation tip clarity. The primary source of uncer-tainty in an individual hardness test is the uncertainty ofthe diagonal length measurement. The uncertaintycontributions from the indentation load, the indenterconstant, and the loading rate are much less significantby comparison. One or more indentations weremeasured several or more times to assess the uncer-tainty of an individual diagonal length reading. Thestandard uncertainty (�1 standard deviation) of anaverage diagonal length measurement for one indenta-tion was between �0.1 �m and �0.5 �m dependingupon the material as discussed below.
Hardness was calculated from the standard formulafor force divided by contact area:
HV = 1.8544P
d 2(1)
where HV is Vickers hardness, P is the applied indenterload, and d is the average diagonal length for an individ-ual indentation.
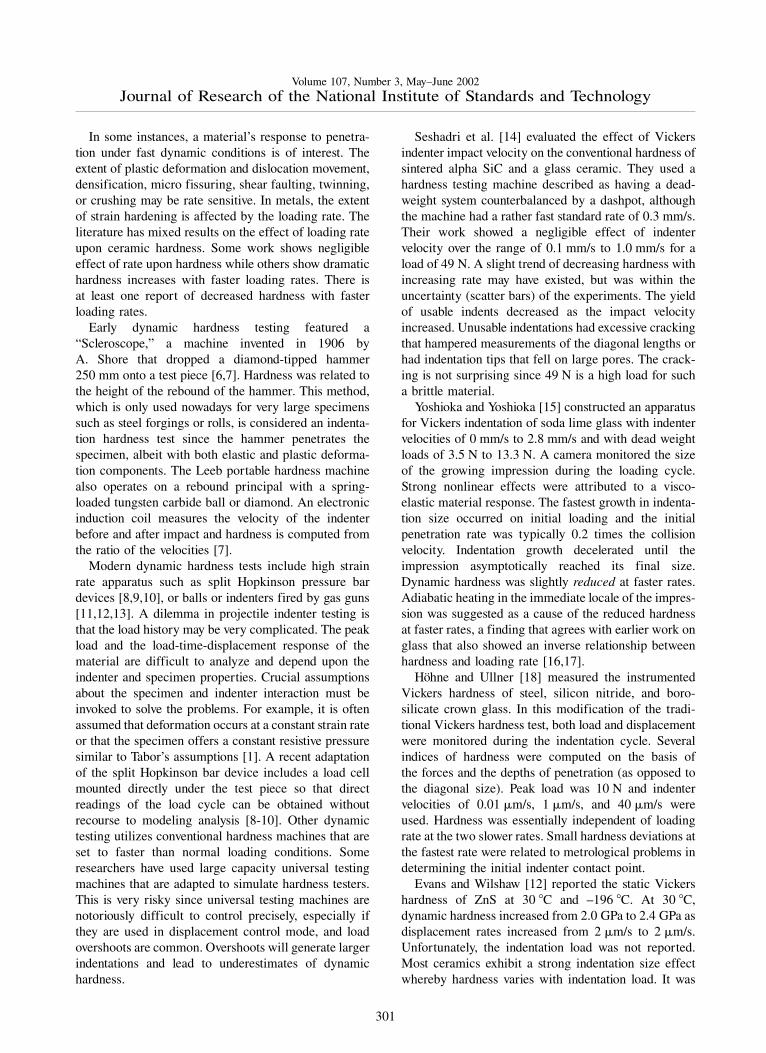
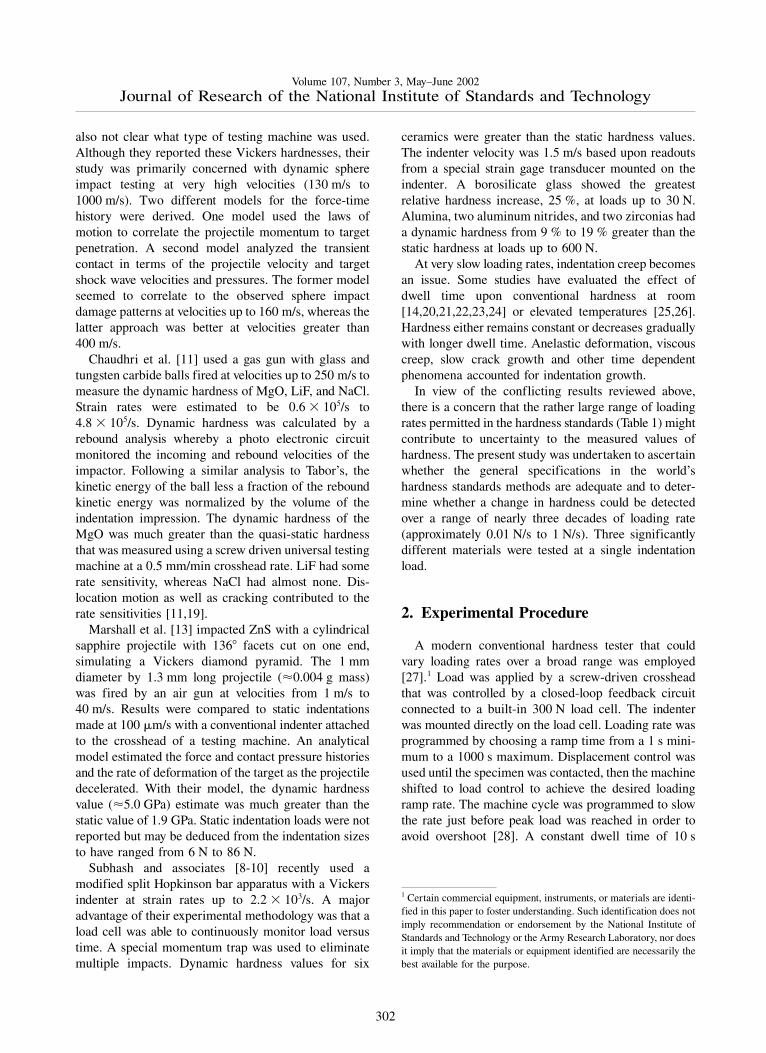
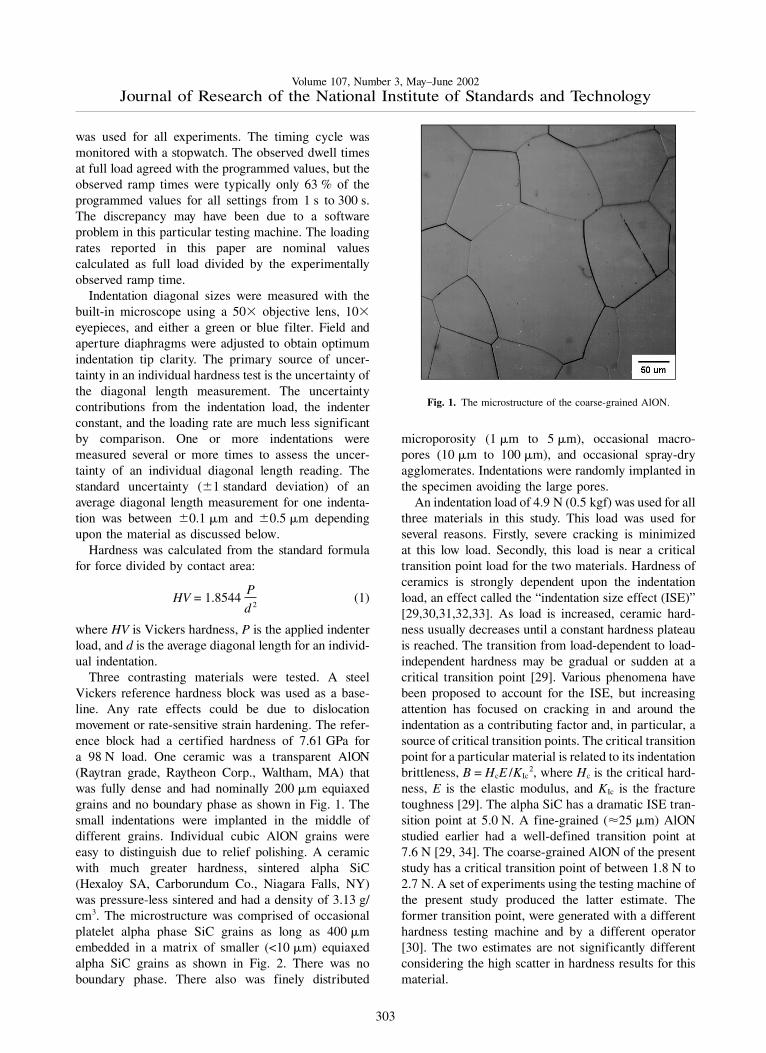
Three contrasting materials were tested. A steelVickers reference hardness block was used as a base-line. Any rate effects could be due to dislocationmovement or rate-sensitive strain hardening. The refer-ence block had a certified hardness of 7.61 GPa fora 98 N load. One ceramic was a transparent AlON(Raytran grade, Raytheon Corp., Waltham, MA) thatwas fully dense and had nominally 200 �m equiaxedgrains and no boundary phase as shown in Fig. 1. Thesmall indentations were implanted in the middle ofdifferent grains. Individual cubic AlON grains wereeasy to distinguish due to relief polishing. A ceramicwith much greater hardness, sintered alpha SiC(Hexaloy SA, Carborundum Co., Niagara Falls, NY)was pressure-less sintered and had a density of 3.13 g/cm3. The microstructure was comprised of occasionalplatelet alpha phase SiC grains as long as 400 �membedded in a matrix of smaller (<10 �m) equiaxedalpha SiC grains as shown in Fig. 2. There was noboundary phase. There also was finely distributed
microporosity (1 �m to 5 �m), occasional macro-pores (10 �m to 100 �m), and occasional spray-dryagglomerates. Indentations were randomly implanted inthe specimen avoiding the large pores.
An indentation load of 4.9 N (0.5 kgf) was used for allthree materials in this study. This load was used forseveral reasons. Firstly, severe cracking is minimizedat this low load. Secondly, this load is near a criticaltransition point load for the two materials. Hardness ofceramics is strongly dependent upon the indentationload, an effect called the “indentation size effect (ISE)”[29,30,31,32,33]. As load is increased, ceramic hard-ness usually decreases until a constant hardness plateauis reached. The transition from load-dependent to load-independent hardness may be gradual or sudden at acritical transition point [29]. Various phenomena havebeen proposed to account for the ISE, but increasingattention has focused on cracking in and around theindentation as a contributing factor and, in particular, asource of critical transition points. The critical transitionpoint for a particular material is related to its indentationbrittleness, B = HcE /KIc
2, where Hc is the critical hard-ness, E is the elastic modulus, and KIc is the fracturetoughness [29]. The alpha SiC has a dramatic ISE tran-sition point at 5.0 N. A fine-grained (�25 �m) AlONstudied earlier had a well-defined transition point at7.6 N [29, 34]. The coarse-grained AlON of the presentstudy has a critical transition point of between 1.8 N to2.7 N. A set of experiments using the testing machine ofthe present study produced the latter estimate. Theformer transition point, were generated with a differenthardness testing machine and by a different operator[30]. The two estimates are not significantly differentconsidering the high scatter in hardness results for thismaterial.
Fig. 1. The microstructure of the coarse-grained AlON.
303

Volume 107, Number 3, May–June 2002Journal of Research of the National Institute of Standards and Technology
The polished specimen surfaces were cleaned withethanol and dried with tissue paper prior to a test.Between 5 and 10 valid indentations (no excessivecracking and four well defined tips) were made for eachcondition.
3. Results and Discussion
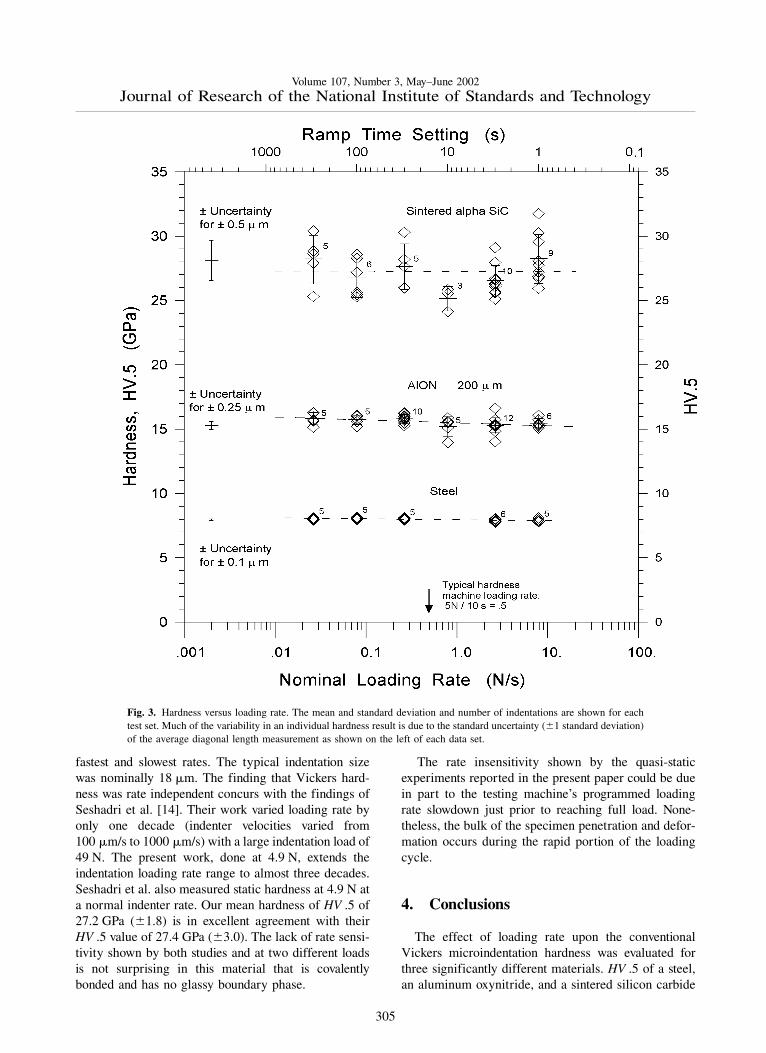
Figure 3 shows that hardness was independent ofloading rate for all three materials. Any possible trend isburied within the data scatter.
The scatter in the steel hardness data is very smallsince the material was very uniform and indentationswere easy to measure with good precision. The standarduncertainty (�1 standard deviation) of an averagediagonal length measurement was 0.1 �m to 0.15 �mdepending upon the test subset. The indentation sizewas nominally 34 �m. The low uncertainty in thediagonal length measurement yields small uncertaintyin hardness as shown by the scatter bar on the left sideof Fig. 3. The average hardness for 26 indentations was7.97 GPa (�0.12 GPa, standard deviation), in goodagreement with the 7.61 GPa certified value at a larger(98 N) load. The insensitivity of measured hardness toloading rate with the quasi-static rates used is notsurprising for steel, but these results confirm that thenew commercial testing machine functioned properlyand had no overshoot at the fastest loading rates.
The greater variability in the AlON was due in part tothe difficulty in measuring indentation sizes in thistransparent material. There was less contrast betweenthe indentation tips and the specimen surface. The
standard uncertainty of an average diagonal lengthmeasurement was �0.25 �m. Some of the variabilitywas due to the different crystallographic orientations ofthe individual cubic grains. The 24 �m indentationswere completely within individual grains in this coarse-grained AlON, and as such, the hardness values areprobably single crystal values. Small cracks were at theindentation corners but did not interfere very much withthe measurements. There was no obvious difference inthe appearance of the indentations or their crackingpropensities at the fastest and slowest rates. Nearly allthe indentations were acceptable. The average hardnessfor all 43 indentations was 15.5 GPa (�0.52 GPa) and isslightly greater than the 14.6 GPa reported earlier forthe finer-grained, not quite fully dense AlON for loadsabove the constant hardness plateau [34]. From theliterature review in the introduction, one may concludethat oxide ceramics and glasses are likely to be vulner-able to rate effects, but the AlON of the present studyhad negligible loading rate sensitivity when tested underthese quasi-static conditions.
The greatest scatter occurred with the silicon carbideand more indentations had to be made to obtain validindentations. Cracking at one or more indentation cor-ners was the most common problem, although lateralcracks spalled off the indentation sides in a few in-stances. Microporosity at the tips and grain dislodge-ments along the indentation sides also contributed todata scatter. The standard uncertainty of an averagediagonal length measurement was approximately0.5 �m. There was no obvious difference in the appear-ance of the indentations or their cracking patterns at the
Fig. 2. The microstructure of the sintered alpha SiC.
304
Volume 107, Number 3, May–June 2002Journal of Research of the National Institute of Standards and Technology
fastest and slowest rates. The typical indentation sizewas nominally 18 �m. The finding that Vickers hard-ness was rate independent concurs with the findings ofSeshadri et al. [14]. Their work varied loading rate byonly one decade (indenter velocities varied from100 �m/s to 1000 �m/s) with a large indentation load of49 N. The present work, done at 4.9 N, extends theindentation loading rate range to almost three decades.Seshadri et al. also measured static hardness at 4.9 N ata normal indenter rate. Our mean hardness of HV .5 of27.2 GPa (�1.8) is in excellent agreement with theirHV .5 value of 27.4 GPa (�3.0). The lack of rate sensi-tivity shown by both studies and at two different loadsis not surprising in this material that is covalentlybonded and has no glassy boundary phase.
The rate insensitivity shown by the quasi-staticexperiments reported in the present paper could be duein part to the testing machine’s programmed loadingrate slowdown just prior to reaching full load. None-theless, the bulk of the specimen penetration and defor-mation occurs during the rapid portion of the loadingcycle.
4. Conclusions
The effect of loading rate upon the conventionalVickers microindentation hardness was evaluated forthree significantly different materials. HV .5 of a steel,an aluminum oxynitride, and a sintered silicon carbide
Fig. 3. Hardness versus loading rate. The mean and standard deviation and number of indentations are shown for eachtest set. Much of the variability in an individual hardness result is due to the standard uncertainty (�1 standard deviation)of the average diagonal length measurement as shown on the left of each data set.
305

Volume 107, Number 3, May–June 2002Journal of Research of the National Institute of Standards and Technology
was independent of loading rate over approximatelythree decades up to 7.8 N/s. Therefore, the generalguidelines or specifications for loading rates in theworld standard test methods for ceramic conventionalhardness appear to be acceptable.
About the authors: George Quinn is a ceramicengineer in the Ceramics Division of the NISTMaterials Science and Engineering laboratory.Parimal Patel is a ceramic engineer with the Weaponsand Materials Research Directorate of the U.S. ArmyResearch Laboratory in Aberdeen, MD. Isabel Lloyd isan associate professor in the Materials and NuclearEngineering Department of the University of Maryland,College Park, MD. The National Institute of Standardsand Technology is an agency of the TechnologyAdministration, U.S. Department of Commerce.
5. References
[1] D. Tabor, The Hardness of Metals, Clarendon Press, Oxford(1951).
[2] B. W. Mott, Micro-Indentation Hardness Testing, Butterworths,London (1956).
[3] I. McHolm, Ceramic Hardness, Plenum, NY (1990).[4] F. Knoop, C. G. Peters, and W. B. Emerson, A Sensitive
Pyramidal-Diamond Tool For Indentation Measurements,J. Res. Natl. Bur. Stands. (U.S.) 23, 39-61 (1939).
[5] N. W. Thibault and H. L. Nyquist, The Measured KnoopHardness of Hard Substances and Factors Affecting its Determi-nation, Trans. ASM, 38, 271-330 (1947).
[6] V. A. Lysaght, Indentation Hardness Testing, Reinhold Publ.NY (1949).
[7] E. L. Tobolski, Miscellaneous Hardness Tests, in MechanicalTesting and Evaluation, ASM Handbook, Volume 8, H. Kuhnand D. Medlin, eds., ASM, Ohio (2000) pp. 252-259.
[8] G. Subhash, B. J. Koeppel, and A. Chandra, Dynamic Indenta-tion Hardness and Rate Sensitivity in Metals, J. Eng. Mat.Techn. 121, 257-263 (1999).
[9] S. Subhash, Dynamic Hardness Testing, in Mechanical Testingand Evaluation, ASM Handbook, Volume 8, H. Kuhn andD. Medlin, eds., ASM, Ohio (2000) pp. 519-529.
[10] R. J. Anton and G. Subhash, Dynamic Vickers Indentation ofBrittle Materials, Wear 239 (1), 27-35 (2000).
[11] M. M. Chaudhri, J. K. Wells, and A. Stephens, DynamicHardness, Deformation and Fracture of Simple Ionic Crystals atVery High Rates of Strain, Phil. Mag. A 43 (3), 643-664 (1981).
[12] A. G. Evans and T. R. Wilshaw, Dynamic Solid ParticleDamage in Brittle Materials: An Appraisal, J. Mater. Sci. 12,97-116 (1977).
[13] D. Marshall, A. Evans, and Z. Nisenholz, Measurement ofDynamic Hardness by Controlled Sharp-Projectile Impact,J. Am. Ceram. Soc. 66 (8), 580-585 (1983).
[14] S. Seshadri, M. Srinivasan, and L. King, Indentation FractureTesting of Ceramics, Ceramic Eng. Sci. Proc. 4 (9-10), 853-863(1983).
[15] M. Yoshioka and N. Yoshioka, Dynamic Process of VickersIndentation Made on Glass Surfaces, J. Appl. Phys. 78 (5),3431-3437 (1995).
[16] D. M. Marsh, Plastic Flow in Glass, Proc. Roy. Soc. A 279,420-435 (1964).
[17] L. Ainsworth, The Diamond Pyramid Hardness of Glass inRelation to the Strength and Structure of Glass, part I, J. Soc.Glass Techn. 38, 479-500 (1954).
[18] L. Hohne and C. Ullner, How Does Indentation VelocityInfluence the Recording Hardness Value?, VDI Berichte 1194,119-128 (1995).
[19] R. W. Armstrong and W. L. Elban, in MicroindentationTechniques in Materials Science and Engineering, ASTM STP829, P. Blau and B. Lawn, eds., ASTM, West Conshohocken, PA(1986) p. 109.
[20] S. P. Gunasekera and D. G. Holloway, Effect of Loading Timeand Environment on the Indentation Hardness of Glass, Phys.Chem. Glasses 14 (2), 45-52 (1973).
[21] C. J. Fairbanks, R. S. Polvani, S. M. Wiederhorn, B. J. Hockey,and B. J. Lawn, Rate Effects in Hardness, J. Mater. Sci. Lett. 1,391-393 (1982).
[22] A. L. Yurkov, Effects of Creep at Room Temperature inCeramics During Indentation, J. Mater. Sci. Lett. 12, 767-769(1993).
[23] J. H. Westbrook and P. J. Jorgensen, Indentation Creep of Solids,Trans. Meet. Soc. AIME 233, 425-428 (1965).
[24] D. M. Marsh, Plastic Flow and Fracture of Glass, Proc. Roy. Soc.A, A282, 33-43 (1964).
[25] J. Henhall, G. M. Carter, and R. M. Hooper, Indentation Creepin Zirconia Ceramics Between 290 K and 1073 K, in Mechanicsof Creep, Brittle Materials, A. Cooks and A. Ponter, eds.,Elsevier, London (1989) pp. 117-128.
[26] W. Kollenberg, Anisotropy of Indentation Creep in Sapphire at500 and 750 �C, J. Mater. Sci. Lett. 7, 1076-1077 (1988).
[27] Tukon 2100, Wilson Division of Instron, Canton, MA.[28] S. Webb, Private communication, Wilson Div. of Instron Corp.,
2000.[29] J. B. Quinn and G. D. Quinn, Indentation Brittleness of
Ceramics: A Fresh Approach, J. Mater. Sci. 32, 4331-4346(1997).
[30] P. Patel, J. J. Swab, M. Staley, and G. D. Quinn, CriticalHardness of Transparent AlON and MgAl2O4, submitted toJ. Amer. Ceram. Soc. 2001.
[31] H. Li and R. C. Bradt, The Microhardness Indentation Size-LoadEffect (ISE) in Hard Ceramic Materials, J. Hard Mater. 3 (3-4),403-419 (1992).
[32] H. Li and R. C. Bradt, The Effect of Indentation-InducedCracking on the Apparent Microhardness, J. Mater. Sci. 31,1065-1070 (1996).
[33] P. M. Sargent and T. F. Page, The Influence of Microstructure onthe Microhardness of Ceramic Materials, Proc. Brit. Ceram.Soc. 26, 209-224 (1987).
[34] G. D. Quinn, N. D. Corbin, and J. W. McCauley, Thermo-mechanical Properties of Aluminum Oxynitride Spinel (ALON),Bull. Am. Ceram. Soc. 63 (5), 723-729 (1984).
306