j. carmassi completing the banking union with a european ...€¦ · – 3, 5 and 10 largest banks...
TRANSCRIPT

Completing the Banking Union with a European Deposit Insurance Scheme: who is afraid of cross-subsidisation?
2019 Biennial IADI Research Conference
23 May 2019, Basel
J. Carmassi
S. Dobkowitz
J. Evrard
L. Parisi
A. F. Silva
M. Wedow
The views expressed are solely our own and do not necessarily represent the opinions of the
European Central Bank or the Eurosystem, or those of the Board of Governors of the Federal
Reserve System

Rubric
www.ecb.europa.eu ©
Deposit insurance: removes depositors’ incentives to run when concerned
about a bank’s solvency
2
Motivation
Protects banks against funding
shocks
Reduces likelihood and
severeness of banking crises
Protects depositors against bank
crises
Mobilisation of savings towards
financing the economy
After the 2007-2009 crisis, deposit insurance reinforced
• More countries with deposit insurance scheme: today 143
• Some countries strengthening deposit guarantee (e.g. US, EU)

Rubric
www.ecb.europa.eu © 3
2
3
Conclusions
Quantitative assessment of EDIS
1 Background
Annex
Rubric
www.ecb.europa.eu ©
• EDIS would strengthen depositor confidence and protection
– Reducing the vulnerability of national schemes to local and systemic shocks
(via pooling of resources), thus reducing bank-sovereign nexus
– Increasing depositor confidence in the safety of their deposits which would
protect banks against funding shocks and contribute to financial stability
– Ensuring uniform level of depositor protection independent of bank
location which would promote financial integration
– Aligning responsibilities of supervision and resolution at the Banking Union
level
– Minimising coordination costs through centralised decision-making body
• Although EDIS is the focus of this study, it has to be complemented by
other Banking Union elements
– EDIS not designed for generalised banking crisis
4
1.1 Rationale for EDIS
1. Background

Rubric
www.ecb.europa.eu © 5
• Concerns have been voiced regarding:
– Methodology for risk-based contributions: are they able to correctly reflect different
bank-specific and/or banking-sector specific risk factors?
– Disproportionate impact on smaller and larger banks
– Appropriateness of EDIS target size
– Possibility of certain banking systems subsidising other banking systems
This paper: examines the validity of these concerns using a unique micro-
level dataset on covered deposits for 2,148 euro area banks
1.2 State of play
1. Background
June 2018
Euro Summit: Roadmap to start political
negotiations on EDIS
Meseberg declaration: Conditionalities to start
discussion on EDIS
Dec 2018 Nov 2015
COM proposal
on EDIS
Oct 2017
COM comm. on revised
approach for EDIS Establishment of HLWG on
EDIS (and BU)
Level of ambition declining compared to original proposal given strong divergent
views on level and sequencing of risk-reduction and risk-sharing in Banking Union

Rubric
www.ecb.europa.eu © 6
1 Background
2
3
Conclusions
Quantitative assessment of EDIS
2.3 Is the size of EDIS adequate?
2.1 Key features and assumptions
Annex
2.2 Risk-based contributions
2.5 Additional tests
2.4 Is there evidence of cross-subsidisation?
Rubric
www.ecb.europa.eu © 7
2. Quantitative assessment of EDIS
2.1 Key features and assumptions (1/4)
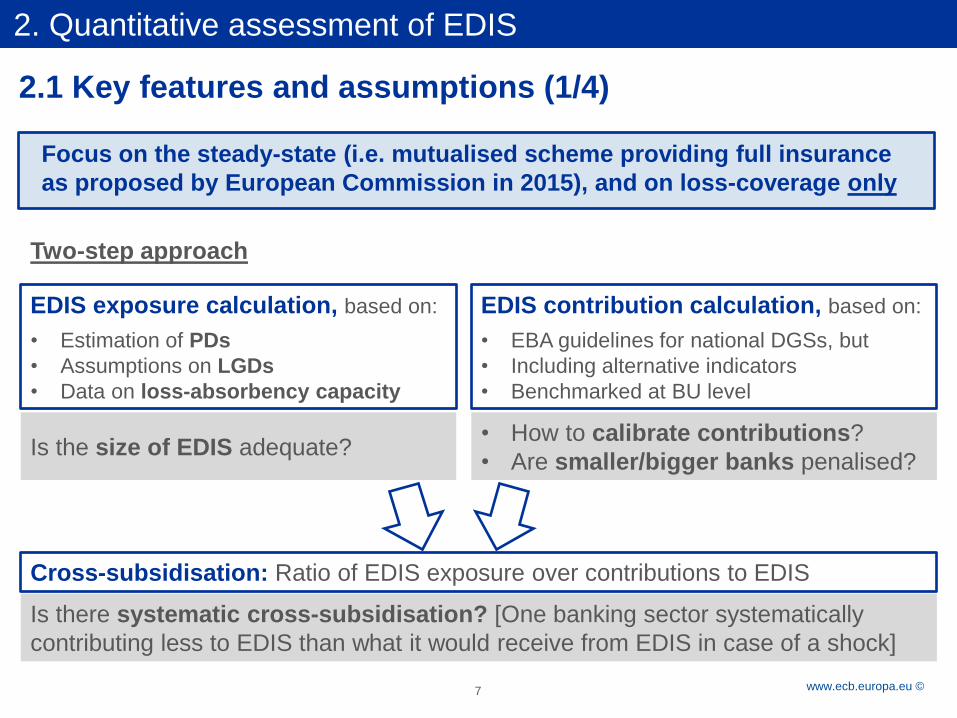
Focus on the steady-state (i.e. mutualised scheme providing full insurance
as proposed by European Commission in 2015), and on loss-coverage only
Two-step approach
EDIS exposure calculation, based on:
• Estimation of PDs
• Assumptions on LGDs
• Data on loss-absorbency capacity
EDIS contribution calculation, based on:
• EBA guidelines for national DGSs, but
• Including alternative indicators
• Benchmarked at BU level
Cross-subsidisation: Ratio of EDIS exposure over contributions to EDIS
Is there systematic cross-subsidisation? [One banking sector systematically
contributing less to EDIS than what it would receive from EDIS in case of a shock]
• How to calibrate contributions?
• Are smaller/bigger banks penalised? Is the size of EDIS adequate?

Rubric
www.ecb.europa.eu © 8
• Early-warning model to estimate PDs
‒ Using panel data from 2000 to 2015 for 5,526 banks
‒ Bank-specific, aggregate banking sector and macro-
economic/financial variables
‒ Bank distress/default defined as follows:
‒ Status of bank in Orbis Bank Focus is “bankruptcy”, “dissolved”, “in
liquidation”
‒ Negative capital
‒ Bank involved in a distressed merger
‒ Bank received state aid (state aid database from European
Commission)
2.1 Key features and assumptions (2/4)
2. Quantitative assessment of EDIS

Rubric
www.ecb.europa.eu © 9
2. Quantitative assessment of EDIS
2.1 Key features and assumptions (3/4)
• Point-in-time estimation: end-2017
• Sample: 2,148 banks
• EDIS target size for sample: 0.8% of
covered deposits = €39.3 bn
75%
TA
90%
Cov Deposits
Number of banks assumed to fail
The 3% and 10% riskiest banks (based
on PDs) are assumed to simultaneously
fail
- 3% scenario: 65 banks
- 10% scenario: 215 banks
SIMULATED SCENARIOS
Loss rates applied to failing banks
For each of the 3% and 10% scenarios,
a range of loss rates is applied
- in resolution: 5% - 25% of Total Assets
- in insolvency: assumed 50% higher than
in resolution

Rubric
www.ecb.europa.eu © 10
2. Quantitative assessment of EDIS
Loss-absorbing process
• In resolution:
– bail-in of regulatory capital, subordinated debt and senior unsecured bonds with
a remaining maturity of at least 12 months
– SRF tapped only after bail in of 8%TA reached, and capped at 5%TA per bank
• In liquidation:
– All liabilities except secured liabilities and covered deposits take losses before
EDIS
EDIS exposure:
• losses not absorbed by bail-in and SRF in resolution
• losses not absorbed by liabilities (except CD and secured) in liquidation
Note:
• EDIS exposure in resolution ≤ theoretical exposure if the bank had been subject
to insolvency (art. 109 BRRD and art. 79 SRMR)
2.1 Key features and assumptions (4/4)
10

Rubric
www.ecb.europa.eu © 11
2. Quantitative assessment of EDIS
• EBA methodology for national DGS - but contributions calibrated at BU level
• “Polluter pays” approach: EDIS contributions = CD * Risk Factor * ε
• Different risk indicators in the calculation of EDIS contributions (with and without MREL,
insolvency, NPL ratio, interconnectedness) variations in risk factors including different
indicators
0.0%
0.2%
0.4%
0.6%
0.8%
1.0%
1.2%
1.4%
1.6%
1.8%
AT BE CY DE EE ES FI FR GR IE IT LT LU LV MT NL PT SI SK
Ris
k f
acto
r
Median
2.2 Risk-based contributions (1/2)
Rubric
www.ecb.europa.eu © 12
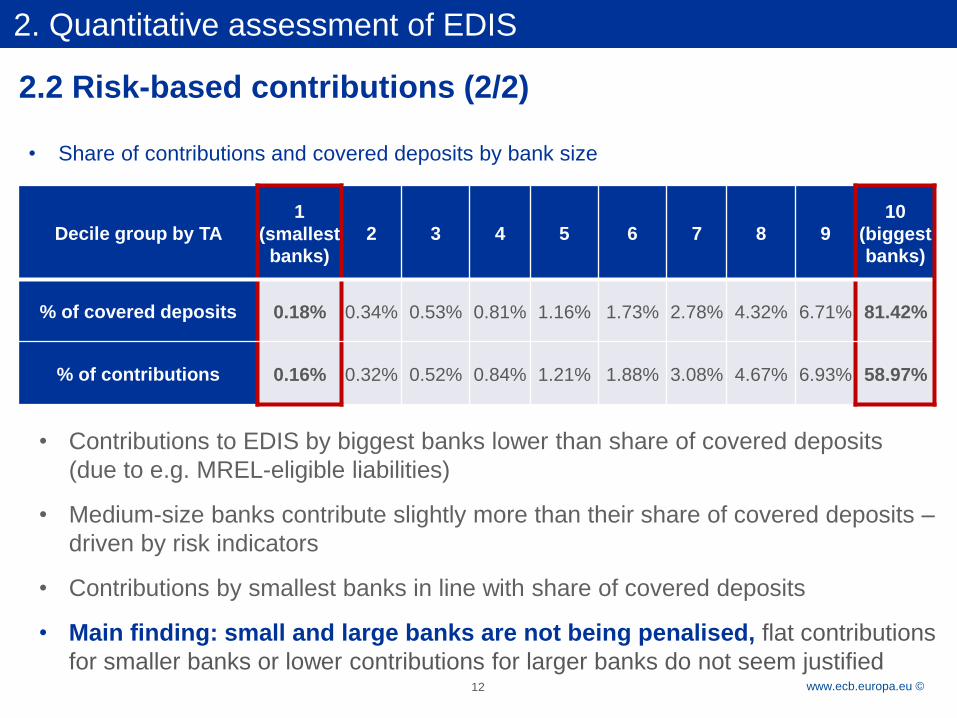
Decile group by TA 1
(smallest
banks) 2 3 4 5 6 7 8 9
10
(biggest
banks)
% of covered deposits 0.18% 0.34% 0.53% 0.81% 1.16% 1.73% 2.78% 4.32% 6.71% 81.42%
% of contributions 0.16% 0.32% 0.52% 0.84% 1.21% 1.88% 3.08% 4.67% 6.93% 58.97%
• Contributions to EDIS by biggest banks lower than share of covered deposits
(due to e.g. MREL-eligible liabilities)
• Medium-size banks contribute slightly more than their share of covered deposits –
driven by risk indicators
• Contributions by smallest banks in line with share of covered deposits
• Main finding: small and large banks are not being penalised, flat contributions
for smaller banks or lower contributions for larger banks do not seem justified
2. Quantitative assessment of EDIS
2.2 Risk-based contributions (2/2)
• Share of contributions and covered deposits by bank size

Rubric
www.ecb.europa.eu © 13
2.3 Is the size of EDIS adequate?
2. Quantitative assessment of EDIS
0.0 0.0 0.0 0.1 0.3
0.0 0.0 0.2
0.5
1.0
5% 10% 15% 20% 25%
Full bail-in (scenario A)*
3% riskiest banks 10% riskiest banks
0.0 0.0 0.0 1.3
14.0
0.0 0.0 0.2
3.6
21.3
5% 10% 15% 20% 25%
More limited bail-in (scenario B)*
3% riskiest banks 10% riskiest banks
ED
IS S
IZE
= E
UR
39.3
bn
*Scenario A: in resolution all liabilities except for secured liabilities and covered deposits absorb losses. Scenario B: in
resolution only capital, subordinated debt and senior unsecured bonds with a remaining maturity of at least 12 months
absorb losses.

Rubric
www.ecb.europa.eu © 14
2.4 Is there evidence of cross-subsidisation?
3% riskiest banks simultaneously fail (65 banks)
2. Quantitative assessment of EDIS
Main findings:
- No cross-subsidisation in any Member State up to losses equal to 15%TA;
- Cross-subsidisation in Belgium, Spain and Slovakia for losses equal to 25%TA (extremely
higher than the losses evidenced in last crisis)
2.8
0.1
7.4
1.3
0.9
0.2
1.1
AT BE CY DE EE ES FI FR GR IE IT LT LU LV MT NL PT SI SK
5% LGD in res. 10% LGD in res. 15% LGD in res.
20% LGD in res. 25% LGD in res.
Rubric
www.ecb.europa.eu © 15
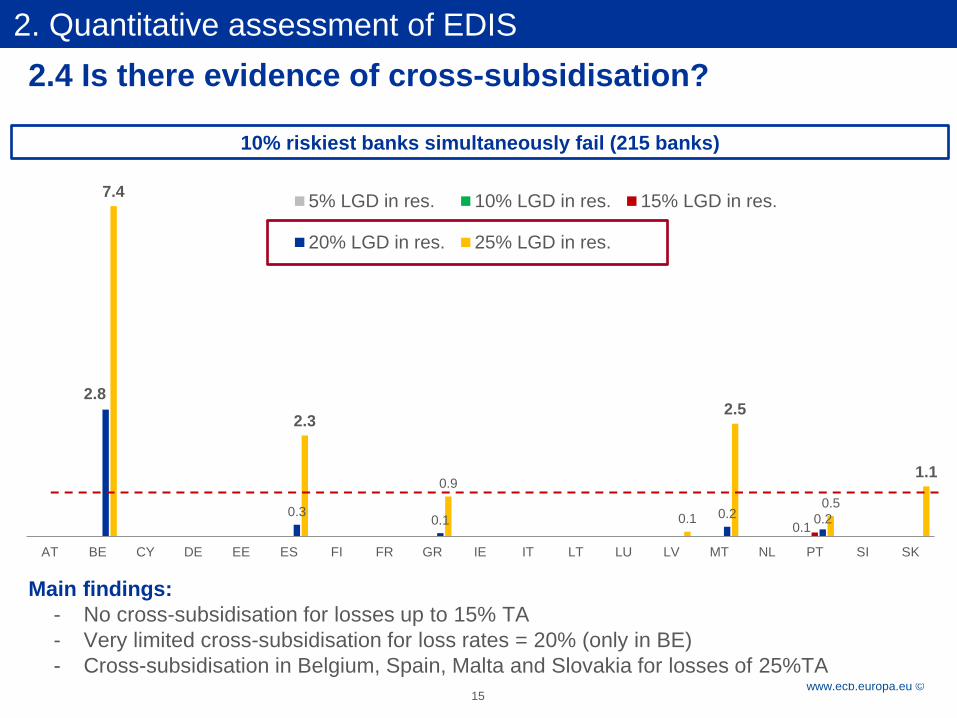
2.4 Is there evidence of cross-subsidisation?
10% riskiest banks simultaneously fail (215 banks)
2. Quantitative assessment of EDIS
Main findings:
- No cross-subsidisation for losses up to 15% TA
- Very limited cross-subsidisation for loss rates = 20% (only in BE)
- Cross-subsidisation in Belgium, Spain, Malta and Slovakia for losses of 25%TA
0.1
2.8
0.3 0.1
0.2 0.2
7.4
2.3
0.9
0.1
2.5
0.5
1.1
AT BE CY DE EE ES FI FR GR IE IT LT LU LV MT NL PT SI SK
5% LGD in res. 10% LGD in res. 15% LGD in res.
20% LGD in res. 25% LGD in res.

Rubric
www.ecb.europa.eu © 16
2.5 Additional tests
2. Quantitative assessment of EDIS
• Country shocks
– 14%TA riskiest banks failing in each country (equivalent to 3% scenario): limited EDIS
exposures (max € 9.6 bn for LGD = 25%TA in resolution), and cross-subsidisation only in
ES
– BIG BLACK SWAN SCENARIO - 80%TA riskiest banks failing in each country
(equivalent to 10% scenario): EDIS exhausted only for LGD = 25%TA in resolution (€
45.2 bn), and cross-subsidisation in BE, DE, ES, FI, SK
• Random shocks
– 3% random banks failing: very limited EDIS exposures (max € 2.6 bn for LGD=25% in
resolution), and no cross-subsidisation
– 10% random banks failing: very limited EDIS exposures (max € 8.6 bn for LGD=25% in
resolution), and no cross-subsidisation
• G-SIB shocks
– 3, 5 and 10 largest banks failing (representing from 23% to 50% of TA of sample).
– No EDIS exposures and cross-subsidisation up to LGD = 35%TA in resolution
– For LGD = 35%TA
• EDIS exposure = € 27.3 bn for 3 and 5 largest banks failing
• EDIS exposure = € 47.2 bn for 10 largest banks failing

Rubric
www.ecb.europa.eu © 17
1 Background
2
3
Conclusions
Quantitative assessment of EDIS
Annex

Rubric
www.ecb.europa.eu © 18
• Main findings:
˗ Size of EDIS sufficient to cover losses even in a very severe crisis
˗ No evidence of systematic cross-country subsidisation within EDIS. Result holds
also with country shocks, random shocks or biggest banks simultaneously failing
˗ With respect to previous analysis (year-end 2015 data), results in terms of EDIS
exposure decrease
• Key elements driving results:
˗ Risk-based contributions crucial, implementing a “polluter pays” approach
˗ Significant risk reduction and increased loss absorbing capacity that took place in
wake of crisis (e.g. higher levels of capital, resolution framework, bail-in, MREL)
˗ Super priority for covered deposits
• Conclusions:
˗ EDIS would offer large benefits in terms of enhancing confidence and avoiding
self-fulfilling crisis (e.g. bank runs, generalised deposit outflows)
˗ While posing very limited risks in terms of EDIS exposure and cross-subsidisation
3. Conclusions

Rubric
www.ecb.europa.eu ©
1 Background
2
3
Conclusions
Quantitative assessment of EDIS
Annex
A.4 Is there cross-subsidisation by country in case of random shocks?
A.2 Risk-based contributions
A.6 Is there cross-subsidisation by country when largest banks fail?
A.1 PD estimation model
A.5 Is there cross-subsidisation by country in case of country shocks?
A.3 Is there cross-subsidisation by country? Baseline scenario
19

Rubric
www.ecb.europa.eu © 20
A1. PD estimation model
(1) (2) (3) (4) (5) (6)
Interest Expenses / Total Liabilities 0.287*** 0.287*** 0.301*** 0.264*** 0.281*** 0.285***
Provisions for NPLs / Total Assets 0.402*** 0.403*** 0.363*** 0.341*** 0.230*** 0.256***
Tangible Equity / Total Assets -0.20*** -0.19*** -0.18*** -0.12*** -0.12*** -0.116***
ln Total Assets 0.247*** 0.171*** 0.163***
Return on Equity -0.02*** -0.02***
Deposits / Total Assets -0.02*** -0.02***
Cost to Income Ratio 0.013*** 0.012***
Financial Assets / GDP 0.000 0.000 0.000** 0.001*** -0.000
Loans / Deposits (1-year change) -0.007** -0.01*** -0.01*** -0.003 -0.005**
Mortgages / Loans (1-year change) -0.002 -0.054 -0.037 -0.046 -0.125**
Issued debt / Total liabilities (1-year change)
-0.19*** -0.08** -0.09***
Bank Concentration 2.941*** 0.097
Total credit / GDP (3-year change) 0.005 0.002 0.001 0.010**
10-year yield (1-year change) 0.048*** 0.055*** 0.043*** 0.047***
Unemployment 0.092*** 0.052*** 0.023 0.064*
ln GDP per capita -0.863* -0.653 -1.295
Inflation 0.075*** 0.087***
No. Observations 55,418 55,418 55,418 55,418 55,418 55,418
Country FE N N N N N Y
No. Banks 5,526 5,526 5,526 5,526 5,526 5,526
No. Distressed Banks 287 287 287 287 287 287
AUROC 0.828 0.828 0.828 0.827 0.867 0.871
Pseudo-R-squared 0.162 0.165 0.176 0.207 0.269 0.284

Rubric
www.ecb.europa.eu © 21
A1. PD estimation model
Two out of sample tests to validate PD estimation model
• Prediction of PDs as of 2015, using data from 2000 to 2013, and comparison
with actual distress/defaults (according to our definition)
Diagnostic 97th percentile as threshold 90th percentile as threshold
TP rate 0.8% 1.4%
TN rate 95.4% 89.1%
FP rate 2.1% 8.4%
FN rate 1.4% 0.8%
Accuracy 96.2% 90.5%
Sensitivity 36.3% 62.5%
• Correlation between CDS spreads and estimated PDs in 2017 (possible for 73
banks due to data constraints)
• Correlation equal to 0.59 and 0.57 for 2 and 5-year CDS spreads, respectively

Rubric
www.ecb.europa.eu ©
22
How do risk-based contributions to EDIS change according to different risk-factors in the methodology?
A2. Risk-based contributions
MS N.
banks
Non risk-based
(0.8% of covered
deposits)
DGS - Baseline DGS without
MREL indicator
DGS plus
Interconnected.
DGS plus NPL
ratio
DGS plus
insolvency
indicator
EUR bn % Fund EUR bn % Fund EUR bn % Fund EUR bn % Fund EUR bn % Fund EUR bn % Fund
AT 333 0.79 2.0 0.69 1.8 0.61 1.6 0.70 1.8 0.82 2.1 0.82 2.1
BE 13 0.60 1.5 0.45 1.1 0.43 1.1 0.50 1.3 0.45 1.1 0.46 1.2
CY 5 0.02 0.1 0.03 0.1 0.02 0.1 0.03 0.1 0.04 0.1 0.03 0.1
DE 1375 12.35 31.4 15.37 39.1 14.20 36.1 14.11 35.9 15.14 38.5 12.48 31.8
EE 6 0.01 0.0 0.01 0.0 0.01 0.0 0.01 0.0 0.01 0.0 0.01 0.0
ES 19 7.46 19.0 7.15 18.2 7.54 19.2 7.40 18.8 6.91 17.6 7.89 20.1
FI 5 0.08 0.2 0.09 0.2 0.08 0.2 0.07 0.2 0.08 0.2 0.07 0.2
FR 34 6.89 17.5 5.44 13.8 5.83 14.8 5.99 15.2 5.21 13.3 6.61 16.8
GR 7 0.81 2.1 0.92 2.4 0.99 2.5 0.91 2.3 1.25 3.2 1.01 2.6
IE 7 0.62 1.6 0.42 1.1 0.43 1.1 0.49 1.2 0.46 1.2 0.52 1.3
IT 242 4.44 11.3 4.44 11.3 4.72 12.0 4.46 11.3 4.88 12.4 5.03 12.8
LT 5 0.09 0.2 0.07 0.2 0.04 0.1 0.07 0.2 0.07 0.2 0.08 0.2
LU 31 0.15 0.4 0.13 0.3 0.12 0.3 0.14 0.4 0.13 0.3 0.15 0.4
LV 15 0.05 0.1 0.03 0.1 0.02 0.0 0.04 0.1 0.03 0.1 0.04 0.1
MT 9 0.02 0.1 0.03 0.1 0.02 0.1 0.03 0.1 0.03 0.1 0.03 0.1
NL 16 4.23 10.8 3.13 8.0 3.33 8.5 3.53 9.0 2.92 7.4 3.16 8.0
PT 17 0.60 1.5 0.78 2.0 0.83 2.1 0.74 1.9 0.77 2.0 0.78 2.0
SI 7 0.08 0.2 0.09 0.2 0.07 0.2 0.08 0.2 0.09 0.2 0.09 0.2
SK 2 0.03 0.1 0.05 0.1 0.04 0.1 0.04 0.1 0.05 0.1 0.05 0.1
Total 2,148 39.32 100.0 39.32 100.0 39.32 100.0 39.32 100.0 39.32 100.0 39.32 100.0

Rubric
www.ecb.europa.eu © 23
Is there evidence of cross-subsidisation? (1/3)
3% riskiest banks simultaneously fail
FSB: losses ranged from 1%-4.7% TA; COM: avg losses of 2.5%TA
A3. Baseline scenario
Loss -
Resolution
(% TA)
Loss -
Insolvency
(% TA)
Country AT BE CY DE EE ES FI FR GR IE IT LT LU LV MT NL PT SI SK TOT
Contribution In EUR
billions 0.69 0.45 0.03 15.4 0.01 7.15 0.09 5.44 0.92 0.42 4.44 0.07 0.13 0.03 0.03 3.13 0.78 0.09 0.05 39.3
5% 7.5%
ED
IS e
xp
osu
re
(1) per euro
contributed 0 0 0 0 0 0 0 0 0 0 0 0 0 0 0 0 0 0 0 -
(2) in EUR bn 0 0 0 0 0 0 0 0 0 0 0 0 0 0 0 0 0 0 0 0
10% 15% (3)
per euro
contributed 0 0 0 0 0 0 0 0 0 0 0 0 0 0 0 0 0 0 0 -
(4) in EUR bn 0 0 0 0 0 0 0 0 0 0 0 0 0 0 0 0 0 0 0 0
15% 22.5% (5)
per euro
contributed 0 0 0 0 0 0 0 0 0 0 0 0 0 0 0 0 0 0 0 -
(6) in EUR bn 0 0 0 0 0 0 0 0 0 0 0 0 0 0 0 0 0 0 0 0
20% 30% (7)
per euro
contributed 0 2.8 0 0 0 0 0 0 0 0 0 0 0 0 0 0 0 0 0 -
(8) in EUR bn 0 1.3 0 0 0 0 0 0 0.1 0 0 0 0 0 0 0 0 0 0 1.3
25% 37.5% (9)
per euro
contributed 0 7.4 0 0 0 1.3 0 0 0.9 0 0.02 0 0 0 0 0 0.2 0 1.1 -
(10) in EUR bn 0 3.3 0 0 0 9.6 0 0 0.8 0 0.1 0 0 0 0 0 0.2 0 0.1 14
• 3% riskiest banks simultaneously fail [65 banks] and all hit by losses from 5% to 25%TA: loss rates above
average evidenced in last crisis
• Main findings:
- No EDIS exposure and no cross-subsidisation in any Member State up to losses equal to 15%TA;
- Cross-subsidisation in Belgium, Spain and Slovakia for losses equal to 25%TA (extremely higher than the
losses evidenced in last crisis) 23

Rubric
www.ecb.europa.eu © 24
10% riskiest banks simultaneously fail
FSB: losses ranged from 1%-4.7% TA ; COM: avg losses of 2.5%TA
Loss -
Resolution
(% TA)
Loss -
Insolvency
(% TA)
Country AT BE CY DE EE ES FI FR GR IE IT LT LU LV MT NL PT SI SK TOT
Contribution In EUR
billions 0.69 0.45 0.03 15.4 0.01 7.15 0.09 5.44 0.92 0.42 4.44 0.07 0.13 0.03 0.03 3.13 0.78 0.09 0.05 39.3
5% 7.5%
ED
IS e
xp
osu
re
(1) per euro
contributed 0 0 0 0 0 0 0 0 0 0 0 0 0 0 0 0 0 0 0 -
(2) in EUR bn 0 0 0 0 0 0 0 0 0 0 0 0 0 0 0 0 0 0 0 0
10% 15%
(3) per euro
contributed 0 0 0 0 0 0 0 0 0 0 0 0 0 0 0 0 0 0 0 -
(4) in EUR bn 0 0 0 0.01 0 0 0 0 0 0 0 0 0 0 0 0 0.01 0 0 0.02
• 10% riskiest banks simultaneously fail [215 banks] and all hit by losses of 5% and
10%TA: more severe than last crisis
• Main finding:
- No EDIS exposure for losses=5%TA, very limited exposure for losses=10%TA
- No cross-subsidisation in any Member State
Is there evidence of cross-subsidisation? (2/3)
A3. Baseline scenario
24

Rubric
www.ecb.europa.eu © 25
• BIG BLACK SWAN: 10% riskiest banks simultaneously fail [215 banks] and all hit
by loss rates that are multiples of those observed in last crisis
• Main finding: - DIF never depleted
- Limited cross-subsidisation with losses of 20%TA
- Cross-subsidisation in Belgium, Spain, Malta and Slovakia for losses of 25%TA
Loss -
Resolution
(% TA)
Loss -
Insolvency
(% TA)
Country AT BE CY DE EE ES FI FR GR IE IT LT LU LV MT NL PT SI SK TOT
Contribution In EUR
billions 0.69 0.45 0.03 15.4 0.01 7.15 0.09 5.44 0.92 0.42 4.44 0.07 0.13 0.03 0.03 3.13 0.78 0.09 0.05 39.3
15% 22.5%
ED
IS e
xp
osu
re
(1) per euro
contributed 0 0 0 0 0 0 0 0 0 0 0 0 0 0 0 0 0 0 0 -
(2) in EUR bn 0 0 0 0.14 0 0 0 0 0 0 0 0 0 0 0 0 0.07 0 0 0.21
20% 30%
(3) per euro
contributed 0 2.84 0 0.02 0 0.26 0 0 0.07 0 0 0 0 0 0.21 0 0.15 0 0 -
(4) in EUR bn 0 1.27 0 0.28 0 1.84 0 0 0.06 0 0 0 0 0 0.01 0 0.12 0 0 3.58
25% 37.5%
(5) per euro
contributed 0 7.41 0 0.03 0 2.26 0 0 0.89 0 0.03 0 0 0.10 2.53 0 0.45 0 1.12 -
(6) in EUR bn 0 3.32 0 0.41 0 16.16 0 0 0.83 0 0.14 0 0 0.003 0.07 0 0.35 0 0.05 21.34
10% riskiest banks simultaneously fail
FSB: losses ranged from 1%-4.7% TA ; COM: avg losses of 2.5%TA
Is there evidence of cross-subsidisation? (3/3)
A3. Baseline scenario
25
Rubric
www.ecb.europa.eu ©
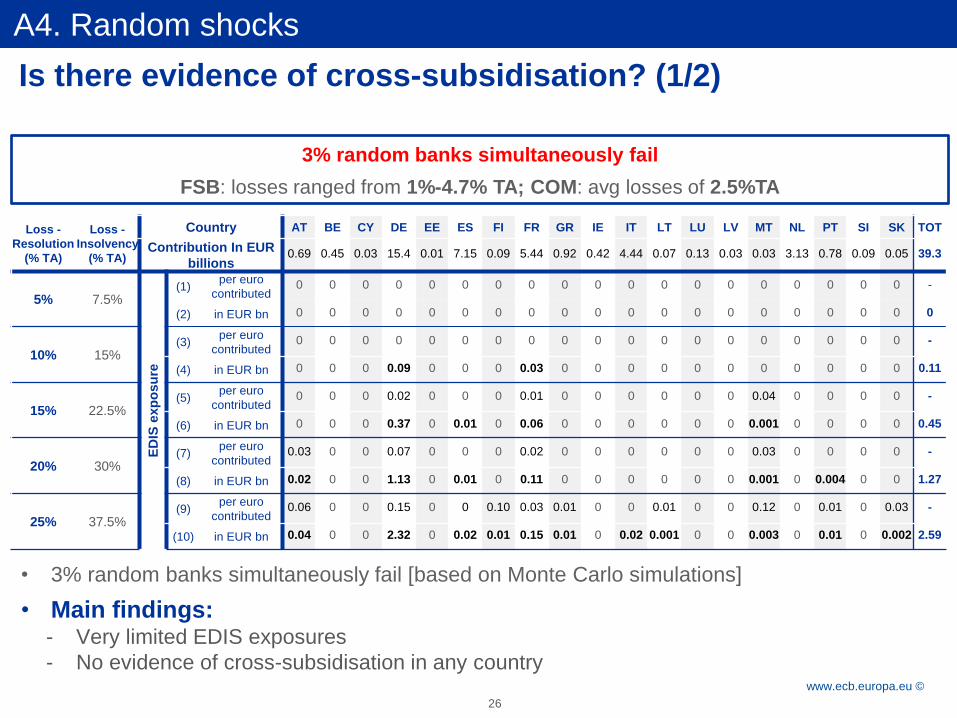
26
3% random banks simultaneously fail
FSB: losses ranged from 1%-4.7% TA; COM: avg losses of 2.5%TA
Loss -
Resolution
(% TA)
Loss -
Insolvency
(% TA)
Country AT BE CY DE EE ES FI FR GR IE IT LT LU LV MT NL PT SI SK TOT
Contribution In EUR
billions 0.69 0.45 0.03 15.4 0.01 7.15 0.09 5.44 0.92 0.42 4.44 0.07 0.13 0.03 0.03 3.13 0.78 0.09 0.05 39.3
5% 7.5%
ED
IS e
xp
osu
re
(1) per euro
contributed 0 0 0 0 0 0 0 0 0 0 0 0 0 0 0 0 0 0 0 -
(2) in EUR bn 0 0 0 0 0 0 0 0 0 0 0 0 0 0 0 0 0 0 0 0
10% 15% (3)
per euro
contributed 0 0 0 0 0 0 0 0 0 0 0 0 0 0 0 0 0 0 0 -
(4) in EUR bn 0 0 0 0.09 0 0 0 0.03 0 0 0 0 0 0 0 0 0 0 0 0.11
15% 22.5% (5)
per euro
contributed 0 0 0 0.02 0 0 0 0.01 0 0 0 0 0 0 0.04 0 0 0 0 -
(6) in EUR bn 0 0 0 0.37 0 0.01 0 0.06 0 0 0 0 0 0 0.001 0 0 0 0 0.45
20% 30% (7)
per euro
contributed 0.03 0 0 0.07 0 0 0 0.02 0 0 0 0 0 0 0.03 0 0 0 0 -
(8) in EUR bn 0.02 0 0 1.13 0 0.01 0 0.11 0 0 0 0 0 0 0.001 0 0.004 0 0 1.27
25% 37.5% (9)
per euro
contributed 0.06 0 0 0.15 0 0 0.10 0.03 0.01 0 0 0.01 0 0 0.12 0 0.01 0 0.03 -
(10) in EUR bn 0.04 0 0 2.32 0 0.02 0.01 0.15 0.01 0 0.02 0.001 0 0 0.003 0 0.01 0 0.002 2.59
• 3% random banks simultaneously fail [based on Monte Carlo simulations]
• Main findings: - Very limited EDIS exposures
- No evidence of cross-subsidisation in any country
Is there evidence of cross-subsidisation? (1/2)
A4. Random shocks

Rubric
www.ecb.europa.eu ©
27
10% random banks simultaneously fail
FSB: losses ranged from 1%-4.7% TA; COM: avg losses of 2.5%TA
Loss -
Resolution
(% TA)
Loss -
Insolvency
(% TA)
Country AT BE CY DE EE ES FI FR GR IE IT LT LU LV MT NL PT SI SK TOT
Contribution In EUR
billions 0.69 0.45 0.03 15.4 0.01 7.15 0.09 5.44 0.92 0.42 4.44 0.07 0.13 0.03 0.03 3.13 0.78 0.09 0.05 39.3
5% 7.5%
ED
IS e
xp
osu
re
(1) per euro
contributed 0 0 0 0 0 0 0 0 0 0 0 0 0 0 0 0 0 0 0 -
(2) in EUR bn 0 0 0 0.01 0 0 0 0 0 0 0 0 0 0 0 0 0 0 0 0.01
10% 15% (3)
per euro
contributed 0 0 0 0.02 0 0 0 0.02 0 0 0 0 0 0 0 0 0 0 0 -
(4) in EUR bn 0 0 0 0.29 0 0 0 0.09 0 0 0 0 0 0 0 0 0 0 0 0.38
15% 22.5% (5)
per euro
contributed 0.02 0 0 0.08 0 0 0 0.04 0 0 0 0 0 0 0.04 0 0.01 0 0 -
(6) in EUR bn 0.01 0 0 1.24 0 0.02 0 0.21 0 0 0 0 0 0 0.001 0 0.01 0 0 1.49
20% 30% (7)
per euro
contributed 0.09 0 0 0.24 0 0.00 0 0.06 0.01 0 0 0 0 0 0.10 0 0.02 0.01 0 -
(8) in EUR bn 0.06 0 0 3.74 0 0.03 0 0.35 0.01 0 0.01 0 0 0 0.003 0 0.01 0.001 0 4.21
25% 37.5% (9)
per euro
contributed 0.20 0 0 0.50 0 0.01 0.31 0.09 0.02 0 0.01 0.02 0 0.03 0.38 0 0.03 0.01 0.11 -
(10) in EUR bn 0.14 0 0 7.71 0 0.06 0.03 0.50 0.02 0 0.06 0.002 0 0.001 0.01 0.01 0.02 0.001 0.01 8.56
• 10% random banks simultaneously fail [based on Monte Carlo simulations]
• Main findings: - Very limited EDIS exposures, even in extremely severe scenarios
- No evidence of cross-subsidisation in any country
Is there evidence of cross-subsidisation? (2/2)
A4. Random shocks

Rubric
www.ecb.europa.eu ©
28
14% TA riskiest banks simultaneously fail in each country
FSB: losses ranged from 1%-4.7% TA; COM: avg losses of 2.5%TA
Loss -
Resolution
(% TA)
Loss -
Insolvency
(% TA)
Country AT BE CY DE EE ES FI FR GR IE IT LT LU LV MT NL PT SI SK TOT
Contribution In EUR
billions 0.69 0.45 0.03 15.4 0.01 7.15 0.09 5.44 0.92 0.42 4.44 0.07 0.13 0.03 0.03 3.13 0.78 0.09 0.05 39.3
5% 7.5%
ED
IS e
xp
osu
re
(1) per euro
contributed 0 0 0 0 0 0 0 0 0 0 0 0 0 0 0 0 0 0 0 -
(2) in EUR bn 0 0 0 0 0 0 0 0 0 0 0 0 0 0 0 0 0 0 0 0
10% 15% (3)
per euro
contributed 0 0 0 0 0 0 0 0 0 0 0 0 0 0 0 0 0 0 0 -
(4) in EUR bn 0 0 0 0 0 0 0 0 0 0 0 0 0 0 0 0 0 0 0 0
15% 22.5% (5)
per euro
contributed 0 0 0 0 0 0 0 0 0 0 0 0 0 0 0 0 0 0 0 -
(6) in EUR bn 0 0 0 0 0 0 0 0 0 0 0 0 0 0 0 0 0 0 0 0
20% 30% (7)
per euro
contributed 0 0 0 0 0 0 0 0 0 0 0 0 0 0 0 0 0 0 0 -
(8) in EUR bn 0 0 0 0 0 0 0 0 0 0 0 0 0 0 0 0 0 0 0 0
25% 37.5% (9)
per euro
contributed 0 0 0 0 0 1.34 0 0 0 0 0.00 0.24 0 0.10 0 0 0 0 0
(10) in EUR bn 0 0 0 0 0 9.58 0 0 0 0 0.01 0.02 0 0.00 0 0 0 0 0 9.61
• Riskiest banks representing 14%TA in each country simultaneously fail [equivalent of 3%
baseline scenario]
• Main findings: - Very limited EDIS exposures (only for LGD = 25%TA in resolution)
- No evidence of cross-subsidisation in any country
Is there evidence of cross-subsidisation? (1/2)
A5. Country shocks

Rubric
www.ecb.europa.eu ©
29
80% TA riskiest banks simultaneously fail in each country
FSB: losses ranged from 1%-4.7% TA; COM: avg losses of 2.5%TA
Loss -
Resolution
(% TA)
Loss -
Insolvency
(% TA)
Country AT BE CY DE EE ES FI FR GR IE IT LT LU LV MT NL PT SI SK TOT
Contribution In EUR
billions 0.69 0.45 0.03 15.4 0.01 7.15 0.09 5.44 0.92 0.42 4.44 0.07 0.13 0.03 0.03 3.13 0.78 0.09 0.05 39.3
5% 7.5%
ED
IS e
xp
osu
re
(1) per euro
contributed 0 0 0 0 0 0 0 0 0 0 0 0 0 0 0 0 0 0 0 -
(2) in EUR bn 0 0 0 0 0 0 0 0 0 0 0 0 0 0 0 0 0 0 0 0
10% 15% (3)
per euro
contributed 0 0 0 0 0 0 0 0 0 0 0 0 0 0 0 0 0 0 0
(4) in EUR bn 0 0 0 1.45 0 0 0 0 0 0 0 0 0 0 0 0 0 0 0 1.45
15% 22.5% (5)
per euro
contributed 0 0 0 0.34 0 0.04 0 0 0 0 0 0 0 0 0 0 0 0 0
(6) in EUR bn 0 0 0 5.21 0 0.31 0 0 0 0 0 0 0 0 0 0 0 0 0 5.52
20% 30% (7)
per euro
contributed 0 2.84 0 0.86 0 0.26 0 0 0 0 0 0 0 0 0 0 0 0 0
(8) in EUR bn 0 1.27 0 13.3 0 1.84 0 0 0 0 0 0 0 0 0 0 0 0 0 16.4
25% 37.5% (9)
per euro
contributed 0.01 7.41 0 1.77 0 1.97 2.57 0 0 0 0.02 0.24 0 0.10 0 0 0.21 0 1.12
(10) in EUR bn 0.01 3.32 0 27.2 0 14.1 0.22 0 0 0 0.10 0.02 0 0.00 0 0 0.16 0 0.05 45.2
• Riskiest banks representing 80%TA in each country simultaneously fail [equivalent of 10%
baseline scenario]
• Main findings: - EDIS exposure above EDIS target only for LGD = 25% TA in resolution
- Cross-subsidisation in BE, DE, ES, FI and SK for very high loss rates
Is there evidence of cross-subsidisation? (2/2)
A5. Country shocks

Rubric
www.ecb.europa.eu ©
30
Is there evidence of cross-subsidisation?
• Three simulated scenarios
• 3 largest banks assumed to simultaneously fail [~ 23%TA of sample]
• 5 largest banks assumed to simultaneously fail [~34.5%TA of sample]
• 10 largest banks assumed to simultaneously fail [~50%TA of sample]
• EDIS exposures
• Equal to zero for loss rates up to 35%TA, in all three scenarios
• For 3 and 5 largest banks failing, LGD=35%TA: EDIS exposure = € 27.3 bn
• For 10 largest banks failing, LGD=35%TA : EDIS exposure = € 47.2 bn
• Cross-subsidisation
• No cross-subsidisation for loss rates up to 35%TA
A6. G-SIBs shocks