j. c. eicher number 655 - world bank · j. c. eicher swp655 world bank staff working papers number...
TRANSCRIPT

Educational Costing and Financingin Developing Countries
Focus on Sub-Saharan Africa
J. C. Eicher SWP655
WORLD BANK STAFF WORKING PAPERSNumber 655
FILE COPYa
Pub
lic D
iscl
osur
e A
utho
rized
Pub
lic D
iscl
osur
e A
utho
rized
Pub
lic D
iscl
osur
e A
utho
rized
Pub
lic D
iscl
osur
e A
utho
rized


WORLD BANK STAFF WORKING PAPERSNumber 655
Educational Costing and Financingin Developing Countries
Focus on Sub-Saharan Africa
J. C. Eicher
INTERNATIONAL MOIiETARY FNJOINT LIBRARY
CO 2~~'1 2A
I;j7FRNATIONAL BgNX FORREC O._STi-JUT;OSI AND DIZVLOPUELIT
;w-ASEINGTCM4, D.C. 20431
The World BankWashington, D.C., U.S.A.

Copyright (C 1984The International Bank for Reconstructionand Development/THE WORLD BANK
1818 H Street, N.W.Washington, D.C. 20433, U.S.A.
All rights reservedManufactured in the United States of AmericaFirst printing September 1984
This is a working document published informally by the World Bank. To present theresults of research with the least possible delay, the typescript has not been preparedin accordance with the procedures appropriate to formal printed texts, and theWorld Bank accepts no responsibility for errors. The publication is supplied at atoken charge to defray part of the cost of manufacture and distribution.
The views and interpretations in this document are those of the author(s) andshould not be attributed to the World Bank, to its affiliated organizations, or to anyindividual acting on their behalf. Any maps used have been prepared solely for theconvenience of the readers; the denominations used and the boundaries shown donot imply, on the part of the World Bank and its affiliates, any judgment on thelegal status of any territory or any endorsement or acceptance of such boundaries.
The full range of World Bank publications, both free and for sale, is described inthe Catalog of Publications; the continuing research program is outlined in Abstracts ofCurrent Studies. Both booklets are updated annually; the most recent edition of eachis available without charge from the Publications Sales Unit, Department T, TheWorld Bank, 1818 H Street, N.W., Washington, D.C. 20433, U.S.A., or from theEuropean Office of the Bank, 66 avenue d'1ena, 75116 Paris, France.
J. C. Eicher, a consultant to the Education Department of the World Bank, isprofessor of economics in the Institut de Recherche sur l'Economie de l'Education of theUniversity of Dijon.
Library of Congress Cataloging in Publication Data
Eicher, Jean Claude.Educational costing and financing in developing
countries.
(World Bank staff working papers ; no. 655)Bibliography: p.1. Education--Africa, French-speaking West--Costs.
2. Education--Africa, French-speaking West--Finance.I. Title. II. Series.LB2826.6.A36E33 1984 379.1'21'0967 84-17375ISBN 0-8213-0402-X

Abstract
The paper analyzes issues in the costs and financing of education
in developing countries. It focuses primarily on Sub-Saharan Africa, and
within that on Francophone West Africa. After evaluating the educational
cost data used in international comparisons, the paper focuses on the
special situation of African countries, most of which experience severe
financial constraints in their effort to achieve educational goals. It
examines the potential for, first, reducing unit costs as a way of
increasing enrollment within an existing budget, and second, tapping
private sources of financing for education. The overall conclusion is that
although the financial prospects are rather bleak in the poorest countries,
existing budgets could be used much more efficiently than at present.
Units costs can often be significantly reduced, and some changes in the
pattern of subsidies to education may allow for a sizeable expansion of
education within existing budgets.
Extracto
En el presente documento se analizan cuestiones relativas a los
costos y financiaci6n de la educaci6n en los paises en desarrollo. Se ha
centrado la atenci6n principalmente en Africa al Sur del Sahara y, dentro
de esa regi6n, en la zona de habla francesa de Africa Occidental. Tras
evaluar los datos sobre costos de la educaci6n utilizados en comparaciones
internacionales, se examina especificamente la situaci6n especial de los
paises africanos que, en su gran mayoria, experimentan graves limitaciones
financieras en sus esfuerzos para lograr los objetivos de la educacion.
En primer lugar, se analiza el potencial para reducir los costos unitarios
como un medio para incrementar la matricula dentro de los limites de los
presupuestos vigentes y, en segundo lugar, para captar fondos privados con
destino a la financiaci6n de la educaci6n. La conclusi6n general es que,
aunque las perspectivas financieras son bastante sombrias en los paises
mAs pobres, los presupuestos vigentes podrian ser utilizados mucho mAs
eficientemente que en la actualidad. En muchos casos, los costos
unitarios podrian reducirse significativamente, y la implantaci6n de
algunos cambios en el sistema de subvenciones a la educaci6n podria
permitir una expansi6n considerable de los programas educativos dentro del
marco de los mencionados presupuestos.

Le document traite des problemes que posent le coat et le
financement de l'education dans les pays en developpement. L'analyse est
essentiellement ax6e sur l'Afrique au sud du Sahara et notamment sur les
pays francophones de l'Afrique de l'Ouest. Apres avoir procede a un
examen critique des statistiques utilisees dans les comparaisons
internationales des coats de l'education, l'auteur d6crit la situation
particuliere des pays africains, qui 6prouvent presque tous des
difficultes a realiser leurs objectifs d'education en raison de serieuses
contraintes financieres. I1 examine dans quelle mesure il est possible,
d'une part, de r6duire les coats unitaires afin d'accroitre les effectifs
scolarises sans grever davantage les finances de l'Etat et, d'autre part,
de faire appel a des sources privees pour financer 1'6ducation. L'auteur
conclut que, si les perspectives financieres sont plut6t sombres dans les
pays les plus d6sherites, les ressources budg6taires pourraient etre
utilisees de facon beaucoup plus efficace qu'elles ne le sont a present.
Dans bien des cas, on pourrait reduire sensiblement les coats unitaires
et, en remaniant le r6gime des subventions a l'6ducation, on pourrait sans
doute developper le syst6me 6ducatif de fagon notable sans augmenter le
budget de ce secteur.

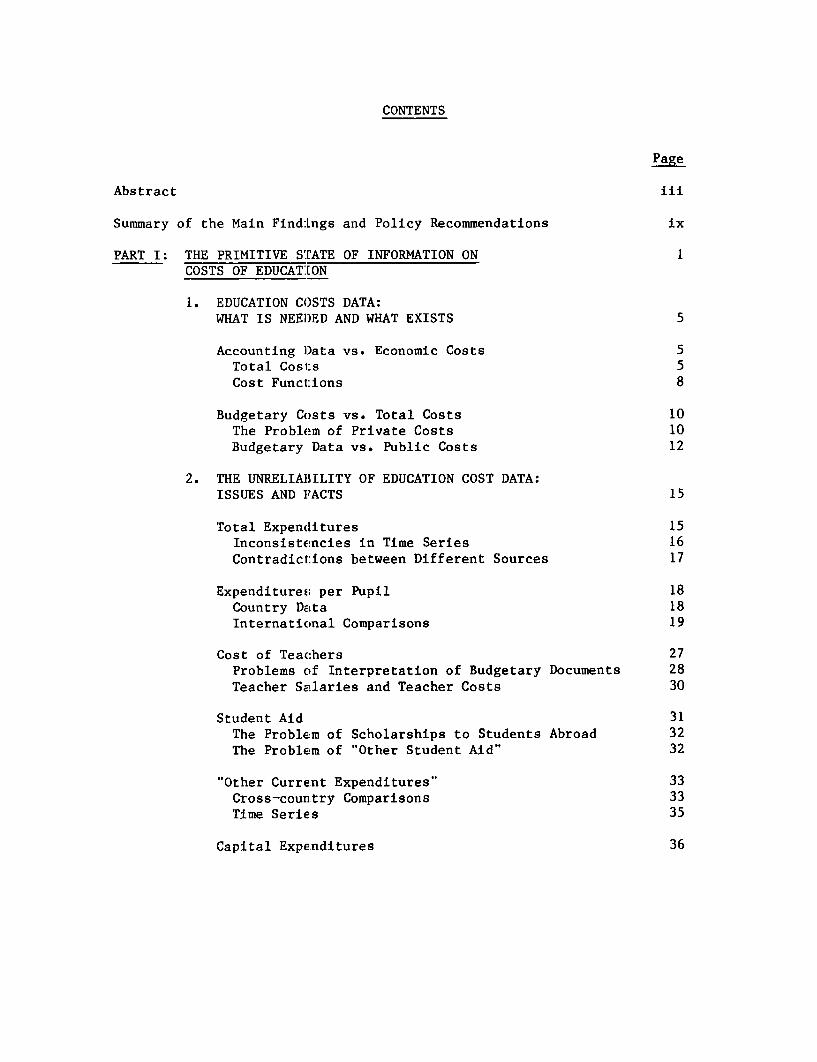
CONTENTS
Page
Abstract iii
Summary of the Main Find:Lngs and Policy Recommendations ix
PART I: THE PRIMITIVE STATE OF INFORMATION ON ICOSTS OF EDUCAT:ION
1. EDUCATION COSTS DATA:WHAT IS NEED)ED AND WHAT EXISTS 5
Accounting Data vs. Economic Costs 5Total Cost:s 5Cost Funcl:ions 8
Budgetary Costs vs. Total Costs 10The Problem of Private Costs 10Budgetary Data vs. Public Costs 12
2. THE UNRELIABILITY OF EDUCATION COST DATA:ISSUES AND FACTS 15
Total Expenditures 15Inconsistencies in Time Series 16Contradict:ions between Different Sources 17
Expenditures; per Pupil 18Country Data 18International Comparisons 19
Cost of Teachers 27Problems of Interpretation of Budgetary Documents 28Teacher Se!laries and Teacher Costs 30
Student Aid 31The Problem of Scholarships to Students Abroad 32The Problem of "Other Student Aid" 32
"Other Current Expenditures" 33Cross-country Comparisons 33Time Series 35
Capital Expe.nditures 36

Page
PART II: COST ISSUES IN EDUCATION 37
3. THE RISING TREND OF TOTAL COSTS 41
Methodological Problems 42The Data and Their Interpretation 44
The Facts 44Interpretation of the Facts 49
4. THE COST OF TEACHERS: FACTS AND PROBLEMS 61
The Facts about Teacher Salaries inDeveloping Countries 61Teacher Salaries as a Percentage ofCurrent Expenditures 61
Teacher Salaries as a Percentage ofGNP per Capita 63
Economic Analysis of the "Price" of Teachers 64
Policy Recommendations 67Lowering Unit Costs 68Hiring Less Qualified Teachers 69Increasing Teaching Loads 71Increasing Average Class Size 72Replacing Teachers by Other Factorsof Production 74
5. COST EFFECTIVENESS OF QUALITY-IMPROVEMENT MEASURES 77
Determinants of School "Quality" 77
Evidence on School Quality in Developing Countries 78Monetary Indices 79.Physical Indices 79
The Relation between SchoolCharacteristics and Student Achievement 81
The Overall View 81Evidence on Relative Costs andCost Effectiveness of Different Inputsand Its Interpretation 87
Evidence from Existing Research 88Proposals for Further Research 94
Page
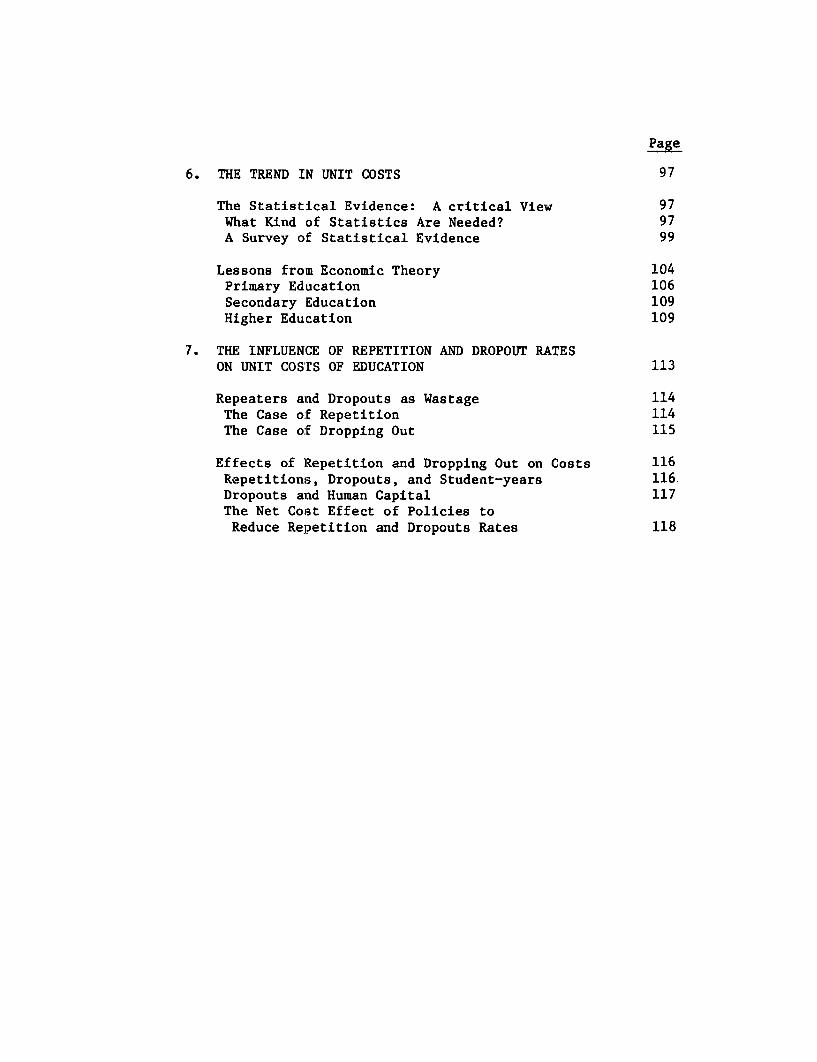
6. THE TREND IN UNIT COSTS 97
The Statistical Evidence: A critical View 97What Kind of Statistics Are Needed? 97A Survey of Statistical Evidence 99
Lessons fro-m Economic Theory 104Primary Education 106Secondary Education 109Higher Education 109
7. THE INFLUENCE OF REPETITION AND DROPOUT RATESON UNIT cosrs OF EDUCATION 113
Repeaters and Dropouts as Wastage 114The Case ofE Repetition 114The Case o:E Dropping Out 115
Effects of Repetition and Dropping Out on Costs 116Repetitions, Dropouts, and Student-years 116.Dropouts and Human Capital 117The Net Cost Effect of Policies toReduce Repetition and Dropouts Rates 118

Page
PART III: THE PROBLEM OF COST RECOVERY 121
8. THE ROLE AND LIMITS OF ECONOMIC ANALYSIS 127
The Inadequacy of General Welfare Economics 127
The Limitations of Current Research onEducation Financing 130
Economic Analysis as a Guide to EducationalFinance Policy in Developing Countries 134The Analytical Framework: Its Main Assumptionsand Conclusions 134
The Analytical Framework: A Critical Survey 140
9. FACTS AND ISSUES IN EDUCATION FINANCE INDEVELOPING COUNTRIES 153,
Firms 154
Local Governments and Communities 156
The "Rest of the World" 157The Facts about Foreign "Aid" to Education 158Interpretation of the Facts 158
Households 163Primary Education 163Higher Education 169
School Production 174
Private Schools 176
ANNEX: SUPPORTING DATA FOR PART II 179
REFERENCES 189
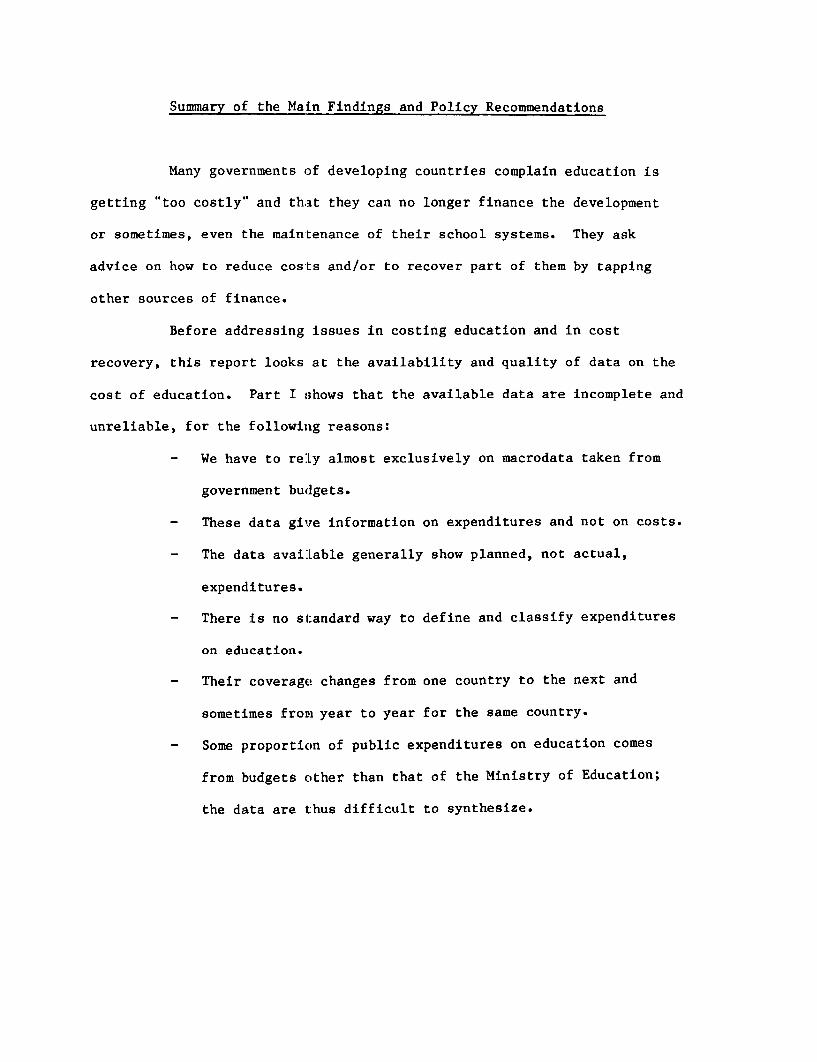
Summary of the Main Findings and Policy Recommendations
Many governments of developing countries complain education is
getting "too costly" and that they can no longer finance the development
or sometimes, even the maintenance of their school systems. They ask
advice on how to reduce costs and/or to recover part of them by tapping
other sources of finance.
Before addressing issues in costing education and in cost
recovery, this report looks at the availability and quality of data on the
cost of education. Part I shows that the available data are incomplete and
unreliable, for the following reasons:
- We have to reLy almost exclusively on macrodata taken from
government budgets.
- These data give information on expenditures and not on costs.
- The data avaiLable generally show planned, not actual,
expenditures.
- There is no standard way to define and classify expenditures
on education.
- Their coverage changes from one country to the next and
sometimes from year to year for the same country.
- Some proportion of public expenditures on education comes
from budgets cther than that of the Ministry of Education;
the data are thus difficult to synthesize.

To remedy this state of affairs:
- Collection of cost data at the local level through local
surveys of schools and of households is imperative.
- The work started at UNESCO and in the World Bank to
harmonize and standardize data on public expenditures on
education should be pursued and intensified.
- At present, international organizations organize courses and
seminars in budgeting and planning for officials from
ministries of education in developing countries. These
courses should be increased and should focus more on cost-
related issues.
Most African countries face a dilemma in educational finance:
enrollments are low, the school age population is growing fast, and
there are tremendous social pressures to expand education; meanwhile,
education already uses a large proportion of the public budget, and its
expansion has to compete with other pressing demands. Part II of the
report discusses the reduction of unit costs as a way of increasing
enrollment within an existing budget, while Part III analyzes the recovery
of costs and explores the extent to which new sources of financing for
education may be tapped.
Why attempt to reduce the unit cost of education in Africa?
Two main sets of reasons call for reductions in the unit cost:
- First, the unit costs of education at all levels, but
particularly higher education, are much higher in Africa than
in other countries in the same range of per capita income.
Within Africa, Francophone countries have much higher unit
costs than Anglophone countries.

- Second, at current unit costs, few African countries will
attain their stated objective of universal primary education
in the next twenty years.
How to reduce educational unit costs?
Two sets of measures can be considered:
- Improve the internal efficiency of education so as to reduce
the unit cost while maintaining or improving the quality of
education; in short, reduce wastage and improve organization.
- Reduce the curriculum choice or length of studies so as to
permit more students to be acccommodated. This type of
measure deals with the quantity-quality dilemma in
education. It also touches on the "back to basics"
argument, and hence requires an assessment of what is basic.
The two sets of measures might be complementary. The first set is almost
universally necessary, while policy decision on the second would obviously
depend on specific circumstances, and are not analyzed in this report.
On ways to reduce unit costs, the report's main conclusions are
as follows:
- Reducing the average salary of teachers is generally not
feasible.
- The number of students supervised per teacher may be
increased either by raising the class size or by raising the
teaching load of the teacher; both of these instruments can
be effective.
- In higher education, though not at the primary or secondary
levels, sizabLe returns to scale may be reaped.

Measures to improve the flow of students within the system
(reducing dropout and repetition) have usually had less
effect on unit costs than anticipated, but they should be
encouraged on their own merits, especially in West Africa.
Among the relatively cheap alternatives for improving the
quality of education, the provision of textbooks seems to be
by far the most cost effective. Improvement in the
managerial capacity of school principals would probably also
be a very cost effective measure.
New way of financing education
- The most promising of these is to cut subsidies to higher
education and to shift the public resources saved toward
primary education -- a measure which is both cost effective
and equitable. In general, it would be appropriate to
reconsider the prevailing pattern of financing in which the
level of subsidization usually increases with the level of
education.
- The use of the proceeds of production activities in the
schools is found to be potentially effective as a way to
raise funds.
- Not enough is known about other measures, such as raising
fees in schools or developing private education, to ascertain
their scope in allowing an expansion of education.
PART I
THE P?RIMITIVE STATE OF INFORMATION
ON COSTS OF EDUCATION

INTRODUCTION
TO PART I
The economist is above all concerned with the optimal allocation
of scarce resources. A resource is scarce when one has to make choices
between its different possible uses; in other words, when there is not enough
of the resource to satisfy all the claims upon it. Satisfying one need,
therefore, implies forgoing the satisfaction of another need. The cost of
using a given resource to satisfy a given need is the value attached to the
satisfaction that is forgone.
In the case of material goods and services that may be exchanged,
markets provide a mechanism that allows comparison of costs in an easy and
clear way. When markets are functioning in a perfect way, prices give an
accurate way to compare sacrifices and satisfaction. But education is not a
good that is bought and sold in the usual sense of the word. Nevertheless,
it has economic consequences; for those who acquire it, and the various inputs
necessary for its production are bought and sold.
It is important to ascertain that the limited resources at the
disposal of the persons and/or institutions who "buy" educational inputs are
used in the most effective way possible given the objectives which are
pursued. It is also important, from society's point of view, to make sure
that education gets its "appropriate" share of social resources. But to
determine such optima, the economist has to have appropriate cost data and to
make sure that they are reliable.
-3-
- 4 -
Before dwelling at some length upon the great unreliability of
most of the information we have on the costs of education, we shall point out
what types of cost data are needed and why the accounting data which are
usually available are inappropriate for a proper economic analysis.
CHAPTER 1
EDUCATION COST DATA: WHAT IS NEEDED AND WHAT EXISTS
A school can only vaguely be compared with a firm selling its
products on the market. Even if we discard the fact that a school has many
functions and if we concentrate upon its central one, that of transmitting
knowledge, we know that the "price" charged for performing this function
cannot be considered as a good economic index of cost.
Fees charged to students are generally far below the total cost of
education. To get cost figures, one therefore has to rely essentially on
budgetary documents. But those are ill-adapted to an economic treatment and
do not give a complete view oi- what is actually spent on education.
Accounting Data vs. Economic ('osts
Total Costs
As we recalled earlier, in a fundamental sense the economic cost
of using resources to do one thing is the value of what is forgone in not
using the resources to do something else. All costs are therefore what the
economist calls in his jargon "opportunity costs." 1/ But this raises two
problems.
First, to measure real costs one has to know the opportunities
which are effectively open. If there is no other possible use of the
resources, there is no cost at. all. This point may be important in education
because the user of the resources is not always the one who pays for them.
For example, teacher salaries do not represent a cost to the school principal
1/ For a longer and more detailed discussion of these problems, seeEicher and others (1982), Chapter 3.
-5-
-6-
if they are paid directly by the ministry of education; the cost of
transmitting educational programs is zero to the ministry of education if it
has free access to the radio network. But there is obviously a cost to
society as a whole in both cases. In developing countries, where governments
are hard pressed to find enough budgetary funds to finance the school
systems, the minister of education will be as interested in schemes for
shifting the cost burden to some other party as in cost-reducing devices.
But, from the point of view of society as a whole, only the second type of
measures is truly cost reducing.
Second, some of those real costs do not entail any direct money
expenditures. They are just opportunities forgone--for instance, income
which could have been earned by students if they had chosen to go into active
work life instead. These costs are not recorded in any transaction account;
they have to be computed indirectly, through the observation of the labor
market in the case of forgone earnings.
The opportunities forgone are often still more dificult to measure
in money terms because they are not linked with gainful employment. Even if
we assume that we are in a perfect market economy and that teacher salaries
exactly reflect the "value" of teachers to the community, there is still the
value of students' time to be considered, especially the value of the time
they would have spent helping their parents or enjoying their leisure.
Especially in poor countries, the value of children's time to the
parents may be very high, even at an early age. It is therefore high to
society as a whole. But it is not a cost for the government, which does not
lose anything, at least directly in the process. Confusion is often made
- 7 -
between the point of view of the state and that of society, and economic
analysis should carefully state which group is concerned in the costs being
measured. 2/
But because education is financed (at least partly) through
administrative channels, it gives rise to many (and often complex) income
flows between the different "spenders" on education. For instance, local
governments may appear to pay the teachers but actually receive a grant from
the ministry of education to cover that expense; families may pay tuition
fees but receive scholarships; and so on. According to the economic factor
the economist is interested in, net social cost will vary; it will generally
not be well represented by the expenditure item which may appear in budgetary
documents.
But budgets may furnish unreliable information on costs in still
another way. The budgets which are readily available are provisional. This
means that they show only what the ministry concerned estimates it will have
to spend during the next fiscal year. Not only may the total amount spent
actually be different because new credits had to be voted along the way, but
the real costs of individual items (for instance, the cost of building a
given school) may turn out to be much higher than anticipated.
Actual expenditures are of course recorded, but they appear only
after a considerable time has elapsed and are often much more difficult to
obtain than provisional budget figures. This is one of the reasons that even
statistical series showing only global expenditures may sometimes appear
inconsistent (and that data for the same year may sometimes vary in
successive statistical yearbooks).
2/ We shall come back to this important question in Part III.

-8-
Cost Functions
The economist is not interested in total costs in themselves. To
be able to draw conclusions, he has to make comparisons and to study the
behavior of costs in different circumstances. Even if we assume for a moment
that expenditures as shown in budgetary documents give a satisfactory account
of (public) costs of education, this absolute level does not tell us anything
about the efficiency of resource allocation or, for that matter, about the
relative importance of education in total public expenditure. Data about
total public budgets may be obtained directly and easily from the same
sources of education budgets, but the economist will also need information
about inputs and outputs to know how costs behave when the level of activity
changes.
First, he has to know unit costs. For reasons mentioned earlier
(and to which we shall return in Part II, Chapter 6), costs per unit of
output may not be calculated readily in the case of education. Cost per
student is used instead, and data on enrollment therefore have to be
gathered. 3/
Second, the economist has to measure the effect of marginal
changes in enrollment on unit cost--that is, to compute marginal costs. To
do that, he has to dispose of coherent time series or to make cross-sectional
comparisons for the same year. In the first case, he faces the danger of
changes in budgetary procedures through time. In the second, he has to
assume that budgetary data mean the same thing in different countries.
3/ The official, readily available figures may not be quite appropriatehere either, since they often give the number of officially registeredstudents at the beginning of the school year and not the number whoreally attend.
Third, the econcimist has to compare, through production-functions
studies, the effect on cost. of changes in the various inputs. He therefore
has to have cost data broke!n down by type of input.
But anybody familiar with budgetary data, especially in developing
countries, knows that the budgetary distinction between current accounts and
capital accounts does not perfectly coincide with the economic distinction
between variable and fixed costs. Moreover, as far as current expenditures
are concerned, budgetary itemization often makes it difficult to get the cost
of inputs other than that of teachers' salaries. In most cases, one can only
lump these other inputs under the broad heading "other current expenditures,"
and even this figure is highly inaccurate when these expenditures are shared
between different levels of government.
These difficulties exemplify the limitation, for relevant economic
analysis, of macro data gathered at the national level. Only surveys made at
the school level can give an accurate picture of the cost of inputs if we
want to study individual items. For instance, even when budgetary data
concerning teacher aids and supplies in general are available and accurate,
they do not enable measurement of the costs of individual items such as books
or modern educational media. This prevents cost-effectiveness analysis,
which in turn makes impossible any policy recommendation on optimal measures
for quality improvement.
In addition, capital expenditures are not always itemized. Even
when figures are given for individual educational institutions, there may be
a very large difference between those which appear in provisional budgets and
the actual expenditure on the building project. Data on equipment do not
detail the individual item, but what interests the economist is the cost of
one table, of one blackboard, and the like. But budgetary data are also ill
- 10 -
adapted to economic analysis for another reason: they give only a partial
picture of the total cost to society of education.
Budgetary Costs vs. Total Costs
Budgetary documents at best give only public costs and therefore
omit all costs financed by private sources. Yet, except in extremely
centralized financing systems, there are several levels of administration
which intervene, whose accounts are not easily available and are not all
easily usable.
The Problem of Private Costs
Several private sources contribute to the financing of education.
First and foremost are the households which undergo direct expenditures
and/or sacrifices for one or more of their members. The cost of education to
the students and/or their families is usually not well known. Most of the
time, it is not even measured. Let us recall the most important reasons.
O Fees directly paid to the school usually represent only a
fraction of the cost of education to the household and
sometimes do not even exist. Other monetary contributions (for
instance, to Parent-Teacher Associations, PTAs) are sometimes
important; expenditures on school supplies may be higher than
direct fees; forgone earnings may constitute the main portion
of total cost.
O Most expenditures incurred because one child is going to school
are not specific to education. For instance, expenditures on
school lunches are part of expenditures on food; purchase of a
school uniform is part of expenditures on clothing; and so on.
But household expenditure surveys usually classify expenditures

- 11 -
according to broad categories of goods and not really according
to the function(s) performed by those goods. Special surveys
therefore have to be undertaken, at great expense.
O There is no scientifically indisputable way to evaluate forgone
earnings because one has to pick a reference group whose
earnings will be used to measure what the students might earn.
O The value of time spent in school is not measured in its
totality by earnings forgone. If they did not go to school,
students might--besides working for pay--help their parents or
enjoy more leisure time.
On this last point, the cost of leisure is generally considered as
equal to zero. From the point of view of society as a whole this may be
acceptable, although debatable, but from the point of view of the student it
certainly is not. Unless we assume that a student enjoys being in school as
much as, or more than, having his own leisure time, we have to assume that
going to school entails a cost equal to the satisfaction forgone.
The value of the time spent helping parents may be very important
indeed in rural areas among subsistence farm families. As we shall see in
Part III, this importance helps explain the reluctance of some parents to
send more than one child to school. Although this cost is very difficult to
measure with great precision, simple administrative reforms--such as a change
in the school calendar to make school vacation coincide with the period when
children are needed most on the farm--may help in reducing the cost
substantially, although it maay create other problems.

- 12 -
But, as we shall also see in Part III, to measure the impact of
new fees on demand one has to know what is the actual cost of education to
the households. The problem is important enough, especially in the poorest
countries, to warrant devoting some effort to gathering data at the school
and household levels.
Education expenditures are also financed through other private
sources. Philanthropists may play an important role in some cases, but at
the national level their part is often negligible, except if we include in
this category churches which run a network of private schools. Firms do
contribute to the financing of technical and vocational training, and
international comparisons may be useful to determine the extent of their
potential contribution. But exhaustive surveys of training programs financed
by firms and/or by trade organizations are almost nowhere available, even in
developed countries. The main reasons are that most of these programs are
conducted by individual firms to adapt their workers to the firm's specific
needs and that programs conducted outside of firms are organized by many
different agencies.
Budgetary Data vs. Public Costs
When several levels of government are involved in financing
education, available budgetary data may suffer from shortcomings.
o Only central government budget data are available in some
countries, and expenditures of the ministry of education are
often given as "total public expenditures."
o Even when the budgetary data at all levels are available, one
has to beware of double counting because part of the
expenditures at the lower levels are usually financed by
subsidies from upper levels.

- 13 -
o Budgetary documents at the local, community level--when they
exist--do not isolate all expenditures on education in a
separate chapter. For instance, heating, maintenance, and
repairs of schools are at best lumped with heating,
maintenance, and repairs of all municipal buildings. 4/
o In developing countries, an important source of
finance--foreign aid--is usually not included in budgetary
documents. 5/
In conclusion, the data on education costs which are generally
available are not well adapted to economic analysis. Official budgetary
documents at the central government level are usually all that is available,
especially in developing countries. These documents have major shortcomings.
o They do not measure costs but only expenditures.
O They usually give figures only on planned expenditures.
O They usually give figures on planned expenditures but not on
how much is actually spent.
o They give figures only on public expenditures and sometimes
only at the central government level.
o The categories of expenditures they distinguish are not those
needed for a correct economic analysis.
4/ For a detailed account of problems encountered and of proper economiccost measurement at the community level in a developed country (France),see Beltramo (1975).
5/ When foreign aid is incLuded without being mentioned, which is sometimesthe case, it makes economic analysis still more hazardous.

- 14 -
o They are not detailed enough to give accurate information on
the cost of individual inputs.
Budgetary documents therefore have to be supplemented by other
sources of information: local budgets, surveys of costs at the school level,
surveys of expenditures on and cost of education for households.
The data currently available present, in many cases, still another
danger: they are not homogeneous from one source to the next, and they are
often grossly inaccurate, even for that portion of total cost which they are
supposed to measure. This point is often neglected but is so important that
we shall try to show some of the pitfalls which are encountered and to give
concrete evidence about the unreliability of cost data in developing
countries, especially in sub-Saharan Africa (in particular, in West Africa).

CHAPTER 2
THE UNRELIABILITY OF EDUCATION COST DATA:ISSUES AND FACTS
Those who have tried to compute unit costs of education know how
frustrating it can be to be faced, most of the time, with time series which
are plainly incoherent, with conflicting evidence from different sources,
with footnotes which show that the published figures include only part of the
total one seeks, and so on. But studies based on such data have been made,
often sponsored by international organizations, and the results are widely
used to make policy recommendations.
A careful and cr:Ltical look at the data shows that some of these
policy recommendations are not warranted by the existing evidence or at least
that they should be advanced with much more caution than is the case at
present.
We shall attempt to emphasize this point by looking at concrete
examples, mostly taken from sub-Saharan Africa. This will allow us to point
out some of the causes of inconsistencies and/or errors and, hence, to
suggest some measures designed to improve methods of data gathering and of
data interpretation.
Total Expenditures
It must be remembered that the figures which are presented in
statistical yearbooks and reports from international organizations (mainly
Unesco and the World Bank) are supposed to concern public expenditures on
education. These data, as mentioned above, are of no interest in themselves
but are necessary raw material to compute more "meaningful" aggregates. But
even at this stage inconsistencies and contradictions are frequent.
- 15 -

- 16 -
Inconsistencies in Time Series
Discrepancies are frequent when budgetary data are used without
checking for changes in definitions and/or in administrative organization.
But Unesco has made an extremely valuable effort in the last ten years to
remove all glaring inconsistencies by systematically checking with the
authorities concerned and by homogenizing the data.
Some examples of sudden jumps in the total figure from year to
year can still be found in issues of the Unesco Statistical Yearbook prior to
1975, but they are hard to find today. 1/ But any given Unesco Statistical
Yearbook gives only short time series on costs (usually fewer than ten
years). Attempts to lengthen the series by referring to older Yearbooks then
encounter obstacles because cost figures have often been corrected from one
issue to the next.
For instance, between the 1974 and 1981 issues of the Unesco
Statistical Yearbook total public expenditures on education have changed for
the same year, 1970:
o From 27.2 million to 20.8 million CFAF in the Ivory Coast
o From 452.2 thousand to 551.7 thousand shillings in Kenya
o From 330.0 thousand to 407.9 thousand shillings in Tanzania
o From 48.0 million to 56.1 million kwacha in Zambia.
1/ An extreme example of the type of checking and subsequent correction thatthe statistical division of Unesco sometimes has to make can be seen in1975 figures for France. In that year the budgetary figure given by theFrench Ministry of Education was much lower than in the preceding years.But the only reason was that a Ministry of Universities had just beencreated, and this budget had not been added to that of the Ministry ofEducation. Unesco has played a very important and useful role inimproving education cost data. The recent decision to give up theseextensive checking and correcting activities is therefore much to bedeplored.

- 17 -
Contradictions between Different Sources
Conflicting figures are numerous and can be found even in
different documents and reports coming from the same organization. We shall
give only one example here. Total educational expenditure in Mali for 1978
was given as 19.75 million CFAF in the 1981 Unesco Statistical Yearbook and
as 17.1 million in the report L'Education au Mali (Republique du Mali 1981;
confidential) prepared the same year (jointly by Unesco and the Ministry of
Education of Mali).
These data have therefore to be carefully checked before being
used. The discrepancies which appear between sources may result from many
causes. The main ones are:
o The extent to which expenditures by other administrations than
the ministry of education are covered
o The type of budgetary documents used (provisional accounts,
final accounts., and the like).
The first cause is the most frequent one--and one which may
strongly bias international comparisons. One example taken from sub-Saharan
Africa shows the extent of that bias when the expenditures of the central
government are confused with the expenditures of the ministry of education.
In the Ivory Coast, part of the budget of institutions controlled
by the ministry of education is financed by other ministries. It has been
estimated that, in the late 1970s, that part amounted to 27% of total
expenditures. If other educational institutions controlled by other
government services are included, this proportion goes up to 39% of total
education expenditures by the central government.

- 18 -
In Malawi, at the same time, it was estimated that the
contribution of all other ministries to expenditures on education did not
represent more than 5% of the contribution of the central government. One
can easily see that a comparison taking only the ministry of education into
account would be strongly biased in favor of Malawi. But things get worse
when one looks at unit costs or, rather, at expenditures per pupil.
Expenditures per Pupil
This type of data is more directly useful than total costs because
it allows direct comparison between countries if the data are translated into
a common monetary unit. But their computation necessitates information
coming from sources other than education budgets.
Country Data
If these data are presented in local money at current prices, they
necessitate only information on enrollments. But the school year rarely
coincides with the fiscal year, and different choices may lead to quite
different outcomes--as can be seen in the following examples taken from Mali
and Upper Volta.
o Mali--cost per student in primary education, 1978:
Source Amount in CFAF
1981 Unesco Statistical Yearbook 28,750
1981 report, L'Education au Mali 23,970
o Upper Volta--cost per student in primary education, 1977:
Source Amount in CFAF
1981 Unesco Statistical Yearbook 11,130
World Bank project data 11,950
When one checks the Mali data, one discovers that one-fourth of
the difference is due to the difference in the total cost figure, but the
- 19 -
other three-fourths comes from the different way in which the enrollment
figure was obtained. The Statistical Yearbook gives enrollment for the
school year, which starts in the given calendar year, and the Mali report
uses a weighted average of ernrollment in school years 1977-78 (3/4) and
1978-79 (1/4). Furthermore, the Statistical Yearbook gives only figures for
the first cycle of basic education, and the Mali report uses figures for the
two cycles. When the data for Upper Volta are checked, the difference is seen
to be due in totality to the fact that enrollments are for the school year
1976-77 in the World Bank data, whereas the Yearbook data for 1977 are
actually for the school year beginning in October of that year--that is, the
school year 1977-78.
If the fiscal year coincides with the calendar year, the weighted
average method used in the Mali report is of course the only correct one.
But these examples show how important it is
o To check the period for which the data are given
o To state expressly how the ratios one uses in a given
study have been computed.
International Comparisons
Cross-country comparisons are often made unreliable by the fact
that definitions vary from country to country. The problem of regional
averages is also important.
Difficulties in international comparisons. Some of the factors
making international comparisons difficult have been pointed out in the
preceding section:
o Differences in coverage
o Differences in the choice of a base year for enrollments
o Unequal quality of the budgetary documents
But there is also the problem of the choice of the unit for the account

- 20 -
The problems of international comparisons of real incomes (or
expenditures) is well known. Sophisticated methods have been devised to
compare national incomes, 2/ but it is not obvious that the same deflator
should be applied to educational expenditures as to GNP, and the new series
are not yet available for most of the poorest countries. Official rates of
exchange in relation to the U.S. dollar have in recent years exhibited
erratic variations which make their use rather hazardous. Utilization of the
implicit GNP deflator and of the weighted average exchange rate used by the
World Bank to compute its series of GNP per capita in constant U.S. dollars
seems to be the least objectionable solution.
As a result, computations made by different people or by using
different sources can be different. Table 2.1 gives an example for West
Africa drawn from four different sources.
2/ See Kravis, Heston, and Summers (1982) and Kravis and Lipsey (1982).

- 21 -
Table 2.1: TOTAL PUBLIC EXPENDITURE ON EDUCATION IN PERCENT OF GNP.WEST AFRICA. SELECTED COUNTRIES AND YEARS.
COUNTRY YEAR SOURCE
I II III IV
Benin 1977 4.12 4.65 a/ -- 4.7 a/
C.A.R 1975 4.18 b/ 4.84 5.0 5.0
Ghana 1975 4.20 b/ 5.11 5.3 5.9
Ivory Coast 1975 6.66 7.02 7.4 6.3
Liberia 1976 2.14 1.97 2.6 2.6
Mali 1977 4.89 b/ 4.84 5.1 5.0
Mauritania 1977 5.79 4.47 5.8 5.8
Nigeria 1976 6.57 6.47 4.7 5.5
Sierra Leone 1977 3.11 3.90 4.3 4.0
Upper Volta 1977 3.08 2.65 2.5 2.5
Sources: (I) 1982 World Bank data compiled by M. Zymelman (EducationDepartment); (II) our own computation using Unesco StatisticalYearbook data (various years) for total cost and IMF or World Bankdata for GDP; (III) Unesco Statistical Yearbook 1980, Table 4.1;(IV) Unesco Statistical Yearbook 1981, Table 4.1.
a/ Current expenditures only.
b/ Using Unesco data (in the other cases, World Bank data were used).

- 22 -
Some results are striking. For example, in the case of Ghana all
sources used Unesco data for public expenditures and still came out with
widely different results. In the cases of the Ivory Coast and of Nigeria,
two successive Unesco Statistical Yearbooks give quite different figures for
the same year.
Table 2.2 shows differences between Zymelman's results and ours,
which used Unesco data for primary education in West and East Africa. It
confirms the sensitivity of the results to choices made by the analyst and
reinforces our warning about the danger of drawing hasty conclusions.
The problem of averages. Unit cost figures are often used to
compare not only countries but also regions of the world and countries within
a region. Regional averages are therefore widely used. Three types of
problems are encountered in their computation.
First is the choice of the regions. There is a generally admitted
distinction between developed and developing countries, but among developing
countries different institutions make different segmentations. The World
Bank distinguishes six regions, Africa being divided between three of them;
Unesco distinguishes only five, two of them (Oceania and North America) being
shared by developing and developed countries. Countries may also be grouped
according to criteria other than their geographical situation. For instance,
grouping according to level of per capita income is used in the last
Education Sector Policy Paper of the World Bank (1980a). In this paper, we
shall follow the World Bank classifications but will also show that some
other groupings might be useful.

- 23 -
Table 2.2: COST PER STUDENT IN PRIMARY EDUCATION IN PERCENTOF GNP PER CAPITA. SUB-SAHARAN AFRICA. SELECTEDCOUNTRIES AND YEARS
COUNTRY YEAR SOURCE
I II
Benin 1977 18 20.5C.A.R. 1975 27 a/ 18.5Ghana 1975 11 a/ 7.5Ivory Coast 1975 21 22.9Mali 1977 55 a/ 45.5Mauritania 1977 44 43.9Nigeria 1976 18 13.1Upper Volta 1977 39 33.0
Botswana 1978 20.85 16.6Burundi 1978 34.09 32.1Madagascar 1977 12.73 13.0Mauritius 1978 16.72 20.5Rwanda 1975 33.92 22.2Somalia 1978 44.41 33.8Swaziland 1977 7.38 7.4Uganda 1975 11.69 a/ 13.0Zambia 1975 13.57 a/ 14.5
Sources: (I) 1982 World Bank data compiled by M. Zymelman (EducationDepartment); (II) own computations using Unesco StatisticalYearbook data for expenditures and enrollments and World BankAtlas for GNP per capita.
a/ Unesco data.
- 24 -
Second is the choice of the base year. Very often data are not
available for all countries for the same year. When the number of countries
in a region is small, the choice of an adjacent year for some countries may
produce different coverages according to the choice made.
Third is the choice of statistical method. Several averages may
be computed: arithmetic or geometric, weighted or unweighted, and so on. The
choice will depend upon the objective. For example, if we want to compare
the "effort" in favor of education made in different countries, each country
should be given the same weight; if we want to avoid giving too much
influence to extreme situations, a geometric average should be preferred to
an arithmetic one. But, as a matter of fact, averages which have been
computed in a different way are often compared as if they were the same. And
judgments are passed on individual countries which would be reversed if other
averages were used.
Two examples will illustrate this point. First, two recent
studies--one by the Unesco Office of Statistics (Unesco 1982b) and one by
M. Zymelman of the World Bank (1982 data, Education Department) report trends
in world educational expenditures by region during the 1970s. A comparison
of the results for developing countries show striking differences. The
Unesco study indicates that, on average, the ratio of educational
expenditures to GNP has increased from 3.3% in 1970 to 4.0% in 1979, whereas
Zymelman finds that it has gone down from 3.29% in the early 1970s to 3.16%
in the late 1970s. Quite different conclusions will of course be drawn
according to the study used as reference. Part of the difference may be
because the two periods of observation are not exactly the same in the two

- 25 -
studies, but most of it comes from the difference in the statistical methods
used in each case. Unesco used arithmetic averages weighted by GNP in each
country, and Zymelman computed straight geometric means of country ratios.
Second, regional averages were computed by us (Eicher and Orivel
1980) for Unesco and by the World Bank for its Education Sector Policy Paper
(1980a), in both cases for the year 1975. If we compare those two studies,
we get the following resultS for higher education by level of GNP per capita
(in U.S. dollars):
Less than US$265 to US521 to US$1,076 toUS$26'5 US$520 US$1,075 US$2,500
World Bankaverages 534 675 1,757 1,290
Our averages 1,332 1,577 1,163 1,847
These striking dijfferences should not be due to the use of
different data sources because Unesco data were used in both cases. They can
be explained in part by the statistical methods. The World Bank Sector
Policy Paper apparently used geometric averages, and we computed unweighted
arithmetic averages. Arithmetic averages weighted by number of students in
each country would give still different results. For instance, for the less-
than-US$265 group we would have the following choices:

- 26 -
o Our unweighted arithmetic average: US$1,332
o World Bank geometric average: US$534
o Weighted arithmetic average: US$147.
The last average is overwhelmingly weighted by the presence of
India, which represents 90% of the total number of students but only 74% of
the expenditure--so that it is close to the figure for that particular
country (US$123), which is among the lowest in the world (only Bangladesh and
Burma spent less per student in 1975).
Another cause of differences probably resides in the number of
countries included in each computation and in the original country data used
in each case. 3/ The geometric average for the countries included in our
study and using Unesco Statistical Yearbook data is US$738 (instead of US$534
for the World Bank figure) for the less-than-US$265 group. It is US$862
(instead of US$675) for the US$265-to-US$520 group, US$648 (instead of
US$1,757) for the US$521-to-US$1,075 group, and US$1,382 (instead of
US$1,163) for the US$1,076-to-US$2,500 group.
This state of affairs is quite unsatisfactory indeed. These data
are actually used for guiding policy recommendations, as can be seen in this
excerpt from the last World Bank education sector report on China (World Bank
1983, p. 54): "The unit cost in higher education was about $1,150 in 1979,
3/ We have not been able to get the regional country data used by theauthors of the Sector Policy Paper, but we suspect they have includedcountries for which data are available not in the Unesco StatisticalYearbooks but in special Unesco reports.

- 27 -
or about $880 in 1975 prices. This unit cost averaged $534 and $675,
respectively, in 1975 in the comparative country groups. The reasons for the
high unit cost in China have been enumerated .... It should be possible to
reduce unit cost without jeopardizing attempts to raise the quantity of
higher education."
This conclusion, based on the average found in the Education
Sector Policy Paper (World Bank 1980a) for the less-than-US$265 and for the
US$265-520 group, would be reversed if our own average of US$1,332 or
US41,577 were used. China would then be found to have rather low unit costs
for higher education, and no recommendation to try to lower these still
further should be made. On the contrary, the use of the arithmetic weighted
average would strengthen the conclusion and the recommendation. Good
arguments can be given in iavor of using a weighted average. In this
particular case, it is probably more useful to compare China with India than
with the many small African countries which are included in the sample. But
great care should be exercised to explain the method used, not to compare
averages computed in different ways, and also to satisfy oneself that the
choice made is based on sotnd logical foundations. The unreliability of cost
data is further confirmed by the observation of specific cost items.
Cost of Teachers
Because teacher salaries are by far the main cost item, at least
in primary and secondary education, it is most important that the cost of
teachers should be recorded with accuracy and in detail. It is indeed the
cost item which is best kncwn. But the figures given do not always represent
the total wage bill of teachers and do not always allow for an economic study
of wage levels.

- 28 -
Problems of Interpretation of Budgetary Documents
One should first mention the case where wages and salaries of
teachers do not appear at all or do not appear as such in the ministry of
education's budget. Sometimes salaries of all public servants appear in the
budget of a single ministry. Sometimes they do appear in the budget of the
ministry of education, but as a transfer to the other ministry. This, for
instance, was the case in Malawi until 1977 for primary school teachers. As
a result, the percentage of expenditures represented by teacher salaries
suddenly went up from 15% to 92% between 1977 and 1978, a change in the
ministry of education's budget which should be baffling to anybody unaware of
that purely formal change in budgetary procedure.
More frequent, but no less important, is the case of retirement
and disability pensions. In most countries where teachers are public
servants, pensions are administered by a special office which is
administratively linked with the ministry of the interior or with a special
ministry. The rather complicated task of reapportioning to the ministry of
education the net expenditures on teacher pensions is necessary only if we
are interested in the cost of teachers to society or to the state. As far as
the ministry of education itself is concerned, there is no cost involved. 4/
Another problem is that of temporary teachers. Secondary school
graduates teach for one or two years in primary schools on a voluntary or
compulsory basis in several countries in West Africa. These temporary
teachers are paid, at a much lower rate than permanent teachers, and the
amount apportioned to them does not usually appear on the same budgetary line
4/ If the pension fund is totally or mainly financed by deductions fromgross salaries, which the ministry of education afterward transfers tothe administration concerned, the cost of pensions is included in thebudget, at least in part.

- 29 -
as for other teacher salaries. But these sums still have to be included if
one wants a clear picture of the evolution of the wage bill, of the average
teacher's salary, and of the average salaries of each teacher category.
Only a careful inventory of all categories of teachers, of their
status, and of their pay scale may help in getting correct salary averages
and thereby correct comparisons. It would help avoid contradictions which
may be found between different reports, sometimes produced by the same
institution. One example concerning Togo may shed some light upon the danger
of too hasty computations.
World Bank education sector data of 1978 state that, in primary
education in Togo, recurrent costs per student are low but that teachers
nevertheless receive high tialaries relative to the income level of the
country--for primary school teachers, on the average about eight times GDP
per capita. But the World Bank staff appraisal data for the First Education
Project in Togo state that primary teachers' salaries are only six times GDP
per capita, and in the Report and Recommendations of the President one reads
that the lower percentage of GNP spent on primary education is due to "low
teacher salaries." A careful analysis of the official data, however, shows
the following.
o The figure given in the Bank's education sector data is correct
only if nonqualified teachers (monitors) are excluded. If they
are included, one finds six times GDP, the figure given in the
Appraisal Report.
O Comparatively, teachers salaries are not very high in Togo (as
can be seen in Table A.3 of the Annex).

- 30 -
This example unfortunately is not unique. Rather, it illustrates
the normal state of affairs and strongly points to the necessity of taking
prompt action to improve the gathering and use of cost data.
In some cases, the figures appearing in provisional budgets are
not of much significance because salaries are not always actually paid out or
are paid after a long delay, sometimes in the next fiscal year. Never-
theless, only in-depth surveys of teacher salaries can give information on
effective disbursements.
Teacher Salaries and Teacher Costs
To get the total cost of teachers to society as a whole and to
each group concerned, it is important to know not only what is the salary
paid to each category of teachers by the official employer but also what the
teachers get from other sources. There may be an important gap between the
official salary for one post and the total income of one teacher for several
reasons.
o Teachers usually get fringe benefits which are not included in
the budget. The most common of these is free lodging, which is supposed to
be guaranteed to primary school teachers in most Francophone West African
countries, for instance, but is usually provided by parents in rural areas
through self-help building schemes. But there usually are also provided may
gifts of food or other goods, which may represent a sizable part of total
income and are in any case a sizable cost to some families. This aspect of
education to the households has never been studied in a rigorous way, at
least to our knowledge. Only well-designed household expenditure surveys
could provide the necessary information.

- 31 -
o Teachers have sometimes more than one teaching job. The most
common case is that of publLc school teachers who also lecture in private
schools. This practice, whLch is widespread in many countries, may partly
account for the fact that several studies show much lower costs per student
in private schools than in public schools. 5/ More detailed studies of this
problem should help in choosing optimal cost reduction measures. For
instance, increasing teaching loads might have unfavorable effects on private
schools and induce an influ: of students to public shools, which in turn
would have an effect on costs.
Student Aid
Student financial, aid is sometimes very high, especially at the
tertiary level. It represents a heavy burden on some governments, especially
in Francophone West Africa. But the costs are often difficult to evaluate in
full for two reasons.
5/ Two recent examples from West Africa will illustrate:
o For the Ivory Coast, the Yearbook of Education Statistics(Enseignment et Formation en Cote d'Ivoire--Statistiques.Annee Scolaire 1978-79) gives the following data for average teachersalaries (Republique de Cote d'Ivoire 1978-79):
Public PrivatePrimary 48,877 CFAF 22,287 CFAFSecondary 290,000 CFAF 105,629 CFAF
o For Togo, a 1975 Unesco report (1975b) gives the following figures:
Public PrivatePrimary 6,675 CFAF 5,544 CFAFSecondary 26,756 CFAF 22,716 CFAF
- 32 -
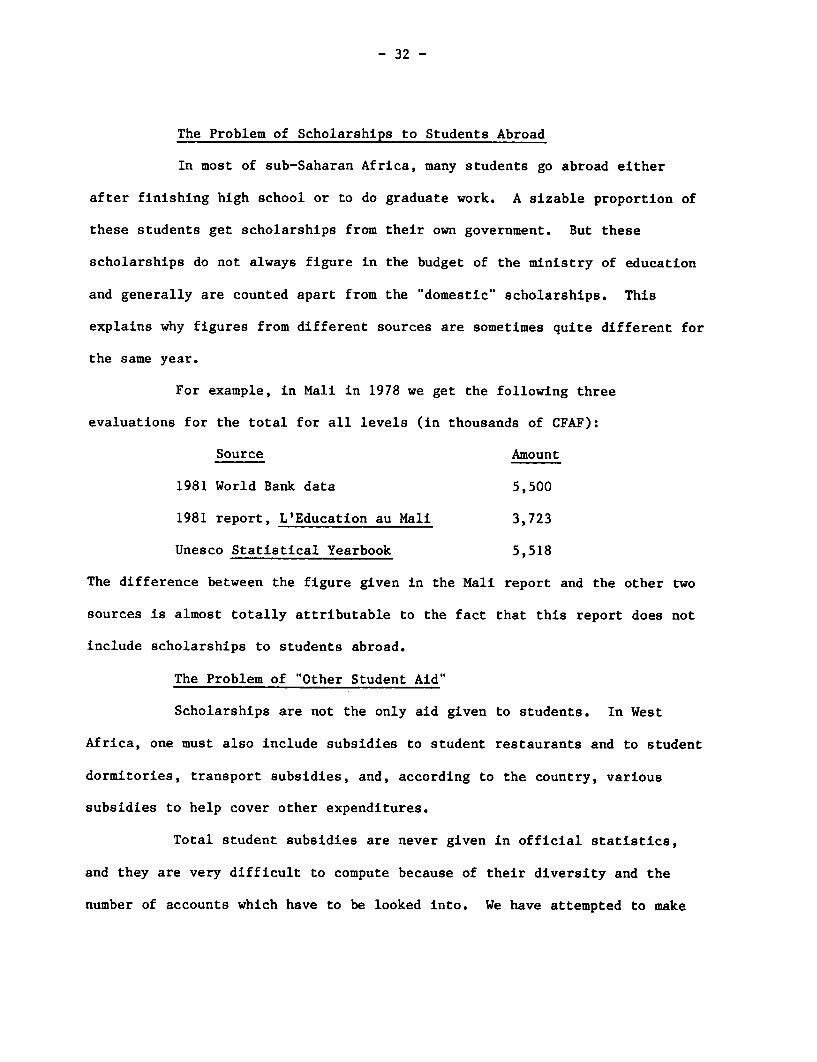
The Problem of Scholarships to Students Abroad
In most of sub-Saharan Africa, many students go abroad either
after finishing high school or to do graduate work. A sizable proportion of
these students get scholarships from their own government. But these
scholarships do not always figure in the budget of the ministry of education
and generally are counted apart from the "domestic" scholarships. This
explains why figures from different sources are sometimes quite different for
the same year.
For example, in Mali in 1978 we get the following three
evaluations for the total for all levels (in thousands of CFAF):
Source Amount
1981 World Bank data 5,500
1981 report, L'Education au Mali 3,723
Unesco Statistical Yearbook 5,518
The difference between the figure given in the Mali report and the other two
sources is almost totally attributable to the fact that this report does not
include scholarships to students abroad.
The Problem of "Other Student Aid"
Scholarships are not the only aid given to students. In West
Africa, one must also include subsidies to student restaurants and to student
dormitories, transport subsidies, and, according to the country, various
subsidies to help cover other expenditures.
Total student subsidies are never given in official statistics,
and they are very difficult to compute because of their diversity and the
number of accounts which have to be looked into. We have attempted to make
- 33 -
such an evaluation for the ]:vory Coast (see Chapter 9 of Part III of this
report, under "Households. Higher Education"), but more detailed studies
should be undertaken in a sample of countries.
Other Current Expenditures
This term was used in Unesco Statistical Yearbooks until 1981 to
cover all expenditures except teacher salaries, student aid, and (sometimes)
cost of administration. These data should be very useful to the economist
because they are supposed to give the cost of teacher's aids and therefore to
have an influence on the quality of education. But published data have two
drawbacks which make them generally quite useless: they are never detailed,
and they exhibit too many inconsistencies. Let us give a few examples of
this last problem.
Cross-country Comparisons
Table 2.3 gives f:Lgures in U.S. dollars for selected countries
during the late 1970s. Clearly, these figures are not representative of what
is really spent for teaching materials, at least in countries such as Italy
and Denmark, and the differences among developing countries look suspiciously
high.

- 34 -
Table 2.3: "OTHER CURRENT EXPENDITURES" PER STUDENT IN PRIMARY EDUCATION.SELECTED COUNTRIES AND YEARS.
COUNTRY YEAR EXPENDITURE (US$)
Burundi 1976 0.47C.A.R 1978 1.5Congo 1978 0.02Ivory Coast 1978 5.6Mali 1978 2.1Togo 1978 1.0Upper Volta 1977 0.8Malawi 1975 0.03Rwanda 1978 1.3Chile 1978 16.98El Salvador 1975 1.0Venezuela 1975 0.49Thailand 1978 0.97Algeria 1978 14.0Denmark 1979 0.27Italy 1978 0.008
Source: Unesco Statistical Yearbooks.
- 35 -
Time Series
Data are not available for more than two or three years in most
developing countries. But what data exist confirm the unreliability of this
source of information. For instance, according to Unesco Statistical
Yearbooks, in the People's Republic of Congo expenditure per student in
primary education moved from US$1.3 to US$0.02 between 1976 and 1978 and in
higher education from US$612 to US$18. In the Ivory Coast between the same
two years, the shift was froma US$13.3 to US$5.6 in primary education and from
US$429 to US$0 in higher education.
There is no need t:o multiply the examples to show that these data
should not be used to make an economic analysis. The main reasons why this
is so are the following.
o The largest part of the expenditure on teaching materials in
most countries is shared between local authorities and
households. Therefore, only surveys of schools and of
household expenditures could give us the information needed,
and very few reliable surveys of the kind are available for
developing countries.
O The figure for "other current expenditures" is often obtained
by taking the difference between total cost and teacher
salaries plus w'hichever other types of expenditures can be
identified.
Because the amount represented is small in any case in poor
countries, the errors which may have been made in calculating other
aggregates are automatically t-ranslated in this budgetary line and may
explain most of the inconsistencies.

- 36 -
Capital Expenditures
Two problems often make budgetary figures unreliable as
measurements of cost. First, budgets give only provisional amounts. The
difference between what was foreseen and what is actually spent is usually
much higher when investments are concerned.
Second, in developing countries a large part of building and
equipment expenditures comes from foreign aid. Because the donors are often
many and the channels through which the aid is funneled highly varied, it is
often difficult to find detailed data.
PART II
COST ISSUES IN EDUCATION

INTRODUCTIONTO PART II
That education cost data are often unreliable is more of a problem
today than it was earlier because of the severe financial constraints most
governments are facing, especially in developing countries. It certainly
impairs the capacity of economic analysis to help make policy
recommendations.
Education policies should, in the medium term, reconcile two
objectives: the quantitative expansion of the school system (especially in
countries where universal basic education is still far away), and the
effectiveness of schools (given the overall objective of social
development). The objectives must be met subject to budgetary constraints,
and it is felt that the budgetary bind is getting so severe that it may
prevent reaching these goals if more cost-effective procedures are not found
or if cost-recovery measures are not implemented.
The first cost iss3ue discussed is therefore the trend in the total
cost of education. Is total cost rising so fast that it will soon be
impossible for most governments to "foot the bill"? Is it already "too
high"? Is the trend true everywhere? If it is, what are the most effective
cost-saving measures?
Because teacher salaries represent a high percentage of total
cost, we shall next concentrate on that issue and try to show if and how the
total wage bill for teachers can be reduced. But some of these cost-reducing
measures have negative effects on the quality of education. Because
educational quality is generally considered as already "low" in low-income
countries, what are the most cost-effective and the least costly
quality-improving measures?
- 39 -

- 40 -
In addition to these issues, school systems are still growing fast
in most developing countries, especially in sub-Saharan Africa. Can we
expect to reap economies of scale and therefore to have lower costs per
student in the future? Under what conditions, and to what extent?
Finally, high repetition and dropout rates are observed in many
developing countries. It is generally considered that lowering them would
contribute in an important way to improving the cost effectiveness of
education, partly by reducing the level of expenditure per graduate. Does
this really mean that automatic promotion procedures, for instance, would
proportionally reduce costs? If not, under which conditions would this
reduction be effective?

CHAPTER 3
THE RISING TREND OF TOTAL COST
After a decade of' "almost euphoric belief in education" (Husen
1979) in the 1960s, education has entered a state of financial crisis. This
crisis is partly the consequence of the preceding growth of educational
expenditure, which, because of its exponential character, could not be
sustained. It has been accentuated by the world economic crisis that started
in 1974. But, to some extent, it is also the result of a crisis in
confidence.
In developed countries, on the one hand, campus unrest in the late
1960s led many governments to see universities more as training grounds for
revolutionaries than as institutions generating highly qualified manpower and
new scientific knowledge. Young people use universities more and more as
"parking lots" when the universities are tuition free and tend to desert them
when they are expensive. In developing countries, on the other hand, demand
for education is in general still very strong. Most parents still feel that
a university degree is the key to well-paid and agreeable jobs. But
governments are sometimes less eager, and almost always less able, to finance
rapidly growing school systems.
As was shown in Part I, official country statistics are often
unreliable, especially in developing countries, and one is faced with much
incoherence in the available data. But broad trends may be detected,
especially when time series constructed from different data sources point in
the same direction. Before looking at the facts, a few methodological
problems concerning the choice of indices have to be solved. After we have
looked at the facts, some policy conclusions will be attempted.
- 41 -

- 42 -
Methodological Problems
Time series data are meant to answer two sets of questions.
First, what is the trend in total cost of education? 1/ Is it really rising
everywhere? By how much? Second (and more difficult), has the ceiling of
what can be done been reached, or will it be reached in the near future?
Where?
A time series of total public expenditures on education by itself
would be of no use to answer these questions. Even supposing that there is
no inflation during the period under consideration, so that money
expenditures may be considered as representing real expenditures, the meaning
of a sharply rising trend in total expenditures on education will be quite
different according to the initial percentage of total budget going for
education and to the trend in total budget.
For instance, if the total budget increases annually by 10% in
real terms and if the education budget increase by 50% but represents at the
start only 1% of the total budget, after ten years the education budget will
have multiplied by almost thirty, its percentage of the total budget will
have grown to almost 20%, but only 30% of the (real) increase of total budget
will have been spent on education (which, presumably, can be afforded if a
high priority is accorded to education).
1/ Of course, it would be interesting to have data on total costs for allparties involved. But data on household expenditures on education areusually not available, even in developed countries. And the problem wedirectly address is the problem of public finance--namely, that of thefinancial burden to the state (defined as representing both central andlocal governments). Therefore, we shall look only at data on publicexpenditures for education, adding later some reflections on costs.

- 43 -
The rate of increase in public expenditures on education may,
however, be of some use in comparing countries. But this rate depends on
many other things besides the relative priority given to education, and first
among these is the rate of increase in the overall budget. From a long-term
point of view, it also depends on the amount of resources produced in the
country.
What we are directly interested in is some kind of measurement of
"effort" in favor of education in order to see whether that effort is
possible given the resources. 2/ But this effort must be observed from two
points of view: that of the state, which has to face a general budgetary
constraint and "political" allocative constraints in the overall budget, and
that of society as a whole, which has to decide which share of total
resources it is ready to allot to education through public channels.
Because we need dimension-free indices to be able to make valid
comparisons through time and space, the two following simple indices seem to
be both possible and acceptable:
o Representing "fiscal effort": percentage of public resources
spent on education (education budget x 100/total budget)
2/ This so-called effort is partly constrained by factors other than budgetlimitation. Within the budget constraint, the effort will be differentin two different countries, even though their "preference" for educationis the same, if the number of potential users is different. Otherfactors are also interesting to study. For one attempt in thatdirection, see Zymelman (1976).

- 44 -
o Representing "national effort": percentage of national
resources spent on education (education budget x 100/GNP) 3/
Of course, these indices are not perfect. In some cases they may
give a strongly biased evaluation of effort. For instance, "fiscal effort"
as defined above will tend to appear smaller in countries where the state
directly undertakes many productive activites than in predominantly
free-enterprise economies. "National effort" will tend to appear higher,
other things being equal, in developing countries because GNP is
underestimated but not public expenditures on education, which are made in
money and appear in totality in budgetary documents. But, once again, if one
is interested mainly in evaluating broad trends, if one does not seek to draw
precise conclusion for any given country, these indices are quite adequate.
The Data and Their Interpretation
The Facts
Time series have been computed for national effort (percentage of
GNP spent publicly for education) for the period 1960-76 for about 140
countries (by us), for the period 1972-79 for a selected group of developing
countries (by Manual Zymelman of the World Bank's Education Department in
1982), and for the period 1970-78 (by Unesco, 1982b). Averages for developed
and for developing countries are given in the last Education Sector Policy
Paper of the World Bank (1980a) for selected years between 1960 and 1974.
3/ GNP is used because it is the most commonly available nationalaggregate. There may be good reasons to prefer another aggregate from apurely logical and abstract standpoint, but we shall not undertake todiscuss these merits here because the interest of such a development ispurely academic.

- 45 -
Although the dat:a for individual countries do not coincide from
one series to the next for reasons explained earlier, the trend is quite
clear.
o During the 1960s, developed and developing countries followed
about the same pattern, increasing their public expenditures on
education much faster than GNP. As a result, the index of
effort (calculated as the arithmetic average of national
efforts) went up from 2.9% of GNP in 1960 to 4.15% in 1970.
o This trend extended into the 1970s, but:
- The rate of increase of public education expenditures slowed
down between 1970 and 1974, although the rate of increase of
GNP was on the average higher than in the late 1960s. As a
result, the index of effort increased less than before (4.3
in 1976).
- The pattern ceased to be uniform. Developed countries
increased their effort more than developing countries;
different regions behaved in different ways; the coefficient
of variation between countries increased considerably.
- Since the world economic crisis began in 1974, the
developed countries have on average stabilized the share of
GNP they s;pend publicly on education (although this is not
true everywhere, especially in Western Europe), but
developing countries still on average increase their effort.
- Among developing regions, Latin America has decreased its
effort, AsLa has more or less stabilized its, and
sub-Saharan Africa has kept increasing its.
- 46 -
If we look at the fiscal effort, the trend is almost the same, but
the contrast in recent years between regions and individual countries is
still more visible than for national effort. The salient facts which must be
highlighted are the following.
o Between 1960 and 1974, the part of the national budgets
allotted to education has increased by around 35%, going from
around 11% to around 15%; these percentages are about the same,
on average, in developed and in developing countries.
O Since the beginning of the 1970s, developed countries as a
whole have started reducing the percentage for education in the
public budget, and the movement is almost universal. It
touches North America as well as Japan, Eastern Europe as well
as Western Europe. But in developing countries the opposite
tendency was quite general until the mid-1970s. Since then,
many developing countries have started stabilizing their fiscal
effort, and a sizable minority have reduced it.
These facts show us two things. First, the effort in favor of
education during the last twenty years or so has really been tremendous.
Total public expenditures were almost multiplied by 3.5 in real terms;
national effort increased by around 75% in developing countries and by around
50% in developed countries; fiscal effort increased by more than one-third in
both groups in less than fifteen years.
Second, this effort is now leveling off. In developed countries,
fiscal effort is even decreasing, and national effort is no longer increasing
everywhere. In developing countries the average trend is still upward, both
- 47 -
for fiscal and for national effort, but this average hides the fact that the
countries where fiscal effort has ceased to increase or is decreasing
henceforth represent a majority. In Latin America a majority of countries
have reduced their national effort, and in Asia the tendency is toward
stabilization. Only sub-Saharan Africa 4/ stands out as a group with
continued upward trends.
Before attempting to interpret the general slowing down, let us go
a little more deeply into the case of Africa. Most sub-Saharan African
countries became independent only after World War II, the majority of them
around 1960. Their school systems were little developed, and most of them
had to undertake setting up a universal primary education system as well as
developing or creating secondary and higher education.
Their national and fiscal effort was, from the start, above
average. They doubled the percentage of GNP spent publicly on education
since 1960. In many of them that percentage was above 4% around 1974, and
they were on average almost one point above the rest of the developing
countries.
The evolution of national effort from 1970 to 1978 is summarized
in Table 3.1 and is further detailed in Tables A.1 and A.2 of the Annex.
4/ The Republic of South Africa, classified as a developed country, isexcluded.

- 48 -
Table 3.1: EVOLUTION OF THE PERCENTAGEOF GNP SPENT ON EDUCATION IN SUB-SAHARAN
AFRICA. 1970-78.
REGION OR GROUP 1970 1974 1976 1978OF COUNTRIES (1) (2) (3) (4)
Sub-Saharan Africa 3.57 3.52 3.64 4.11 (4.39) a/West Africa 3.39 3.54 3.79 4.39 (4.46) a!East Africa 3.79 3.48 3.42 3.77 (3.93) a/Former French
colonies 3.51 3.69 4.02 4.67 (4.81) a/Former British
colonies 3.92 3.53 3.70 4.04
Source: Col. 1: Unesco Statistical Yearbook 1980, Table 4.1.Cols. 2,3,4: own calculations using Unesco StatisticalYearbook data from total public current expenditures oneducation and IMF International Financial Statistics forGNP (except for the Central African Republic, Chad,People's Republic of Congo, Guinea, Mali, Niger, Somalia,for which World Bank data were used).
Note: All the percentages have been calculated by computing anunweighted arithmetic average of country ratios.
a/ Numbers in parentheses are percentages excludingcountries for which no data were available for precedingyears and countries for which data did not come from thesame source as in preceding years.
The most striking fact from the table is the considerable increase
in effort since the beginning of the world economic crisis in 1974. But one
also may note that the increase is the greatest in former french colonies,
former British colonies being closer to the average.
A look at individual country data (see Tables A.1 and A.2 in the
Annex) shows that since 1976 the increase in effort is quite general. The
contrast between sub-Saharan Africa and most other regions is therefore quite
marked and needs a special explanation.

- 49 -
Interpretation of the Facts
To interpret the general slowing down (outside of Africa), the
question will first be asked whether the circumstances which made governments
embark on such an effort are changing in such a way that some relaxation is
warranted. Then a little more rigorous study of the determinants of public
effort in favor of education will be undertaken.
The slowing down of education expenditures was not caused by
saturated demand. Because the effort produced during the 1960s was
exceptional, one likely hypothesis would be that most countries had reached
their goals around 1970 and henceforth gave priority to other, more urgent
social concerns such as health, communications, and the like. In developing
countries, one topmost priority is universal basic education. Was that goal
achieved, or at least close to being achieved, at the beginning of the 1970s?
Time series on total enrollment in primary education are
impressive because they show a total of almost 265 million pupils enrolled in
1970 and an average rate of increase in enrollment of 5.1% per year between
1965 and 1970. But the gross; enrollment rate, which considerably overstates
the true proportion of children who are in school, was only 70% in 1970, and
it had reached that level partly because of an increase in the repetition
rates. Net enrollment rates are much less encouraging. Although enrollment
kept increasing in the 1970s, the situation in 1977 was as shown in Table
3.2.
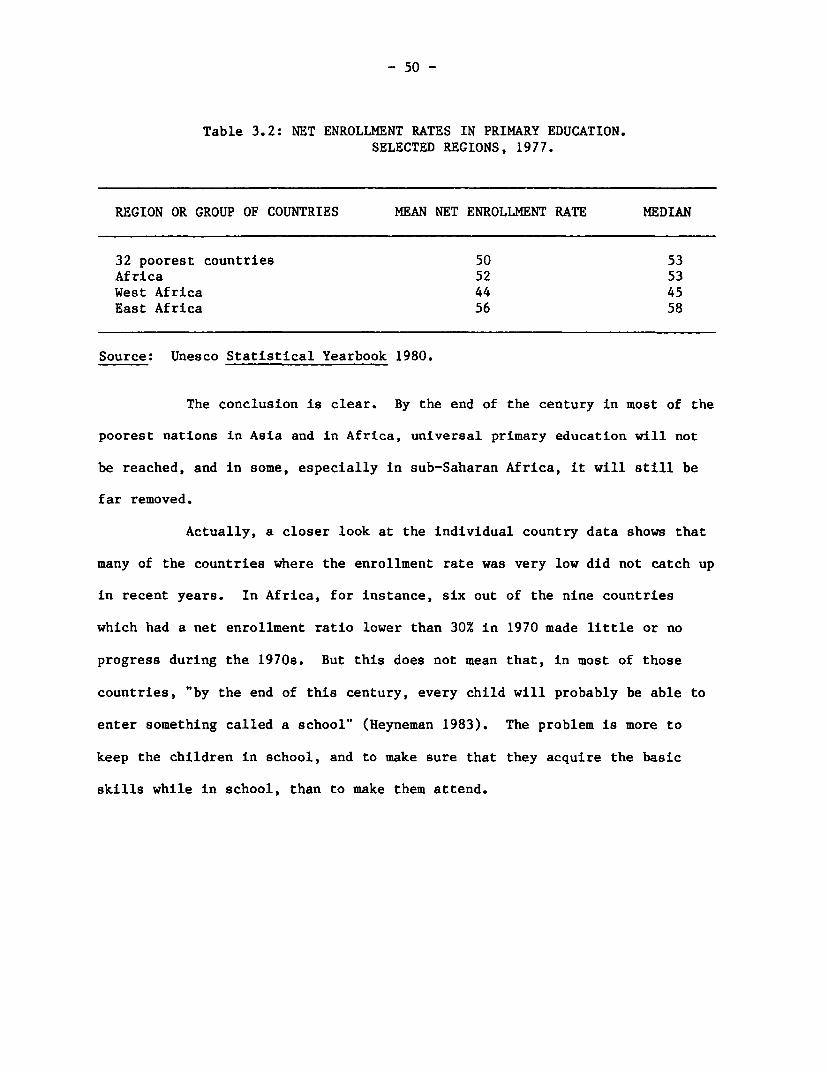
- 50 -
Table 3.2: NET ENROLLMENT RATES IN PRIMARY EDUCATION.SELECTED REGIONS, 1977.
REGION OR GROUP OF COUNTRIES MEAN NET ENROLLMENT RATE MEDIAN
32 poorest countries 50 53Africa 52 53West Africa 44 45East Africa 56 58
Source: Unesco Statistical Yearbook 1980.
The conclusion is clear. By the end of the century in most of the
poorest nations in Asia and in Africa, universal primary education will not
be reached, and in some, especially in sub-Saharan Africa, it will still be
far removed.
Actually, a closer look at the individual country data shows that
many of the countries where the enrollment rate was very low did not catch up
in recent years. In Africa, for instance, six out of the nine countries
which had a net enrollment ratio lower than 30% in 1970 made little or no
progress during the 1970s. But this does not mean that, in most of those
countries, "by the end of this century, every child will probably be able to
enter something called a school" (Heyneman 1983). The problem is more to
keep the children in school, and to make sure that they acquire the basic
skills while in school, than to make them attend.

- 51 -
Unfortunately, the crude indices often used to measure the
"quality" of primary schoolE8 show a shocking difference between developing
and developed countries and tend to point to a lowering of the quality in the
first group, especially in Africa.
o Total cost per student in primary education has been going up,
but it is still much below what is spent in developed countries. In 1976,
the situation was the following (in U.S. dollars): 5/
Total Costper student Ratio to (a)
(a) North America 1,734 --(b) Europe 549 1:3(c) Oceania 325 1:5(d) Latin America 87 1:20(e) Asia 79 1:22(f) Africa 50 1:35
The contrast is striking between developed and developing regions, and the
situation in Africa appears, as usual, particularly unfavorable. But these
figures may be misleading because they represent not only differences in
effort but also in cost levels. Data on current expenditures other than
salaries may be more interesting to examine.
o "Other current expenditures" are, as we have seen, generally
very poorly reported in official statistics. But several detailed surveys
(as well as most reports on primary education) show that, in Africa at least,
these expenditures are extremely low and have a tendency to regress in
absolute and relative terms. As a result, in most countries there is only
one textbook for several pupils, and in some countries, at least in rural
areas, even the teacher himself has no book; there are not enough benches and
tables to seat the pupils; there is no blackboard, not to mention the more
5/ For more details see Eicher and Orivel (1980), p. 18.

- 52 -
sophisticated teaching aids. And it is not by spending only one to three
dollars per pupil (which is what is effectively spent in many poor countries)
that this situation can be remedied. This fact is only beginning to be known
and its consequences on school, achievements to be understood. 6/
o Pupil-teacher ratios may be used to measure the trend in
quality if we assume that they were generally "too high" (compared with what
is generally considered as a maximum) at the start. Unesco data show that
they have been deteriorating in seventeen of the twenty-seven African
countries for which data are available between 1970 and 1977; they have
improved only in five. In Latin America and in Asia the situation is better,
although in no way satisfactory, as can be seen in Table 3.3.
Table 3.3: EVOLUTION OF THE PUPIL/TEACHERRATIO IN FIRST-LEVEL EDUCATION.
BY REGION, 1970-77.
NO. OF COUNTRIES NO. OF COUNTRIES NO. OF COUNTRIESIN WHICH THE IN WHICH THE IN WHICH THE
REGION RATIO HAS RATIO HAS RATIO HAS WORSENEDIMPROVED (two REMAINED MORE (two or moreor more points) OR LESS CONSTANT points
Africa(27 countries) 5 5 17
Latin America(11 countries) 3 4 4
Asia(14 countries) 5 5 4
Source: Eicher (1982), p. 61.
6/ For a forceful statement on these points, see Heyneman (1983).

- 53 -
In conclusion, by no stretch of the imagination can one attribute
the relaxation of the effort in favor of education to the fact that
educational needs were beginning to be considered as largely satisfied. A
more thorough investigation of the determinants of public spending on
education is therefore in order, as well as a look at the medium-term
consequences of a pursuit of the present effort.
The determinants of education expenditures. Assuming there is a
demand for primary education on the part of households, the amount spent will
depend on the demographic factors which determine potential enrollment and
the effective enrollment ratLos, on economic factors which determine the
capacity to finance education, and, given these constraints, on the attitude
of the government toward education.
Three models 7/ using data for 122 countries and for the period
1960-76 gave the following re!sults:
o Enrollment ratio in the 6-11 age group is the most important
explanatory variable for the national effort, and the rate of
change in this ratio is the most important explanatory variable
for the increase in effort between 1960 and 1976. 8,
7/ Details about their structure and results can be found in Eicher andOrivel (1980), pp. 42-55.
8/ Of course, the results of multiple regression models do not provecausality but show only correlation. One could also argue that the levelof education services provided explains the rate of enrollment. But thisis a dialectic process; when the pupils are enrolled, one has to keepoffering the services.
- 54 -
o GNP per capita is also important but less significant, and the
regression coefficient is very small--which confirms that rich
countries do not on average spend on education a much larger
proportion of their GNP than do poor countries. The rate of
growth of GNP between 1960 and 1976, however, had a strong link
with the rate of increase of public expenditures during the
same period but no link with the change in effort.
o Cultural traits seem to play a fairly important role, since the
countries in some cultural areas spend significantly more than
the average on education and others significantly less, other
things being equal. Among developing countries,
"French-speaking" Africa stands out strikingly (this variable
comes out third in the step-wise regression, and the "effort"
of Francophone African countries is one-third larger than that
of the others) and "English-speaking" Africa a little less so
(the variable comes out fourth, and the "effort" is a little
over one-fourth larger than that of the others).
Recent data compiled by Manuel Zymelman (1982, World Bank,
Education Department) confirm and complete this diagnosis. They also show
the "atypical" behavior of West and East Africa. Enrollment ratios have much
more influence on effort in favor of education than what Zymelman calls the
"demographic burden factor" (measured by the ratio between the age cohort
considered and total population), and there are important differences between
countries in unit costs of education relative to GNP per capita. By
considering separately each level of education, Zymelman gives further
insight on "national preferences."

- 55 -
The conclusions to be drawn from these studies are clear. In
developing countries in general, three causes contributed to the slowdown in
education spending:
o The slowing down of economic growth
o The relative decrease in the pressure of demand for education
o A change in government attitude toward education.
The relative contribution of each of these causes is far from being uniform
from one region to the next and even within a given region.
In sub-Saharan Africa the third cause is not yet at work in most countries,
and the pressure of unsatisfied demand has forced governments to increase the
percentage devoted to education in a stagnating GNP. But there is still a
long way to go before most of these countries come close to universal primary
education and before adult illiteracy becomes the exception. What can be
said about future probable trends and their consequences?
Future trends and problems. It is extremely perilous to try to
extrapolate past trends. In the field of education, one has only to recall
the extremely "optimistic" forecasts published in the "Europe 2000" plan or
studies made for Unesco in the 1960s, which anticipated that universal
primary education would be reached in most countries around 1980. But it is
useful to show what will happen if what is generally considered as the
minimum effort in favor of education is pursued until the end of the
twentieth century. Assuming that the trend in enrollment observed in
developing countries between 1960 and 1974 will be maintained until 2000 and

- 56 -
that unit costs of education will increase at the same rate as GNP per
capita, a simulation for developing countries shows that: 9/
o The gross enrollment rate in primary education will have the
following evolution:
1970 2000
Developing countries
as a whole 70.8 92.9
Africa 59.3 95.4
Latin America 102.4 130.6
Asia 66.4 81.4
This shows that, if rates of enrollment progress in the 1980s and
1990s as they progressed in the 1960s and the 1970s, universal
primary education will be reached in Latin America before the end
of the century but that Africa will still be rather far from it
and Asia still farther. 10/
o The percentage of GNP spent (publicly) on education will have
grown in the following way from 1975 to 2000:
Africa From 4.8 to 10.6
Asia From 3.8 to 5.2
Latin America From 3.3 to 5.5
9/ See Eicher (1982), pp. 61, 64. An earlier simulation, using a fictitiouscountry and reaching broadly similar conclusions, can be found in Hultinand Jallade (1975).
10/ These are gross rates. Net enrollment rates which show the trueproportion of school-age children who really are in school are, onaverage, at least 20 points below gross rates in developing countries.The poor performance of Asia is the consequence of the slow growth inenrollment rates observed between 1960 and 1974.
- 57 -
These results are striking inasmuch as they show that, although
while increasing substantially their "national effort" on education, two
regions out of three will not succeed in coming close to universal primary
education at the end of the century. The "effort" to be undertaken does not
seem unmanageable in Latin America and in Asia, but it clearly looks out of
reach in Africa. At present, no country comes close to spending almost 11%
of its GNP on education. International comparisons tend to show that there
is a ceiling to this "effort"' at about 8% of GNP, and that in many countries
the competition from other ":social concerns" is growing fast. The overall
situation will be satisfactory in quantitative terms only in one region,
Latin America, where, besides; universal primary education, one observes that
secondary school enrollment will almost triple and that tertiary education
enrollment will almost quadruple.
But the quality of education, by assumption, will nowhere increase
substantially. A policy which would aim simultaneously at universal primary
education, an improvement in the adult illiteracy situation, a substantial
increase in secondary and higher education enrollments, and quality
improvements would most probably be out of reach everywhere. 1/
From the observations and analysis of existing data made in this
chapter, one thing is clear. Governments do have good reasons to be
concerned about the rising trend of total costs and about their ability to
finance those costs in the future.
11/ Of course, it must be once again emphasized that regional averages hideimportant differences between countries, and, therefore, that theseconclusions do not apply to all developing countries. But it is safe tosay that most developing countries will face this problem.

- 58 -
If nothing is done to reduce unit costs and/or to improve the
cost-efficiency ratio of educational services, the present situation,
unsatisfactory as it is, can only deteriorate in the future in many
developing countries and, most probably, in the majority of sub-Saharan
African countries. But a comparative analysis of public expenditure trends
also shows that, given the demographic and financial constraints, governments
do exert a certain degree of "political will."
Of course, this does not explain the totality of the difference in
what we call national effort between any two countries. Part of it comes
from historical social choices. Some countries feel that it is better to
leave a large part of the financing of education in the hands of households,
and some think that this type of service should be provided almost free to
the consumer. As a matter of fact, what we call national effort is only that
part of a larger "societal effort" which is assumed by public authorities,
and differences in national effort may be partly compensated by differences
in "household effort."
Yet the multivariate models show that there are sizable
differences in national effort even between countries which not only face
similar constraints but also have made similar social choices. This means
that political will may partly offset constraints. As far as education is
concerned, this political will is nowhere more visible than in West Africa
(and to a lesser degree in East Africa). But it, too, has its limits and
cannot be expected to push the majority of those countries much further along
the road of increasing national effort.
- 59 -
The need for cost-reducing measures and, more generally, for
policies turned toward cost effectiveness is everywhere present and is
becoming urgent in many countries. Because the cost of teachers is by far
the largest item of total education cost, it is normal to look first at
possible ways to reduce it.


CHAPTER 4
THE COST OF TEACHERS: FACTS AND PROBLEMS
The cost of teachers is often considered to be "high" in
developing countries. But ithe adjective may mean several things. First, it
may mean only that teacher salaries represent a high proportion of recurrent
costs of education, whatever those costs may be. Second, it may mean that
the wage bill for teachers represents a sizable proportion of the total
recurrent budget and/or of GNP. Third, it may mean that individual teacher
salaries are considered high compared with other incomes.
These observations may be made from a static point of view (today,
in 1982, in country A, teachers' salaries are "high") or from a dynamic point
of view (teachers' salaries are getting higher or are getting "too high").
Before using economic analysis, we will look at what we know about the facts
of the case.
The Facts about Teacher Salaries in Developing Countries
Teacher Salaries as a Percentage of Current Expenditures
Table 4.1 based on Unesco data, shows us that teacher salaries
represent globally between two-thirds and three-fourths of total current
expenditures. If the percentage is lower in West Africa, it is because
scholarships also represent a sizable proportion of the total in secondary
and higher education. At the primary level, teachers salaries represent
usually more than 90% of the total. 1/
1/ The relatively low percentage for Asia is due to the presence ofoil-producing countries and of Bangladesh, where welfare services areimportant.
- 61 -

- 62 -
Table 4.1: PERCENTAGE OF TEACHERS' SALARIES INRECURRENT PUBLIC COSTS OF EDUCATION.AVERAGE BY REGION, 1978.
REGION/LEVEL ALL LEVELS PRIMARY
OECD countries 67.1 79.60Latin America 76.7 92.90Asia 69.4 82.60Africa 69.2 93.20West Africa 62.6 92.43East Africa 74.5 95.06"French" Africa a/ 63.6 92.69
Source: Unesco Statistical Yearbook 1981, Tables 4.2 and 4.4.
a/ "French" Africa is defined as sub-Saharan Africa (countrieswhich were colonized by France).

- 63 -
Although most of these data are not reliable if we want to draw
conclusions about one particular country (see Part I), they are clear enough
to allow us to conclude that in most countries the cost of primary education
can be lowered only through a reduction of the teacher wage bill and that, at
higher educational levels, this type of measure should also be very
effective. But are these costs "too high"?
Teacher Salaries as a Percentage of GNP per Capita
Because Unesco data concerning expenditures on teacher salaries in
secondary and higher educatLon are difficult to interpret, the case for
primary education will be used as an example. To have an idea of the
relative salary levels in various regions and in individual countries within
regions, average teacher sa:Laries will be computed by dividing total salary
expenditures by the number of primary school teachers, and the ratio of this
average primary school teacher's salary to GNP per capita will be used. 2/
Around 1978, the average ratio by region was the following:
OECD countries 2.5
Latin America 2.4
Asia 2.6
Africa 6.7
West Africa 10.8
East Africa 5.5
Francophone Africa 11.5
2/ If one wanted to compare teachers' salaries with the incomes of equallyqualified persons working in other sectors of the economy, it would bemore appropriate to use the average incomes of graduates of theappropriate level of education. But these data are available for onlysome of the developing countries.

- 64 -
The contrast is striking between Africa and the other two regions. In
Africa, the average primary teacher's salary is generally much higher than
the average income of other economically active people. In Latin America and
Asia, it is below that average income. Inside Africa, West Africa (and in
that region, the former French colonies) stands out--salaries are twice as
high in proportion to GNP per capita as in the rest of Africa and more than
four times as high as in the other regions.
But individual country data, although they must be interpreted
with great caution, seem to show important intraregional differences in the
absolute levels of average salaries as well as in their relative levels (see
Table A.3 of the Annex). What can economic analysis tell us about the
determinants of the price of teachers?
"Economic Analysis of the "Price" of Teachers
In a market economy, the price of a given good is supposed to
equal its marginal cost, given certain conditions. If that particular good
is used as a factor of production, it is supposed to be paid its marginal
value product. This price will be relatively high or low compared with the
price of other factors according to the relative scarcity of the given
factor. But teachers cannot be considered as commodities bought and sold in
perfect markets. Their marginal productivity is difficult to ascertain for
the following reasons.
o The products of their activity are multiform, partly
competing, and often difficult to value in money terms.
o They are not homogeneous units of one same factor.

- 65 -
The supply of education generally does not originate in competing
firms. In most countries education is largely controlled by the state, and
most schools are public schools. Teachers, at least in public schools, are
usually paid by the state or by local governments (which are usually
subsidized by the central government). But this does not mean that salaries
of teachers have nothing at all to do with productivity and with market
conditions. The state cannot set up pay scales for teachers without taking
into account economic condit:ions.
Salaries of teachers will depend on their relative scarcity, on
alternative employment opportunities, and on their bargaining power.
Relative scarcity depends orn the supply and demand of qualified manpower.
Other things being equal, when the number of graduates is low and the demand
is high, teacher salaries will be relatively high. This type of situation is
typical of the less advanced countries, which have to expand their school
systems at a fast rate but which have few qualified teachers available.
Alternative employment opportunities also have an influence on
supply and may reinforce the absolute scarcity of graduates. If graduates
may get better pay and generally better jobs elsewhere, they will not take
teaching positions. In developing countries, especially in Africa, the
majority of job openings for graduates are in the public sector, where wage
scales are often almost uniform from one service to the next. Nonwage
compensation (vacation, subs:Ldized lodging, and the like) will then be an
important choice variable.
But competition may also come from outside the country. Richer
neighboring countries may try to attract teachers by offering higher wages.
This is particularly true in Francophone Africa, where teaching is still

- 66 -
conducted in French in most cases and where the curriculum is still partly
inspired by the French model. This situation favors the mobility of teachers
and forces low-income countries to push the teacher wage scale above the
"normal" level to retain local graduates. For instance, the relatively high
salaries of primary school teachers in Upper Volta, Mali, and Niger can
partly be explained by the influence of demand on the part of the Ivory
Coast. But this problem is already much less acute in general because most
countries are already trying to protect themselves from cheap foreign labor
by closing their borders and because, in the case of the Ivory Coast, the
proportion of native teachers in primary education is already close to 100%
(99% in 1980).
Teachers' bargaining power is stronger when there is scarcity and
still more so when the bargaining is led collectively through a strong
union. Teacher unions are especially strong in West Africa. This may
account, at least in part, for the fact that, in several West African
countries, teachers earn more than other civil servants at the same level of
qualification.
Economic analysis may therefore help us understand why teacher
salaries are "high" and also why they are often not "too high" given the
circumstances. 3, But it may also help to understand better the effects of
changes in pay scales on the evolution of the wage bill and to devise an
economically optimal pay scale.
The optimal pay scale will be different according to the market
situation. If there is no shortage of teachers, pay scales should increase
with productivity. Assuming that productivity increases with experience,
3/ This of course does not detract from the fact that a government thathas to pay relatively high wages (in relation to national resources) mayhave more problems in financing its school system than others.

- 67 -
older teachers should earn more. And if the type of function relating
productivity with experience can be observed empirically, it is easy to set
up the optimal rate of increase. 4/ If there is a shortage of teachers in
some fields, it might be useful to introduce a "differentiated" salary scale
to attract new candidates in the fields where scarcity is really a problem.
But, of course, the psychologLcal consequences of such a differentiation must
be balanced against its advantages.
The future effects of changes in pay scales may be anticipated by
using simulation models. Thes;e models allow us to compare the effects on
total costs of various policiets and of various mixes. They illustrate the
fact that substantial savings may be obtained in the middle term by
marginally changing the pay scale. 5/ By applying economic analysis to the
existing data, what policy recommendations can we make?
Policy Recommendations
Two remarks are in order before even attempting to point out possible
ways to reduce the cost of teachers. First, the data show important
interregional and intraregional differences, and a closer look at individual
cases indicates that the relative importance of the various determinants
differ in each case. Therefore, no attempt should be made to recommend
uniform measures. There is no panacea for the ills of school systems; many
high-cost countries are not responsible for these costs and in some cases
could not lower them without endangering the future of education. Second,
economically sound measures cannot always be implemented because of
sociopolitical constraints. The economist can only point out the economic
4/ This problem is addressed in a 1982 simulation model for forecastingteachers' salaries prepared by Manuel Zymelman (World Bank, EducationDepartment).
5/ Many examples may be founcl in Zymelman's simulation model.

- 68 -
effects of a given policy to the decisionmaker, who should then decide
according to the broader context.
But, considering more specifically the context of sub-Saharan Africa,
what can we say about the relative cost effectiveness of various
cost-reducing measures? The objective is to reduce the total budgetary cost
of teachers. It may be reached in different ways.
Lowering Unit Costs
This is the most direct and obvious way to reach the objective, but it
can be considered legitimate only if teachers' salaries are considered as
"too high." As long as a country faces a situation of high relative
scarcity, and if that scarcity is not artificially created by restrictive
practices on the part of teachers, the only solution is to pay high wages and
to offer more openings in teacher training schools or their prerequisites
(e.g., secondary schools).
With smoothly functioning markets, this policy should lead to a
decrease in teachers' salaries within a few years. But in a situation where
salaries are determined for all public servants simultaneously, this eventual
future decrease will be much more difficult to implement. In most
Francophone West African countries this is the case. But the extremely high
level (in relative terms) of civil servants' salaries in that part of the
world is a fact that cannot be explained only by relative scarcity and
international supply and demand. It is, therefore, a major policy issue
which will have to be faced by governments.
A more feasible alternative would probably be to revise pay scales
of teachers to alleviate the future burden created by today's high
recruitment rates. But this policy would have no immediate effect on costs.
- 69 -
The only effective measures would seem to be authoritarian measures--wage
reductions, restrictions on imigrations, compulsory orientation of
students--which cannot be justified in general economic terms alone. But
another way to reduce the wage bill, or at least to reduce its rate of
growth, would be to hire less3 qualified persons.
Hiring Less Qualiied Teachers
Most West African countries have resorted to this practice,
although often mainly because qualified persons were not available.
The saving on the wage bill irom this practice may be quite important, as can
be seen in the examples given in Table 4.2.
By hiring only people from the least qualified category, these
countries may save from 40% to 75% of each individual starting salary, and
the saving would increase through time if the new recruits were to stay in
that category. The saving is still more important with temporary teachers,
whose use allows the ministry of education to reduce new hirings
considerably.
But effectiveness considerations have to be introduced here. If we
assume that there is at least some correspondence between the relative pay
scale of the different categories and their relative effectiveness as
teachers, we have to conclude that such cost-reducing measures, if pushed to
extremes, will also reduce the effectiveness of the schools.
The evidence on the determinants of teachers' effectiveness is not
clear, and a discussion of it is outside the scope of this report. But, on
the one hand, there is enough clear evidence about the low quality of schools
in most sub-Saharan African countries (and even about a decrease in quality
in the last decade) and also enough evidence about the low average
effectiveness of totally unqualified teachers for governments to avoid using
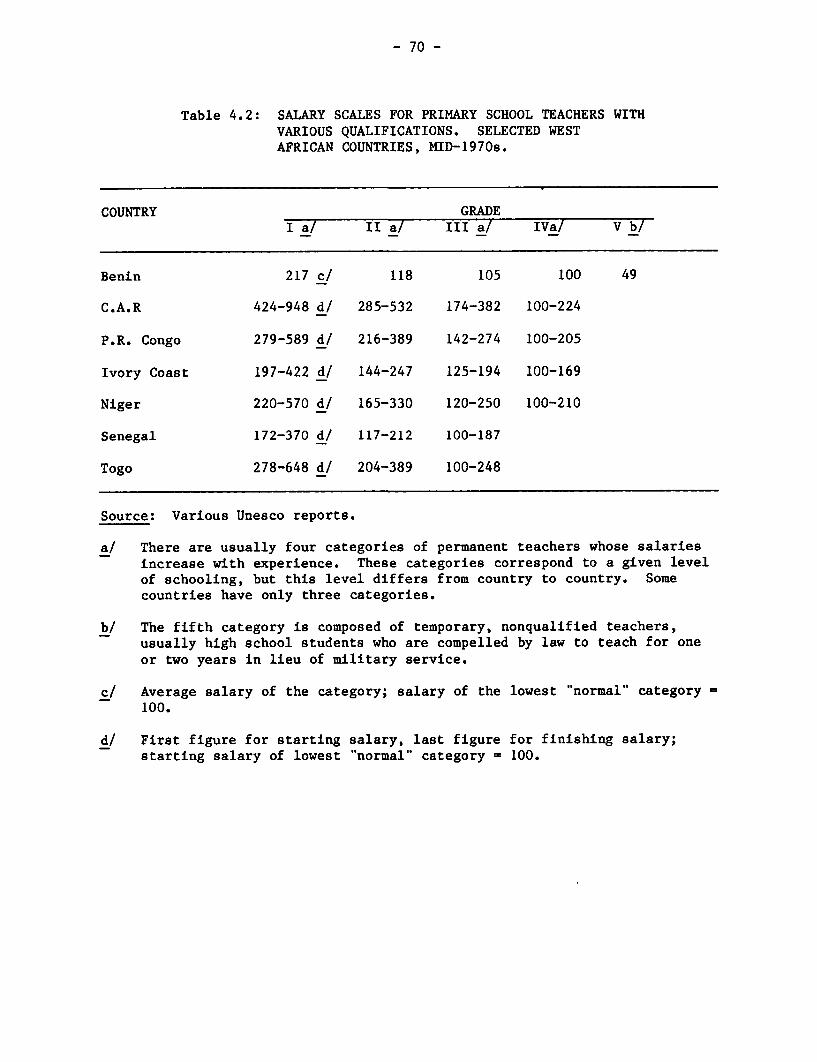
- 70 -
Table 4.2: SALARY SCALES FOR PRIMARY SCHOOL TEACHERS WITHVARIOUS QUALIFICATIONS. SELECTED WESTAFRICAN COUNTRIES, MID-1970s.
COUNTRY GRADEI a/ II a/ III a/ IVa/ V b/
Benin 217 c/ 118 105 100 49
C.A.R 424-948 d/ 285-532 174-382 100-224
P.R. Congo 279-589 d/ 216-389 142-274 100-205
Ivory Coast 197-422 d/ 144-247 125-194 100-169
Niger 220-570 d/ 165-330 120-250 100-210
Senegal 172-370 d/ 117-212 100-187
Togo 278-648 d/ 204-389 100-248
Source: Various Unesco reports.
a/ There are usually four categories of permanent teachers whose salariesincrease with experience. These categories correspond to a given levelof schooling, but this level differs from country to country. Somecountries have only three categories.
b/ The fifth category is composed of temporary, nonqualified teachers,usually high school students who are compelled by law to teach for oneor two years in lieu of military service.
c/ Average salary of the category; salary of the lowest "normal" category100.
d/ First figure for starting salary, last figure for finishing salary;starting salary of lowest "normal" category - 100.

- 71 -
this type of cost-reducing measure on a permanent basis. 6/ On the other
hand, it has been argued that the "highest-category" primary school teachers
are overqualified in terms of length and level of training, at least in some
countries in the region, and that the proportion of teachers of this category
could be lowered where it is high by appropriate personnel management (e.g.,
one qualified headmaster plus two or three auxiliary teachers per school).
But this type of measure can be applied only in countries where the
proportion of fully qualified teachers is high.
Two other cost-reducing measures may have much less unfavorable
influence on teachers' effectiveness: increasing teaching loads and
increasing average class size.
Increasing Teach:Lng Loads
To cover the who:Le curriculum, teachers have to be in contact with
students for so many hours. If the compulsory number of hours each student
has to teach is increased, f-ewer teachers will be needed for a given number
of schools and of classes. Because public school teachers are usually well
protected against being laid off, this type of measure will usually be more
effective when enrollment i£: increasing, since it will enable governments to
reduce the number of new teeLchers to be hired.
The feasibility of such a measure depends upon the initial
teaching load and upon the bargaining strength of unions. There is at least
one case where it was implemented in West Africa. This is in Benin, where
the teaching load of secondary school teachers was increased as part of a
6/ For evidence on the quality decrease, see Heyneman (1981 and 1983). Ofcourse, a progressive reduction in real wages may be obtained by raisingsalaries by a smaller percentage than the rise in the price level. Thiswould have no immediate effect on quality, but in the middle term itwould probably decrease it through mobility.

- 72 -
package of cost-reducing measures that succeeded in maintaining the cost per
student at a constant level in current prices after 1975.
Increasing Average Class Size
This type of measure has been advocated by some, based on two
arguments:
o Most studies show no significant influence of class size on
internal effectiveness, and some even show a positive
influence. 7/
o A moderate increase in class size would provide enough savings to
finance important quality improvements. 8/
But a closer look at the data shows several things. First, all
these studies were made in fairly developed countries, and very few
observations concern classes of 50 pupils or more. But, if we look at the
situation in primary education in West Africa, for instance, we observe that
eight out of the twenty-two countries of the region for which data were
available had an average class size of 50 or above in 1978. (See Table A.4
in the Annex). And it is well known that most urban classrooms are
overcrowded, even in countries where the average is below that level. For
instance, in Senegal in 1980-81, 1,463 classes out of 7,921 (18.5%) had more
than 70 pupils, and numerous cases of classes with more than 90 pupils (with
a maximum of over 150) are cited. At the same time, 380 classes (4.8%) had
10 pupils or less.
7/ For a survey of the evidence, see Haddad (1978)
8/ See the (cross-sectional) results for Chile (a 15% increase in class sizewould be associated with an annual savings equivalent to 5% of the annualbudget in 1970) in Schiefelbein and Farrell (1974).

- 73 -
Second, class size seems to be fairly important in the first grades
of primary education but not afterward. 9/ In sub-Saharan Africa, and
especially in Francophone countries, repetition rates and dropout rates are
generally high, and teachers often prefer to teach in the upper grades. The
result is that the average number of pupils per classroom is much higher in
the first grades than in the following ones. For instance, in Mali in
1978-79/ the situation was the following for grades in public primary schools:
Pupils per class
1st grade 62
2nd grade 54
3rd grade 49
4th grade 41
5th grade 36
6th grade 30
In Senegal in 1980-81, 1,041 out of the 1,463 classes with more than 70
pupils per class were in the three first grades.
This evidence shows that, at least in the first grades of primary
education, the pupil-teacher ratio is already very high, that a decrease of
that ratio would probably improve internal efficiency, and that an increase
in it would probably still worsen the present unsatisfactory state of
things. Furthermore, it may be physically impossible to put more pupils in
already overcrowded classrooms. If one had to build new and larger
classrooms to accommodate the larger groups, the result would probably be
highly cost ineffective. But the introduction of double-shift scheduling
91 See Balow (1969).

- 74 -
where it does not yet exist could probably help solve this problem if
teachers were trained for multigrade teaching.
Increasing the pupil-teacher ratio might be more effective in
secondary and higher education, but the evidence from West Africa shows more
cases of overcrowding than of undercrowding, which leads us to believe that
such a cost-reducing meausure can be cost effective only in a very few
cases. To reduce the cost of teachers, another type of measure is
theoretically possible: to modify the production function of education in
such a way that it becomes less labor intensive.
Replacing Teachers by Other Factors of Production
The so-called communication revolution has raised high hopes in
education. For centuries the education production function had been highly
labor intensive. Knowledge and know-how were transmitted by a teacher to a
group of pupils through face-to-face contact. But, because teachers are
usually part of the highly qualified manpower, they constitute a scarce
resource and are therefore rather expensive. As soon as distance
communication became easy, projects to replace face-to-face teaching by
transmission through the media of the "educational message" were studied and
implemented.
So great was the belief in the high cost effectiveness of distance
teaching compared with traditional schooling that, at first, no evaluation
was deemed necessary. But the heavy investments involved in this type of
project made financiers, in particular donor agencies, more cautious. As a
consequence, cost-benefit and cost-effectiveness studies of all the main

- 75 -
projects were undertaken. The amount of evidence is now sufficient to draw
certain tentative conclusions. 10/
o The use of new educational media (radio, television, computers,
etc.) in regular schools is generally not cost effective, at least
at the primary level. It has not been used to change the normal
pupil-teacher ratio and therefore adds to the cost and does not
significantly improve effectiveness except in a few, especially and
carefully designed projects at the secondary level.
O Distance teaching through the media does not altogether dispense
with teachers. Only when the project is well designed and caters
to an extremely motivated group is it cost effective.
O Basic education cannot be effective without important face-to-face
contacts with a teacher. Teachers do have to be specially trained
to make effective use of the new techniques. It is therefore
illusory to believe that the total cost of primary education could
be lowered by distance techniques alone.
o Distance teaching might be the only way to reach certain groups who
do not frequent regular schools (for instance, the children of
nomadic groups living in thinly populated areas). It might be more
cost effective than trying to set up regular schools for those
groups, but it wiLl be more expensive than the average regular
school.
10/ We are giving here only an extremely brief summary of the mainconclusions of a comprehensive survey of the evidence. For more details,we refer the reader to Eicher and others (1982).

- 76 -
o "Little media" are more cost effective than "big media" 11/
although the microcomputer may change this situation in the future.
O Modern technology cannot be effective in education if a minimum
number of qualified technicians is not present to maintain the
equipment, and this minimum number is not always available in
developing countries.
In conclusion, poor countries will find it difficult in many cases
to lower the cost of teachers, and they should resist using cost-reducing
measures of the type most likely to reduce the quality of teaching.
But, because teachers represent by far the largest part of total
education cost, especially in primary education, even marginal changes may be
quite effective. Ingenuity will have to be applied to find the optimal mix
of cost-reducing measures, and a strong political will be needed to make the
common good prevail. In some countries, the potential cost saving is more
than marginal. But these savings should in many cases be transferred to the
"other current expenditures" line of the budget, since quantity and quality
of the teaching aids is often dramatically low.
11/ These terms were coined by W. Schramm. "Little" media like radio arethose which do not necessitate heavy investment. Opposed to these arethe "big" media like television. See Schramm (1977).

CHAPTER 5
COST EFFECTIVENESS OF QUALITY-IMPROVEMENT MEASURES
Although most developing countries face severe financial
constraints and are looking for cost-reducing policies in education, they are
aware of the relatively low quality of their schools and that some
cost-saving measures may push this quality still further down. Yet they
might be willing to improve the quality of education if it could be proved to
them that some measures are both inexpensive to implement and very effective.
After a brief survey of the different factors contributing to
quality (or the lack of it) of schools, the facts will be examined to
ascertain whether, and to what extent, there is an urgent quality problem in
some or more countries. Then the chapter will concentrate on the analysis of
the relationship betwen student achievement and school characteristics before
attempting to draw some pol:Lcy conclusions.
Determinants of School "Quality"
In any productive process, the quality of the output depends upon
that of the inputs. The "ouitput" of schools is students. The students as
outputs differ from the students who entered the schools as "inputs" by what
"value" was "added" to them., This value has many dimensions whose relative
importance will vary according to the hierarchy of social objectives given to
the schools and according tc, the relative efficiency the schools manifest in
the pursuit of each objective.
Because it is not our purpose to make a choice among various
philosophies of education, and inasmuch as the amount of new knowledge the
pupils have acquired in the various fields of the curriculum is always
- 77 -
- 78 -
considered and important dimension of the "output," we shall satisfy
ourselves with such a unidimensional measure. 1/
The main inputs to be considered are:
o Teachers
o Classroom resources
o School plant
o School management.
These inputs are complementary, but that does not mean that the relative
effect of improving their respective quality may not be different. They
should therefore be considered separately. 2/
Evidence on School Quality in Developing Countries
Quality may be observed by using monetary indices, such as
expenditure per student, or physical indices, such as number of square meters
per student, quantity of various resource (books, desks, maps) per student or
per classroom, student-teacher ratio, number of students per classroom, and
so on.
1/ This is not to say that a homogeneous conceptual framework is notessential to a proper analysis of production functions. But, if one canagree with H. Levin (1980) that there is a conspicuous absence of such aframework in most empirical work in this field, one also may agree thatthere are good reasons for it, with the underlying complexity of thephenomenon as the main one. As shall be seen later, the relevance ofwhat is learned is still more important than the amount of knowledgeacquired.
2/ A more rigorous analysis would further subdivide these inputs. It wouldespecially distinguish at least three determinants of teacher quality:capacity (of which level of qualification is only one dimension),effort, and time. These issues are important, and Levin is right topoint them out and to start analyzing them (Levin 1980, pp. 207-85).But in this paper we are concentrating on what is generally accepted, atthe risk of being often hopelessly superficial.

- 79 -
Monetary Indices
These are generally very unreliable (as was shown in Part I) when
they are drawn from macro statistics. This is mainly because current
expenditures other than salaries are not always registered in detail in
central budgets, they are often incurred at the regional level and are not
always included in national data, and a sizable part of them are financed by
local communities and by the families of the pupils. Specific surveys would
be necessary to bring out the complete picture, but very few are available.
The contributions by village communities and by parents will be examined more
fully in Part III. Here, we will only briefly comment on what can be gotten
from the existing monetary indices about the quality of three of the four
main inputs.
Teachers. As was seen in Chapter 4, absolute salaries cannot be
used as an index of quality because they are strongly correlated with the
level of national income. Teachers' salaries as a percentage of GNP are a
little better indicator, but they are partly determined by supply and demand
factors and by the institutional background. For instance, when one looks at
teachers' qualifications one cannot interpret the relatively high salaries of
primary school teachers in Francophone Africa as reflecting only their
relatively high quality (compared with teachers in other regions.) The data
presented in Chapter 4 therefore have to be interpreted with care.
Classroom resources. The amount spent on school supplies and light
equipment is poorly recorded Ln national data. But evidence from a few
special surveys 3/ confirms that in most low-income countries the amount
3/ Heyneman has given evidence on four developing countries (Bolivia, ElSalvador, Indonesia, and Malawi) in recent World Bank reports; seeHeyneman (1983).

- 80 -
spent per pupil in primary schools is below US$2 per year. There is also
evidence that this amount has had a tendency to decline in many countries in
the last ten to fifteen years. For instance, in Mali the official budgetary
data showed a budgeted expenditure of 285 million CFAF in 1966 for scholastic
supplies at the primary level. In 1972 that figure had gone down to 190
million CFAF and in 1976 to 120 million CFAF.
Buildings. There are unfortunately no comparative figures on cost
per square meter in different countries; even if there were, these data would
have to be deflated by the price level. But data available in a few
countries on differences in cost per classroom according to the type of
construction and the region may be of some interest.
From the above, one must therefore conclude that monetary indices
are on the whole of little value for comparative analyses.
Physical Indices
There are no general physical indices available except in a very
few countries. But local surveys show that:
o In many developing countries, the quality of school buildings is so
low that it often impedes the learning process, especially at the
primary level, because "wind and rain disrupt classroom activity as
a matter of course" (Heyneman 1981).
o The quantity and quality of furniture and supplies is generally
insufficient--only in rare cases does one find one textbook per
pupil in primary educaton; many schools do not offer enough seats
and desks; teacher aids are often hopelessly inadequate.
O The proportion of unqualified teachers is often very high (see
Chapter 4). Table A.5 in the Annex summarizes the information

- 81 -
available for West African countries. It shows that the situation
is generally not ~very promising except in the Ivory Coast and, to
some extent, in Senegal.
The Relation between School Characteristics and Student Achievement
Does the quality of school inputs have a significant influence on
the educational achievement of students? If so, what are the input
improvements which are the smost cost effective? Is there a possibility of
improving attainments significantly while staying within very strict
budgetary constraints?
The Overall View
A tremendous amount of research has been directed in the last
fifteen years or so toward answering this question. The evidence which was
gathered during the late 1960s and the early 1970s seemed to point
overwhelmingly in the same direction and to warrant pessimistic conclusions.
Not only did it appear that school resources (as measured by per pupil
expenditures and level of teacher training) did not seem to have any
significant effect on student scholastic achievement, but quality
improvements also seemed to benefit more socially privileged students than
their less affluent comrades., 4/ But these conclusions have been challenged
in the last five or six yearsi.
4/ The most influential studies in this field were the Coleman report(1966), the Plowden report (Central Advisory Council for Education1967), and Jencks' book on inequality (1972). But many other morelimited surveys seemed to point in the same direction.
- 82 -
First, studies using a broad array of school quality variables tend
to show that schools do affect educational outcomes 5/ and that they may
benefit more underprivileged children. But the studies also show that
expenditures and teacher certification are not the most significant
variables--educational climate and school organization are often more
effective. Second, analyses of data concerning developing countries tend to
show that school variables are much more important as predictors of
educational outcome in poor rather than in rich countries, although the
variables which have the strongest effect differ from one country to another
and according to the outcome observed.
For instance, a comparative study made by Heyneman and Loxley
(1983a; 1983b) of the situation in twenty-nine countries gives the following
results:
o The proportion of explained variance in academic achievement that
is attributed to variables of school and teacher quality in a
model--including preschool influences (age, sex, and socioeconomic
status) and school variables (program, teacher, quality of school
and of teachers measured by various indices)--is on average 66% in
the fifteen developing countries included in the survey (Argentina,
Bolivia, Botswana, Brazil, Chile, Columbia, Egypt, El Salvador,
India, Iran, Mexico, Paraguay, Peru, Thailand, Uganda). In the
5/ For a survey of recent research in the United States, see Dougherty(1981). For sub-Saharan Africa, a survey giving more mixed evidence canbe found in Assie (1982).

- 83 -
remaining fourteen developed countries, this percentage is only
35%.
o Preschool variableis (which were introduced first in the regression)
accounted for 56% of the explained variance in developed countries
but for only 33% in developing countries.
O There is a highly significant negative correlation between the
influence of school and teacher quality variables on educational
achievement and level of per capita GNP (r = -.72; p < .001), which
suggests that "the poorer the country, the greater the impact of
school and teacher quality on science achievement" (Heyneman and
Loxley, 1983a, p. [9)
But, before drawing definite conclusions from this study, one should note the
following.
First, the authors have gathered all the comparable data sets
available. But other studies show a contrasting picture, especially
concerning the differential effect of schools on pupils of different social
origins (Assie 1982).
Second, the authors themselves admit that, although they consider
that they have improved upon past studies, there are still methodological
problems which may reduce the validity of the results.
Third, total variance explained is in many cases quite low (for
developing countries, it is below 20% in five cases, between 20% and 30% in
five other cases, and is nowhere above 40%), which means that the proportion
of total variance explained by school and teacher quality is not above 20% in

- 84 -
eleven cases out of fourteen and is around 25% in the other three. All in
all, on average the percentage of total variance explained by school and
teacher quality variables is not very different in the two groups of
countries (the median is 15% in the developing group and 11.5% in the
developed group).
Fourth, among the developing countries included in the sample, the
correlation between the level of GNP per capita and the proportion of
explained variance attributable to school quality variables is weak.
Fifth, and most important, the achievement tests used to represent
quality of schools and teachers and which qualified for the final regressions
vary from country to country.
This procedure raises several serious questions.
O For each country in the sample, quality variables are introduced
and observed as a block. On the one hand, this prevents showing
the relative importance of equipment vs. teacher quality. 6/ On
the other hand, the original variables selected to represent
teacher quality are so heterogeneous that it is sometimes difficult
to see the rationale behind the choice. For instance, why select
indices of social origin and of standard of living to characterize
teacher quality in some cases and not in others? Obviously, there
is a different theory of the educational process implicit in each
choice, and the term "quality" does not always mean the same
things.
6/ Further analysis of the data could, of course, bring this out.

- 85 -
o From a comparative point of view, the procedure for selecting the
variables used in the final regression lowers the comparability of
the results; some variables disappear in some countries' equations,
others in other equations, so that we are left with different
indices of quality in different countries. For instance, in the
eighteen-country International Association for the Evaluation of
Educational Achievement (IEA) Science Survey, no single objective
index of teacher quality is present in the final regression for
more than six countries. "Subjective" indices trying to represent
teachers' attitudes toward their work are a little more
homogeneous, but the same index is never present for more than
seven countries. In many cases, only two or three countries share
the same index. As a result, detailed cross-sectional analysis is
most of the time impossible. This is a pity because comparisons
between the relative effectiveness of various quality improvement
measures are made hazardous.
In spite of their scientific quality, these comparative studies
therefore leave us with two questions. First, they give strong evidence in
favor of relatively stronger influence of school variables (and,
correlatively, of a relatively weaker influence of preschool variables,
especially home background) in developing countries. But they evidently do
not explain why this happens. In other words, the first question is: Are
there any logical reasons to expect such a difference?

- 86 -
Heyneman and Loxley (1983a, pp. 14-18) do not find any convincing
evidence pointing toward a lack of variance in socioeconomic status of
students in low-income countries, toward a high preselectivity of pupils with
low socioeconomic status, or toward a high correlation between social origin
of the students and "quality" of the school. They conclude that the
explanation of the relative lack of influence of family background variables
on achievement in low-income countries may therefore be found in "a more
uniform aspiration among high- and low-income families to utilize education
for social mobility" (p. 21).
This hypothesis sounds plausible, but no direct evidence is given
to sustain it (perhaps because the evidence on social selectivity of schools,
at least in Africa, is too mixed to warrant definite conclusions; see Assie
1982). The two results which look fairly well established--that school
quality variables have a relatively stronger influence than preschool
variables on school achievement, on the one hand, and that in most developing
countries there is a much better chance for children of socially privileged
groups to stay in school, on the other hand--are fairly difficult to
reconcile. Two conclusions then seem warranted: that stronger theoretical
bases are now needed if we want to understand better the determinants of
educational outcomes, and that developing regions are too different from one
another for conclusions lumping them all together to be very useful.
The second question we are left with is one which concerns us more
directly here. Granting that school and teacher quality variables do

- 87 -
generally have more influence on educational outcomes in poor countries,
which are the quality-improvement measures that are both cost effective and
inexpensive enough not to be barred by budget constraints?
Evidence on Relative Cost and Cost Effectiveness of Different
Inputs and Its Interpretation
The evidence to be gathered from available studies is scant and
often unreliable, for three reasons. First, cross-sectional analysis cannot
go very,far into detail in the analysis of the influence of a specific input
because, as we have seen, the different studies which are being compared were
not designed in the same way. One therefore has to fall back on broad
aggregates, such as teacher quality, which are made up by putting together
what are in fact different variables (teacher salary in country A, teacher
educational level in country B, teacher certification level in country C,
teacher attitude toward work in country D, and so on).
Second, even analysis at the country level is difficult because
most studies were not designe,1 to give cost-effectiveness information.
Quality variables most of the time either are not measured in units which can
be costed (for instance, it is asked whether the Parent-Teacher Association,
or PTA, is active, and not how much money it spends on school; whether the
school gives free materials to students, and are not what amount) or are not
susceptible at all to cost measurements (attitude variables, for instance).
Third, cross-sectional analysis always leaves the suspicion that
"all other things" are not really being equal, and the inequality may explain
at least part of the observed differences in achievement.

- 88 -
In spite of these severe shortcomings, existing studies do give us
a certain amount of information. But there is room for more and
better-tailored research in this area.
Evidence from Existing Research
This section will examine existing research findings on student
achievement and three main education inputs: teachers, physical facilities,
and school management.
Teachers. Several points are apparent from available research.
o Level of education of teachers does not seem to have a powerful
effect on student achievement. This effect is generally positive but small
(and often not significant in the regressions) at the primary level, but it
disappears or becomes negative at the secondary level. 7/ But one must note
that only one study concerns sub-Saharan Africa and none West Africa. One
significant result of the study on Uganda (Heyneman 1976), however, is that
the only characteristic of primary school teachers which was found to be
significantly related to student achievement was "English language
competence." This aspect of teacher training is essential in all those
countries where the language used in the school is not the language used in
the home and concerns, therefore, most of sub-Saharan Africa. More than the
level of general education, ability to teach in the language used in the
school system should be emphasized in recruitment.
7/ Schiefelbein and Farrel (1974); Loxley and Heyneman (1981); for a moregeneral survey of the evidence, see Avalos and Haddad 1979.

- 89 -
o It is difficult to disentangle level of teacher education,
certification, and training. Therefore, it is also difficult to decide which
characteristic is more important for policy emphasis.
o Attitudinal variables (and, more generally, teacher characteristics
which cannot be easily manipulated by policy) seem to be more important than
level of teacher education and/or of training.
On the whole, it seems safe to draw three conclusions from the
existing research on teachers. First, education and/or training above a
minimum level generally considered as indispensable to teach properly does
not seem to improve educational outcomes significantly. Second, research
design in this field has progressed a great deal in the last ten years, but
few of the available sample surveys made in developing countries have been
properly designed to give reliable answers to the questions raised above.
(Because local conditions differ widely from country to country and from
region to region, no general conclusion should be drawn from existing
evidence, and new research should be encouraged in countries where reforms
are envisaged. Third, teachers do not teach in a vacuum. Their
effectiveness depends partly upon the quantity and the quality of the
teaching aids at their disposal and upon the size and the quality of the
school building.
Physical facilities. Keeping in mind the caveats expressed above
about the possibility of drawing general conclusions from the comparison of
studies which do not include the same variables and were not designed in the
same way, some tentative conclusions may be presented.

- 90 -
o When school quality variables are entered as a block in
regressions, their combined effect is always positive and statistically
significant and is most of the time the principal determinant of explained
variance of educational achievement.
o Several recent studies seem to bring evidence in favor of a
stronger influence of school quality variables on educational achievement of
children from a disadvantaged home environment. 8/ This evidence is still
too fragmentary, and it comes from studies which were not designed to test
this specific relation, so that the question is still open. But at least it
is contrary to the idea that privileged children benefit more from quality
improvements than do their more disadvantaged schoolmates, and this in itself
is worth noting.
Although the evidence is often difficult to interpret, 9/ three
conclusions seem to emerge from the analysis of the influence of specific
8/ See Birdsall (1982a) on Brazil; Heyneman, Jamison and Montenegro(forthcoming) on the Philippines; Loxley (1983) on Egypt. For moreambiguous results, see Heyneman and Jamison (1980) on Uganda;Schiefelbein and Farrell (1974); Loxley and Heyneman on El Salvador(1981); Prewitt (1974) on Kenya.
9/ Loxley and Heyneman (1981) provide a good example of a "paradoxical"result concerning two-seat desks in El Salvador.

- 91 -
items. First, class size, up to a certain level, has no significant effect
(and sometimes even a negative effect) on student achievement. 10/
Second, the item which comes out consistently with the strongest
positive effect is books. School library size, library use, and number of
books in the home are always positively correlated with achievement, but
availability of textbooks is unquestionably the single most effective quality
item. 11/ It is almost impossible to use existing data to make
cost-effectiveness comparisons. But the little we have seems to point toward
higher cost-effectiveness for textbooks than for any other school facility.
For instance, in El Salvador it appears that an increase in expenditure on
textbooks of 1.5 colones ($0.6) per pupil is linked with an increase in
achievement of 1 point (the mean score being 50). The same difference in
achievement is linked with a difference of 0.26 years of teacher education.
Although no direct monetary measure of this last item is available, it is
clear that it amounts to much more than 1.5 colones per pupil. 12/ Studies
10/ For a more thorough discussion, see Chapter 4. Schiefelbein and Farrell(1974) discuss the ambiguity of this concept.
11/ For a synopsis of the literature on the influence of reading material onstudent outcomes in low-income countries, see Heyneman (1981).
12/ Of course, these conclusions have to be interpreted with the utmostcaution. First, they are valid only if we feel allowed to use directlythe absolute value of the beta coefficient for each variable, and in anycase they only show that given differences in inputs between schools areassociated with given differences in outcomes--not that a given increasein one input in one school would result in the same given outcome.

- 92 -
on textbook production, however, show that, given certain conditions, the
cost of improvement can be assumed directly by poor countries at a low cost
per student. 13/
Third, new educational media (radio, television, computers, and the
like) are sometimes very effective but never cost effective in the context of
the traditional school. Their extensive use can therefore be envisaged only
as part of a sweeping educational reform or in out-of-school education
programs. 14/ Whatever the possible conclusions for individual inputs, one
should not forget to look at the way in which the various school inputs are
combined.
School management. In a firm, productivity depends not only on
the quality of the various inputs but also on the way in which they are
combined and, more generally, on the quality of management. Schools are like
firms in that they have to combine various inputs to produce education.
o Concretely, one should expect the quality of education provided in
a given school to be affected by the ability of the school principal to raise
local resources (when he or she is free to do so) and to use them for
improving the quality of physical facilities by his (or her) ability to
organize the time schedule of the various streams, to develop the enthusiasm
of teachers and of students, and so on.
13/ For a persuasive presentation of this question, see Neumann (1980).
14/ References to extensive studies are given above in Chapter 4.

- 93 -
o A few recent studies of the determinants of student achievement
include items concerning various aspects of school management and/or various
characteristics of school principals. Although the conclusions one may draw
from them are still very tentative, it appears that management is important
and that the role of the principal may be decisive if he or she is given good
training and sufficient autonomy. 15/
Three conclusions therefore seem to be allowed by this review of
the existing evidence. First, although the optimal input mix strongly
depends upon the local situation, in all cases where there is a shortage of
textbooks, improving their availability and their relevance is almost
certainly the most cost-effective quality improvement measure and a
relatively cheap one if textbook production and diffusion are carefully
designed.
Second, teacher characteristics do not seem to be very important,
other things being equal, as long as teachers have a minimum of education and
of training. Furthermore, those characteristics which seem to be the most
effective (home environment, attitude towards students, attitude toward work,
etc.) are not those which can beaffected by policy.
15/ The clearest case seems to be that of Indonesia, where about half of theinfluence of school and teacher quality on student achievement in the12th grade seems to be attributable to the level of the principal'ssalary (1982 World Bank data on Indonesia compiled by S. Heyneman,Education Department). Preliminary results of a study of achievement inthe 6th grade in Peru (1982 World Bank data compiled by A. M. Arriagada,Education Department) go in the same direction. School variablesaccount for more than half of explained variance in reading and inscience, and around half (46% in reading, 57% in science) of thisinfluence is due to management.

- 94 -
Third, management of the school is an important variable.
Improvement of management through better training and higher salaries of
principals appears to be relatively cheap and cost effective. But these
conclusions need to be strengthened and complemented through further and
better-adapted research.
Proposals for Further Research
As already stated above, more studies should be undertaken before
several key questions about the cost effectivenss of various school inputs
can be answered with a reasonable degree of certainty. But to be more
effective, future studies should go in three directions.
O First, although each individual study has to be designed according
to the local situation to be explored, they all should attempt to
include (and to define in the same way) the same key variables.
For instance, they should all include the level of education of the
teachers, measured in the same way; they should all include a
question on the availability of textbooks; they should all include
questions about the level of training of the school principal.
O Second, all education projects sponsored by the World Bank which
aim to improve school facilities should include an evaluation of
the impact of these improved facilities on student achievement.16/
More attention than in the past should be given by Bank staff
members to the design and the execution of such research studies.
16/ That this is not yet the case is shown by the fact that, in West Africafor example, out of half a dozen projects of this type only one (in theCentral African Republic) specifically mentions such an evaluation.

- 95 -
o Third, to strengthen the tentative conclusions drawn from
cross-sectional analysis, more longitudinal studies observing the
effects of innovations in given schools should be undertaken.

CHAPTER 6
THE TREND IN UNIT COSTS
One of the most salient characteristics of modern economic growth
since the beginning of the nineteenth century is the almost universal
increase in the size of producing units. Economic theory teaches us that
this phenomenon was caused by the fact that technical progress was mostly
labor saving, so that firms reaped "economies of scale" by growing up.
One could be tempted to draw a parallel between industrial growth
and the rapid expansion of school systems in developing countries and to
predict that unit costs of education should go down as long as this expansion
is not over. But this tendency for unit costs to decrease as productive
capacity increases has its limits and its constraints. The evidence
therefore has not only to be examined with a critical eye but must be
interpreted and supplemented by the use of pertinent economic analysis.
The Statistical Evidence: A Critical View
Economies of scale are usually observed through the behavior of
unit costs when the level of production changes. But education is a peculiar
industry, and its study needs special statistical indices.
What Kind of Statistics Are Needed?
In a firm, unit cost generally means cost per unit of output. But
schools do not turn out units of material goods. They perform various
services which, as we have already recalled, are partly competitive. It
would therefore be hopeless to try to define in a nonarbitrary way the output
of education and to attempt to measure it in a unique way.
- 97 -
- 98 -
An analysis of the objectives pursued by schools may, however,
avoid this apparent dead end. Schools, as a matter of fact, are always (and
essentialy, at least at levels below higher education) meant to have students
and to offer them certain services. Rates of enrollment are universally used
as indices of the level of "production" of the school systems. To be able to
provide classroom space to all the children reaching school age is a goal of
all countries.
The student is therefore the most relevant unit to use when
measuring unit costs of education. To observe decreasing cost per student as
the number of students increases means that it will be easier and easier to
reach a given educational target as that target becomes closer. Total cost
per student is apparently the best index to use because it gives an
evaluation of the amount spent. But recurrent cost per student may also be
useful to observe--especially in developing countries, which usually can more
easily find outside sources to finance investments than to cover day-to-day
expenditures of schools.
But, as we have seen in Chapter 3, budget constraints tend to make
governments reason in terms of the maximum "effort" they can afford. The
essential question for them is therefore whether the effort they make to
bring another child to school may be expected to decrease in the future.
This effort is usually measured by dividing unit cost by per capita GNP. But
we want to compare unit cost at various levels of output. In the case of
education, the obvious variable to examine is the number of students
enrolled, and it might also be interesting to use a relative rather than an
absolute figure. The rate of enrollment would then be chosen.

- 99 -
The comparisons should logically be made for the same country
through time. But time series are often difficult to get for a long time
span. Cross-sectional analysis may be used if there are enough good reasons
to assume that the differences in unit costs between countries at a given
point in time are mainly due to the differences in the level of "output."
But, as we have seen, cost per student to the state depends upon
the institutional setting. The use of the ratio of unit cost to per capita
GNP eliminates most of the influence of the level of development but does not
account for this factor. This is why we feel that comparisons should be made
only between countries belonging to the same "region" -- that is, to a group
of countries sharing certain institutional characteristics.
A Survey of Statistical Evidence
Cost per student varies with the level of education one considers.
Average cost for all levels depends upon the enrollment pyramid. It is
therefore more useful to exam:Lne unit costs at each level. For reasons
already mentioned, we shall limit ourselves to higher education and to
primary education.
Time series and higher education. In a study made in 1980, G.
Psacharopoulos presented evidence which led him to conclude: "In spite of
cost fluctuations in the case of a few countries, the clear picture that
emerges is that of a falling cost per student in constant prices"
(Psacharopoulos 1980, p. 29). A closer look at the evidence he presents, as
well as the observation of other data, challenges that conclusion.

- 100 -
o Of the seven developing countries for which Psacharopoulos gives
data, three (Egypt, Thailand, Mexico) do not exhibit falling costs per
student in constant terms, and one of those three (Mexico) shows sharply
rising costs when one extends the series from 1975 to 1978. Another country
(Pakistan) should not exhibit falling costs but slightly rising ones,
according to Table B.8 in Psacharopoulos's Annex. The data for two other
countries (Ghana and Zambia) do not seem to coincide with the reference;
Unesco data show a stabilization since 1970 (Ghana) or marked increase
between 1975 and 1978 (Zambia). The series for the only developed country
(France) starts in 1964, the year when cost per student reached a historical
peak. A longer series starting in 1952 shows the real unit cost index to
rise from 28 to 100 between 1952 and 1964, at a time when enrollment was
increasing very fast, before falling back to 69 in 1978.
o Data for developed countries in 1970 and 1978 show quite a mixed
picture, as can be seen in Table 6.1. Between 1970 and 1978, six of eleven
countries exhibit a (more of less marked) downward trend, three an upward
trend, and two no marked trend. But the trend before 1975 is clearly upward,
since only two countries (France and Norway) show decreasing costs, and it is
reversed in the second part of the 1980s (only one country, France, shows a
slight upward trend). We have here the first indication of possible changes
in policy as the main determinant of cost per student. 1/
1/ A comparison of the average amount spent per student as a percentage ofGNP per capita made by M. Zymelman (1982 World Bank data, EducationDepartment) tends to confirm this change of policy; it shows that thisindex of effort has gone down between the early and late 1970s.

- iO -
0 Data for various countries situated in sub-Saharan Africa show no
uniform pattern for higher education, as can be seen in Table A.6 of the
Annex. But one can see that there is a jump in unit cost when a national
university is created where only scattered higher education streams existed
before. After a university lias been created, the trend is apparently
downward.
Table 6.1: EVOLUT]:ON OF EXPENDITURES FOR HIGHER EDUCATIONPER STUDENT IN 1978 PR]:CES. SELECTED DEVELOPED COUNTRIES, 1970-78.
a/YEAR TREND
COUNTRY 1970 1975 1978 1970-75 1975-78 1970-78
Belgium 105,572 154,208 151,220 + = +
Denmark 35,818 36,720 28,670 + - -
France 10,680 8,078 8,910 - + -
Italy 824,362 1,067,826 842,400 - +
Netherlands 12,320 17,718 17,350 + = +
New Zealand 12,320 2,470 2,340 + - +
Norway 23,031 21,530 20,690 - - -
Sweden 16,716 19,638 15,910 +
Switzerland 14,209 16,350 11,210 + - -
U.K. 2,592 2,656 1,890 = - -
U.S.A. 3,259 3,191 2,930 =-
Note: All figures in units of local currency.
Sources: Total expenditures in current money and enrollments:Unesco Statistical Yearbook 1981, Tables 4.3 and 3.11.Price indices: United Nations Statistical Yearbook 1979/1980,Table 168.
a/ Trends: + (increase of more than 3%)- (decrease of more than 3%)= (chanze less than 3%).

- 102 -
Time series and primary education. The dominant tendency between 1970
and 1978 in sub-Saharan Africa is upward, as shown in Table A.7 of the
Annex. The evidence from time series is therefore not clear. If anything,
it points rather toward rising unit costs, at least until the budgetary
squeeze of the middle 1970s.
Cross-sectional evidence and higher education. G. Psacharopoulos
gives evidence for fifty-eight non-oil-producing developing countries as well
as for eighteen developed countries and seven oil-producing countries around
1975 (Psacharopoulos 1980, Section IV).
Three conclusions may be drawn from these data. First, there seems
to be a clear negative relationship between the cost per student and
enrollment in higher education and a still clearer one between what
Psacharopoulos calls the "real" cost per student (cost per student divided by
per capita income) and the enrollment rate. Second, the shape of the
function seems to be hyperbolic, thereby implying a sharp decrease of cost
per student when enrollment starts rising and fewer gains thereafter (when
enrollment ratios go above 5%). Third, the scatter diagrams also show
extraordinary differences in cost per student among poor countries with a
very low enrollment rate in higher education.
- 103 -
These findings, therefore, seem to point to the possible existence
of economies of scale. The fact that they conflict with time series,
however, must make one very careful in drawing conclusions from them. As
shall be seen below, economic analysis should be pursued further, and better
data gathered, before asserting the existence of economies of scale.
Nevertheless, the cross-country differences in costs, given the level of
enrollment, provide further proof of the importance of the policy variable.
Cross-sectional evidence and primary education. A simple linear
correlation model applied to sub-Saharan Africa using "real" cost (defined by
G. Psacharopoulos as the dependent variable and net enrollment ratios) as the
independent variable shows a highly significant negative correlation between
the two variables. The results are the following for 1978:
31 sub-Saharan countries r = -0.47 (p = 0.004)
28 sub-Saharan countrieswhose data are more reliable r = -0.53 (p = 0.002)
10 West African Francophonecountries r = -0.79 (p = 0.006)
18 other sub-Saharan countries r = -0.24 (p = 0.171)
Only in the last case is the coefficient nonsignificant at the 1% level. But
this finding again contradicts the evidence from the time series as far as
economies of scale are concerned. Some reflection about the meaning and the
limits of the economic theory of economies of scales is therefore in order.

- 104 -
Lessons from Economic Theory
The concept of economies of scale was developed within the theory
of the firm. It is part of the more general law of variable proportions,
which is meant to explain the familiar U-shaped average cost curves one finds
in economics texts.
The idea behind this is indeed quite simple and may be summarized
in the following way. The factors of production which are combined to
produce a given good or service cannot all be divided into very small units.
It follows that, if one wants to produce at all, one has to purchase a
minimum amount of each factor, and that this minimum amount is, in the case
of some factors, "too large" if the firm turns out only a few units of the
output. One says that the productive capacity of the input(s) which can be
acquired only in large lumps is "underutilized." The building in which
production takes place is one of the cases in point.
But it also follows that one can increase production, within
certain limits, without having to purchase more of the "lumpy" factor, so
that average cost per unit of output decreases when production increases
(other things equal). In other words, one experiences economies of scale.
But it is clear that this reasoning applies only at the microeconomic level
to one given productive unit. It only goes to say that, given the state of
the techniques, there is an optimal size to the productive unit and an
optimal size of operation of a given unit where capacity is fully utilized
and average cost at a minimum.

- 105 -
This conclusion cannot be directly extended at the macroeconomic
level, however, because total production can usually be increased by setting
up another productive unit in which unit costs are the same as the unit cost
in already active units. In the field of education, the productive unit is
the school. It is easy to see why cost per student should decrease in a
given school when the size of the school increases, at least up to a certain
point. The most obvious reason why this is so is that teachers' salaries are
always the largest input cost. Because teachers can effectively teach groups
of students, cost per student has to go down from its initial high level when
the number of student's becomes larger than one.
Another reason to anticipate economies of scale in education is
that it is cheaper to provide certain services such as science laboratories
or sports facilities to different groups of students than to one single group
or class. But this already shows that economies of scale cannot be
automatically expected when the school system expands. The optimal size of a
school actually depends upon the level of education and its content. For
instance, a science laboratory or industrial workshops may be deemed
indispensable in technical high schools but not in primary schools. It also
depends upon the level of the budget. It is cheaper per student to build
adequate sports facilities for a large school than for a small one, but, if
the ministry of education and/or local government cannot afford to provide

- 106 -
schools with swimming pools or football fields, the optimal size might be
smaller. 2/
At the macro or national level, the problem is still more
complicated because it is theoretically possible to duplicate existing school
facilities and therefore to expand the system at constant unit costs. But if
we look at the problem of economies of scale from the point of view of poor
countries where enrollment rates are still low, even at the primary level,
what can we logically 3/ say about the probable trend in unit costs when the
school system expands? Let us consider each level in turn.
Primary Education
The expansion takes place essentially through the building of more
schools and the training of more teachers. What types of economies of scale
may be expected?
Larger school buildings. First, it is not obvious that larger
school buildings are always more cost effective. But even though it may be
the case, the practical possibility of building larger schools is very
limited, especially in West Africa, for the following reasons. First, in
urban areas enrollment rates are already high, and few new buildings are
2/ A recent article by Lawrence Kenny (1982) gives a good survey of theresearch on economies of scale at the school level in the United Statesand gives evidence in favor of sizable economies. But it is easy to seethat these results cannot be extended to developing countries.
3/ We have to use logical reasoning because empirical evidence is not clearenough at this point to warrant definite conclusions and because furtherempirical research needs to be based on hypotheses built fromtheoretical reasoning.

- 107 -
needed, except to reduce overcrowding. Building new and better schools would
improve quality but probably would not reduce unit cost unless other
cost-reducing measures, such as double shifts, were simultaneously put into
operation. Second, in rural areas population density is usually low. In
many cases, it is difficult to have more than one classroom where all grades
are taught together. Larger school buildings, as well as modern facilities,
are therefore out of the question because schools are usually built by
villagers themselves through self-help schemes.
Other cost-saving devices such as double shifts are also
impractical in most cases for the same reasons. Only biannual recruitment
schemes--by which two age cohorts are recruited simultaneously and there are
no recruitments on alternate years--might allow some economies of scale to
appear. But one must remember that, beyond a certain point, increasing the
enrollment rates means mainly reaching children in more remote area. If
durable building materials are to be used, the probability is that the
building cost will increase because it will become more and more costly to
bring these materials into the villages where schools are to be built.
Increased class size. We have seen in Chapter 5 that the average
class size is already very large in sub-Saharan Africa--in urban areas, so
large that the quality of education is impaired. And, as we recalled in the
preceding subsection, in rural areas it is in most cases impossible to
increase class size because pupils would have to walk too far to go to
school.

- 108 -
More efficient role of school administration. It is theoretically
possible to lower costs through better administration and planning of the
school system at the national level when the school system develops. A
planning cell may be created at some point and then, some time later, reach
the critical size which allows it to work efficiently. But history shows us
that bureaucracy often has a tendency to become top-heavy and to induce
diseconomies of scale if a strong political will and a clear vision of the
needs of schools do not prevail at the top.
From the above we may therefore conclude that the general prospect
is rather dim for realizing future economies of scale in primary education,
especially in sub-Saharan Africa. But of course the situation varies from
one country to the next and from region to region in each country, so that
only carefully designed empirical studies at the local level can give us a
definite answer. And we must also remember that empirical evidence taken
from cross-sectional studies does show that the "real" cost (or the "effort"
in favor of education, as we called the cost in terms of the proportion of
real resources used) is lower in countries where the rate of enrollment is
higher. Although, strictly speaking, this has nothing to do with economies
of scale as they are usually defined and can be explained by a change in the
relative scarcity of people qualified enough to become teachers when the
education system expands, it tends to show that unit cost does not grow as
fast as national income (because enrollment rates are positively correlated
with level of GNP per capita). If it can be shown that quality of education
is not systematically lower in countries where the rate of enrollment is

- 109 -
high, this type of evidence may be good news indeed, since it indicates to
the developing countries that their financial effort per pupil will tend to
go down, other things being equal, as the enrollment rate goes up.
Secondary Education
The outlook for economies of scale may be brighter in secondary
than in primary education.
General education. Here the pressure of demand is very high and
rates of enrollment still very low, and there are more opportunities to
experiment and to try to find the optimal school size. Of course,
quality-improvement considerations will enter the picture, and unit cost
might not always go down, but cost effectiveness should improve with better
school design.
Technical education. Technical schools have to be large to be cost
effective. They take time to fill up, so that unit cost should go down in
each new school during the first year after the opening.
Higher Education
Here is the best case in favor of economies of scales. To reach a
minimum level of excellence, universities have to carry on research, and
research laboratories have to have a certain minimum size. Furthermore, it
is more efficient to plan the size of a new university according to future
enrollment targets. Finally, teachers have to be well paid if a minimum of
academic proficiency is to be reached. For these reasons (and others), the
unit cost per student has to be extremely high in newly opened universities,
but it should go down as expansion takes place.

- 110 -
Evidence for sub-Saharan Africa seems to point in this direction.
The existence of very high costs per student in that part of the world is
well documented, and costs seem to be decreasing when the number of students
goes up. Of course, one has to be very careful in interpreting these data.
O As G. Psacharopoulos points out, "the documented fall in unit costs
might not only reflect returns to scale, but also a fall in the quality of
education provided by university institutions" (Psacharopoulos 1980, p. 31).
O It is also clear that authors, such as Dunworth and Bottomley
(1974), who have concluded that economies of scale exist in the universities
of advanced countries have never been able to prove that quality has remained
constant when unit costs have decreased.
O Comparisons between schools of different sizes are usually not made
(or sometimes cannot be made), other things being equal. For instance, a
comparison of recurrent unit costs in two types of primary teacher training
colleges in Malawi (1978 World Bank education sector survey data) clearly
shows that the difference in favor of missionary colleges is due to two
factors, neither of which has anything to do with the fact that they are of
smaller size: missionary colleges are filled to capacity and national
colleges are not; and missionaries are paid less than lay teachers. And the
evidence purporting to show that unit cost in national colleges would go down
slightly in one college and sharply rise in the other if they were both
filled to capacity is not valid because the comparison is between observed
historical costs and norm-referenced future cost.

- ll -
This example and the observations made above remind us of how
difficult it is to isolate economies of scale from other factors influencing
unit costs. But it still seems safe to conclude that a decrease in unit
costs due to economies of sczale may be expected in the coming decade in most
African universities.


CHAPTER 7
THE INFLUENCE OF REPETITION AND DROPOUT RATESON UNIT COSTS OF EDUCATION
Repetition and dropout rates are extremely high in many developing
countries. In the late 1970s, for example, in seventeen out of the eighteen
countries of Francophone Africa for which we have comparable data, over 10%
of enrollment in primary education consisted of repeaters. This rate was
above 20% for ten of the countries and above 30% for four of them.
Dropout rates were also very high in most countries of the same
group. Sixty-nine percent of the children who entered primary school failed
to finish it in Benin, 58% in Gabon, 54% in Mali, 40% in Chad, and 38% in the
P.R. Congo. The two phenomena of repetition and dropping out are often
thought to be positively linked, and their joint effect on cost is thought to
be important. Consequently, their reduction is often presented as one of the
most efficient ways to reduce unit costs.
But the effects of dropouts and repeaters on costs are not the
same. The effect also varies depending upon the unit one uses to measure
unit costs. Finally, the net impact on costs depends upon the cost
implications of the remedial measure taken to lower repetition and/or to
reduce dropping out. Before looking at these issues, however, we must decide
whether repetition is truly and always a "waste."
- 113 -
- 114 -
Repeaters and Dropouts as Wastage
"Wastage" is a term used to describe the failure of the educational
system to achieve its objectives. Since one of these main objectives is to
transmit certain levels of knowledge to students by leading them through a
cycle of studies, planners have tended to consider that taking more time than
normal to complete a cycle, or dropping out before having completed it, is a
"waste." As a result, many statistical studies were made in which the term
wastage was used to represent repeaters and dropouts. 1/ But this
characterization of dropping out and repetition begs several questions.
The Case of Repetition
Those who consider repetition to be a waste implicitly assume that
there is a "normal" rate of knowledge acquisition and that school cycles have
been built up so that the yearly programs correspond to what can "normally"
be assimilated. They are comforted in their conviction by the results of
most of the research in this field. Two main conclusions seem to emerge from
this research. First, repetition does not seem to increase significantly the
level of school achievement or the amount learned by the repeaters. Second,
repetition seems to have a negative psychological effect because it tends to
lower the pupil's self esteem, to make his or her attitude toward learning
less positive, and to damage peer relations. 2/
1/ Unesco played an important role in promoting that type of research. Fora thorough description of the concepts, the measures, and themethodological problems encountered, see the report produced by theOffice of Statistics in November 1980 (Unesco 1980).
2/ For a survey of the evidence, see Haddad 1979.

- 115 -
This does not mean, however, that an automatic promotion system
would be free of waste. It is also well documented that children do not all
acquire knowledge and/or attitudes at the same rate. To promote the "slow
learners" automatically without devoting special attention to them during the
school year makes them less and less able to understand and to assimilate the
curriculum as they reach higher grades. "Fast learners" may also have the
feeling that they are wasting their time when they are placed in classes
where the teaching schedule is geared to the potential of "average" pupils.
There is some evidence which shows that children learn more when placed in
groups of similar ability.
The optimal school system would therefore be one in which the
length of each school cycle would vary according to the learning capacity of
the pupils. But compared with the present uniform system, such a reform
would entail extra costs which would have to be taken into account before
deciding whether net costs would go up.
The Case of Dropping Out
Dropouts are considered as a waste because each school cycle is
taken as a logical entity which should be attended in its totality if the
pupil is to reach a certain level of competency. But this position is
certainly too extreme. Learning is a continuous process, and one can hardly
assume that a student who drops out just before the end of a cycle has
learned nothing at all. It is true that the so-called basic skills (reading,
writing, arithmetic) cannot be assimilated in less than some minimum time
spent in primary education. But beyond that minimum, it is probably more

- 116 -
accurate to measure the amount of "human capital" acquired by the time spent
in school. Furthermore, schools do much more for students than transmit new
knowledge. They help to play an important role in shaping children's
attitudes and transmitting social values. Of course, it may be argued that
those who drop out may do so because they do not share those values, but
economic and institutional reasons seem to be, in most cases, the main
determinants of dropping out. Before concluding that all dropping out and
repetition are purely wastage, one should look more carefully at what the
students who do drop out have learned from the school before they left.
Effects of Repetition and Dropping Out on Costs
The case of repetition is different from that of dropping out. One
more repeater is one more student to be taught in a given year; one other
student dropping out means the opposite. The total number of student-years
to be provided is therefore the first problem to be considered. But the true
balance sheet would also have to consider what quantity of human capital
students have acquired before leaving. Finally, the net effect on cost will
also depend upon the cost of remedial measures intended to reduce repetition
and/or dropping out.
Repetitions, dropouts, and student-years
Since repetitions and dropouts affect the number of student-years
to be provided for all entrants to go though a cycle, the number of
student-years will depend upon the relative magnitudes of the two phenomena
and upon the stage at which dropping out takes place.

- 117 -
Simple simulations show that, if the number of dropouts is
relatively high compared with the number of repetitions and if they occur
early in the cycle, the number of student-years will tend to be lower than it
would be if all students went through the whole cycle without repeating. It
is only in the opposite case, when repetition rates are relatively high and
dropping out occurs mostly late in the cycle, that one can be sure that there
is a significant increase in the number of student-years that have to be
provided.
Dropouts and Human Capital
If it is assumed that the students who do not graduate have not
acquired anything in school, then the years of schooling they have received
before dropping out are clearly wasted. If we make the opposite
assumption--that students who drop out accumulate as much human capital while
in school as those who ultimately complete the cycle--and then compare the
number of student-years provided with some indicator of human capital
acquired, we see that dropouts have no influence on the "cost per graduate
equivalent."
The truth must be somewhere between these two extremes. Clearly
some education can be acquired in less than a full educational cycle, and one
should not assume that the amount spent to teach future dropouts is totally
wasted. We have no indicators of what the educational value of an
uncompleted cycle might be.
- 118 -
The Net Cost Effect of Policies to Reduce Repetitionand Dropout Rates
Several conditions have to be met if the effects on cost of
policies to reduce repetition and dropout rates are to be favorable. Also,
in countries where primary education enrollment rates are still low, the
effects of such policies have to be considered separately.
The general case. For the net effect on total cost to be positive,
the overall effect on enrollment has to be negative, and the effects on
savings due to a smaller number of students enrolled must be greater than the
cost of the measures used to reduce repetition and dropout rates.
The direct effect on cost can be negative only if the number of
students decreases. That is what people assume when they say that, if
repetition rates are equal in each grade, one can reduce the total number of
students in a cycle by a percentage equal to the repetition rate by deciding
upon a policy of automatic promotion. But this reasoning applies only to
repetition. If the number of dropouts is substantial, and if policies to
reduce dropping out are implemented at the same time, the reduction in total
enrollment will be less. Total enrollment may even increase.
The direct effect on cost will be less than proportional to the
effect on enrollment because of the existence of fixed costs. In the short
run, a high proportion of total cost must be considered as fixed. Not only
are school buildings already there, but teachers cannot usually be dismissed
easily. In the longer run, the cost of teachers may decrease because there
will be fewer hirings, so that total cost will be more affected--especially
at the primary level, where teacher salaries often amount to 90% or more of
current expenditures.

- 119 -
The cost of the remedial measures taken to reduce wastage will
depend upon the type of measures. Some measures, such as automatic promotion
and revision of examination standards, are essentially costless. But there
are reasons to question whether they will significantly reduce dropping out.
First, if they induce students to stay who were discouraged because they were
forced to repeat a grade, they may also discourage some who find themselves
promoted without having gained an adequate foundation for further learning.
Second, they will not have any effect on those who drop out for personal,
economic, or family reasons or who are "pushed" out of school for lack of
places in the higher grades (as is often the case in poor countries).
Costlier remedial measures such as better teaching aids, compensatory
programs, and individualized or nongraded instruction are needed if one
really wants to get rid of wastage. As a study made more than ten years ago
by Unesco (Berstecher 1970) purports to show, such measures may tend to
reduce cost per graduate, but: they will increase total costs.
The case of primary education in developing countries. Many
developing countries, especially in sub-Saharan Africa, still have low
enrollment rates in primary education. All aspire to come close to universal
primary education, and reducing repetition rates may appear to be an
essentially costless way to increase the intake of primary schools. Each
student who was promoted instead of repeating would make a place for a new
entrant. Here the problem is not to reduce cost but to bring more children
to school without increasing cost and without lowering quality.

- 120 -
It is an error to conclude, as Unesco did in its report to the 36th
International Conference on Education in 1977, that in 1970 "repeaters
constituted about 15 percent of total enrollment in primary education in
Latin America, 15 percent in Africa and 18 percent in South Asia. In other
words, the number of children of primary school age admitted to school could
have been increased by some 15-20 percent in LDCs without increasing the cost
had there been no repetition." This statement is incorrect and misleading.
Children of primary school age can only enter the first grade. It is the
percentage of repeaters in the first grade which determines the number of
additional places that could be made available. Furthermore, repetition
rates are not equal in different grades, so that automatic promotion would
produce different changes in the number of pupils per class in different
grades. This process of implementing automatic promotion would certainly not
be costless. Finally, there is no correspondence between repetition rates
and new demand by community or region. In most urban areas repetition rates
are very high, and unsatisfied demand is generally small.
Although the problem is more complex than is often thought, some
points seem clear. First, high repetition rates constitute educational
problems: negative effects on many children and positive effects on few.
Second, lowering repetition rates does make room for new entrants, although
the ratio is not one to one. One may therefore conclude that further studies
should be made, country by country and level by level, using simulation
methods. It is probable that lowering repetition rates where they are very
high will have positive effects on students and may contribute to lowering
total cost or to enabling more children to attend school.

PART III
THE PROBLEM OF COST RECOVERY

INTRODUCTION
TO PART III
Education is a good which is demanded for many reasons. In the
jargon of the economist, one would say that it is at the same time an
investment good (a good acquired for the monetary returns one expects to earn
from putting it to use in future periods), a durable consumption good (a good
whose services one expects to enjoy in future periods), and a nondurable
consumption good (a good one enjoys consuming now). Inasmuch as its
dimension as a durable good is important, demand for education on the part of
individuals 1/ will depend on the breadth and accuracy of their information
about future benefits to expect from it.
Society as a whole and governments, to the extent that they act
as representatives of society, will be concerned by this demand in two
cases:
o If there are reasons to believe that individuals underestimate
the returns of education, thereby inducing a loss of future
welfare in the given society
o If some of the (positive) returns spill over from the individual
to the community, thereby making social returns higher than the
sum of individual returns.
In the first situation, government might limit its intervention
to providing better information to the students and/or their families; but
1/ In the case of education, the problem is further complicated by the factthat demand is often expressed not by the person acquiring the good butby someone else (generaLly parents); the former is unable to understandand to appraise the future returns.
- 123 -

- 124 -
in the second case it should induce them to "buy" more education by sharing
the cost with them.
Here lies the case for public subsidies to education. But
unless there are no private benefits from education at all (or people are
so poor that they cannot afford to divert even a small part of their
incomes from survival expenditures), and unless the collective advantage to
be gotten from sending children to school is so high under given
circumstances that government feels that public resources should be spent
in priority on education, there is no logical reason why education should
be offered free to the public. The problem the economist faces is
therefore that of determining the optimal amount of "user charge" which
should be imposed for education. As with other types of so-called "public
goods" or "merit wants," an optimum can only be reached by reconciling two
partly conflicting objectives: efficiency and equity.
Economic analysis of this type of problem is not new; it dates
back to the very beginnings of economics. But it is only in the last fifty
years or so that "welfare economics" developed as a separate branch of
economics, and in the last twenty-five that highly refined and rigorous
mathematical models were developed to point out optimal solutions to welfare
problems.
In contrast with those highly abstract and purely logical
developments, urgent practical problems of public finance have been posed
to governments in most countries. As pointed out in the first part of this
report, most governments consider that public expenditures on education
have reached a level relative to total exenditures and to GNP which cannot
be increased in the future. Faced with severe financial constraints, they

- 125 -
look not only for ways to lower unit costs but also for strategies to shift
at least part of the burden to somebody else. The problem is still more
acute in many developing countries where a tremendous effort has been made
in favor of education but where the financial squeeze has come at a time
when universal basic education is not yet achieved and the absolute number
of illiterates is not regressing.
What can economic analysis tell the decisionmaker about these
issues? What are the facts, and therefore the real issues, involved? What
kind of data should be gathered for the economist to be able to advise the
decisionmakers more aptly? Such are the questions which shall be addressed
below.


CHAPTER 8
THE ROLE AND LIMITS OF ECONOMIC ANALYSIS
What can economic analysis tell us about the optimal price of
education? A rapid look at contemporary writings on welfare economics does
not offer one much help in view of the highly abstract and purely logical
character of the literature and of its dominant concern with optimal taxing
mechanisms in rich countries. But a few recent essays on the education
problems of developing countries may be of some help.
The Inadequacy of General Welfare Economics
The purpose here is not to review even a small fraction of the
abundant literature which has appeared in the last thirty years. We shall
only state some well-known facts about welfare economics.
Economic theory does tell us the following. As soon as we have
reasons to believe that a given good cannot be produced at constant returns
to scale and/or that the consumption of this given good is not purely
individualistic but entails sizable "external effects," social allocation
according to market rule cannot be optimal. For such goods, one can define
"a frontier of efficient points from which no universally advantageous
movements are possible," but one cannot pinpoint "the" socially best
solution unless one uses a "specified normative welfare function".1 /
By implication, it is easy to see that any normative welfare function has
to be based on a concept of equity. But "different concepts of equity all
1/ This quotation and the preceding one are taken from the limpid andstill fully actual article by P. A. Samuelson (1958).
- 127 -

- 128 -
require interpersonal comparisons of utility which take the subject beyond
the range of pure economics and require philosophical and ethical
judgement" (McMahon and Geske 1982, p.190).
Since these conclusions were reached by Samuelson and others more
than twenty years ago, progress has been made in the exploration of the
conditions of an optimum, and a great deal of ingenuity has been deployed
in building mathematical models, but most of the research has been of a
highly abstract and axiomatic character. Until only recently, very little
has been directed toward providing the decisionmaker with useful information
and methods of financing public goods. 2/
This recent type of economic research tells us that education is
a good which cannot be produced optimally under market conditions because
it presents the two characteristics mentioned above -- variable returns to
scale and important external effects. This by itself is useful because it
demonstrates that the historical choice made by most governments to control
and to subsidize schools heavily was possibly economically efficient. We can
also get from welfare economic theory the notion that it may be efficient to
make the buyers pay part of the cost. But things get less clear when equity
considerations are introduced. To avoid the logical difficulties involved in
calculating the optimal tradeoff, most authors tend to consider as optimal
solutions those in which only a very small portion of the cost and of the
2/ A very good example of this type of research and of its limitation canbe found in P. G. Hare and D. T. Ulph (1982) and in J. A. Mirrlees'scomment on this model (in Bowman 1982).

- 129 -
benefits of the considered educational investment are left in the hands of
private individuals.
But as J. A. Mirrlees points out (in Bowman 1982, p. 133), it is
difficult to believe that people actually make optimal economic decisions
when both costs and benefits to them are very small, although "it is not a
consideration that our economic theories allow us to handle." Furthermore,
axiomatic welfare economics cannot and does not tell us at what level the
user cost should be set in a given concrete situation, how it should be
collected, 3/ and from whom. But it may help us reflect on the degree of
consistency of a particular institutional arrangement--which, again, is very
important and not to be negLected for the sake of apparent "realism."
Recent research concerned more directly with the financing of
education than the general welfare models referred to above might be of
more direct use to the decisionmaker. But, as we shall soon see,
it also has its limitations.
3/ Other than saying that the ideal tax is a lump-sum tax which in actuallife cannot be levied.
- 130 -
The Limitations of Current Research on Education Financing
A survey of research done in this field in the last ten years 4_
reveals two characteristics which severely limit the utility of the research
to decisionmakers in developing countries.
o Most of this research concerns developed countries,
principally the United States.
o Most of this research concerns higher education only.
Moreover, the few studies of developing countries concern middle-
income countries, not the poorest, and deal with their present situation
and not with what could be done to find new resources for education. But if
one may say that these studies are also of little immediate use in helping to
solve the problem with which we are concerned, this does not mean that
nothing useful can be gathered from them--on the contrary.
First, much more attention is now paid to equity considerations
than before. As a consequence, our knowledge of the different concepts of
equity which are being used and of their links with different philosophical
theories of justice, as well as that of the practical consequences of
adopting each one of them, has been improved. 5/ As a consequence, economic
analyses of these welfare issue have become much more accesible to
4/ We shall not attempt to give a full bibliography on the subject. But alook at three recent sources might give the interested reader fairlycomprehensive references. These are 1982 World Bank data on Chile,France, and Malaysia compiled by M. J. Bowman, B. Millot, and E.Schiefelbein (Education Department); Bowman (1982); and McMahon and Geske(1982).
5/ For a good description of the different equity criteria and of theireffects on income distribution, see McMahon and Geske (1982), pp.16-22.

- 131 -
noneconomists. For instance, the link betwen Pareto optimum and the concept
of commutative equity (which recognizes to every citizen a property right on
the product of his activity) is now clearly grasped. 6/ Another consequence
of this increased interest in equity considerations is that,instead of
reasoning only in terms of tradeoffs between efficiency and equity, several
authors are exploring the situations in which efficiency and equity are joint
products which can be simultaneously increased through appropriate policy
measures. 7/
Second, by looking at future effects as well as at present
effects of education efficiency, studies of the cost-benefit type rightly
draw the attention of decisionmakers in developing countries to the plain
but often forgotten fact that education is an investment which, like all
other investments, is justifiable only if it brings positive returns to the
students and to society as a whole.
Third, most of the hundreds of studies which have been undertaken
in the United State on the opl:imal school finance system since the late
1960s (in the wake of the movement of educational finance litigation) have
concentrated on notions of equality of treatment and of uniformity of
effort. These studies have shown with more precision and realism than before
that asking an equal contribution from all families is often tantamount to
imposing on them very different financial burdens, thereby putting in
6/ For a clear and forceful presentation of this doctrine, see Feldman(1971).
7/ See, for instance, Part III of McMahon and Geske (1982).

- 132 -
question the equity of a uniform school fee. This is especially important in
poor countries, where such a fee is often the only practical way to make
parents contribute to the cost of schooling.
Finally, a few recent studies are beginning to draw attention to
the fact that government should not only be considered as an entity
representing society as a whole but also as an organization which acts
according to certain rules and certain constraints. Cost (and returns) of
education should therefore be looked at not only from the point of view of
society and from the point of view of the individual but also from the point
of view of government. This is especially important because costs, as
measured up to now by the economist, do not correspond to what education
really costs government--nor do returns. This is evident in table 8.1. As
can be seen from the table, forgone taxes replace forgone earnings as imputed
costs, and incremental taxes attributable to education replace incremental
incomes of graduates as far as government is concerned and should therefore
be taken into account in budgetary discussions.
Another reason why it is important to look at the cost-benefit
balance from the government's point of view is that, in most developing
countries, government itself is the main employer of graduates.
In such a case, the state might be able to compensate part of the
public expenditure on education by paying lower wages than would be
required to attract a suitable labor supply when training is
not subsidized. 8/
8/ 1982 World Bank data compiled by Bowman, Millot, and Schiefelbein(Education Department).
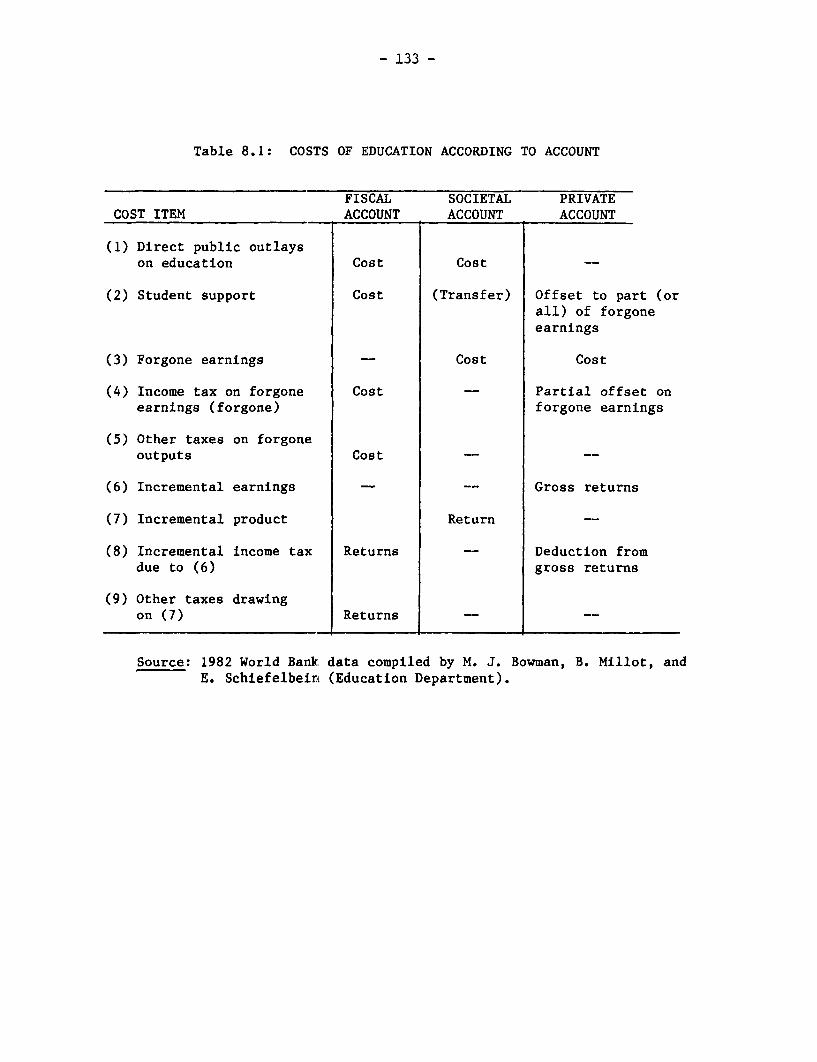
- 133 -
Table 8.1: COSTS OF EDUCATION ACCORDING TO ACCOUNT
FISCAL SOCIETAL PRIVATECOST ITEM ACCOUNT ACCOUNT ACCOUNT
(1) Direct public outlayson education Cost Cost __
(2) Student support Cost (Transfer) Offset to part (orall) of forgoneearnings
(3) Forgone earnings Cost Cost
(4) Income tax on forgone Cost __ Partial offset onearnings (forgone) forgone earnings
(5) Other taxes on forgoneoutputs Cost
(6) Incremental earnings __ __ Gross returns
(7) Incremental product Return __
(8) Incremental income tax Returns Deduction fromdue to (6) gross returns
(9) Other taxes drawingon (7) Returns __ __
Source: 1982 World Bank data compiled by M. J. Bowman, B. Millot, andE. Schiefelbein (Education Department).
- 134 -
Contemporary economic analysis therefore provides important,
although indirect, guidelines to decisionmakers in developing countries.
But what can it contribute directly to the solution of the urgent problem
that goverments of poor countries are facing--namely, how and where to find
new resources for education?
Economic Analysis as a Guide to Educational Finance Policy inDeveloping Countries
Very recently, two analysts have addressed the problem. Trying to
keep in close contact with the realities of developing countries, and
resisting the temptation to build up sophisticated mathematical models, they
have attempted to show under which conditions user fees may increase the
efficiency of an educational system without sacrificing equity. 9/
Using these two examples, we shall make a critical review of such
attempts, insisting on the conditions which have to be met before user fees
can contribute to the financing of education and on the type of
information one should have in order to test these models.
The Analytical Framework: Its Main Assumption and Conclusions
It is a quite conventional and quite simple supply-and-demand,
static partial equilibrium model. Assuming constant marginal costs and
nonzero elasticity of demand, the authors introduce a constraint concerning
the amount of money the ministry of education may spend in a given period,
given the prices of inputs. This means that a given maximum amount of
9/ The contributions of these two analysts, both with the Country PolicyDepartment of the World Bank, are still in the preliminary stage; seeThobani (1983) and Birdsall (1982b).

- 135 -
educational services can be provided free of charge. Assuming further that
all other possible sources of finance have been fully tapped, including
foreign aid, 10/ the conclusion is that supply of education can only be
increased if a fee is levied. on the users. With such a constraint, it is
likely that there will be excess demand for education as long as it will be
provided free of charge. Education will therefore be rationed (not all of
the children who want to enter school will be accepted, not all those who
want to go on toward higher levels will be allowed to do so).
To the question why education should not be offered at a price
equal to Its marginal cost, the authors answer by recalling that, in the case
of education, there is strong evidence pointing toward the existence of
market imperfections and of positive externalities. As a result, one may
assume that the social demand curve is above the private demand curve, so
that to charge the full social cost would induce consumption below the social
optimum. But the quantity oE education which can be provided free of charge
by the government is also below the social optimum. The problem is therefore
to determine the optimal "pr:Lce" to impose on the students or their parents.
Given the government budget constraint, this "optimal" price will
probably not be that level which would provide the optimal quantity of
education--that is, that quantity for which social demand is equal to
marginal cost. But, given certain conditions of demand and of cost, it is
10/ Neither Thobani nor Birds all mention this specific source of finance,but their specific objective is to study the effects of user fees ondemand.

- 136 -
possible to show that a positive fee will bring larger social benefits than
the zero-fee situation and that there is a level of fee which maximizes
social benefit given the contraint, thereby constituting a second-best
solution as can be seen in Figure 1.
The "best" solution would be to set the fee at OPO because
private demand at that price would equal social demand at OQO. But, given
the budget constraint, the government could not finance the difference
between marginal cost and price (given by the surface of the PmcFGPo
rectangle), which is larger than the surface of the PmcBQfO rectangle
(representing the education budget).
The "second-best" solution is therefore the provision of less
education (OQp) at a higher "price" (OPp). But it clearly increases
benefits to society (by an amount represented by the surface ADCB) compared
with the no-fee solution, and it makes excess demand disappear.
Only efficiency considerations have been introduced up to this
point. The use of a unique private demand curve, by assuming that all
"demanders" of education have similar tastes and constraints (or that the
differences in tastes offset the differences in constraints), allows the
authors to dismiss possible effects of fees on the distribution of
education among individuals. But equity considerations are later
introduced in the analysis in two different ways. The first way is to give
pieces of concrete evidence purporting to show that, in real life, very low
fees are more likely to benefit the rich than the poor (Thobani 1983). The
second way is to apply a household demand model to two groups, the "rich"
and the "poor" (Birdsall 1982b).

- 137 -
Figure 1: SECOND-BEST SOLUTION WITH EXCESS DEMAND
Ds
A
.: !.
P.~~~~~~~~~~~~~~~~~~.
Source: Thobani (1983, p. 8, with minor modifications).P = Price.,Q = Quantity.
DP = Private demand curve.Ds = Social demand curve.MC = Marginal cost curve.SS = Locus of points showing the quantity of the services
the government can provide at different user fees.
- 138 -
The criterion of equity used is the following. Any education
policy is equitable as long as it increases the utilization of that service
among the poor more than among the rich. If a new universal fee is used to
increase equally for all students the quantity and/or quality of
educational services offered, the effect tends to be regressive, under the
usual assumption of decreasing marginal utility of money. The marginal
utility of income spent on fees will be greater for the poor than for the
rich, so that their demand will likely be more fee elastic. 11/
But if we assume that in the initial no-fee situation there is a
much larger excess demand on the part of the poor than on the part of the
rich, it is possible to show that a fee may be equitable. The only
condition is that the demand of the "rich" be sufficiently inelastic for
the proceeds of the fees to be used mainly to increase the attendance of
the poor. 12/ This apparent paradox results from the fact that, although
demand from the poor is much larger at zero fee than after a fee has been
imposed, a large part of that initial demand was not satisfied because of
the budget constraint. As long as excesss demand on the part of the poor
has not disappeared, the increase in fee will increase the enrollment of
the poor unless their demand is infinitely elastic and will increase it by
more than it will increase the enrollment of the rich.
11/ The fee elasticity of demand on the part of the poor could only besmaller than the elasticity of the rich if the poor had a much higher"preference" for education than the rich. Because it is difficult tobelieve this would be the case unless the poor expected to benefit muchmore than the rich from education, it does not seem unrealistic toassume higher fee elasticity for the poor.
12/ For a diagrammatic presentation of this type of situation, see Birdsall(1982b), p. 19.

- 139 -
From this summary of recent economic analysis of the potential
effects of raising school fees, the possibility of increasing both the
efficiency and the equity of education by raising fees seems to hinge upon
the existence of excess demand at the start. But Birdsall (1982b) attempts
to show that fees may contribute to more efficiency and more equity, even
in the absence of excess clemand, if other conditions are satisfied.
Using a household demand function framework, she first notes that
demand for education does not depend only upon the cost of education but
also on the characteristics of schools (namely, the quality of their
service offered and their distance from the home), on the characteristics
of the household (income and the opportunity cost of the child's time
forgone), and on the characteristics of the child (sex, ability) and the
prices of other goods consumed by the household. If the government uses
the proceeds from fees 13/ to improve the quality and accessibility of
schools, this will tend to increase households' demand for education. The
net result will depend upon the relative elasticities of demand and on the
marginal costs conditions. It will be positive (net demand will increase)
only if:
o The (positive) effect on demand of the improvement in quality and
distance is stronger in absolute terms than the (negative) effect of
the increase in fee.
o The expenditures on quality improvement and/or distance reduction
do not induce an equal increase in marginal cost.
Thus, efficiency may be increased even in the absence of excess demand at
the start.
13/ These proceeds will increase with the level of the fee if theelasticity of demand is less than unity, but they will always bepositive if we start from a no-fee situation unless elasticityequals - °°.
- 140 -
The same argument may be used with respect to equity. It is
assumed that the poor, on average, are offered schools that are of lower
quality and/or are more distant from their homes. Equity will be increased
provided that:
o Fees are used to increase quality and/or lower distance for the
poor.
o The fee elasticity of demand of the "rich" is sufficiently low to
ensure increased revenues.
o The (positive) effect on the poor's demand of the increase in
quality and/or the lowering of distance is stronger in absolute
terms than the (negative) effect of the increase in the fee.
o The increased revenue is sufficient to improve the quality and to
provide a larger number of school seats.
These conditions are very stringent indeed, and the whole analysis deserves
a critical look if we want to ascertain its validity and effectiveness.
The Analytical Framework: A Critical Survey
These analytical constructs must be judged from two points of
view. First on their own terms as pieces of logical reasoning; second as
possible aids to policy. The economic analysis is, of course, fairly
crude. This is not necessarily a shortcoming because it was not meant as a
purely theoretical exercise but as a model which could be tested with
available data. But it still raises questions, since some of the
conclusions are dependent upon the particular specification of the model.
The supply and demand model and its graphic presentation leave
many questions unanswered and contain several inconsistencies. Because
- 141 -
it is not our purpose here to engage in an academic argument, we shall only
point out the problems which may weaken the persuasive power of the
practical conclusions.
First, of course, it is a purely static, partial equilibrium
model, and its appropriateness might be questioned on the ground that
education is an activity ancl a process which has long-term effects, both
intended and unintended. The authors are conscious of this fact but
satisfy themselves with adding a few long-term considerations which do not
fit into the model. 14/ Second, the demand curves are drawn in such a way
that they leave the reader confused.
o Marginal revenue c.urves and not demand curves should be used to
determine the socially optimal quantity of education.
o The use of a straight line implies increasing price elasticity of
demand when the price goes down, which is probably not what the
authors intended and makes interpretation of the results
difficult.
o It is assumed that the private demand curve of the "rich" is the
same as their social demand curve (Birdsall 1982br, p. 18).
This is presented as plausible, but the reasons given exclude the
possibility of positive externalities, and one does not see why
education given to "rich" children should not have positive
effects on society as a whole. If such externalities were taken
into account, the *esults might not appear as socially optimal.
14/ Some of these long-term considerations, especially those about thebeneficial effects of more education on income distribution, are toosimplistic to be taken seriously.

- 142 -
Third, marginal cost of education is assumed to be constant. Not
only may this hypothesis be questioned in the case of a service the
production of which entails high fixed costs, but the authors may also be
accused of not showing that if marginal costs were decreasing it might not be
possible at all to determine the optimal quantity of education by using this
type of model. Finally, it might be said that Birdsall (1982b) tends to
overstate her case by showing only situations when efficiency and equity are
improved, when it is easy to see that a slightly different position and/or
slope of the curves on her graphs would have given different results. This
problem will be taken up later because it is crucial when one looks at the
possible use of the model as an aid to policymakers.
In addition, the household demand function, as it is presented,
is not very useful and may even be dangerous. First, it puts side by side
explanatory variables which are not homogeneous among themselves. Some of
them, such as household incomes, may act only as constraints; some are a
subset of a broad category (for instance, school fees, quality of schools,
distance); and some are but characteristics of the good demanded. One may
ask why only those characteristics and not others such as quantity, are
offered (at least in excess demand situations).
Second, nothing is said about the type of functional relationship
assumed between each one of those variables and demand for education. But
the presentation of the function may lead one to think that the same type
of relation is assumed, so that multiple regression analysis is in order.
As soon as one feels that one has to distinguish between different groups
such as "rich" and "poor," one seems to assume discontinuities in at

- 143 -
least some of those functional relationships. 15/ But these shortcomings
and/or obscurities are critical only inasmuch as they infringe on the
model's usefulness as a guide to policy decisions.
The model's usefulness for policy rests heavily on two implicit
assumptions. The first assumption is that all the conditions which are
(more or less precisely) stated in the model in order for fees to increase
both efficiency and equity in education can be met. In one case at least,
the authors' reasoning itself leads one to doubt that this can easily be
the case; in other cases, empirical considerations show that some caution
is in order.
The logical problem lies with the condition, found in Birdsall,
that "any increase in marginal cost associated with the quality improvement
or distance reduction does not absorb completely the increase in revenue
associated with the fee" (Birdsall 1982b, p. 12). As a matter of fact, if we
assume that cost conditions do not change, it is difficult to see why, in the
situation of constant marginal and average costs, an increase in quality
should not induce a corresponding increase in average and marginal cost. The
problem is different with distance reduction because, presumably, new
facilities could be built at the same unit cost as the old ones. One
therefore has to assume that at least part of the improvement will be
15/ Some of these problems are recognized in the last part of Birdsall's(1982b) paper, but the wEay proposed to deal with them is, to our mind,a little overoptimistic in the sense that it is supposed that simplehousehold surveys will give the opportunities to test all types ofhypotheses concerning the shape of various functional relationships.

- 144 -
in the form of distance reduction to believe that the above condition can be
met.
One other important condition of the improvement in efficiency
and in equity is that the total proceeds of the fee (or at least the
largest part of them) be used to increase the quantity and the quality of
education offered to the poor. If one admits, as Birdsall does (1982b,
p. 29), that in actual cases important political and logical problems may
arise, one must conclude that the following should be expected:
o Part of the official fee will never be recovered.
O A part (which may be large if the system is complex; e.g., with
a fee level varying according to household conditions) of the
recovered fee will go to cover administrative expenses.
Needless to say, the government should resist the temptation to use this
revenue to finance another "urgent" program. It is extremely important to
keep this in mind because, if the fee is not used to offer more and better
education, not only will the efficiency and equity objectives not be met but
one also can expect strong resistance by the parents to this new
tax. 16/
The equity objective is specified by reference to two groups:
the "rich" and the "poor." This dichotomy, as the authors admit, does not
do justice to the complexity of social structures. If the model were
complicated in order to include several income groups, one should expect to
16/ If the fee concerns only an especially powerful group, such as theparents of university students, the opposition may very well exist andprevent the implementation in any case.

- 145 -
observe that the poorest of the poor are more sensitive to fees than the
less poor and, therefore, that the levy of a fee might at the same time
increase the school attendance of the children of the latter group and
decrease that of the children of the former group. If such is the case,
what can be concluded about equity, even if the net overall effect on
demand is positive? 17/
Quite logically, qualitative aspects of education are taken into
account, and it is argued that, if quality is improved, the nature of the
product as seen by the prospective consumers changes. As a result, a new
demand may be generated. But this amounts to saying that if the parent can
be convinced that the schoo:L in which they felt their child was wasting his
or her time (because he or she did not learn anything which could be used
to improve his or her socioeconomic status sufficiently to offset his or
her forgone production and/or earnings) is becoming much "better," they may
change their attitude.
These quality improvements, then, mean much more than more
textbooks, better trained tetachers, more teaching aids. They mean a school
more relevant to the needs of a given social group. This is probably the
major problem facing the school systems in many poor countries, especially
in rural areas, and great care should be exercised not to confuse lack of
17/ Of course, one could either assume that the children of the pooresthouseholds do not attend because they are less able, less motivated(Birdsall 1982b, p. 21), or take a cynical attitude, observing that inall societies social policies benefit the lower-middle strata in thebest of cases but never those who are really destitute.

- 146 -
relevance with poor standards in the teaching of a relevant curriculum. 18/
The second assumption is that the data necessary to test these
models are available or can be made available without too much trouble and
at fairly low cost. On this point one may feel rather dubious for several
reasons.
As could easily be seen in the presentation of the models, the
"second-best" solution is always very sensitive to the level of the
independent variables. If we take the case of demand, we see in Figure 1
that the excess demand which exists when the price to the user is zero may
disappear even with a very modest fee if the private demand schedule is
highly elastic with regard to price. In such a situation, almost any fee
could push the level of demand below that of supply, thereby creating a
situation of excess supply and lowering the efficiency of resource
allocation. Likewise, if the difference between social demand and private
demand were small, setting the fee at Pp to eliminate excess demand would
induce a "consumption" of education in excess of the social optimum
(= Qo2)-
18/ This point may be linked with the one concerning external effects. Itis usually assumed (in Birdsall 1982b, p. 27, for instance) thatexternal effects of education are positive and greater among the poorbecause of the role an educated person can play in an uneducatedcommunity. But it has often been observed that teenagers coming frompeasant families, when they return to the farm after having learnedpieces of an urban culture, tend to feel scornful of their parents' wayof life. They are unable to help the parents improve their methods ofcultivation because they have not learned the appropriate skills andthey have forgotten the traditional ways, so that their productivitytends to be lower after school than before. This, therefore, is a caseof negative external effects of education on the poor community.
- 147 -
Looking at marginal cost, one sees that one should know precisely
by how much it would be raised by the quality-improving and distance-
reducing expenditures in order to determine what would be the increase in
the supply of educational services.
These examples show that a very accurate knowledge of the
characteristics of demand and of cost is required to determine the optimal
fee or even to decide whether any fee at all can be justified on efficiency
grounds. 19/ The data which have to be known with accuracy are numerous,
and their range wide. They have been quite clearly and precisely enumerated
by Birdsall (1982b, p. 30 ff.). A close look at the five categories she
distinguishes shows three thiLngs.
First, most of these data are not available at present in poor
countries. This is obviously true of the data falling into the last three
categories of data needed to test the demand function.
o Data concerning exogenous variables common to households grouped by
location (such as fees, quality of school, distance, etc.) have to
be gathered at the local level.
19/ We therefore must caution against hasty conclusions drawn only from thefacts that there is rationing of school seats and that the poor are moreexcluded than the rich. Contrary to what Birdsall states (1982b, p. 39),this observation is not sufficient to warrant the conclusion that "anincrease in fee which pernits the expansion of the system will be moreequitable as well as more efficient."

- 148 -
o Data concerning choice variables for each household can be gathered
only through specifically designed household surveys.
o Data which capture the existence of rationing can be gathered partly
at the national level (existence of national entrance tests) and
partly at the local level (administrative area the schools cater
to).
But the situation is actually not much better for Birdsall's
other two categories. Most of the exogenous variables specific to
households--such as total income, child and parent characteristics (age, sex,
ability, health states, ethnic group, and level of education of parents), and
the opportunity cost of a child's time--are not measured in most household
income or expenditure surveys (when these exist at all) or are measured in an
inappropriate way. This is particularly true of income in countries where
only a small minority of the work force earn wagesfrom employment in the
modern sector of the economy and where most of the production of the
traditional sector is not exchanged on a market for money. As for the last
category, costs to the government of delivering the educational services, we
have seen earlier how unsatisfactory the statistical information is.
Second, Birdsall's data indicate that progress in data collection
and analysis is urgent. This means not only the constitution of reliable
cost data banks but the multiplication of household surveys. The recent
trend in that direction and the important role the World Bank seems willing
to play are very encouraging indeed. These household surveys have to be
specially designed, but they should not be multiplied in the same country.
They are costly, and the experience of developed countries shows that a

- 149 -
tendency of households to refuse to participate tends to build up when the
frequency of such surveys (and their tendency to overlap) goes beyond a
certain point. The solution, therefore, is to try to set up cooperation
among all agencies and research groups working in the field of human
resources development so that questionnaires will be integrated.
Third, Birdsall's data suggest that, because there is still very
little experience with this tvpe of survey, with the type of data which can
be gathered directly when surveys are not possible, and with the way to go
about gathering these data, it is urgent to bring the interested parties
together for regular discussions. A few hours spent in such interchange
might avoid mistakes, which are costly not only in terms of money but also in
that the inappropriate or unreliable data sometimes gathered through
ill-designed questionnaires are used to make policy recommendations.
In conclusion, a review of recent research on the financing of
education in developing countries shows that the type of research which is
developing at present has, as we have seen, some shortcomings. But most
of these (economic analysis that is not always fully convincing, too much
distance between theory and practical problems) are because this type of
work is still at an early stage. Compared with these shortcomings, the
positive contributions of the research are quite substantial indeed.
First, the supply and demand model combined with the household
demand model has the great didactic advantage of showing that, contrary to
what was up to now currently aimitted, an increase in fee not only may be
economically efficient but also may be equitable (in a broad sense).

- 150 -
Second, this type of analysis shows, at least by implication,
that the absence of observed excess demand does not mean that the families
are satisfied with the service. On the contrary, the conjunction of low
enrollment rates and of no apparent excess demand should be interpreted as
showing that the service provided is considered by many families as
inappropriate. 20/
Third, by introducing as a constraint the maximum subsidy for
education, this type of approach allows a distinction between the state as
an organization and the state as the representative of society as a whole.
In the latter capacity, the state will attempt to measure and to satisfy
social demand for education--that is, to take account of the factors
(market imperfections, external effects) which make private demands an
inappropriate index of "need." In the former capacity, the state will
allocate budgets to the various government branches (including the ministry
of education) according to the total amount of resources it is able to
gather and to the relative bargaining powers of the parties involved. 21/
20/ The main reason why the families feel that way may differ from onegroup to the other and therefore should be explored. Some may feelthat the closest school is too far from home, some that the quality ofthe teaching is too low, some that the curriculum is not relevant.
21/ It is all the more important to consider the state in its twocapacities because, in the case of primary education, the only reasonfor imposing a fee is to allocate the financial burdens on government.The other argument in favor of user fees, that providing a good free ofcharge induces its consumption, does not apply in this particular casebecause it is difficult to see how one can consume too much universalprimary education.

- 151 -
Fourth, by addressing themselves specifically to the case of
developing countries, these studies come closer to having a direct
usefulness to the decisionmalcers faced with the dilemma of the growing gap
between public resources and social demand.
Fifth, these studies insist quite forcefully and cogently on the
need to gather more empirical, evidence at the local level, especially
through household surveys. This last point is very important because
national statistics, even improved according to the recommendations made in
Part I of this paper, will never give some of the information which is
absolutely necessary for an effective cost-benefit, or even an effective
cost-effectiveness, analysis.
But it should be recalled that this type of research explores
only the possibilities and consequences of one type of measure intended to
alleviate the financial burden of education to the government--namely, the
levying of fees on households. In the final chapter, we shall turn to a
survey of all the possible sources of education finance and of what
concrete evidence exists on their respective levels.


CHAPTER 9
FACTS AND ISSUES IN EDUCATION FINANCE IN DEVELOPING COUNTRIES
As stated in Part I, many governments seem to hold as true that the
cost of education is "too high." By that they mean partly that the school
system, as it is organized at present, is inefficient and therefore that
savings could and should be made. As we have also seen in Part I, little has
actually been done in cost saving, and the prospects for doing more and
better in the future are rather dim, for political as well as for economic
reasons.
But when they speak of high education costs, government officials
also mean that they fear that the state will not be able to keep assuming
for long the overwhelming part of the financial burden. The next logical
step is therefore to look to other groups who could contribute to the
financing of education. Four other groups are usually distinguished by
students of public finance:
o Firms
o Local governments and communities
o The "rest of the world"
o Households. 1/
Let us review the possible contribution of each of these groups in this
order.
1/ One other group, philanthropists (or patrons), is sometimes referred to.But its role in poor developing countries is usually so marginal that weshall disregard it. One other, new possible source of finance ofrecurrent costs is the school itself, through its productive activities.We shall therefore treat this possibility at the end of this chapter.
- 153 -
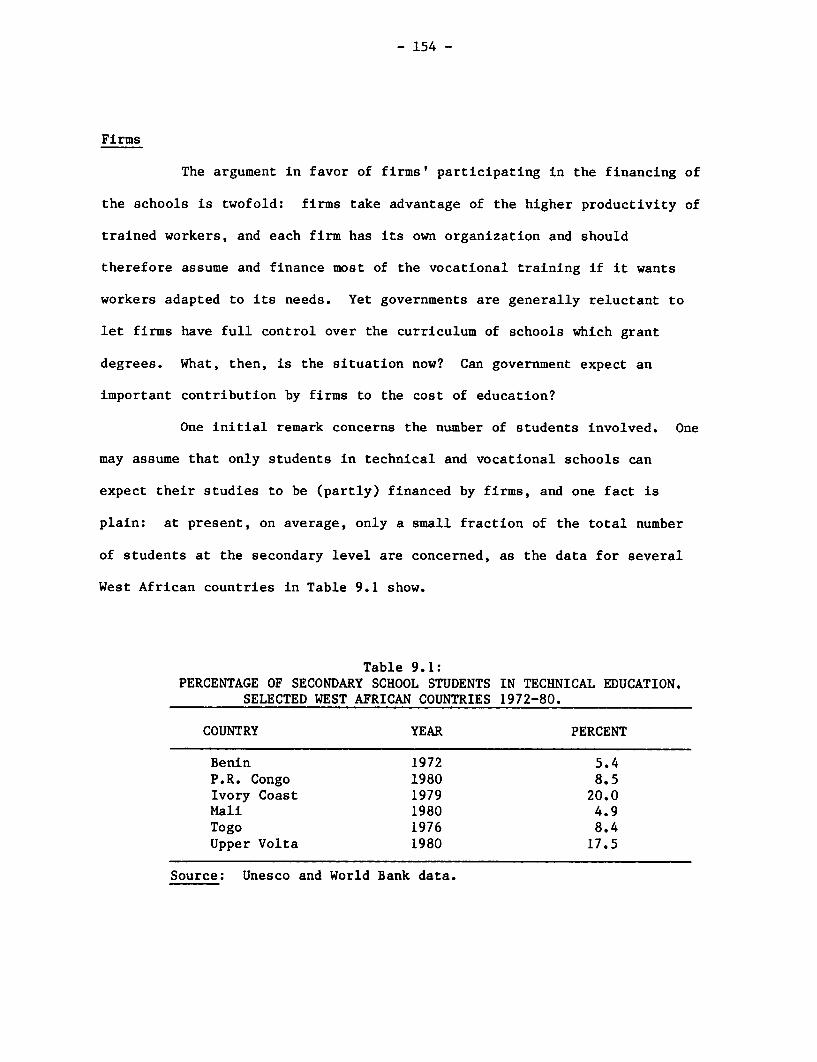
- 154 -
Firms
The argument in favor of firms' participating in the financing of
the schools is twofold: firms take advantage of the higher productivity of
trained workers, and each firm has its own organization and should
therefore assume and finance most of the vocational training if it wants
workers adapted to its needs. Yet governments are generally reluctant to
let firms have full control over the curriculum of schools which grant
degrees. What, then, is the situation now? Can government expect an
important contribution by firms to the cost of education?
One initial remark concerns the number of students involved. One
may assume that only students in technical and vocational schools can
expect their studies to be (partly) financed by firms, and one fact is
plain: at present, on average, only a small fraction of the total number
of students at the secondary level are concerned, as the data for several
West African countries in Table 9.1 show.
Table 9.1:PERCENTAGE OF SECONDARY SCHOOL STUDENTS IN TECHNICAL EDUCATION.
SELECTED WEST AFRICAN COUNTRIES 1972-80.
COUNTRY YEAR PERCENT
Benin 1972 5.4P.R. Congo 1980 8.5Ivory Coast 1979 20.0Mali 1980 4.9Togo 1976 8.4Upper Volta 1980 17.5
Source: Unesco and World Bank data.

- 155 -
For the same period, official data indicate that an important
proportion of these students attended private technical school: 49% in
Benin, 50% in the Ivory Coast, 26% in Mali, 74% in Upper Volta, 68% in
Togo, and 74% in Upper Volta. 2/ These percentages concern generally only
the students who attend private schools delivering national degrees. In most
West African countries a host of private "schools" delivering their own
degrees and sometimes giving only correspondence courses have opened in the
last decade or so. If these were included, the proportion of secondary
students in private technical education would still be higher. But most of
the cost of the private schools in general and of the "unofficial" 3/
schools in particular is financed by fees. Their standards are usually poor,
and the business community has usually very little contact with them,
contributing almost nothing to their expenditures.
Firms do contribute to the financing of technical and/or
vocational training in two ways. First, and at least in Francophone West
Africa, they do so through a compulsory contribution by employers. This
contribution, representing a fixed proportion of the firm's wage bill, has
appeared only in recent years--not only in the relatively rich countries,
such as the Ivory Coast, but also in some of the poorest countries of the
region, such as the Central African Republic. The proceeds of this
contribution may be used either to adapt school leavers to their first job
or to give on-the-job training to those already employed. The programs may
be organized by the firms themselves, but firms may also pay schools to
give the training. This is an important financial contribution by firms
2/ There are officially no private schools in P.R. Congo, where educationwas nationalized in 1965.
3/ By "unofficial" we mean schools which are not controlled and/orsubsidized by the government.

- 156 -
to technical and/or vocational education, and it will grow in the future.
But a very small proportion of these funds go to general technical high
schools linked with the ministry of education.
Second, most large firms (whether private, semipublic, or public)
and so-called technical administrations (the ministry of agriculture, the
ministry of public works, the ministry of communications, and so on) have
their own vocational schools in most West African countries. These schools
are generally very good and provide the firms and administrations with most
of the technicians and executives they need.
We may conclude on this point that the contribution of firms to
vocational training is already high in most West African countries, but
that their contribution to the type of education and/or training provided
by establishments under the control of the ministry of education is small
or nil and will most probably continue to remain so in the future.
Local Governments and Communities
This source of financing is apparently already included in the
figures for public expenditures on education (discussed in Parts I and
II). Of course, it is useful for certain purposes to distinguish between
centralized countries, where the central government (through the ministry
of education) assumes most of the public expenditure for education, and
decentralized countries, where regional governments assume most of the
task. As far as cost recovery is concerned, however, the problem is the
same in both cases. It would be absurd for the central government to turn
to local governments, or the inverse, because both levels of government tap
the same source of public revenue.

- 157 -
The problem of the contribution of local communities is
different. Official data (for example, Unesco Statistical Yearbook
data) include such local contributions unless otherwise specified. But
most of the time this source is actually not included in the
official figures on public expenditures, at least when the funds collected at
the local level are not sent to the regional capital to be used by the
regional authorities but are spent where they are collected. This source of
finance may be potentially significant because the inhabitants of a village
or of a town may be more willing to undergo financial sacrifices to open a
new local school or to improve the quality of their school than to give a
faraway administrative body resources to be used without their consent and
probably not in their area. Since the real problem here is that of consent
and of control over the use of the resources, local contribution to education
can be considered as part of the household contribution and will be studied
later.
The "Rest of the World"
This term is used in national accounts to represent all the
countries which have economLc relations with the nation whose accounts are
being drawn. In our case, the "rest of the world" is of interest inasmuch
as it agrees to pay for par: of the educational services rendered in a
given nation at a given time or at least to lend money and/or physical
inputs for that purpose. This source of finance is apparently important
for many poor countries. But how important is it actually? Can it be
expected to increase significantly in the future? These are the two
questions to which we shall address ourselves.

- 158 -
The Facts about Foreign "Aid" to Education
It is very difficult to get a comprehensive and accurate picture
of the foreign aid contribution to education in developing countries
because the aid has many origins and takes many forms (from the "lending"
of technical assistants as teachers to the building of a university).
Information is scattered in many statistical documents and reports.
Usually, different sources give different figures. What we feel to be the
most reliable information available is given in Table 9.2 for most West
African countries.
As can be seen from the table, the bulk of investment in
educational facilities was paid by foreign aid in five of the sixteen
countries concerned, and it is known that this same source represented a
sizable part of total investment in most others. Foreign aid also
contributed a large part of recurrent expenditures at the university level in
several countries. The proportion of the foreign teaching staff, usually
"loaned" under technical assistance schemes, is also impressive. It was
approximately 50% in the second cycle of general education in most countries,
higher in technical education, and still higher in higher education (in which
it almost reached 100% in two countries). But a closer look at the data
shows that, at least from the point of view of cost, the foreign contribution
is generally not as impressive as it looks.
Interpretation of the Facts
First, expatriate teachers are expensive for the host country.
Even leaving aside teachers who have individual contracts with the ministry
of education and whose salary is entirely paid by the host country (and
amounts, on average, to three times the salary of an equivalently qualified
domestic teacher), one must remember that the "technical cooperants" are

- 159 -
Table 9.2: IMPORTANCE OF FOREIGN AID TO EDUCATION IN WEST AFRICA.
FINANCIAL FLOW
COUNTRY Recurrent Expenditure Capital Expenditure FOREIGN STAFFTotal Amount % of Total (% of Total) (% of total)
BENIN 620 million Approx. 10% Almost 100% of building costs 1st cycle secondary: 9%(1975) CFAF in secondary & higher educ. Technical secondary: 75%
Higher: 33%CAMEROON n.a. n.a. n.a. Gen. secondary: 31%(1973) Technical second: 25%CENTRAL 50% in secon- 100% of university expends Gen. second.: 1st cycle:AFRICAN dary; 90% in 22%; 2nd cycle 65%;REPUBLIC university Higher: 95%CHAD (1976) n.a. n.a. Almost 100% More than 80% in second.
& higher educationCONGO (1979) Gen. second.: 55%; tech.
n.a. n.a. n.a. second.: High;Higher:
_______ ______ ______ _______ _______ _______41% (of permanent staff)GABON n.a. n.a. n.a. Gen. second.: 72%(1972) Higher: over 80%GUINEA (1979) 58.1 million 5% High Approx. 10%
sylisIVORY COAST n.a. n.a. n.a. Gen. second.: 38%
Tech second.:65%LIBERIA n.a. n.e. n.a. 6.1%MALI 95% Gen. second: 12%; tech.(1974) n.a. n.a. second.: over 50%;
Higher: over 50%MAURITANIA n.a. n.a. n.a. Gen. sec.:approx. 60%(1977) Tech. sec.: approx. 80%NIGER n.a. n.a. Over 80% Gen. second.: 70%(1976) Average: 50%NIGERIA approx. $20 High in secondary and(1972) million n.a. n.a. higher education
(total exp.)SENEGAL 6 billion 38% at univ. n.a. n.a.(1975) CFAF levelTOGO n.a. 42% during 1st half of 2nd Gen. second. : 20%(1975) plan - 1971-1973UPPER VOLTA Approx. 50%; Approx. 75% 70% in higher education(1976) n.a. over 60% in Approx. 90% in higher educ.
higher Educ.
n.a. Not available.Source: Unesco and World Bank data.

- 160 -
never offered free. The host country usually has to provide housing, to pay
for at least part of the transportation costs, and to pay special bonuses.
Sometimes it has to cover part of these salary.
In West Africa the extreme case is that of the Ivory Coast, which
has to bear 84% of the cost of this type of personnel. 4/ The end result is
that each technical cooperant costs the Ivory Coast about three times as much
as a local teacher at the secondary level and even more in higher education,
so that domestic public expenditure on technical assistance represented in
1980 22% of the total education budget. Even in more "normal" cases where
the "donor" country pays most or all of the basic salary, it has been
estimated that the budgetary cost of one cooperant in the host country is at
least that of an equally qualified local teacher. 5/ This means that this
form of aid is in any case not financial and may even mean extra expenditures
for the receiving country. 6/ Direct foreign financing of education projects
and/or programs is also often much less effective than one would think by
looking only at the provisional cost figures.
4/ This concerns only the French technical cooperants, but they representthe overwhelming majority. The Ivory Coast is trying to renegotiate thisagreement.
5/ See for instance Unesco (on Mauritania, 1978c, Appendix I, p. 2) andUnesco on Senegal (1977a and various reports). The situation does seemlimited to West Africa. Heyneman (1980) shows that, in Malawi between1962 and 1970, foreign teachers cost the Malawi government from 2.5to1.03 times as much as local secondary school teachers, according to theirstatus.
6/ This does not mean, of course, that is it not important and sometimesvital for some developing countries, at this stage, because of the severeshortage of domestic candidates they may encounter, to be able to counton foreign teachers. It means that, from the ministry of education'spoint of view, on the cost side this foreign contribution is at bestclose to zero and in some cases is negative.
- 161 -
First, it is often observed that not all the projects which have
been approved and appear in the plans are effectively implemented.
Second, when a foreign aid agency provides only money for the
first phase of a project, the receiving country sometimes is unable to
interest other donors (contrary to what was expected and planned), and the
building is left uncompleted.
Third, a varying but often important proportion of this foreign
aid is made up of loans. Loans, as a rule, even if they are called "soft,"
are meant to be repaid. Some countries do default, but then they find it
very difficult indeed to obtnin new grants and/or loans. From a long-term
point of view, loans do not constitute a supplementary source of financing.
They may help finance investments at a certain period, but they impose a
heavy burden on the budget whLen repayment starts.
Fourth, even grants are not totally free of charge. They always
entail some degree of dependency on the part of the recipient. Foreign
donors, even when they think only of the interest of the developing
country, tend to think they know best what is good for it; representatives
of donor agencies often tend to give little weight to the historical
background. In other words, what is granted is not necessarily exactly
what is wanted, and the country has to show appreciation.
In spite of its shortcomings, the constraints it entails, and the
fact that it does not always lower the cost to the central government by
much, foreign aid is useful and sometimes indispensable. What are its future
prospects? Judging from recent trends, they are not too bright.

- 162 -
o The proportion of foreign teachers is going down everywhere.
This is in itself a rather good sign because it shows that most
countries have been able not only to find domestic candidates to
keep up with rapidly growing enrollments but also to replace some
of the foreign teachers who were present at the beginning
of the 1970s with local ones. But there are also signs that those
countries which still find it indispensable for some time to recruit
many outside teachers may find it more and more difficult and
expensive to do so.
o The amount of financial aid, globally, is going down. Even
though the education sector may often be less hard hit than
others, the trend is clear.
For example, in the Ivory Coast the percentage represented by
foreign aid in total recurrent expenditures on education went up from 10.4
to 15.4 between 1960 and 1970 but was back at 10.5 in 1975 and had gone
down to 3.2 in 1978. As far as investment expenditures are concerned, the
percentage represented by foreign aid went up from 0 to 47.3 between 1960
1970 but was down to 19.1 in 1975 and to 1.4 in 1978. Unfortunately, this
trend is not due mainly to the fact that the demand on the part of poor
countries is decreasing because they become more able to finance their
school systems themselves. It results from the world economic crisis and
more directly from an increasing squeeze on public budgets everywhere.
Except in a few very limited cases of countries which in the past have seldom
resorted to foreign aid and whose credit ranking is good, the probability of
seeing foreign aid replace even a small portion of the expenditure of the
ministry of education is almost nil in the short and medium term.
- 163 -
Households
As we have seen in Chapter 8, school fees are usually considered
as an inefficient way to cover the cost of education, and any increase of
fee is generally considered regressive. It is for these reasons and
because education was considered in the 1960s as one of the main
prerequisites of economic and social development that most newly
independent nations set up essentially "free" school systems. But the
facts are not so clear and simple. First, one must not forget that
free education has usually meant only the absence of registration fees and
not an education which is costless to the families of pupils. Second,
important stipends and other subsidies are offered students at secondary
and higher levels which may make education not only costless but a source
of profit. It is therefore useful to take the case of primary education
separately.
Primary Education
Primary education iLs supposed to be "free" in most countries. But
a close look at the situation shows two things: it usually entails various
expenditures on the household budget, and it entails costs in excess of
actual expenditures.
The actual expenditures include not only inscription fees but
also other kinds of fees (contributions to parents' associations, insurance
fees, and the like) and expenditures on books and other school supplies.
Although they do not always involve monetary outlays, contributions to
school construction and to the running of school lunch programs should also
be included.

- 1b4 -
Complete data on these items are almost never available. In
Africa, very few special household surveys have been made up to now. From
the evidence gathered from various reports (mainly by Unesco and the World
Bank), one can give the information on West Africa that is listed in Table
9.3.
As can be seen from Table 9.3, although a majority of the
countries of the region do not impose registration fees and although the
fees are very low when they exist, in most cases families do have to cover
the largest part or the totality of the cost of construction of the school
(and generally, in rural areas, of the teacher's house). Furthermore,
expenditures on school supplies are never absent, although they are not
recorded, and special household surveys are needed to capture them.
According to such a survey conducted in Mali, 7/ families spend around US$13
in various fees and from US$25 (rural areas) to US$75 (urban areas) on books,
school supplies, and equipment necessary to go to school (clothing, shoes,
and so on).
If we take these figures as representative of the situation in
most of the countries of the region (and there ar
they are), this shows that sending a child to primary school is a heavy
financial burden, especially for rural families who have a very low
7/ These figures are given by Ibrahim Sidibe (1980) and come from a surveywhich he made himself. This is the only example, to our knowledge, ofsuch a survey in West Africa. Although the survey design is not fullyadequate and the statistical methods used are questionable, these figuresmay be considered as a fair approximation for the region.Another survey undertaken by the Country Program Department of theWorld Bank's Western Africa Regional Office (RPO 672.72) is currentlyunder analysis. It does not provide information on expenditures onbooks and supplies but gives evidence on fees which shows that, althougheducation is supposed to be "free" in public schools, "informal"enrollment fees do exist in most primary schools. Discrepancies betweenthe figures given by the headmaster and by the parents, however, showthat further studies are indispensable.

- 165 -
Table 9.3: EXPENDITURES OF HOUSEHOLDS ON PRIMARYEDUCATION, 1975-80.
MONETARY EXPENDITURESInscription fees Other fees School supplies
COUNTRY (US$ per pupil) (US$ per pupil) & equipment PARTICIPATION IN KIND
BENIN Yes (for alphabeti- Contribution to constructionzation only) n.a. of school
CAMEROOON Yes (amount Yes (amount unknown) Contribution to constructionunknown) n.a. of school
CENTRAL AFR. 0 1 Contribution to constructionREPUBLIC n.a. (apparently only envisaged)CHAD n.a. n.a. n.a. Contribution to construction
& repairs of schoolCONGO 0 n.a. n.a. Contribution to construction
& equipment of schoolGABON 0 n.a. n.a. n.a.GUINEA 0 n.a. n.a. Contribution to construction
of schoolIVORY COAST 0 Yes (Fee to parents Students pay for Contribution to construction
association) books in non-TV of schoolclasses
LIBERIA 0 Between 1 & 2 n.a. n.a.MALI Officially 0 13 75 (urban) Contribution to construction
25 (rural) of school & to cookingschool lunch
MAURITANIA 0 in public schoo s; contribution of p rents to current Contribution to constructionexpenditures of traditional (Moslem) schools of school
NIGER n.a. n.a. n.a. Contribution to constructionand to repair of school
NIGERIA 2 n.a. n.a. n.a.SENEGAL 0 n.a. n.a. Apparently no contribution
to constructionSIERRA LEONE I (only in grades 8 Apparently, contribution to
I and 2) n.a. construction (only_ _ envisaged in the future)
TOGO Between 2 & 3 8 Contribution to constructionThe parents pay 90% of "other recurrent costs" of schooland 22% of total recurrent costs (certain nonqualifiedteachers, "moniteurs de village," are paid by thevillages).
UPPER VOLTA n.a. n.a. [Books & supplies Families generally constructpaid by the and repair the schoolsfamily
n.a. Not available.Source: Unesco and World Bank data.
- 166 -
monetary income. 8/ But the total cost is still higher. An important
part of the cost is made up of the amount the pupils could have earned if
they had engaged in productive activity that they have had to forgo by
choosing to go to school.
Of course, this forgone amount depends upon the effective
opportunities which are open. In developed countries, where primary
education is universal and compulsory and where child labor is not used,
there is no such opportunity, and forgone earnings are therefore equal to
zero. But in the rural parts of poor developing countries, children of
primary school age do help on the farm. 9/ It is very difficult to measure
what is forgone by sending these children to school. But if we reason at the
margin, we may see that the cost may be quite high in some cases. On the one
hand, children of primary school age may not be very productive in farm
activities, but they may free an adult from domestic or other tasks (cattle
herding, for instance) and allow him or her to spend more time in the field.
On the other hand, subsistance farmers have to get a minimum of cash in order
to pay taxes and to purchase the manufactured products they need. But they
can only get this cash through the sale of farm products, and they can only
sell the surplus after they have satisfied their own direct needs. The
8/ This conclusion would probably be even more valid in East Africa thanin West Africa, for two reasons: school fees are usually levied in EastAfrican countries and are on average higher than in Western Africa;boarding schools where parents have to pay for boarding are quitecommon. For instance, it has been estimated that, in Kenya until 1974,25-30% of the funds needed for the primary level were collected fromparents (World Bank Kenya education sector data).
9/ Even more so because in many countries repeating rates are high, so thatmany children already in their teens are still in primary school.

- 167 -
presence of one child (or more) may make the difference--so that the
sacrifice of sending him or her to school, although small when measured in
monetary terms, may be very high when looked at in this perspective.
One may therefore conclude that the cost of primary education to
the household is far from negligible and may actually be quite high if all
the children of a farming couple leave to attend school. It is therefore
difficult to believe that a much larger contribution to the funding of
education can be asked from such families in most cases. Furthermore,
fairly affluent families already often pay much higher fees to the private
schools where they send their children. But registration fees represent
only a small fraction of total cost. If it can be shown to the families
that most of the extra fee would be used to improve the quality of the
teaching (by allowing the purchase of benches, books, and other teacher's
aids), one may expect a fairly low elasticity of demand within a given
limited "fee" range, and we may find ourselves in the favorable situation
portrayed by Birdsall (1982b) and Thobani (1982). But is there any
evidence on elasticity of dem.nd for primary education?
A short methodological comment is in order here. Ideally, to be
able to calculate the elasticity of demand for a product one should have to
observe a situation in which:
o The price of the product has changed as a result of a change in
supply conditions, the demand schedule being unaffected
o The product is bought in small quantities at frequent intervals
o The product comes only, in one uniform quality.

- 168 -
Only in such a situation may we be reasonably sure that the change in
quantity bought is the result of a move along a given demand curve. In
actual situations, the best we may expect to observe is a change in price
and a change in quantity between t1 and t2. We can never be sure that
demand conditions have not changed during that time (in technical terms,
that the demand curve has not shifted). Nor may we conclude that the
quantity demanded will stabilize at the new level, if the good is not
bought every day.
In the case of a service such as education, changes in demand
will take the form of people entering the market or withdrawing from it,
not of "old buyers" buying more or less. The effects of the change in the
administered price take some time to make themselves felt, so that it is
very hazardous to assume that all other things are equal. It is therefore
not surprising that good evidence is scarce on this point. But there are a
few cases which deserve some attention.
First, there are at least two cases where fees were lowered.
This happened in Kenya (in state schools) and in Tanzania in the
mid-1970s. In both instances, the immediate effect was a sizable increase
in new enrollments. This could be interpreted as showing a high elasticity
of demand, but later figures show not only that the increase did not last
but that new enrollments tended afterward to decrease slightly in
percentage of the age group. Further studies should be made to interpret
more cogently these two successive phenomena, but the hypothesis of a
rather high elasticity of demand does seem to be supported by these two
cases.
Second, we have some evidence showing a decrease in (relative)
enrollments in private schools at the same time that new public schools
were opening. This happened during the 1970s in Chad (the percentage
- 169 -
of pupils attending private primary schools dropped from 14% in 1966 to
5.5% in 1976), in the Ivory (Coast (32% in 1959, 15.5% in 1979), and in Togo
(32% in 1976, 25% in 1978), but the opposite happened in Upper Volta.
Third, there is also some indirect evidence about a link between
fees and dropout rates of rural children in Mali and Togo. But none of it
is precise enough to allow any reliable guess about elasticities.
Two conclusions may therefore be drawn: reliable studies of the
determinants of demand for education are badly needed, and the setting up
of fees in excess of a few dollars per year would most likely be
inefficient and unequitable.
Higher Education
Higher education 10! is much more costly than primary education--
both to the state (because higher education needs more and costlier inputs
per unit of output) and to the student (because forgone earnings are always,
in principle, high at this level). But it is also an educational level where
an important part of the cost to the state is made up of the various aid
given to the students.
No comprehensive evLdence can be gathered on this point for an
entire region because sources and kinds of aid vary from one country to the
next. It is therefore useful first to present the type of information
10/ We shall not treat the case of secondary education for two reasons.First, secondary educatiort is made up of different types of schools,imposing different fees and offering different forms of aid to students.Second, as a result, the case of secondary education is something of amix of the cases of primary education and higher education.

- 170 -
needed before trying to make a rough evaluation for the countries where
some information is available.
Information needed. The required data concern costs on the one
hand and receipts on the other. The costs of higher education include:
o Tuition fees
o School expenditures (books, stationery, etc.)
o Living expenditures
o Forgone earnings.
Receipts include:
o Proceeds from student work
o Direct public aid in money (scholarships and other stipends)
o Direct public aid in kind (subsidies to student housing and student
cafeterias, free transport, etc.)
o Public aid to the parents of students (tax rebates).
The difference between costs and receipts represent the true cost of
education to the student. Because information on public aid to the parents
is not available and because one cannot be sure that it is used to finance
university studies, they shall be excluded.
On the side of costs, we know that fees are negligible or at
least very low everywhere in West Africa. Living expenditures are
generally not high and become negative if one substracts from them public
- 171 -
aid in kind to the students. 11/ For instance, in the Ivory Coast in 1978
students contributed 239 million CFAF to their room and board, and the state
contributed 1,921 million. Although one should deduct from that
administrative costs, one may say that Ivorian students paid hardly more than
10% of the cost of their room and board if they chose to eat only in the
student cafeterias. We do not have data on school expenditures, 12/ but
forgone earnings may be evaluated because most secondary school graduates
work in the urban modern sector, where wage schedules are fairly well known.
On the side of receipts, scholarships are known, but public aid
in kind cannot always be isolated in budgetary documents. No precise
information is available on receipts from gainful employment, but it is
well known that African university students generally do not hold jobs.
Evaluation of net cost per student. In the case of the Ivory
Coast, in 1978 per student. 13/ Fees were 4,140 CFAF. For net living
expenditures, the total cost of the Centre National des Oeuvres
11/ Ideally, one should compute net living expenditures--that is, the net(positive or negative) difference between what the student spends forstudent living and what he or she would have spent in "ordinary life."The numerous problems involved in such a calculation will not bementioned here. The interested reader may refer, for a thoroughdiscussion of the problem, to Millot and Orivel (1979).
12/ A survey is under way in Malawi, but none seems to have been made in WestAfrica.
13/ Only university students are considered. We are using data given inEnseignement et Formation en Cote d'Ivoire-Statistiques. Annee Scolaire1978-79 (Republique de Cote d'Ivoire 1978-79). Another report, by J.M.Maigne (1980), uses the 3same sources but gives slightly differentfigures.

- 172 -
Universitaires (CNOU), which runs the cafeterias and student dormitories, was
2,171.2 million CFAF (of which the students paid only 239.3 million).
If we assume that the students could cover their eating and
lodging needs by using CNOU services and that their other living expenses
may be considered as approximately equal to the value of the free
transport permit which they receive (but whose precise amount we could not
obtain), the total net living expenditures are: 239.3 - 1,931.9 = -1,692.6
million CFAF, or approximately -241.800 CFAF per Ivorian student.
For forgone earnings, the average gain of a secondary school
graduate was approximately 1.5 million CFAF per year.
For scholarships, each student gets approximately 475,000 CFAF
per year.
The balance sheet per student is therefore the following:
o If we consider only expenditures:
Receipts = 475,000
Expenditures = approx. 38,000
Net surplus = 437,000 CFAF
o If we look at costs:
Incomes = 475,000 + 241,800 = 716,800
Outgo = 40,000 + 1,500,000 = 1,540,000
Net cost = 823,200.

- 173 -
If we consider that:
o This net cost is probably overestimated because we have not
taken into account the rising unemployment rate of secondary
school graduates
o The amount received as direct financial aid is approximately
equal to one-third of the average salary of a secondary school
graduate and more than two times GNP per capita
o Students have living expenses which are less than one-tenth of
those of active people both because of the high subsidies and
because the total cost of food and housing is less in student
accommodations than the price of the same services on the
market, we may then safely conclude that students are very
privileged indeed.
It is impossible to make such calculations for other West African
countries, but evidence on the level of scholarships and other aid suggests
that the situation is more or less the same in many countries. 14/ If we
put these observations in balance with the well-known facts that students
come, in their majority, froma relatively well-to-do families and that in most
of these countries there is already (or there soon will be) a surplus of
university graduates, we come to the conclusion that a reform of the funding
of higher education is in order.
14/ For instance, at the end of the 1970s the average scholarship for auniversity student in the; Central African Republic amounted toapproximately one-half of the salary of a secondary school graduate inthe public sector, more than one-half in Niger, three-fifths in Mali,one-third in Senegal. In percentage of GNP per capita the averagescholarship amounted to: 160% in Senegal, 700% in Mali and the CentralAfrican Republic, 800% in Niger.

- 174 -
This is admitted in most of these countries, and new schemes,
mostly based on a selective scholarship policy, are being studied almost
everywhere. But the data we produce show more clearly than before:
o How profitable it is to be a student at a time when there
is a surplus of graduates
o Not only that students do not pay for their tuition but that
their cost of living is only about one-tenth of what it
is to other people.
If we recall that the percentage of public expenditure on education
allotted to higher education is between 15 and 25 in most of these
countries, and that scholarship and welfare services always represent an
important percentage of total recurrent expenditures, 15/ this is clearly a
case where a participation of students and/or their families would be both
possible, important as a cost recovery device, and socially equitable.
School Production
The debate over the introduction of productive work in the school
curriculum is almost as old as the debate about what is a "relevant" school
15/ The figures given in the Unesco Statistical Yearbooks (chapter 4, table44: "Public current expenditure on education: distribution by level ofeducation and by purpose") usually overestimate this percentage forcountries in which an important proportion of the higher educationteaching staff is foreign and composed of technical assistants because,usually, the portion of their salaries and other amenities paid by thehost country does not appear in the ministry of education budget.

- 175 -
curriculum. Opinions about the virtues of such reforms are as divergent
today as they were more than a century ago. But the fact is that in recent
years productive work has been introduced, or at least recommended, in
basic education in most developing countries. The official rationale
behind this reform, although it varies from country to country, seems in a
majority of cases to be that such work increases the relevance of the
curriculum. But the sale of the products of this activity is also
generally mentioned as a waty to help finance recurrent costs and quality
improvements.
Up to now, the economic record of these innovations in Africa is
mixed. Many reports mention the same drawbacks.
o Teachers have not received the proper training and tend to
scorn such work activities.
o There are no funds to buy implements, which therefore have to be
borrowed, which in turn prevents using more up-to-date methods.
o These work activities are not taken into account when
the decision to promote (or hold back) a student is taken.
The end result is low productivity and little to sell. Many
studies of actual programs dlraw similarly pessimistic conclusions. They
generally show that these reforms induce a decline in general achievement
because time is taken away from teaching. Surveys of the large-scale
reforms conducted in Tanzania, Cuba, and China do not support optimism.
But strictly from the point of view of cost recovery, two studies of
experiments still in their first stage in two West African countries give
fairly positive results and therefore must be mentioned.
o In Benin, a study made in 1975-76 on a sample of 60 primary
schools (Unesco 1978b, Annex 73) showed that: (1) receipts from
sales of products were four times as high as production costs;

- 176 -
(2) net income represented around 50% of current school expenditures
(salaries excluded); net income represented approximately
US$2.5, which is more than the average school fee where it exists.
o In Mali, a survey of 39 schools comprising 213 classes made in
1978-79 (Unesco 1976, p. 34 and Annex 3.12) showed a net benefit of
3,202,305 Malian francs (MF), or 336 MF per pupil (approximately
equal to US$0.80).
Because the reports which give these figures also insist on the
many shortcomings of these experiments, these results can be taken as
rather encouraging, since they seem to imply that there is some possibility
of covering recurrent costs with the proceeds of sales and of perhaps
financing more and better teaching aids. But the overall feeling about the
effects of introducing productive work in schools is too pessimistic for
one to draw this type of conclusion without relying on new and more
extensive observations.
Private Schools
Another, although indirect, way for the government to reduce the
financial burden of public education is to encourage the development of
private schools. In this way it may stabilize the education budget, and
perhaps even improve the quality of public schools, by spending as much as
before but on a smaller number of students. As we have seen earlier, this
may even reduce the social cost of education if further studies confirm
that the cost per student is lower in private schools.
- 177 -
But before endorsing such a policy, some remarks are in order.
O This would run count:er to the general trend in primary
education, where with one exception (that of Upper Volta) the
percentage of private schools is decreasing.
o It might be impossible in upper secondary education, where the
proportion of private schools is already high in many countries.
o It would be politically impossible unless the ministry of education
were assured of being able to exert strict control over curriculum
and qualification of teachers.
o Control usually has for its counterpart subsidies, so that the
transfer is not as fLnancially advantageous as one might think.
O This is made even more true by the fact that trends can be altered
only if financial inducements are given in the form of higher
subsidies (which would probably have to apply also to existing
private schools).
o Private schools usually raise fairly high fees; the danger is
therefore to create a segregation between private schools attended
by the children of the rich (because quality is higher) and public
schools where the children of the poor would go and whose quality
could not be increased unless the education budget were increased.
These remarks show that this type of solution to the budget squeeze is not
necessarily feasible; nor is it always advisable for equity reasons. But
they also show that it should not be put aside out of hand without giving it
serious consideration. 16/
16/ For a balanced appraisal of the pro's and con's, see J. Meerman (1980).


ANNEX
SUPPORTING DATA
FOR PART II


- 181 -
Table A.1: EAST AFRICA: EVOLUTION OF NATIONAL EFFORT FOR EDUCATION(% OF GNP SPENT PUBLICLY ON EDUCATION). CURRENT EXPENDITURES,
1970-78.
COUNTRY 1970 1974 1976 1978
BOTSWANA 4.4 3.21 4.24 6.67
BURUNDI 2.3 2.25 2.24 2.64
ETHIOPIA 2.2 2.05 2.06 a/ 1.98
KENYA 3.8 5.25 5.50 5.27
LESOTHO :3.3 n.a. n.a. n.a.
MADAGASCAR 3.6 2.69 3.85 5.46 b/
MALAWI 3.0 2.14 2.06 a/ 2.01
MAURITIUS 3.4 2.44 4.75 5.61
RWANDA 2.3 3.76 2.01 2.04
SOMALIA 1.8 2.56 3.55 1.80 c/
SUDAN 2.7 4.95 n.a. n.a.
SWAZILAND 4.5 4.79 2.50 n.a.
TANZANIA 3.7 4.04 d/ 4.04 4.26
UGANDA 3.2 2.74 2.58 1.51 d/
ZAIRE 5.9 5.48 d/ n.a. 5.10
ZAMBIA 3.6 3.86 5.14 4.60
n.a. Not available.Source: See Table 3.1 in text.
a/ 1975.b/ 1977.c/ Ratio computed from sources different from sources for earlier
years.d/ 1973.
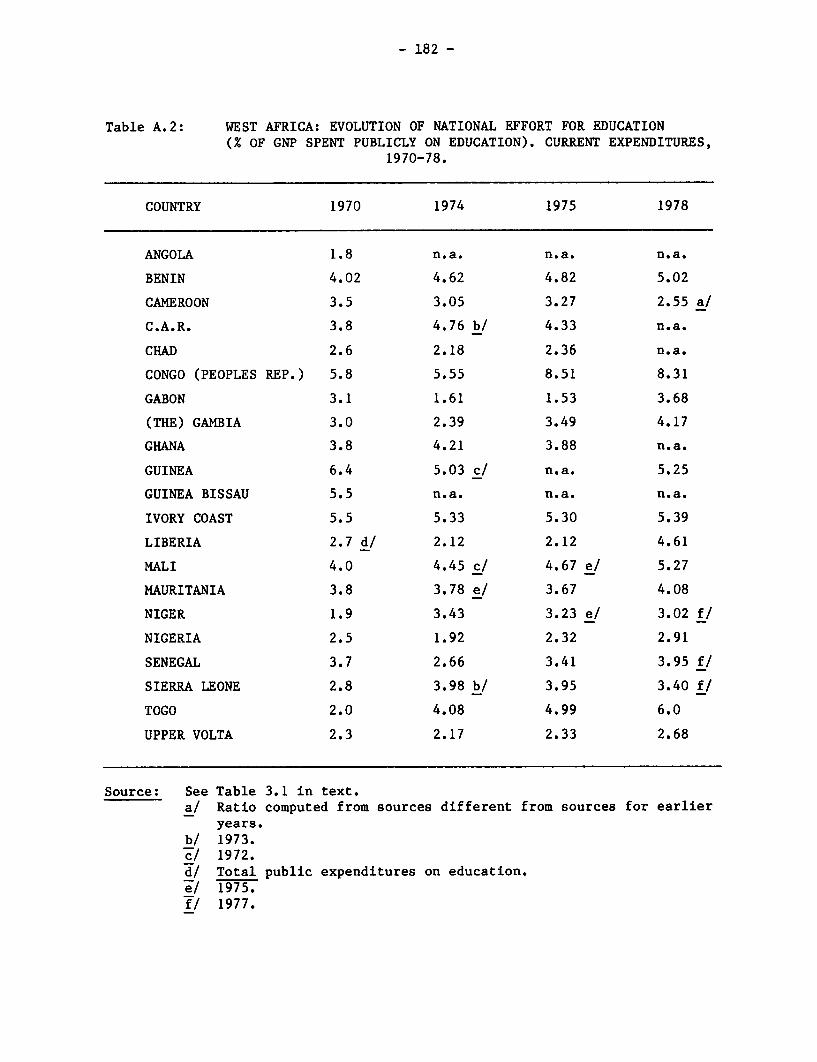
- 182 -
Table A.2: WEST AFRICA: EVOLUTION OF NATIONAL EFFORT FOR EDUCATION(% OF GNP SPENT PUBLICLY ON EDUCATION). CURRENT EXPENDITURES,
1970-78.
COUNTRY 1970 1974 1975 1978
ANGOLA 1.8 n.a. n.a. n.a.
BENIN 4.02 4.62 4.82 5.02
CAMEROON 3.5 3.05 3.27 2.55 a/
C.A.R. 3.8 4.76 b/ 4.33 n.a.
CHAD 2.6 2.18 2.36 n.a.
CONGO (PEOPLES REP.) 5.8 5.55 8.51 8.31
GABON 3.1 1.61 1.53 3.68
(THE) GAMBIA 3.0 2.39 3.49 4.17
GHANA 3.8 4.21 3.88 n.a.
GUINEA 6.4 5.03 c/ n.a. 5.25
GUINEA BISSAU 5.5 n.a. n.a. n.a.
IVORY COAST 5.5 5.33 5.30 5.39
LIBERIA 2.7 d/ 2.12 2.12 4.61
MALI 4.0 4.45 c/ 4.67 e/ 5.27
MAURITANIA 3.8 3.78 e/ 3.67 4.08
NIGER 1.9 3.43 3.23 e/ 3.02 f/
NIGERIA 2.5 1.92 2.32 2.91
SENEGAL 3.7 2.66 3.41 3.95 f/
SIERRA LEONE 2.8 3.98 b/ 3.95 3.40 f/
TOGO 2.0 4.08 4.99 6.0
UPPER VOLTA 2.3 2.17 2.33 2.68
Source: See Table 3.1 in text.a/ Ratio computed from sources different from sources for earlier
years.b/ 1973.c/ 1972.d/ Total public expenditures on education.e/ 1975._/ 1977.
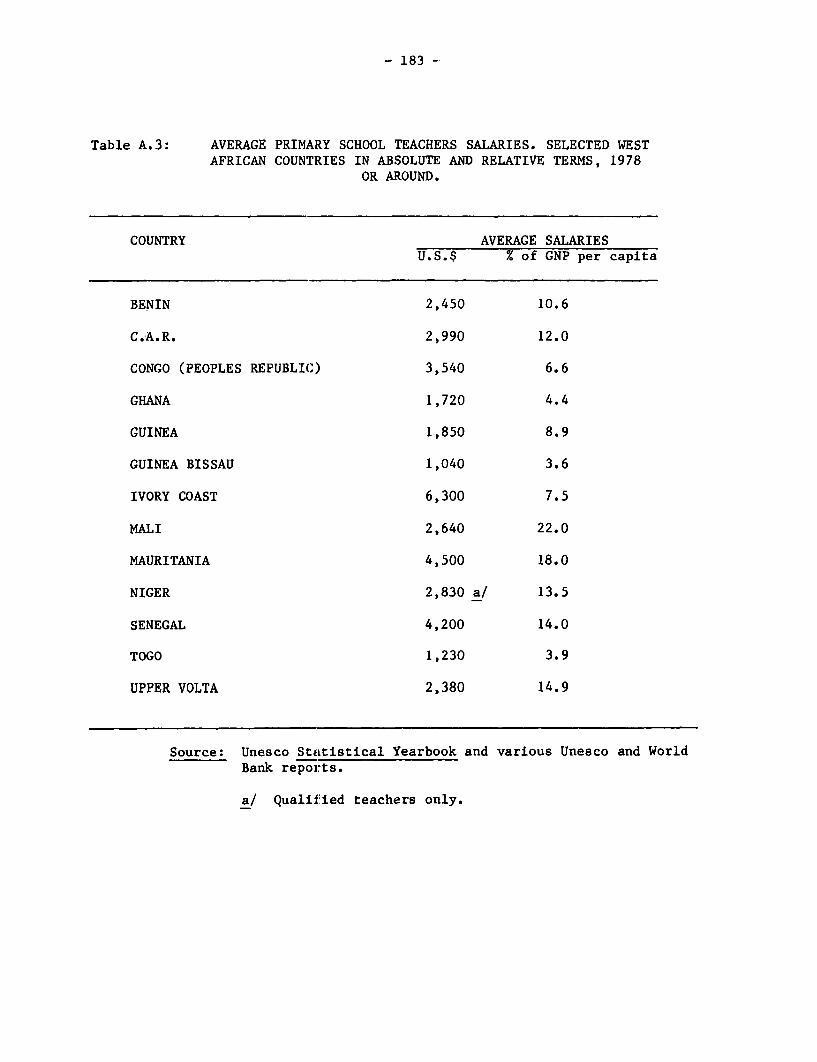
- 183 -
Table A.3: AVERAGE PRIMARY SCHOOL TEACHERS SALARIES. SELECTED WESTAFRICAN COUNTRIES IN ABSOLUTE AND RELATIVE TERMS, 1978
OR AROUND.
COUNTRY AVERAGE SALARIESU.S.$ % of GNP per capita
BENIN 2,450 10.6
C.A.R. 2,990 12.0
CONGO (PEOPLES REPUBLIC) 3,540 6.6
GHANA 1,720 4.4
GUINEA 1,850 8.9
GUINEA BISSAU 1,040 3.6
IVORY COAST 6,300 7.5
MALI 2,640 22.0
MAURITANIA 4,500 18.0
NIGER 2,830 a/ 13.5
SENEGAL 4,200 14.0
TOGO 1,230 3.9
UPPER VOLTA 2,380 14.9
Source: Unesco Statistical Yearbook and various Unesco and WorldBank reports.
a/ Qualified teachers only.

- 184 -
Table A.4: PUPIL-TEACHER RATIOS AT THE PRIMARY LEVEL IN WEST AFRICA.
COUNTRY 1960 1965 1970 1975 1978
BENIN 41 42 44 48 56
CAMEROON n.a. 47 48 51 51
C.A.R. 58 56 64 67 65(1977)
CHAD n.a. 83 65 77 n.a.
CONGO (PEOPLES REP.) 53 60 62 59 53
EQUAT. GUINEA 76 62 n.a. 57(1973) n.a.
GABON n.a. 39 46 48 46
(THE) GAMBIA 31 31 27 26 26
GHANA n.a. 29 30 30 27
GUINEA 66 41 44 40 38
GUINEA BISSAU 39 30 45 34 33(1979)
IVORY COAST 41 47 45 44 41
LIBERIA 32 32 36 41 43
MALI 45 41 40 41 43
MAURITANIA 20 20 24 35 44
NIGER n.a. 42 39 39 41
NIGERIA 30 33 34 n.a. n.a.
SENEGAL n.a. 43 45 49 43
SIERRA LEONE 36 32 32 32 32(1977)
TOGO 63 50 58 60 55
UPPER VOLTA 47 49 44 47 52

- 185 -
Table A.5: PRIMARY EDUCATION. INDICES OF QUALITY.SELECTED WEST AFRICA COUNTRIES.
PercentageCOUNTRY Of unqualified Of classroom con- Of pupils having
teachers a/ structed with non- textbooks b/durable material
BENIN 55 40 Very low
C.A.R. 48 High Very low
CHAD 70 65 Very low
CONGO(PEOPLES REPUB.) 14 n.a. Low
IVORY COAST 2.5 n.a. Very high
MALI n.a. 52 Low
MAURITANIA 45 n.a. n.a.
NIGER 42 12 c/ n.a.
SENEGAL 5 16 d/ n.a.
SIERRA LEONE 61 High Low
TOGO 42 41 n.a.
UPPER VOLTA 2 High Very low
Source: Unesco and World Bank data.
a/ For Francophone countries, the percentage covers all the teachers whoare not "instituteurs" or "instituteurs-adjoints".
b/ It is impossible to have precise data at the national level. In anycase, the overall average is not sufficient because the situation varieswidely from region to region and from cities to villages, the latterbeing usually much more poorly equipped.
c/ Percentage of thatch-roofed classes.d/ Percentage of classes classified as being in "bad shape."

- 186 -
Table A.6: EVOLUTION OF EXPENDITURES PER STUDENT IN HIGHER EDUCATION.SELECTED SUB-SAHARAN AFRICAN COUNTRIES IN SELECTED YEARS
(1976 U.S. DOLLARS).
CAMEROON CONGO IVORY COAST KENYA LIBERIA
1964: 3,094 1965: 842 1965: 5,390 1965: 3,149 1965: 4,156
1965: 4,013 1970: 1,204 1970: 3,031 1970: 1,260 1967: 2,533
1968: 3,320 1971: 2,391 1973: 4,460 1971: 1,266 1975: 1,295
1970: 3,009 1972: 2,377 1975: 6,422 1972: 1690 1978: 3,100
1971: 2,721 1975: 4,755 1976: 5,067 1975: 2,441
1976: 3,634 1977: 5,325 1976: 2,347
1978: 3,547 1978: 6,489
GHANA MADAGASCAR MALAWI TANZANIA ZAMBIA
1965: 5,833 1965: 249 1965:10,036 1965: 5,514 1970: 8,316
1968: 6,128 1970: 192 1970: 3,658 1966: 4,675 1975: 2,558
1970: 5,605 1971: 1,599 1971: 3,604 1970: 4,150 1977: 2,396
1971: 4,965 1972: 1,728 1972: 3,639 1971: 4,320 1978: 2,565
1973: 3,583 1975: 997 1975: 3,027 1972: 3,094
1974: 4,982 1976: 951 1975: 5,139
1975: 4,248 1977: 1,317 1976: 3,533
1977: 5,510
Source: Unesco Statistical Yearbook (various years).

- 187 -
Table A.7: EVOLUTION OF THE COST OF PRIMARY EDUCATION PER PUPIL.SELECTED SUB-SAHARAN COUNTRIES, 1970-78 (1978 U.S. DOLLARS)
COUNTRY 1970 1978 Trend
BENIN 51 50C.A.R. n.a. 48 n.a.CONGO (PEOPLES REP.) 52 68 +GAMBIA 29 71 a/ +GHANA 23 67 +IVORY COAST 74 186 +NIGERIA 36 57 +NIGER 79 77 b/TOGO 24 25MALI 47 c/ 64 +SIERRA LEONE 20 c/ 31 +UPPER VOLTA 33 d/ 45 +
BOTSWANA 42 103 +BURUNDI 30 c/ 45 +ETHIOPIA 34 22KENYA 34 36MADAGASCAR 27 30 +MALAWI 19 12 a/MAURITIUS 49 170 +RWANDA 13 23 +SOMALIA 107 44SWAZILAND 31 d/ 39 +UGANDA 39 30 e/TANZANIA 36 29ZAMBIA 66 60
+ Positive; - negative; = change less than 5%.
Source: Unesco Statist:ical Yearbook (various years) except Niger(1977) and Sierra Leone (1978); where World Bank data wereused.
a/ 1979.b/ 1977.c/ 1969._/ 1968.e/ 1975.


REFERENCES
Assie, N.T. 1982. "Educational Selection and Social Inequality in Africa: TheCase of the Ivory Coast." Ph.D. dissertation. The University of Chicago.
Avalos, B., and Haddad, W. 1979. A Review of Teacher Effectiveness Researchin Africa, India, Latin America, Middle East, Malaysia, Philippines andThailand: A Synthesis of Results. Ottawa: International DevelopmentResearch Centre.
Balow, I.H. 1969. "A Longitudinal Evaluation of Reading Achievement in SmallClasses." Elementary English, vol. 46 (February), pp. 186-87.
Beltramo, J.O. 1975. Les Depenses d'Enseignment des Collectivites Locales enFrance. Cahier de L'Iredu no. 14. Dijon: Institut de Recherche surl'Economie de l'Educat.Lon.
Berstecher, D. 1970. Costing Education Wastage: A Pilot Simulation Study.Paris: Unesco.
Birdsall, Nancy. 1982a. "The Impact of School Availability and Quality onChildren's School Attainment in Brazil." World Bank Population and HumanResources Division Discussion Paper no. 82-3. Washington, D.C.:Population, Health and Nutrition Department.
. 1982b. "Strategies for Analyzing Effects of User Charges in theSocial Sectors." Washington, D.C.: World Bank, Country PolicyDepartment, July. Restricted circulation.
Bottomley, A., and Dunworth, J. 1974. "Rate of Return Analysis and Economicsof Scale in Higher Education." Socio-economic Planning Science, vol. 8.
Bowman, M.J., ed. 1982. Collective Choice in Education. Kluwer-NijhoffPublishing.
Central Advisory Council for Education (U.K.). 1967. Children and TheirPrimary Schools [Plowden Report]. London: Her Majesty's StationeryOffice.
Coleman, J.S., and others. 1966. Equality of Educational Opportunity.Washington, D.C.: U.S Government Printing Office.
Dougherty, K. 1981. "After the Fall: Research on School Effects since theColeman Report." Harvard Education Review, vol. 51, pp. 301-07.
Dunworth, J., and Bottomley, A. 1974. "Potential Economies of Scale at theUniversity of Bradford." Socio-economic Planning Science, vol. 8.
- 189 -
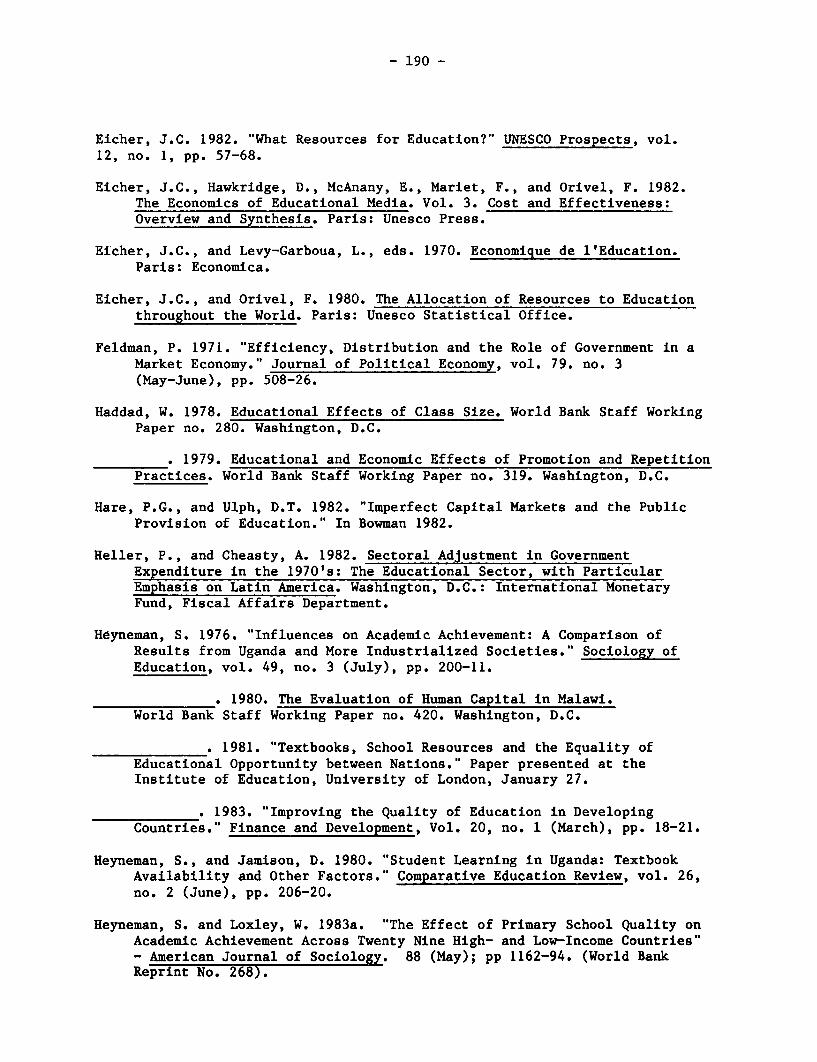
- 190 -
Eicher, J.C. 1982. "What Resources for Education?" UNESCO Prospects, vol.12, no. 1, pp. 57-68.
Eicher, J.C., Hawkridge, D., McAnany, E., Mariet, F., and Orivel, F. 1982.The Economics of Educational Media. Vol. 3. Cost and Effectiveness:Overview and Synthesis. Paris: Unesco Press.
Eicher, J.C., and Levy-Garboua, L., eds. 1970. Economigue de l'Education.Paris: Economica.
Eicher, J.C., and Orivel, F. 1980. The Allocation of Resources to Educationthroughout the World. Paris: Unesco Statistical Office.
Feldman, P. 1971. "Efficiency, Distribution and the Role of Government in aMarket Economy." Journal of Political Economy, vol. 79. no. 3(May-June), pp. 508-26.
Haddad, W. 1978. Educational Effects of Class Size. World Bank Staff WorkingPaper no. 280. Washington, D.C.
. 1979. Educational and Economic Effects of Promotion and RepetitionPractices. World Bank Staff Working Paper no. 319. Washington, D.C.
Hare, P.G., and Ulph, D.T. 1982. "Imperfect Capital Markets and the PublicProvision of Education." In Bowman 1982.
Heller, P., and Cheasty, A. 1982. Sectoral Adjustment in GovernmentExpenditure in the 1970's: The Educational Sector, with ParticularEmphasis on Latin America. Washington, D.C.: International MonetaryFund, Fiscal Affairs Department.
Heyneman, S. 1976. "Influences on Academic Achievement: A Comparison ofResults from Uganda and More Industrialized Societies." Sociology ofEducation, vol. 49, no. 3 (July), pp. 200-11.
. 1980. The Evaluation of Human Capital in Malawi.World Bank Staff Working Paper no. 420. Washington, D.C.
. 1981. "Textbooks, School Resources and the Equality ofEducational Opportunity between Nations." Paper presented at theInstitute of Education, University of London, January 27.
. 1983. "Improving the Quality of Education in DevelopingCountries." Finance and Development, Vol. 20, no. 1 (March), pp. 18-21.
Heyneman, S., and Jamison, D. 1980. "Student Learning in Uganda: TextbookAvailability and Other Factors." Comparative Education Review, vol. 26,no. 2 (June), pp. 206-20.
Heyneman, S. and Loxley, W. 1983a. "The Effect of Primary School Quality onAcademic Achievement Across Twenty Nine High- and Low-Income Countries"- American Journal of Sociology. 88 (May); pp 1162-94. (World BankReprint No. 268).

- 191 -
Heyneman, S., and Loxley, W. 1983b. "The Distribution of PrimarySchool Quality within High- and Low-Income Countries." ComparativeEducation Review/27 (February) pp 108-118.
Heyneman, S.; Jamison, D.T.; and Montenegro, X. Forthcoming - "Textbooksin the Philippines: Evaluation of the Pedagogical Impact of aNation-Wide Investment" Educational Evaluation and Policy Analysis.
Hultin, M., and Jallade, J.P. 1975. Costing and Financing Education in LDC's:Current Issues. World Bank Staff Working Paper no. 216. Washington, D.C.
Husen, T. 1979. The School :Ln Question. New York: Oxford University Press.
Jencks, C., and others. 1972. Inequality: A Reassessment of the Effect ofFamily and Schooling iI America. New York: Basic Books.
Kenny, L.W. 1982. "Economies of Scale in Schooling." Economics of EducationReview, vol. 2, no. 1 (Winter), pp. 1-24.
Kravis, I., Heston, A., and Summers, R. 1982. World Product and Income:International Comparisons of Real Gross Product. Baltimore: JohnsHopkins University Press.
Kravis, I., and Lipsey, R. 1982. "The Diffusion of Economic Growth in theWorld Economy, 1950-1980." Paper presented at the Conference onInternational Comparisons of Productivity, American EnterpriseInstitute, Washington, D.C., September 30-October 1.
Levin, H. 1980. "Education Production Theory and Teacher Inputs." InBirdwell, C., and Windham, D., eds. The Analysis of EducationalProductivity, vol. 2. Cambridge, Mass.: Ballinger.
Loxley, W. (1983). "The Impact of Primary School Quality on Learning inEgypt." International Journal of Educational Development. Vol. 3 (1):pp. 33-45.
Loxley, W. and Heyneman, S. [981. "The Influence of School Resources onLearning Outcomes in El Salvador" - Washington, D.C. EducationDepartment. The World Bank - (Mimeographed)
Maigne, J.M. 1980. "Etude sur les couts du systeme d'Education Formation.Abidjan: Ministere de l'Economie, des Finance et du Plan, March.
McMahon, W.W., and Geske, T.G., eds. 1982. Financing Education. Glencoe:University of Illinois IPress.
Meerman, J. 1980. "Paying for Human Development." In P.T. Knight, ed.Implementing Programs of Human Development. World Bank Staff WorkingPaper no. 403. Washington, D.C., July.
Millot, B., and Orivel, F. 1979. L'Economie de l'Enseignement Superieur.Paris: Cujas.

- 192 -
Neumann, P.H. 1980. Publishing for Schools: Textbooks and the Less DevelopedCountries. World Bank Staff Working Paper no. 393. Washington, D.C.
Peaker, G.F. 1971. The Plowden Children Four Years Later. London: NationalFoundation for Educational Research in England and Wales.
Prewitt, K. 1974. "Education and Social Equality in Kenya." In Court, D.,and Ghai, D.P., eds. Education, Society and Development: NewPerspectives from Kenya. Nairobi: Oxford University Press.
Psacharopoulos, G. 1980. Higher Education in Developing Countries: A Cost-Benefit Analysis. World Bank Staff Working Paper no. 440. Washington,D.C.
Republique de Cote d'Ivoire. 1978-79. Enseignement et Formation en Coted'Ivoire--Statistiques. Ann Scolaire 1978-79. Abidjan; Minist re de1'Education. Restricted circulation.
Republique du Mali. 1981. L'Education au Mali. Problemes, Perspectives etPriorities. Bamako: Ministere de l'Education Nationale (in cooperationwith Unesco), May. Restricted circulation.
Samuelson, P.A. 1958. "Aspects of Public Expenditures Theories." Review ofEconomics and Statistics, vol. 40, pp. 332-38.
Schramm, W. 1977. Big Media, Little Media: Tools and Technologies forInstruction. Beverly Hills, Calif.: Sage.
Schiefelbein, E., and Farrell, J.P. 1974. "Expanding the Scope of Education-al Planning: The Experience of Chile." Interchange, vol. 2, pp. 18-30.
Sidibe, I.A. 1980. Couts et Financement de l'Education au Mali. Bamako:Ministere de l'Education Nationale.
Thobani, M. 1983. Charging User Fees for Social Services - The Case ofEducation in Malawi - World Bank Staff Working Paper No. 572.Washington, D.C.
Unesco. 1973. "GABON. Developpement.de l'Education. Perspectives et Projets."2 vols. Paris, Educational Financing Division, June.
. 1975a. "TCHAD. Education et Developpement Rural." Paris, EducationalFinancing Division, July.
. 1975b. "TOGO. Reforme de l'Education en Vue de l'Egalite des Chanceset du Developpement Economique." Paris, Educational Financing Division,November.
. 1976. "Republique du MALI. L'Education en Perspective. DynamiqueOptions Projets." Paris, Educational Financing Division, April.
- 193 -
. 1977a. "SENEGAL. Developpement de l'Education: Analyse et Perspec-tives." Paris, Educational Financing Division, June.
. 1977b. "COTE D'IVOIRE. Education: Developpement et Reforme." 2 vol.Paris, Educational Financing Division, August.
. 1978a. "NIGER. Analyse et Developpement de l'Education." Paris, May.
. 1978b. "BENIN. Propositions pour le Developpement de 1'Education."Paris, Educational Financing Division, October.
. 1978c. "MAURITANIA. Education-Problemes et Perspectives." Paris,Educational Financing Division, November.
. 1979. "EMPIRE CENI'RAFRICAIN. Education et Developpement." Paris,Educational Financing Division, February.
. Various years. Statistical Yearbook. 1969, 1974, 1975, 1976, 1977,1978-79, 1980, 1981. Paris.
_ . 1980. Wastage in Primary and General Secondary Education: AStatistical Study of Trends and Patterns in Repetition and Drop-outRates. Paris: Office of Statistics, November.
. 1982a. "Republique Populaire du CONGO. Education: Priorities etPerspectives." Paris, Educational Financing Division, March.
. 1982b. Public Expenditure on Education in the World, Regional andCountry Trends, 1970-1'979. STE/FIN/4. Paris: Office of Statistics,October.
World Bank. 1980a. Education. Sector Policy Paper. Washington, D.C.,April.
. 1980b. World Development Report 1980. New York: Oxford UniversityPress.
. 1983. China: Socialist Economic Development. Vol. 3. The SocialSectors, Annex I, Education. Washington, D.C.
. Various years. World Bank Atlas (1977, 1978, 1979, 1980, 1981).Washington, D.C.
Zymelman, M. 1976. Patterns of Educational Expenditures. World Bank StaffWorking Paper no. 246. Washington, D.C., November.


World Bank EducationEDUCACION Wadi D. Haddad, coordinatingPublications author
of Related ___. Emphasizes the pervasive role of edu-cation in development and drawvs ex-
Interest tensivelv on the Bank's experience ineducation for two decades and itsclose collaborative ties with other in-ternational agencies, individuals, and
Alternative Routes to Formal institutions of developing countries.Education: Distance Teaching -t, Sector Policy Paper 1980. 143 pageh (in-for School Equivalency clu ,p liidin 79 annexes, map)Edited by Hilary Perraton >'z'- -¢' - i _ Stock Nos. BK 9071 (En'lishi), BK 9072The demand for education is outstrip- (French), BK 9073 (Spanish),$5ping the capacitv of manv countries tobuild schools or to recruit and payteachers. To meet this demand and to Basic Education and Spaniisl Prograrnas de foruiacion profes-provide access to education to individ- Agricultural Extension: Costs, sional. su evalliacion econonica Editorialuals who are unable to attend regular Effects, and Alternatives Tecnos, l977.schools, educators throughout the Hilarv Perraton and others ISBN 84-309-0747-5, Stock No IB 0536world are trving to develop alterna- $6.tives to the traditional classroom One Addresses the effectiveness of usingof these alternatives-known as dis- mass media for agricultural extensiontance teaching--combines correspond- and basic education. Includes a review The Educational Use of Massence courses with radio or television of the literature on the effectiveness of Mediabroadcasts and occasional face-to-face agricultural extension and on the use Gloria Feliciano, and othersstudv of mass media for rural education. Staff Working Paper No 491 1981 l29
Case studies from Malawi, Cameroon,Does this alternative wsork' Is It and Lesotho examine institutions us- pages (Including bibiograpiy).cheaper? This book is the first attempt ing mass media in widely different Stock No. WP 0491 55to answer such kev questions. It exam- waysines the varietv of'wavs in w hich dis- Education and Basic Humantance teaching has been used, pro- Staff lVorking Paper No. 564. 7983 308 Needsvides comparisons of specific cases, piages. Abdun Nooranalyzes their costs, and considers the ISBN 0-8213-0176-4 Stock No WP 0564. Staff Working Paper No. 450 1981. 68effectiveness of distance teaching ver- $15. pages (including 2 annexes).sus traditional education.
Charging User Fees for Social Stock No. WP 0450. S3.The Johns Hopkins Uni'crsitv Press. 1982. Services: The Case of Education and Income344 pages Education in Malawi Edited bv Timothv King; prepared
LC 82-7233. ISBN 0-8018-2587-3. Stock Mateen Thobani bv Marv Jean Bowman and othersNo lI-I 2587 $35 hardcover An analvsis of one wvav to reduce the Staff Working Paper No. 402. 1980 323
probIlEm of recurrent expenditure in pages (includinig appendix, bibliography)social sector services Argues that the Stock No WP 0402. $15
Attacking Rural Poverty: How deterioration or curtailment of servicesNon-Formal Education Can resulting from low user charges affects The Effects of Education onHelp the poor disproportionately, and con- HealthPhilip H. Coombs and siders conditions under which raising HealtHManzoor Ahmed charges would increase efficiency Susan H. Cochrane and othersEducational efforts outside the formal while reducing the financing problem. Staff Working Paper No. 405. 7980. 95school system that offer potential for Staff Wtorking Paper No. 572. 1983. 35 pages.rural development and productivity. pages. Stock No. WP 0405. $3.
ISBN 01-8213-0179-9. Stock No. WP 0572.The Johns Hopkins ULniv'ersity Press, 1974; $3. The Evaluation of Human3rd paperback printing, 1980. 310 pages Capital in Malawi(including 3 appendixes, references, index). The Economic Evaluation of Stephen P. Heyneman
ISBN 0-8018-1601-7. Stock No IH 1601 Vocational Training Programs Staff Working Paper No 420. 1980. 707$10 95 paperback Manuel Zvmelman pages (including references, 21 tables, 6Spanish: La lucha contra la pobreza rural A methodology for appraising the cost anmiexes).el aporte de la educdcion no formal Edito- effectiveness of alternative methods of Stock No. WP 0420. $5rial Teczos, 1975. industrial training in developing coun-ISBN 84-309-0559-6, Stock No. IB 0525. tries. Farmer Education and Farm510 95 The Johns Hopkins University Press, 1976 Efficiency
134 pages (including chart. 3 appendixes, Dean T. Jamison and Lawrence J.bibliography). Lau
Prices subject to change without notice LC 76-4868. ISBN 0-8018-1855-9. Stock This book complements earlier studiesand may vary by country. No. JH Z855. $6 paperback by reviewing existing literature on the
relation between farmer education and ing and improvement of the vocational Staff Working Paper No. 624. 1983. 216farm efficiency. The authors then are training system. pages.able to confirm these earlier findings-- Staff Working Papers No. 554. 1983. 41 ISBN 0-8213-029Z4.Stock No. WP 0624.which strongly suggest that more edu- pae.$5.cated farmers are more productive, pages.particularly where new inputs and ISBN 0-8213-0144-6. Stock No. WP 0554. M Fmethods are available-by using new $3 Mexico's Free Textbooks:techniques to examine new data sets Nationalism and the Urgencyfrom Korea, Malaysia, and Thailand. The Influence of School to EducatePrice data from Thailand are used to Peter H. Neumann andtest the effect of education on the abil- Resources in Chile: Their Maureen A. Cunninghamity of a farmer to adjust the prices and Effect on Educational Staff Working Paper No. 54Z. 1982. 148composition of his output to the pre- Achievement and Occupational pages.vailing prices. Attainment IB -2300-.SokN.W 52The Johns Hopkins University Press, 1982. Ernesto Schiefelbein, Joseph SStock o. WP 0541.310 pages (including bibliography, appen- Farrell, and Manuel Sepulveda-dixes, index). StuardoLC 81-47612. ISBN 0-8018-2575-X, hard- Checks out impact of investments in Primary Schooling andcover. Stock No. IH 2575. $27.50. school resources as reflected by text- Economic Development: AHigher Education in book use, academic achievement and Review of the Evidence
Higher Education in success in the labor market. For maxi- Christopher ColcloughDeveloping Countries: A Cost- mum benefit, investments should be Staff Working Paper No. 399 1980 31Benefit Analysis preceded by study of teacher attitudes pages (including references, 5 tables).George Psacharopoulos toward use of resources, be applied Stok NStaff Working Paper No. 440. 1980. 129 early in the educational process and oc o. WP 0399. $3.pages (including references, tables). take into account malnutrition and Primary School Participation
other external problems. Piand IScInernl Distribuption iStock No. WP 0440. $5. Staff Working Paper No. 530. 1983. 118 and Its Internal Distribution in
pages. Eastem AfricaNEW ISBN 0-8213-0145-4.Stock No. WP 0530. Jack van L. Maas and Bert Criel
$5. Staff Working Paper No. 521. 1982. 105How Secondary School pages.Graduates Perform in the ISBN 0-8213-0055-5. Stock No. WP 0511.Labor Market: A Study of NEW $5IndonesiaDavid H. Clark Manpower Issues in Publishing for Schools:Investigates whether or not higher sec- Educational Investment: A Textbooks and the Lessondary education should be expanded Consideration of Planning Developed Countriesin Indonesia. Compares employment Processes and Techniques Peter H. Neumannpattems and earning rates of gradu- George Psacharopoulos, Keith Staff Working Paper No. 398. 1980. 81ates who enter the labor market withgthat of people having less education. Hinchliffe, Christopher Dougherty, pages (including 2 appendixes).Results of the National Labor Force and Robinson Hollister Stock No. WP 0398. $3.Surveys suggest that academic senior Outlines for educators and economistssecondary schools are the best invest- a variety of approaches to improve The Use of First and Secondment except in local situations where manpower analysis. Advocates replac- Languages in Primaryspecialized secondary schools deserve ing a dominant technique with a well- Education: Selected Casea higher priority. structured planning methodology. StudiesStaff Working Paper No. 615. 1983. 88 Recommends a broad approach to be Nadine Dutcher
pages. ~~~~~~~~used to analyze the relationship be-Pages. tween manpower and the educational Staff Working Paper No. 504. 1982. 65ISBN 0-8213-0260-4.Stock No. WP 0615. system. Examines planning tech- pages (including annex, references). Eng-$3. niques, three points of view (country, lish and Spanish
technical assistance agency, lending Stock No. WP 0504. $3Human Resources Planning in agency), and the role of manpowerthe Republic of Korea: analysis planning in developing coun- Worker-Peasant Education inImproving Technical Education tries. Contends that forcing all man- the People's Republic of Chinaand Vocational Training power questions into any single ana- Nat J. Colletta
Kye-Woo Lee ~~~~~~lytical framework results in low-qualityKye-Woo Lee analysis and low-quality educational Staff Working Paper No. 527. 1982. 94Provides a basis for human resources investments. Cites a need for continu- pages.planning during a period of far-reach- ity of manpower analysis through the ISBN 0-8213-0050-4. Stock No. WP 0527ing structural change. Focuses on labor development of a planning methodol- $3.market problems and their solution ogy. Suggests that such analvsisthrough institutional hnkages between should go beyond identifying and pre- Prices subject to change without noticeformal education and vocational train- paring specific education projects. and may vary by country.
The World BankPublications Order Form
SEND TO: YOUR LOCAL DISTRIBUTOR OR TO WORLD BANK PUBLICATIONS(See the other side of this form.) P.O. BOX 37525
WASHINGTON, D.C. 20013 U.S.A.
Date
Name Ship to: (Enter if different from purchaser)
Title Name
Firm Title
Address Firm
City State_ Postal Codee Address
Country Telephone l ) _ City State_ Postal Code
Purchaser Reference No. Country 'Tilephone
Check your method of payment.Enclosed is my rI Check 0 International Money Order OUnesco Coupons C International Postal Coupon.Make payable to World Bank Publications for U. S. dollars unless you are ordering from your local distributor.
Charge my OI VISA L MasterCard L AmerAcan Express OI Choice. (Credit cards accepted only for orders addressedto World Bank Publications.)
Credit Card Account Number Expiration Date Signature
El Invoice me and please reference my Purchase Order No.
Please ship me the items listed below.
Customer InternalStock Number Autbor/ Title Routing Code Quantity Unit Price Total Amount 5
All prices subject to change. Prices may vary by country. Allow 6-8 weeks for delivery.
Subtotal Cost $
Ttail copies _ _ Air mail surcharge if desired 1$2.00 each) $
Postage and handling for more than two complimentary items ($2.00 each) S
Total $
ISRD.053 Thank you for your order.

Distributors of World Attn. Mr Giancarlo Bigazzi Attn Mr J M HernandezDistributors ofbl WorldVia Lamarmora 45 Castello 37Bank Publications 30121 Madrid
ARGENTINA ilorence SRI LANKA AND THE MALDIVESCarlos Hirsch, SRL, JAPAN Lake House BookshopAttn. Ms Monica Bustos Eastern Book Service Attn: Mr. Victor WalataraFlorida 165 4° piso Attn. Mr. Terumasa Hirano 41 Wad Ramanavake MawathaGaleria Guemes 37-3, Hongo 3-Chome, Bunkvo-ku 113 Colombo 2Buenos Aires 1307 Tokyo SWEDENAUSTRALIA, PAPUA NEW GUINEA, KENYA ABCE Fritzes Kungl, HovbokhandelFIJI, SOLOMON ISLANDS, Africa Book Services (E.A ) Ltd Attn Mr Eide SegerbackWESTERN SAMOA, AND Attn. Mr M B. Dar Regeringsgatan 12, Box 16356VANUATU P O. Box 45245 S-t10327 StockholmThe Australian Financial Review Nairobi SWITZERLANDInformation Ser%ice (AFRIS) KOREA, REPUBLIC OF Librairie PavotAttn Mr. David Jamieson Pan Korea Book Corporation Attn .Mr Henri de Perrot235-243 Jones Street Attn M91r Yoon-Sun Kim 6. rue GrenusBroadwav P 0 Box 101, Kwanghwamun 1211 GenevaSydney, NSW 20001 Seoul TANZANIABELGIUM MALAYSIA Oxford University PressPublications des Nations Unies Uni ersitv of Malava Cooperative Attn Mr Anthonv TheoboldAttn Mr Jean de Lannov Bookshop Ltd Maktaba Road, IP.O Box 5299ax. du Rot 202 Attn Mr Mohammed Fahim Htj Dar es Salaam1060 Brussels Yacob THAILANDCANADA P 0 Box 1127, Jalan Pantai Baru Central Department Store, Head OfticeLe Diffuseur Kuala Lumpur Attn Mrs atanaAttn Nlrs. Suzanne Vermette MEXICO 306 Silom RoadC P 85, Boucherville J4B 5E6 INFOTEC BangkokQuebec Attn. Mr Jorge Cepeda Thailand NManagement AssociationCOSTA RICA San Lorenzo 153-I , Col del Valle, Attn. Mrs. SunanLCbrerla TrCos Deleg Benito Juarez 308 Silom RoadAttn. Mr rugo Chamberlai 03100 Mexico. D.F BangkokCalle 11-13. Av. Fernandez Guell NIIDDLE EAST TUNISIASan Jose Mliddle East Mfarketing Research Societe Tunisienne de DiffusionDENMARK Bureau Attn: Mr Slaheddine Ben HamidaSanfundslitteratur Attn, r George \dssilou 5 A enue de CarthageAttn Mr Wilfried Roloft MktaSios BId 3 TunisRosenderns Alle 11 aNiaosta TURKEYDK-1970 Copenhagen V. Cyiros Haset Kitapevi AS.EGYPT, Arab Republic of (Branch otfices in Bahrain, Greece, AttnN Mr Izzet lherelAl Ahram Nlorocco, Kuwait, United Arab 469, Istiklal CaddesiAl Galaa Street Emirates. Jordan) Bevoglu-IstanbulCairo NETHERLANDS UNITED KINGDOM AND
MBE BV NORTHERN IRELANDFINLAND Attn Mr Gerhard van Bussell Microinto Ltd.Akateeminen Kir;akauppa Noorderwal 38, Attn: Mr. Rov SelwynAttn Mr Kari Litmanen 7241 BL Lochem Newman Larie, P 0 Box 3Keskuskatu 1, SF-00100 NORWAY Alton, Hampshire GU34 2PGHelsinki 10 Johan Grundt Tanum A S. EnglandFRANCE Attn Ms. Randi NlikkelborgWorld Bank Publications P o Box 1177 Sentrum UNITED STATES66, avenue dIlena Oslo I 600 19th Street, N W
75116 Paris ~~~~~~PANAMA Washington, D.C 20433GERMANY, Federal Republic of Ediciones Libreria Cultural Panamena (Postal address P.O Box 37525UNO-Verlag Attn Mr Luis Fernandez Fraguela R. Washington, D.C. 20013, U S AAttn. Mr. Joachim Krause Av 7, Espana 16 Baker and Tavlor CompanvSimrockstrasse 23 Panama one 1 501 South Gladiola AvenueD-5300 Bonn I PHILIPPINES Momence, Illinois, 60954HONG KONG, MACAU National Book Store 380 Edison WavAsia 2000 Ltd Attn Mrs Socorro C. Ramos Reno, Nevada: 89564Attn Ms. Gretchen Wearing Smith 701 Rizal Avenue 50 Kirby Avenue6 Fl, 146 Prince Edward Road Manila Somermville, New Jersey, 08876Ko%vloon PORTUGAL Commerce, Georgia 30599INDIA Livraria PortugalUBS Publishers' Distributors Ltd. Attn Mr Antonio Alves Martins Bernan AssociatesAttn Mr D P Veer RRua Do Carmo 70-74 9730-E George Palmer Highway5 Ansari Road, Post Box 7015 12t0 Lanham, Maryland, 20761New DelhR 110002 B i bon Blackwell North America, Inc(Branch oftices in Bombav, Bangalore, SAUDI ARABIA 1001 Fries Mill RoadKanpur, Calcutta. and Madras) Jarir Book Store Blackwood, New Jersey 08012INDONESIA Attn Mr Akram Al-Agil Sidnev Kramer BooksPt Indira Limited P O Box 3196 1722 fI Street, N WAttn: Mr. Bambang Wahvudi Rivadh Washington, D C 20006Jl, Dr Sam Ratulangi No 37 SINGAPORE, TAIWAN, BURMA United Nations Bookshop
Information Publications Private, Ltd United Nations PlazaIRELAND Attn Ms Janet David New York, N Y. 10017TDC Publishers 02-06 Ist Floor, Pei-Fu IndustrialAttn Mr. James Booth Building VENEZUELA12 North Frederick Street 24 New Industrial Road LAbre Jua del EsteDublin I Singapore Attn Mr Juan PericasITALY Avda Francisco de .Miranda, no 52ITAL Y ob o msi n ra S n o P u d-rSPAIN Edificio Gai an, Aptdo 60 337Licosa Commissionariai Sansoni SPA 1M,undii-Prensa Libros, S A Caracas 1060-A

HG 3881.5 .W57 W67 NO.655c.3
EICHER, JEAN CLAUDE.
EDUCATIONAL COSTING AND, FINANCING IN DFVELOPING

The World Bank
Headquarters European Office Tokyo Office1818 H Street, N.W. 66, avenue d'16na Kokusai BuildingWashington, D.C. 20433, U.S.A. 75116 Paris, France 1-1 Marunouchi 3-chomeTelephone: (202) 477-1234 Telephone: (1) 723-54.21 Chiyoda-ku, Tokyo 100, JapanTelex: VUI 64145 WORLDBANK Telex: 842-620628 Telephone: (03) 214-5001RCA 248423 WORLDBK
Telex: 781-26838Cable Address: INTBAFRADWASHINGTONDC