iwmi anik bhaduri, upali amarasinghe, tushaar shah, bk anand benefits and cost of irrigation water...
TRANSCRIPT

IWMIAnik Bhaduri, Upali Amarasinghe,
Tushaar Shah, BK Anand
Benefits and Cost of Irrigation Water Transfers:
A case study of Polavaram

Objectives - Irrigation cost/benefit assessment
• Main objective – Assess direct/indirect irrigation benefits and costs of the
Polavaram project
• Specifically, net benefits due to irrigation water transfers on
– Crop production – Livestock – Fisheries – Forward linkages (agro based industries, transporation,
storage etc.)– Backward linkages (Farm equipment s, agriculture inputs
supplies, Equipment maintenance etc. )

Outline - Presentation
• What Polavaram irrigation proposes?• Present status of irrigation in RBC (en-route link) and
LBC• Emerging cropping patterns and irrigation• Net benefits of irrigation – source wise• Cost/benefits of the irrigation water transfers

Does irrigation benefits exceed the cost? It does, but under different circumstances
Scenario I
Scenario II
Scenario III
Scenario IV
B/C ratio 1.04:1 1.36:1 1.47:1 1.24:1
IRR 6.38 7.87 8.45 7.40
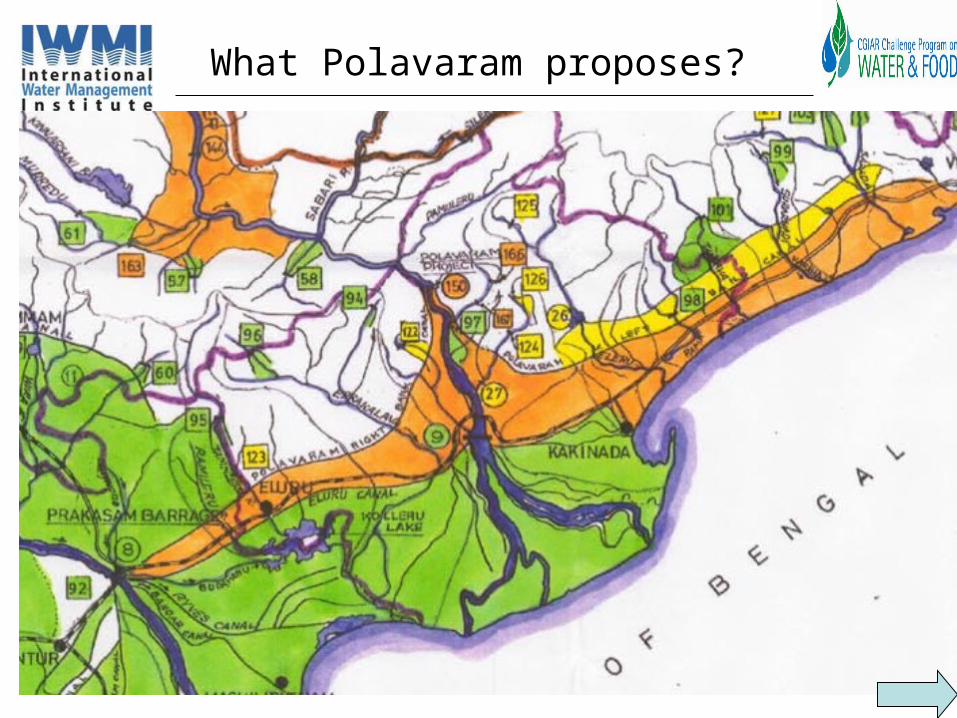
What Polavaram proposes?

What Polavaram proposes?
Transfer or use 287 tmc of water

Cost/benefit methodology
• Conceptual and empirical Domain of the analysis
– Assess benefits of irrigation in LBC & RBC
• Valuation of ex-ante benefit analysis -
Reference condition
– Area that could be like Polavaram command after irrigation
water transfers
• Net value added per ha or m3 of after water transfers
– Requires the differences irrigated and rainfed crop yields, input
application, other cost of production, land rent etc.

Cost/benefit methodology
• Sample of 1000 farmers
– 37 mandals, 50 villages
– 521 farmers in the RBC, 479 farmers in the LBC
Category Land Holding ,Ha Percentage of farmers
Marginal <1 15.46Small 1.0-2.0 26.81
Semi Medium 2.0-4.0 29.89Medium Large 4.0-6.0 10.31Large >6.0 17.53

Current status of irrigation
← 94% of the RBC crop
land are irrigated
← Groundwater is the
dominant source
63.82%
20.55%
15.63%
Groundwater Rainfed Tank
Left Canal Command Area
Proportion of Irrigated area Source wise
→ 80% of the LBC crop
lands are irrigated
→ Groundwater is the
dominant source

Current status of irrigation
63% 5.37%
19.56%
12.07%
GW Depth more than 25 m and less than 50 m
Area wise Composition of Groundwater Depth
GW Depth more than75 m and less than 100 m
GW Depth more than 50 m and less than 75 m
GW Depth more than 100m
.5102%
38.27%
5.102% 16.84%
39.29%
GW Depth less 25 m
GW Depth more than 25 m and less than 50 m GW Depth more than 50 m and less than 75 m
GW Depth more than 75 m and less than 100 m GW Depth more than 100 m
Number of Farmers wise Composition of Groundwater Depth

64.4%
26.04%
9.56%
Annual Crops Kharif Rabi
Right Canal Command Area
Composition of Cropped area
Current status of irrigation
6.25%1.563%.3125%4.531%
40%
47.34%
Cashew Eucalyptus LemonPalmoil Sugarcane Tobacco
Right Canal Command Area
Cropping Pattern -Annual Crops

Current status of irrigation
32.25%
64.68%
3.077%
Annual Crops Kharif Rabi
Left Canal Command Area
Composition of Cropped area
5.344%
13.74%
7.634%
72.52%
.7634%
Banana Cotton PalmoilSugarcane Teak
Left Canal Command Area
Cropping Pattern -Annual Crops

61.54%
38.46%
Paddy Sugarcane
Groundwater Depth more than 25m & less than 50m
Cropping Pattern
18.6%
58.14%
23.26%
Paddy Sugarcane Tobacco
Groundwater Depth more than 50m & less than 75m
Cropping Pattern
6.3%
27.33%
19.88%
46.58%
Lemon Paddy SugarcaneTobacco
Groundwater Depth more than 75m & less than 100m
Cropping Pattern
6.3%
27.33%
19.88%
46.58%
Lemon Paddy SugarcaneTobacco
Groundwater Depth more than 75m & less than 100m
Cropping Pattern
53.84%21.68%
17.91%
Banana Black gram Green gramLemon Paddy Palm moilSoya beans Sugarcane Tobacco
Groundwater Depth more than 100mCropping Pattern
53.84%21.68%
17.91%
Banana Black gram Green gramLemon Paddy Palm moilSoya beans Sugarcane Tobacco
Groundwater Depth more than 100mCropping Pattern

0 5,000 10,000 15,000 20,000Net value of Paddy (Rs/ha)
Tank
Surface
Rainfed
Groundwater
Conjunctive
Current status of irrigation
0 2,000 4,000 6,000 8,000Yield (kg/ha)
Tank
Rainfed
Pump irrigation
Groundwater
Conjunctive
Canal
RabiKharif
RabiKharif
RabiKharif
RabiKharif
RabiKharif
RabiKharif
Season and Source of Irrigationwise
Yield of Paddy Yield

Current status of irrigation
0 10,000 20,000 30,000 40,000Net Value (Rs/ha)
in Different categories of GW level
Net value (Rs/Ha) in Kharif
More than 25 m and less than 50 m
More than 50 m and less than 75 m
More than 75 m and less than 100 m
More than 100 m
10000
20000
30000
40000
Ne
t Va
lue
(R
s/H
a)
0 50 100 150Depth Of GW (meters)
Between GW Depth and Net Value
Fitted Relationship
Hig
her
Cap
acity
Pum
ps+
Div
ersi
fied
cr
oppi
ng p
atte
rn10000
20000
30000
40000
Ne
t Va
lue
(R
s/H
a)
0 50 100 150Depth Of GW (meters)
Between GW Depth and Net Value
Fitted Relationship
Hig
her
Cap
acity
Pum
ps+
Div
ersi
fied
cr
oppi
ng p
atte
rn
← Net value is high in areas with GW water depth 75-100m
→ They have high capacity pumps, and diversified cropping patterns

Polavaram project irrigation
315140175Cultivable Command Area
(‘000 Ha)
291129162Net irrigated area (‘000 Ha)
OverallRight Canal AreaLeft Canal Area
315140175Cultivable Command Area
(‘000 Ha)
291129162Net irrigated area (‘000 Ha)
OverallRight Canal AreaLeft Canal Area
Source: Indirasagar Multipurpose Project Environmental Impact Assessment Report (2005)-Government of Andhra Pradesh

Benefits and costs
25% reduction in Groundwater irrigated areas in the right canal command area
Scenario-IV
Present cropping pattern for annual cropsScenario -III
Different Cropping Pattern - Paddy-Kharif: Maize Rabi: Annual crops: Sugarcane and chillies
Scenario-II
proposed cropping pattern from the Andhra
Pradesh Environmental Impact Assessment Report: Paddy-Kharif:
Pulses Rabi: Annual crops: Sugarcane and chillies.
Scenario-I
DescriptionScenarios

Benefits and Cost
Scenario I II III IIAnnual Increase in the Value of crop Output -Left Bank In crorescrores
236.34236.34 276.81276.81 325.60325.60 236.34236.34
Annual Increase in the Value of crop Output -Right Bank In crorescrores
83.4283.42 141.61141.61 127127 146.16146.16
Annual Increase in the Value of crop Output - Total Command Area In crorescrores
319.76319.76 418.43418.43 452.60452.60 382.50382.50
Net Gain with Multiplier Effect ( 1.20) In crorescrores
383.71383.71 502.11502.11 543.12543.12 459.00459.00
Increase in Value (Rs)
Per cubic meter of water
0.770.77 1.001.00 1.091.09 0.920.92

Benefits and Cost analysis - Assumptions
• Assumptions-– Life of the Project-100yrs– Depreciation rate 1% per year– Rate of Interest –8%– Period of Construction-15 yrs– Rehabilitation Cost-None– Ignores the positive externalities of groundwater– Recharge and negative externalities of water logging
and salinity.

Cost of supplying irrigation
Estimated Total Cost of The Project for Irrigation (In crores)
4064.294064.29
Operation and Maintenance Cost (In Crores)
2.912.91
Depreciation Cost (In Crores)
40.6440.64
Annual Cost (In Crores) 368.70368.70

Benefit cost ratio and IRR
Scenario I II III IITotal Command Area
1.04:11.04:1 1.36:11.36:1 1.47:11.47:1 1.24:11.24:1
Right Bank 0.62:10.62:1 1.06:11.06:1 0.95:10.95:1 1.09:11.09:1
Left Bank 1.38:11.38:1 2.44:12.44:1 2.64:12.64:1 1.38:11.38:1
Internal Rate of Return (%)
6.386.38 7.877.87 8.458.45 7.407.40

3.58
5.25
3.95
5.52 5.26 6.24
0
2
4
6
Litres /day /animal
Groundwater Rainfed Surface
Source of Irrigation Wise Milk Production
Cattle Buffalo
Livestock benefits
1550.67
6453.4
2488.73
6218.55 5513.33
10755.8
0
2,000
4,000
6,000
8,000
10,000
Rs/animal/year
Groundwater Rainfed Surface
Source of Irrigation wise Net Value of Livestock per year
Cattle Buffalo
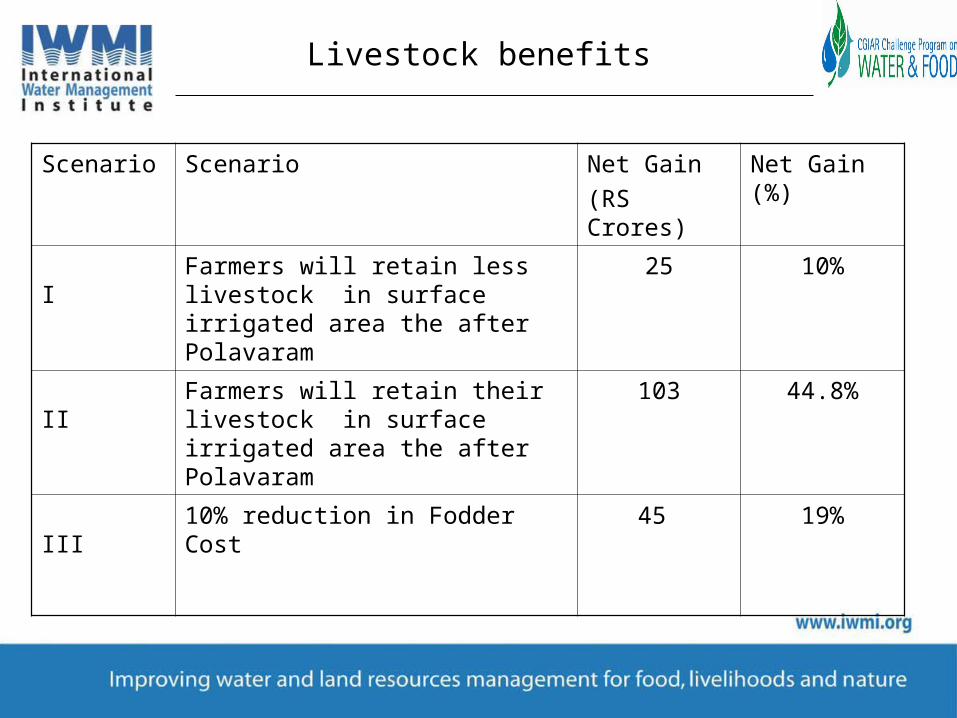
Scenario Scenario Net Gain
(RS Crores)
Net Gain (%)
I Farmers will retain less livestock in surface irrigated area the after Polavaram
25 10%
II Farmers will retain their livestock in surface irrigated area the after Polavaram
103 44.8%
III 10% reduction in Fodder Cost 45 19%
Livestock benefits

Salient Observation and Policy Implications
• Much of cultivated area in the proposed command area is already
irrigated, and particularly in the right canal command area.
• Ground water is the most dominating form of irrigation in the
command area.
• Farmers are using groundwater to grow high valued annual crops.
• Present cropping intensity is high as 165% in the right command
area due to extensive cultivation of annual crops using
groundwater irrigation

• Higher benefits if the farmers continue to grow annual crops and benefit
cost ratio will be more favorable for the implementation of the project.
• Polavaram Dam may also be useful in GW sustainability where much of the
groundwater resource is used to grow high valued annual crops ,
particularly in the rabi season.
• Livestock benefits will be substantial if the farmers retain their livestock even
after the introduction of surface water or with a reduction in fodder cost.
• Livestock can increase the overall benefits of the Polavaram dam by 8 to 32
% depending upon different scenarios.
• The gains will be maximum if the farmers grow maize for livestock feed in
the rabi season and retain their livestock.
Salient Observation and Policy Implications

Thank you