iv. calculating population to provider ratios dental iv-1
TRANSCRIPT
IV. CALCULATING POPULATION TO PROVIDER
RATIOS
Dental
IV-1
CALCULATING POPULATION TOCALCULATING POPULATION TO PROVIDER RATIOS PROVIDER RATIOS
(DENTAL)
Objective:
Participants will understand how to:
1) Identify all dental providers, 2) Calculate Full-Time-Equivalency (FTE) rates, and 3) Determine the population to provider ratios for
dental geographic and population designations
IV-2
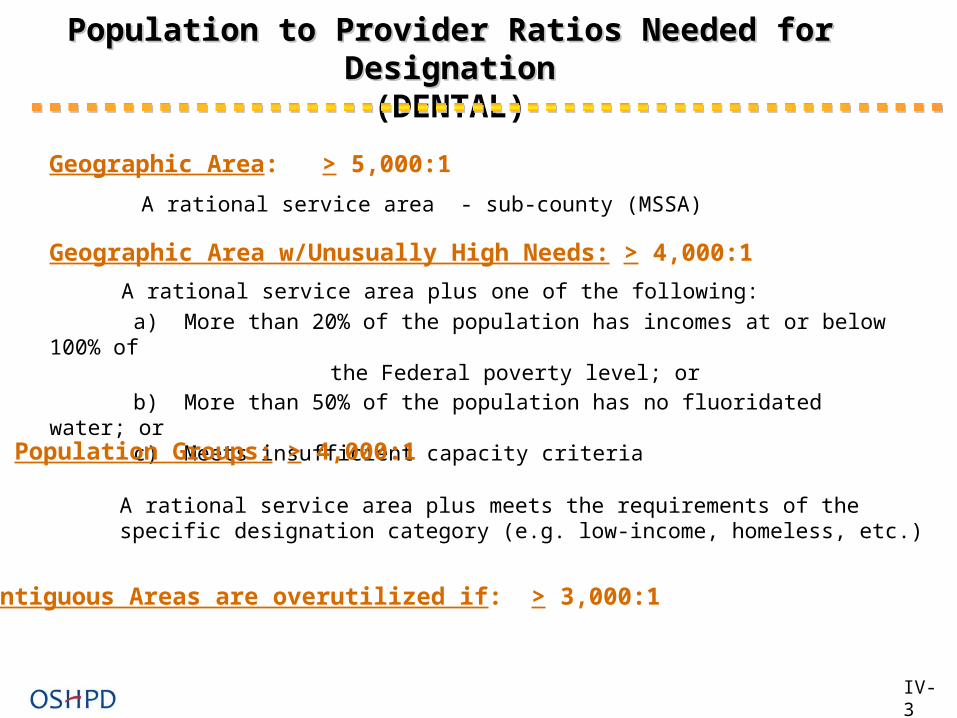
Population to Provider Ratios Needed for DesignationPopulation to Provider Ratios Needed for Designation(DENTAL)
Geographic Area: > 5,000:1
A rational service area - sub-county (MSSA)
Geographic Area w/Unusually High Needs: > 4,000:1
A rational service area plus one of the following:
a) More than 20% of the population has incomes at or below 100% of the Federal poverty level; or
b) More than 50% of the population has no fluoridated water; orc) Meets insufficient capacity criteria
Population Groups: > 4,000:1
A rational service area plus meets the requirements of the specific designation category (e.g. low-income, homeless, etc.)
Contiguous Areas are overutilized if: > 3,000:1
IV-3
POPULATION SIDE OF THE RATIOPOPULATION SIDE OF THE RATIO(Same as Primary Health Care)
IV-4
________________:
PROVIDER SIDE OF THE RATIOPROVIDER SIDE OF THE RATIO
:
IV-5
___________

STEPSSTEPS
1) Identify all general practice dentists in the area tobe designated.
2) Determine the number of hours each dentist works in direct patient care office serving the population to be designated.
3) Calculate the FTE for each dentist serving the population to be designated.
4) Calculate the population to provider ratio.
IV-6
STEP 1STEP 1
IdentifyIdentify all general practice all general practice dentistsdentists in the area to be designated. in the area to be designated.
IV-7

List all dentists (D.D.S. or D.M.D.) who:
1) Provide direct patient care in the service area, and
2) Practice principally in general dentistry or pedodontics (pediatric dentistry)
Do not include: Oral surgeons, orthodontists, or other specialists
Include in your list: Dentists who serve in the NHSC Scholarship or Federal Loan Repayment Programs (exclude their FTEs) Dentists who serve in the State Loan Repayment Program Dentists who are Federal providers (e.g., Commissioned Officers at Indian Health Services or Bureau of Prisons) Dentists who are planning on retiring but are still seeing patients Dentists engaged solely in administration, research, or teaching Locum tenens serving less than 1 year
IV-8
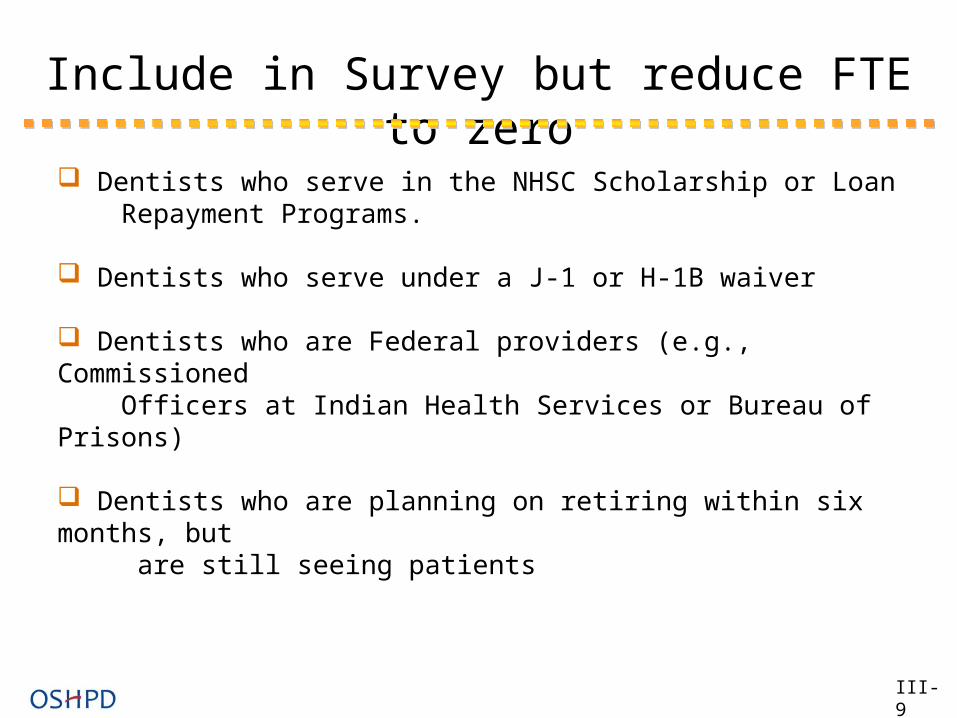
Dentists who serve in the NHSC Scholarship or Loan Repayment Programs. Dentists who serve under a J-1 or H-1B waiver Dentists who are Federal providers (e.g., Commissioned Officers at Indian Health Services or Bureau of Prisons)
Dentists who are planning on retiring within six months, but are still seeing patients
Include in Survey but reduce FTE to zero
III-9
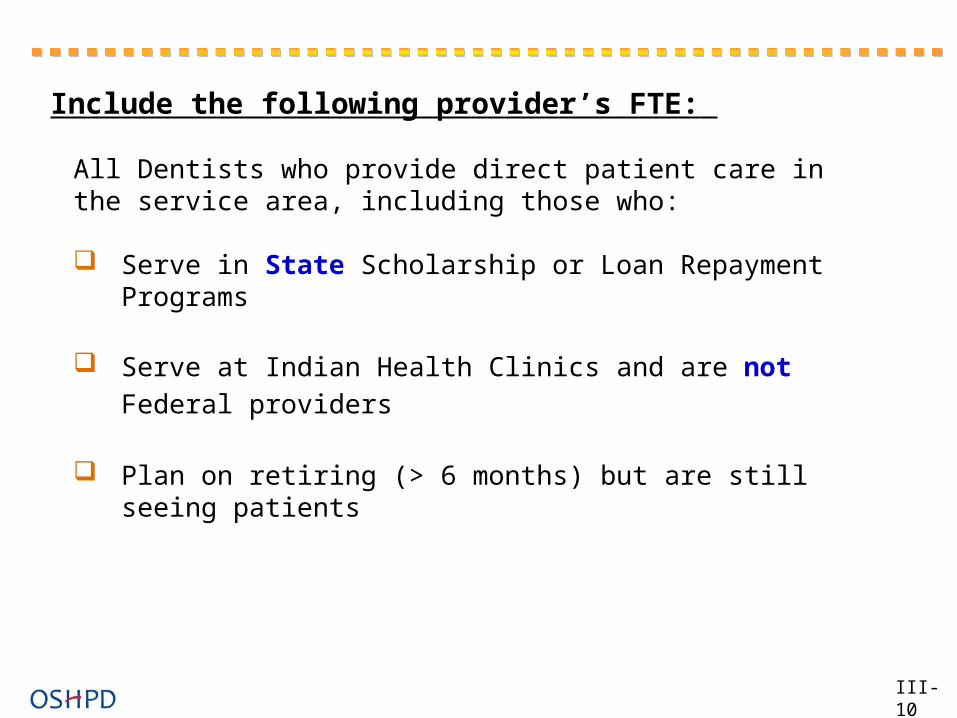
Include the following provider’s FTE:
All Dentists who provide direct patient care inthe service area, including those who:
Serve in State Scholarship or Loan Repayment Programs
Serve at Indian Health Clinics and are not Federal providers
Plan on retiring (> 6 months) but are still seeing patients
III-10

Sources of Provider DataSources of Provider Data
State Licensure Lists:http://www2.dca.ca.gov/pls/wllpub/wllqryna$lcev2.startup?p_qte_code=DDS&p_qte_pgm_code=3610
National, State, and Local Dental Association Directories
Local Telephone Directory/Yellow Pages
Commercially Developed Listings
IV-11

STEP 2STEP 2
Determine each dentist’s age, number of Determine each dentist’s age, number of auxiliariesauxiliaries11, and number of hours serving , and number of hours serving the population to be designated.the population to be designated.
IV-10
1 Auxiliaries are non-dentists assisting in dental care such as dental assistants, hygienists, etc. They do not include receptionists and other support staff.
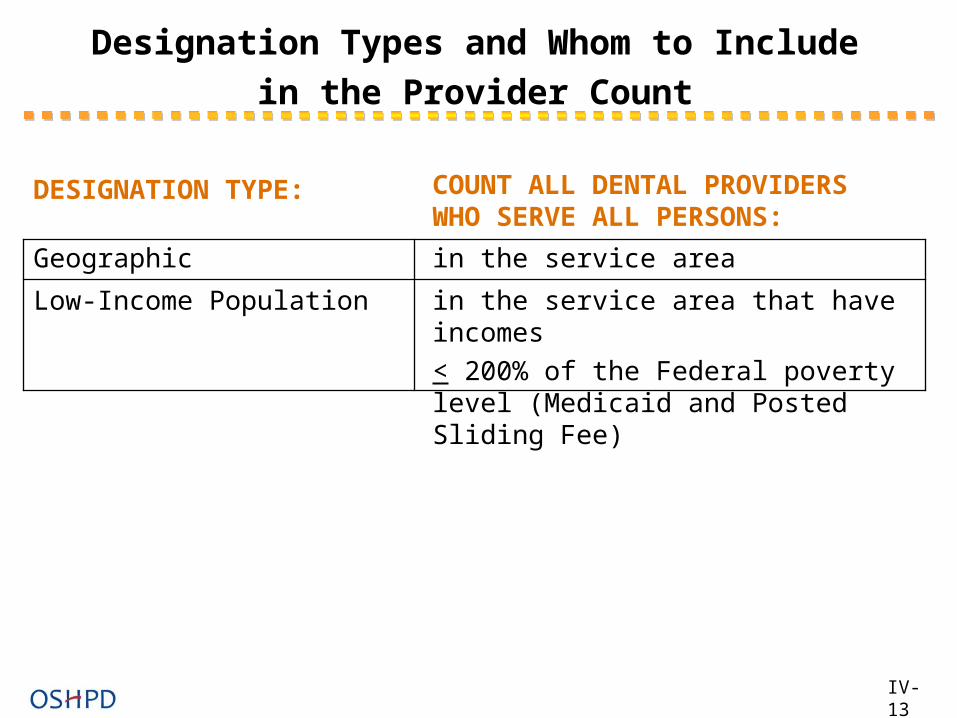
Designation Types and Whom to Include in the
Provider Count
COUNT ALL DENTAL PROVIDERSWHO SERVE ALL PERSONS:
Geographic in the service area
Low-Income Population in the service area that have incomes
< 200% of the Federal poverty level (Medicaid and Posted Sliding Fee)
DESIGNATION TYPE:
IV-13
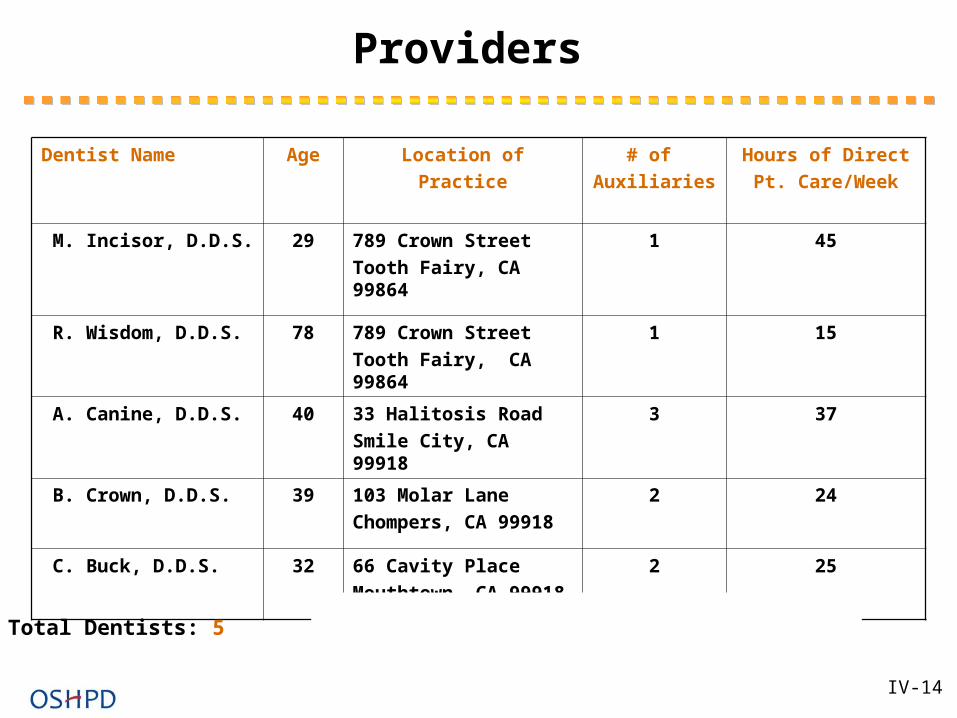
Providers
Dentist Name Age Location of
Practice
# of
Auxiliaries
Hours of Direct
Pt. Care/Week
M. Incisor, D.D.S. 29 789 Crown Street
Tooth Fairy, CA 99864
1 45
R. Wisdom, D.D.S. 78 789 Crown Street
Tooth Fairy, CA 99864
1 15
A. Canine, D.D.S. 40 33 Halitosis Road
Smile City, CA 99918
3 37
B. Crown, D.D.S. 39 103 Molar Lane
Chompers, CA 99918
2 24
C. Buck, D.D.S. 32 66 Cavity Place
Mouthtown, CA 99918
2 25
Total Dentists: 5
IV-14
STEP 3STEP 3
Calculate the FTE for each dentist Calculate the FTE for each dentist serving the population to be serving the population to be designated.designated.
IV-15

Equivalency Weights by Number of Auxiliaries and Age
Auxiliaries are non-dentists assisting in dental care such as dental assistants, hygienists, etc.
Auxiliaries <55 55-59 60-64 65+ 0 0.8 0.7 0.6 0.5 1 1.0 0.9 0.8 0.7 2 1.2 1.0 1.0 0.8 3 1.4 1.2 1.0 1.0 > 4 1.5 1.5 1.3 1.2
If an auxiliary is less than full-time, round to nearest whole number (0.4 = 0, 0.5 = 1).
If more than one auxiliary works less than full time, add total hours, divide by 40, and round if not a whole number [(16 +20 + 32/40) = 1.7 = 2].
If number of auxiliaries is not available, use these weights: <55 = 1.2
55 - 59 = 0.9 60 - 64 = 0.8
> 65 = 0.6
If dentist’s age and the number of auxiliaries are not available:
Use weight of 1.2
IV-16

FTE CalculationFTE Calculation
40 hours = 1.0 FTE (There are no provisions to reduce the FTE of a dentist in residency.)
Every 4 hours (½ day) is counted as 0.1 FTE
Adjust FTE based on actual hours, age, and auxiliaries
A dentist’s FTE can exceed 1.0 due to auxiliaries
Only the Total (or Total Low-Income) FTE is rounded to the nearest tenth of a percent:
Examples: 0.875= 0.9 0.817= 0.80.83 = 0.8 0.85 = 0.9Note:
The FTE for low-income population designations is based on the average number of hours per week spent with Medicaid and SFS patients. It is not based on whether the provider is accepting new Medicaid patients.
IV-17
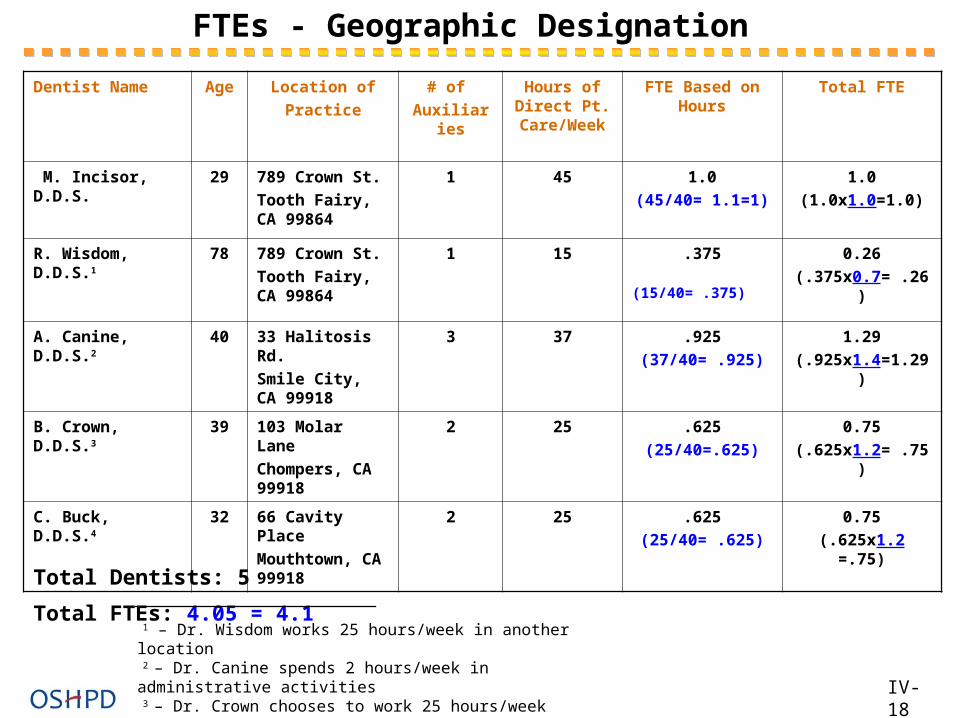
FTEs - Geographic Designation
Dentist Name Age Location of
Practice
# of
Auxiliaries
Hours of Direct Pt.
Care/Week
FTE Based on Hours
Total FTE
M. Incisor, D.D.S. 29 789 Crown St.
Tooth Fairy, CA 99864
1 45 1.0
(45/40= 1.1=1)
1.0
(1.0x1.0=1.0)
R. Wisdom, D.D.S.1 78 789 Crown St.
Tooth Fairy, CA 99864
1 15 .375 (15/40= .375)
0.26
(.375x0.7= .26)
A. Canine, D.D.S.2 40 33 Halitosis Rd.
Smile City, CA 99918
3 37 .925
(37/40= .925)
1.29
(.925x1.4=1.29)
B. Crown, D.D.S.3 39 103 Molar Lane
Chompers, CA 99918
2 25 .625
(25/40=.625)
0.75
(.625x1.2= .75)
C. Buck, D.D.S.4 32 66 Cavity Place
Mouthtown, CA 99918
2 25 .625
(25/40= .625)
0.75
(.625x1.2 =.75)
Total Dentists: 5 Total FTEs: 4.05 = 4.1
1 – Dr. Wisdom works 25 hours/week in another location 2 – Dr. Canine spends 2 hours/week in administrative activities 3 – Dr. Crown chooses to work 25 hours/week 4 – Dr. Buck spends 15 hours/week in childcare activities IV-18
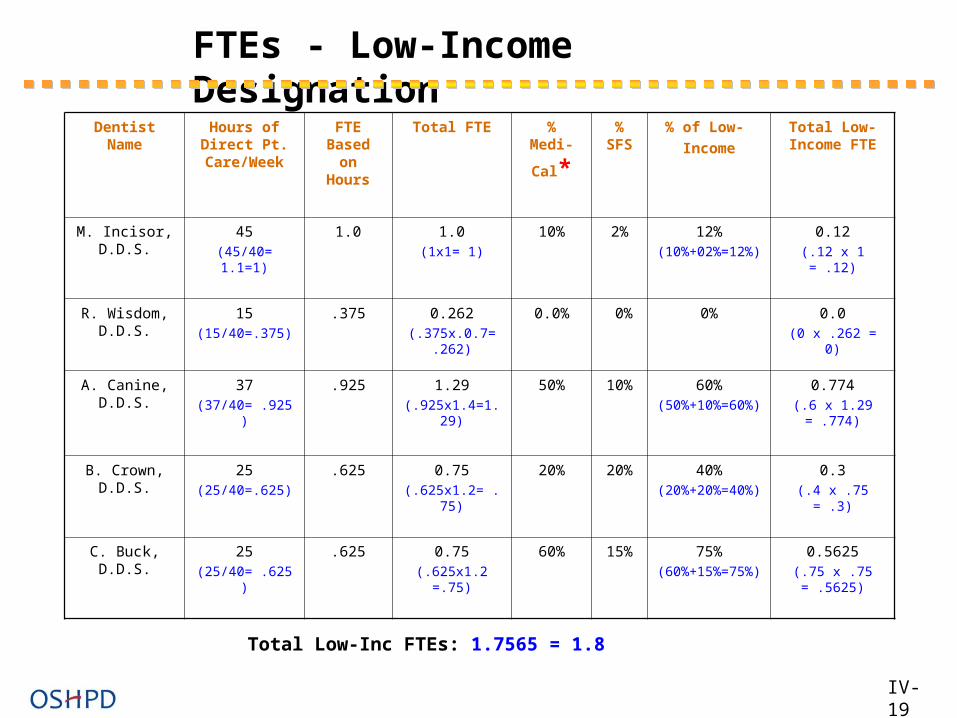
FTEs - Low-Income Designation
Dentist Name Hours of Direct Pt.
Care/Week
FTE Based on
Hours
Total FTE % Medi-
Cal*%
SFS% of Low-
Income
Total Low-Income FTE
M. Incisor, D.D.S.
45(45/40= 1.1=1)
1.0 1.0(1x1= 1)
10% 2% 12%(10%+02%=12%)
0.12(.12 x 1 = .12)
R. Wisdom, D.D.S.
15(15/40=.375)
.375 0.262(.375x.0.7= .262)
0.0% 0% 0% 0.0(0 x .262 = 0)
A. Canine, D.D.S.
37(37/40= .925)
.925 1.29(.925x1.4=1.29)
50% 10% 60%(50%+10%=60%)
0.774(.6 x 1.29 = .774)
B. Crown, D.D.S.
25(25/40=.625)
.625 0.75(.625x1.2= .75)
20% 20% 40%(20%+20%=40%)
0.3(.4 x .75 = .3)
C. Buck, D.D.S.
25(25/40= .625)
.625 0.75(.625x1.2 =.75)
60% 15% 75%(60%+15%=75%)
0.5625(.75 x .75 = .5625)
Total Low-Inc FTEs: 1.7565 = 1.8
IV-19
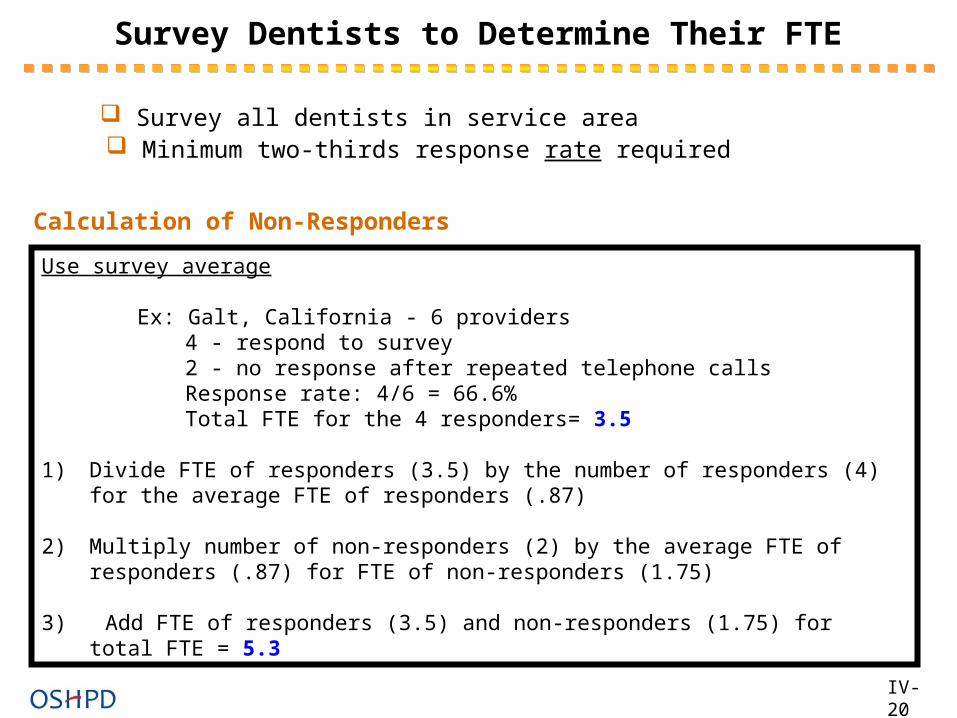
Survey Dentists to Determine Their FTE
Survey all dentists in service area Minimum two-thirds response rate required
Calculation of Non-Responders
Use survey average
Ex: Galt, California - 6 providers4 - respond to survey2 - no response after repeated telephone callsResponse rate: 4/6 = 66.6%Total FTE for the 4 responders= 3.5
1) Divide FTE of responders (3.5) by the number of responders (4) for the average FTE of responders (.87)
2) Multiply number of non-responders (2) by the average FTE of responders (.87) for FTE of non-responders (1.75)
3) Add FTE of responders (3.5) and non-responders (1.75) for total FTE = 5.3
IV-20

STEP 4STEP 4
Calculate the population to providerCalculate the population to provider ratio. ratio.
IV-21
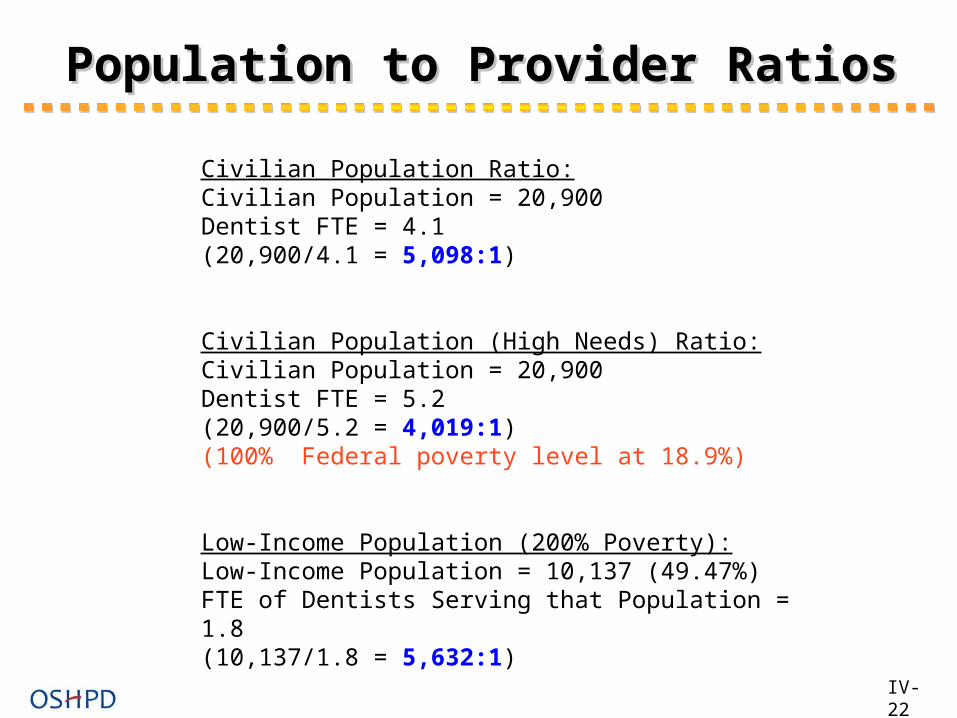
Population to Provider RatiosPopulation to Provider Ratios
Civilian Population Ratio: Civilian Population = 20,900Dentist FTE = 4.1(20,900/4.1 = 5,098:1)
Civilian Population (High Needs) Ratio:Civilian Population = 20,900Dentist FTE = 5.2(20,900/5.2 = 4,019:1)(100% Federal poverty level at 18.9%)
Low-Income Population (200% Poverty):Low-Income Population = 10,137 (49.47%)FTE of Dentists Serving that Population = 1.8(10,137/1.8 = 5,632:1)
IV-22

Calculating the Maximum FTECalculating the Maximum FTE
IV-23
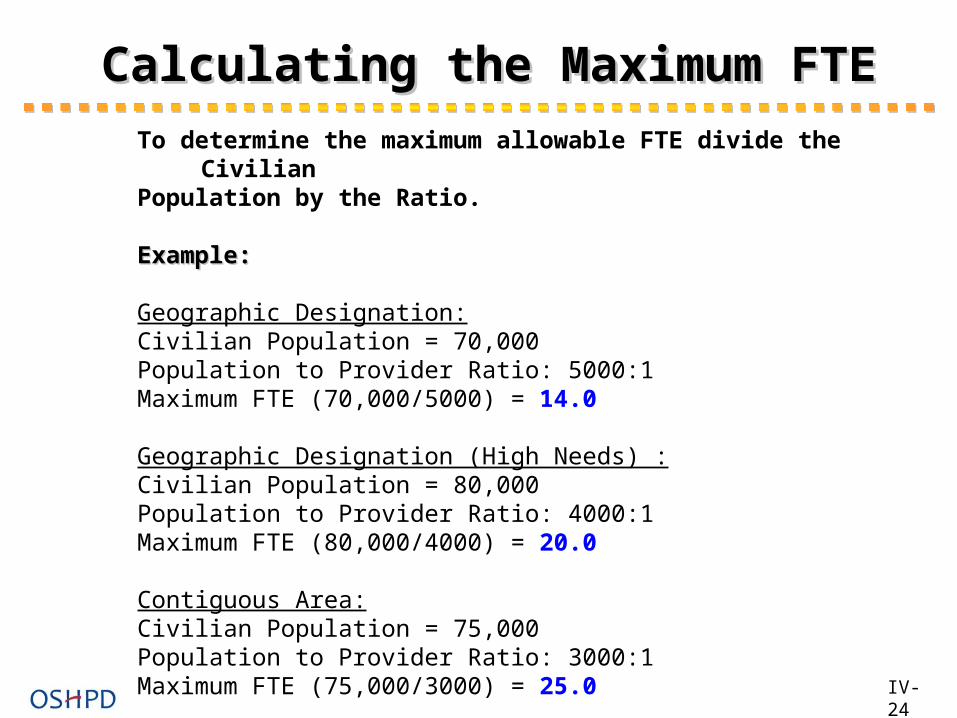
Calculating the Maximum FTECalculating the Maximum FTE
To determine the maximum allowable FTE divide the Civilian Population by the Ratio.
Example:Example:
Geographic Designation:Civilian Population = 70,000Population to Provider Ratio: 5000:1 Maximum FTE (70,000/5000) = 14.0
Geographic Designation (High Needs) :Civilian Population = 80,000Population to Provider Ratio: 4000:1 Maximum FTE (80,000/4000) = 20.0
Contiguous Area:Civilian Population = 75,000Population to Provider Ratio: 3000:1 Maximum FTE (75,000/3000) = 25.0
IV-24

What to Include in the Population to Provider Ratio DentalSection of Your Application
Population
Cover letter with summary findings Total adjusted population Source of data
List of Dentists Include the Following for Each Dentist: Name Age Location:
Non-metro areas - name of town Metro areas – complete address with zip code, and CT if available
Specialty (general dentistry and pedodontics) Number of auxiliaries Equivalent weights Number of hours/week of patient care in area Percentage of practice Medicaid (for low-income and Medicaid-eligible designations) Percentage of practice Sliding Fee Scale (for low-income designations) FTE total for each provider rounded to the nearest tenth of a percent Description of how information was obtained (sources, methods of gathering data)
Totals and Ratio Total number of providers Total FTE Population to provider ratio Explanation of any high need indicators
IV-25

Contiguous Area ResourcesContiguous Area Resources
IV-26

Contiguous Area ResourcesContiguous Area Resources
Objective:
Participants will understand how to identify contiguous areas, determine if they have resources, and if the resources are excessively distant, overutilized, or inaccessible to the population of the area proposed for designation.
Purpose of Contiguous Area Analysis:
To identify nearby sources of care and determine if they are
inaccessible to the population in the proposed service area
IV-27
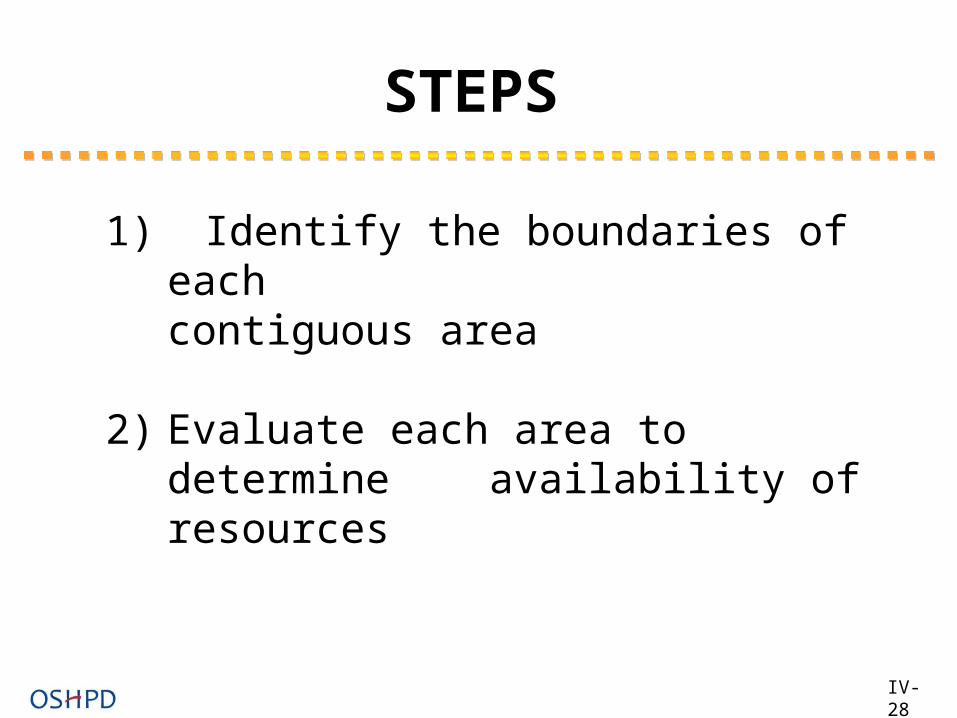
STEPS
1) Identify the boundaries of eachcontiguous area
2) Evaluate each area to determine availability of resources
IV-28

Identify the Boundaries of Each Contiguous Area
A. Identify on a map the boundaries and population center of theproposed service area.
B. Determine the contiguous areas in all directions within 40 minutes from the proposed area’s population center.
C. Map the boundaries of each contiguous area in all directions (North, East, South, & West).
Boundaries The boundaries of each contiguous area may be based on:
• Travel time (40 minutes)• Socio-economic/demographic characteristics• Established neighborhoods• Physical barriers• Designated HPSA
The boundaries of contiguous areas are often (not always) based on the same census delineation as the proposed area:
Proposed service area = whole countyContiguous areas = whole counties
Proposed service area = census tracts (MSSA)Contiguous areas = census tracts (MSSA) IV-29
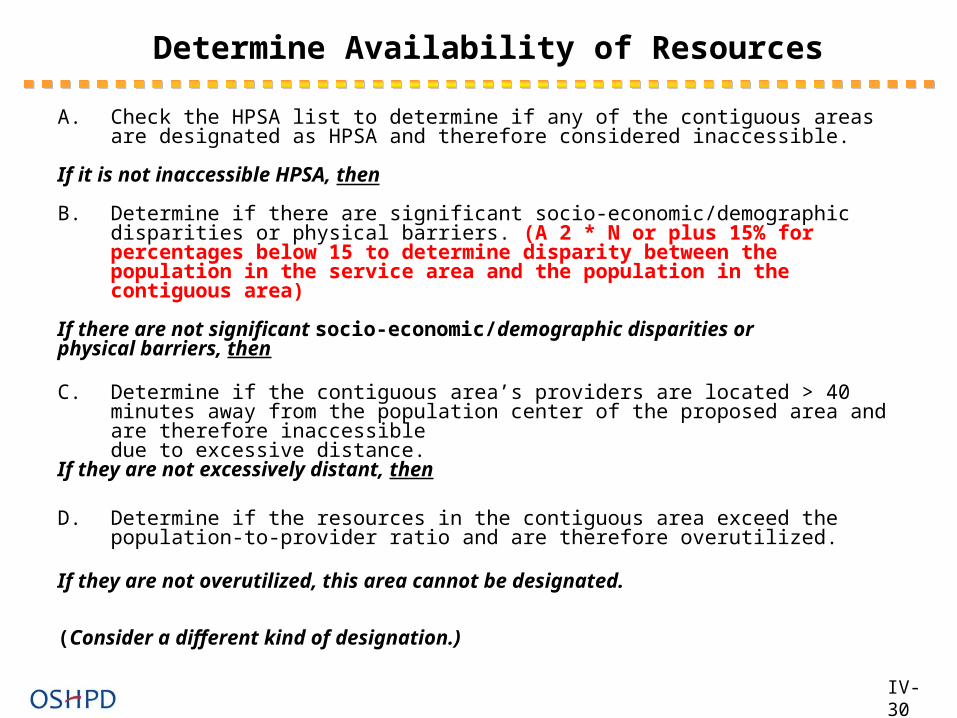
Determine Availability of Resources
A. Check the HPSA list to determine if any of the contiguous areas are designated as HPSA and therefore considered inaccessible.
If it is not inaccessible HPSA, then
B. Determine if there are significant socio-economic/demographic disparities or physical barriers. (A 2 * N or plus 15% for percentages below 15 to determine disparity between the population in the service area and the population in the contiguous area)
If there are not significant socio-economic/demographic disparities orphysical barriers, then
C. Determine if the contiguous area’s providers are located > 40 minutes away from the population center of the proposed area and are therefore inaccessibledue to excessive distance.
If they are not excessively distant, then
D. Determine if the resources in the contiguous area exceed the population-to-provider ratio and are therefore overutilized.
If they are not overutilized, this area cannot be designated.
(Consider a different kind of designation.)
IV-30
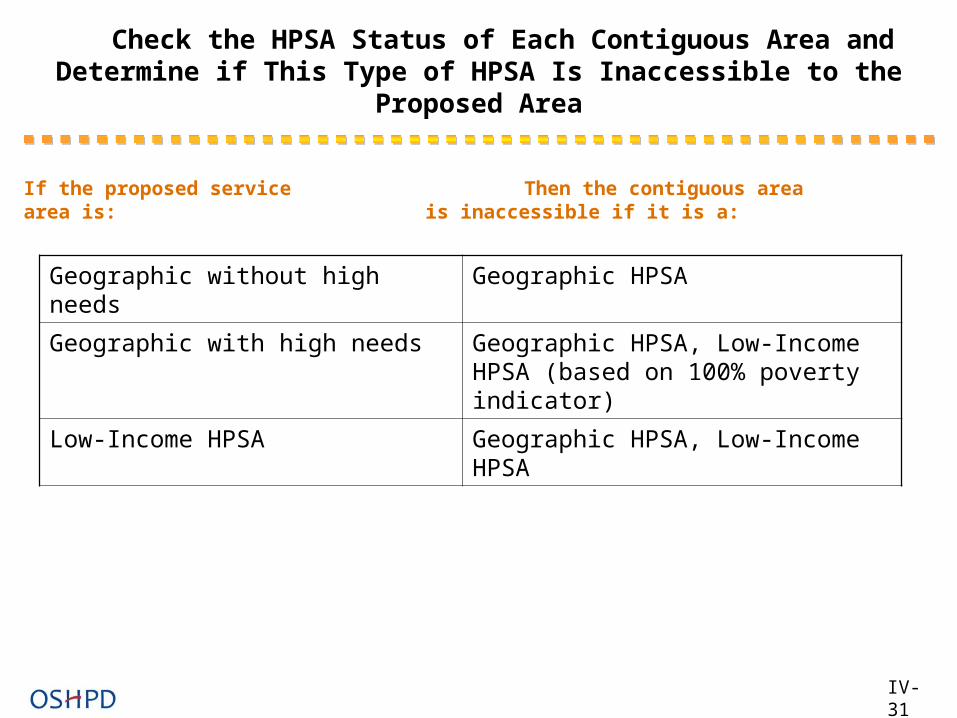
Check the HPSA Status of Each Contiguous Area and Determine if This Type of HPSA Is Inaccessible to the Proposed Area
Geographic without high needs Geographic HPSA
Geographic with high needs Geographic HPSA, Low-Income HPSA (based on 100% poverty indicator)
Low-Income HPSA Geographic HPSA, Low-Income HPSA
IV-31
If the proposed service Then the contiguous area area is: is inaccessible if it is a:
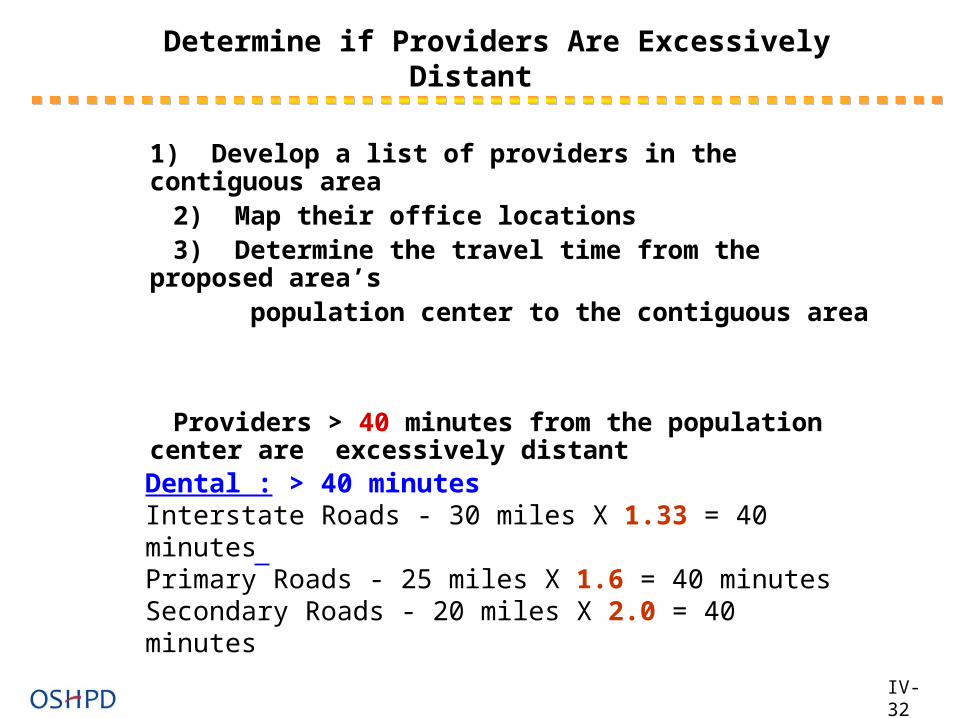
Determine if Providers Are Excessively Distant
1) Develop a list of providers in the contiguous area 2) Map their office locations 3) Determine the travel time from the proposed area’s population center to the contiguous area
Providers > 40 minutes from the population center are excessively distant
IV-32
Dental : > 40 minutesInterstate Roads - 30 miles X 1.33 = 40 minutesPrimary Roads - 25 miles X 1.6 = 40 minutesSecondary Roads - 20 miles X 2.0 = 40 minutes

Service Area Travel CalculationPrimary Health Care
Interstate Roads: 25 miles X 1.2 = 30 minutes
Primary Roads (include surface streets): 20 miles X 1.5 = 30 minutes
Secondary Roads (mountainous terrain or unpaved road): 15 miles X 2.0 = 30 minutes
Dental and Mental Health Care
Interstate Roads: 30 miles X 1.33 = 40 minutes
Primary Roads (include surface streets): 25 miles X 1.6 = 40 minutes
Secondary Roads (mountainous terrain or unpaved road) 20 miles X 2.0 = 40 minutes
III-33
Determine if Providers Are Excessively Distant (continued)
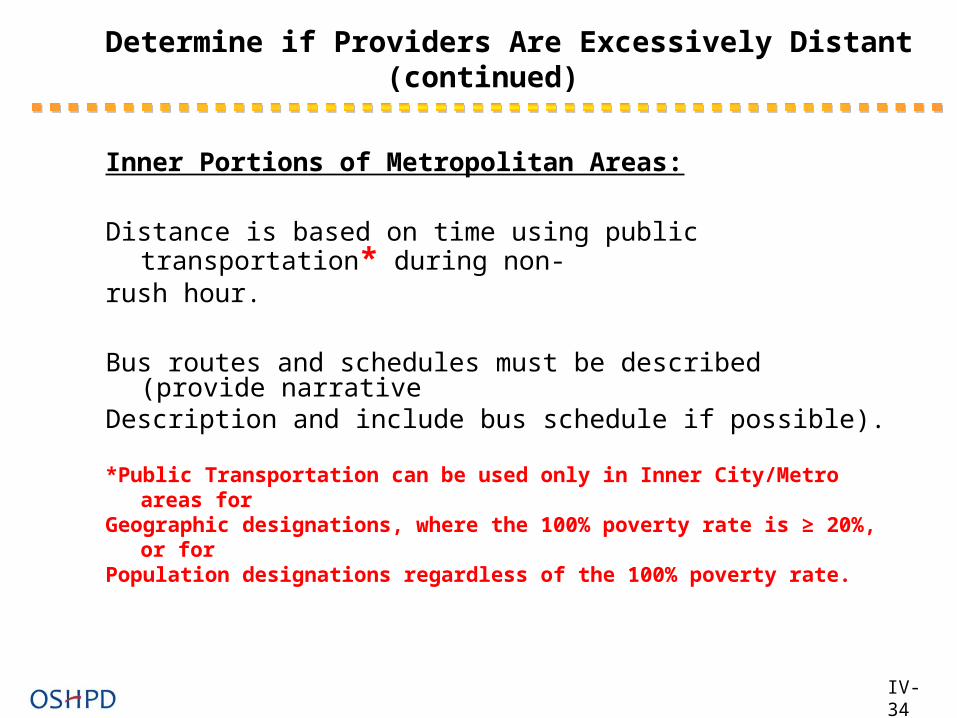
Inner Portions of Metropolitan Areas:
Distance is based on time using public transportation* during non-rush hour.
Bus routes and schedules must be described (provide narrativeDescription and include bus schedule if possible).
*Public Transportation can be used only in Inner City/Metro areas for Geographic designations, where the 100% poverty rate is ≥ 20%, or for Population designations regardless of the 100% poverty rate.
IV-34
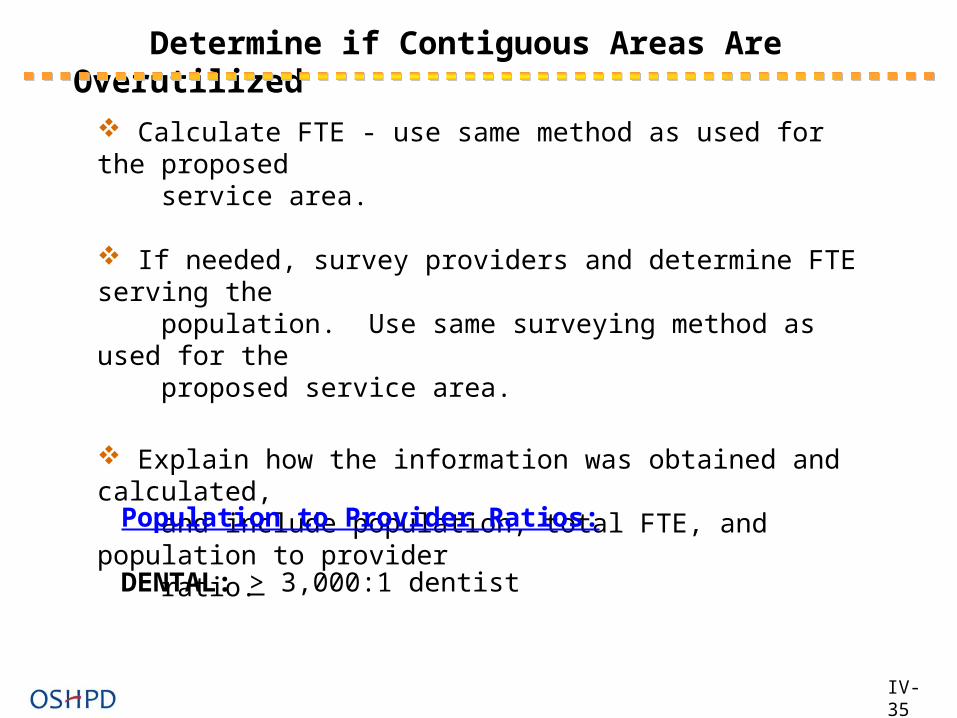
Determine if Contiguous Areas Are Overutilized
Calculate FTE - use same method as used for the proposed service area.
If needed, survey providers and determine FTE serving the population. Use same surveying method as used for the proposed service area.
Explain how the information was obtained and calculated, and include population, total FTE, and population to provider ratio.
Population to Provider Ratios:
DENTAL: > 3,000:1 dentist
IV-35
ExamplesExamples
Survey
IV-36
IV-37
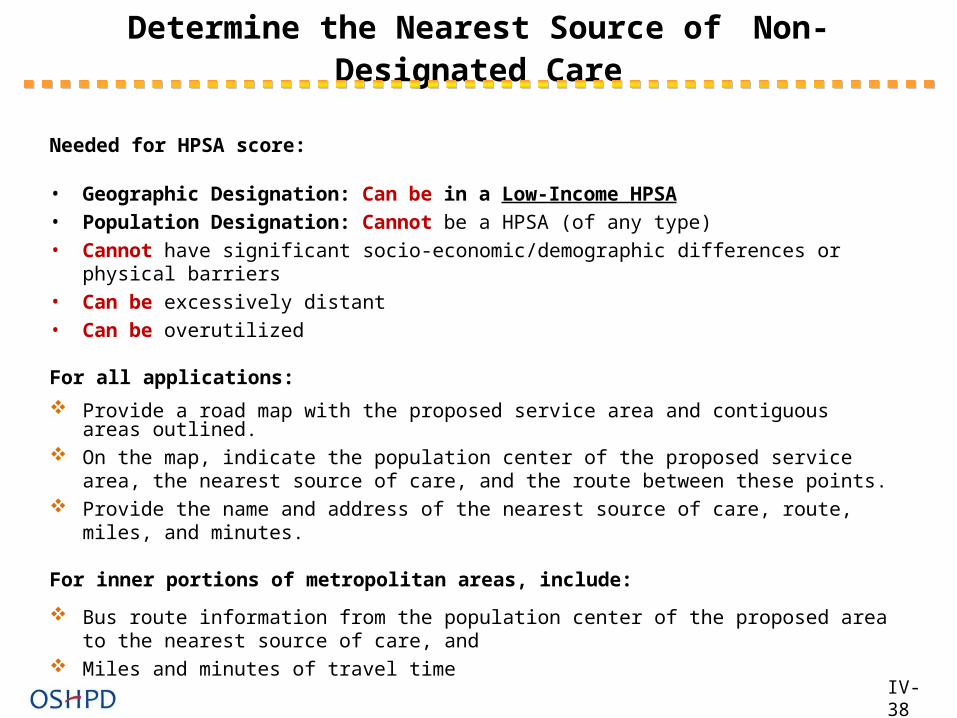
Determine the Nearest Source of Non-Designated Care
Needed for HPSA score:
• Geographic Designation: Can be in a Low-Income HPSA• Population Designation: Cannot be a HPSA (of any type)• Cannot have significant socio-economic/demographic differences or physical barriers• Can be excessively distant• Can be overutilized
For all applications:
Provide a road map with the proposed service area and contiguous areas outlined. On the map, indicate the population center of the proposed service area, the nearest
source of care, and the route between these points. Provide the name and address of the nearest source of care, route, miles, and
minutes.
For inner portions of metropolitan areas, include:
Bus route information from the population center of the proposed area to the nearest source of care, and
Miles and minutes of travel timeIV-38
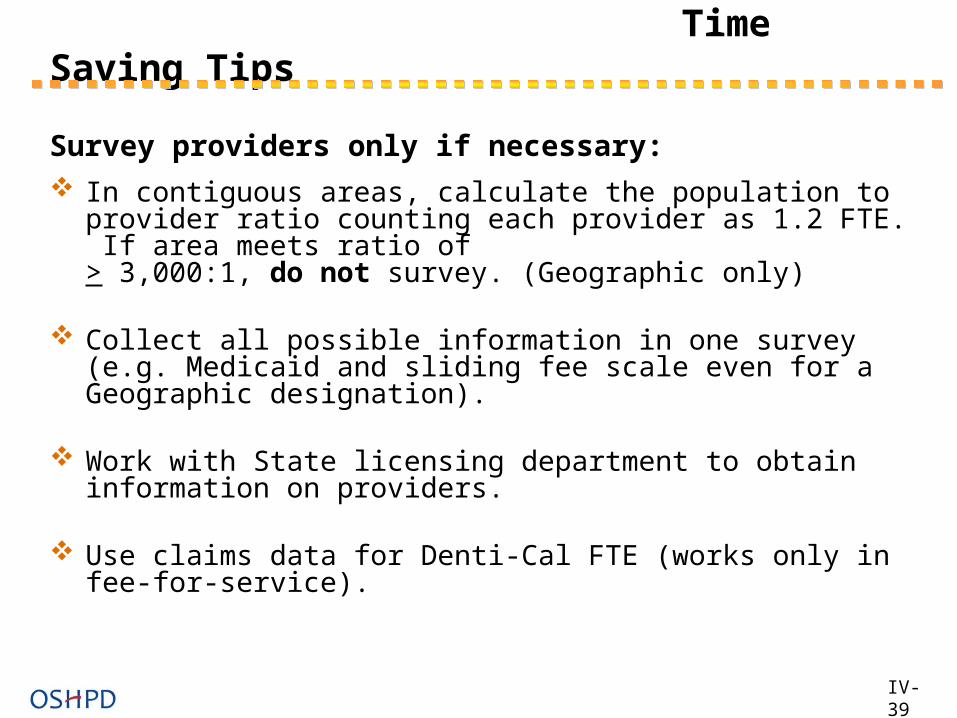
Time Saving Tips
Survey providers only if necessary:
In contiguous areas, calculate the population to provider ratio counting each provider as 1.2 FTE. If area meets ratio of > 3,000:1, do not survey. (Geographic only)
Collect all possible information in one survey (e.g. Medicaid and sliding fee scale even for a Geographic designation).
Work with State licensing department to obtain information on providers.
Use claims data for Denti-Cal FTE (works only in fee-for-service).
IV-39

What to Include in the Contiguous Area Resources Section of Your Application
Map with Census Delineations
Name and boundaries of proposed service area Name and boundaries of contiguous areas Population center for the proposed service
Knowledge of designation status of each of the contiguous areas is helpful.
Road Map
Outline of proposed area boundaries Location of nearest source of non-designated care For automobile transportation - start, end, and route For public transportation - start and end points of route
IV-40
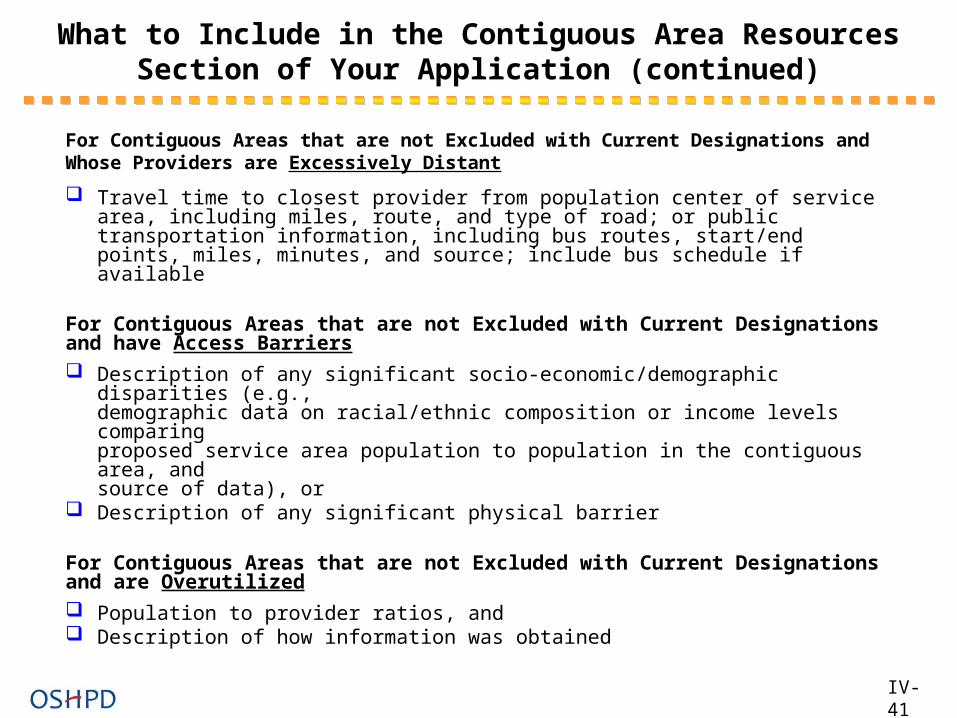
For Contiguous Areas that are not Excluded with Current Designations and Whose Providers are Excessively Distant
Travel time to closest provider from population center of service area, including miles, route, and type of road; or public transportation information, including bus routes, start/end points, miles, minutes, and source; include bus schedule if available
For Contiguous Areas that are not Excluded with Current Designationsand have Access Barriers
Description of any significant socio-economic/demographic disparities (e.g.,demographic data on racial/ethnic composition or income levels comparingproposed service area population to population in the contiguous area, andsource of data), or
Description of any significant physical barrier
For Contiguous Areas that are not Excluded with Current Designations and are Overutilized
Population to provider ratios, and Description of how information was obtained
IV-41
What to Include in the Contiguous Area Resources Section of Your Application (continued)

For All Designation Requests:
For Public Transportation Routes*:
Travel time, based on non-rush hour bus schedules Start/End point of route Include time waiting for transfers while in route Map showing proposed area boundaries, start and end points of bus route Bus schedules, if available Cite source of information
*Public Transportation can be used only in Inner City/Metro areas for Geographic designations, where the 100% poverty rate is ≥ 20%, or for Population designations regardless of the 100% poverty rate.
Address of nearest source of non-designated, accessible care, including address, miles and minutes via public transportation if metropolitan area Location of nearest source on road map
IV-42
What to Include in the Contiguous Area Resources Section of Your Application (continued)

Websites
California Public Transit Information and Maps:http://maps.google.com
2010 CT Locator:http://www.ffiec.gov/Geocode/default.aspx
U.S. Census Bureau – American Factfinder:
http://factfinder2.census.gov/faces/nav/jsf/pages/index.xhtml
IV-43

APPLY FOR DESIGNATION
No ContiguousArea Conditions
Met
1or more Contiguous Area ConditionsMet for EACH
Contiguous Area
Evaluate ContiguousArea
STOP:Area Not Qualified
For Designation
Calculate Population-to-Dentist Ratio
Define Rational ServiceArea
Determine Dental FTEs
Determine Service AreaPopulation
Evaluate Service Area for High-Need Indicators
STOP:Area Not Qualified
For Designation
STOP:Area Not Qualified
For Designation
No HighNeed Indicators
Present
1 or more High-Need Indicators
Present
Process Model for Geographic Dental Health (Professional Shortage Area Designation)Process Model for Geographic Dental Health (Professional Shortage Area Designation)
To Use: Follow arrows. Numbers are reference citations only. Refer to correspondingly numbered pages following for additional information on steps in numbered boxes
2
3
4 6
9
1
5
9 8
IV-44
Ratio < 3999
9
Ratio 4000-4999
Evaluate Contiguous Area
5
1 or lessInsufficient
CapacityIndicators
Present
2 or moreInsufficient
CapacityIndicators
Present
1 or more ContiguousArea Conditions Met
for EACH Contiguous
Area
No ContiguousArea Conditions
Met
STOP:Area Not Qualified
For Designation
9
APPLY FORDESIGNATION
8
Ratio > 5000
Evaluate forInsufficient
Capacity7