iufro uncertainty mexicov5_cw
TRANSCRIPT

Forest Carbon Stock Change Uncertainty Estimation in Mexico
Oswaldo Carrillo, Jorge Morfín, Craig Wayson, Gustavo Rodríguez, Luis Rangel, Miguel Muñoz, Marcela Olguín and Lucio Santos
October 2014

• What is the Monitoring Reporting and Verification (MRV) system in Mexico
• General process of carbon stock change estimation in Mexico and its uncertainty under a MRV system
• Importance of uncertainty estimation in a national GHG emissions report
• Limitations in developing countries to estimate GHG emissions and its uncertainty
• General methodologies of carbon stock change estimation in Mexico
• Evolution of carbon emission estimation in Mexico and changes in trends
• What are the political implications?
• So we need to be sure that this carbon stock change Is real for FL-FL
• For FL-FL, how was forest carbon stock change estimated and as well as its uncertainty?
• The National Forest Inventory data shows that Mexican forest sector is a huge sink and, their uncertainties of estimations are moderate
• Next steps

What is the MRV system in México
MRV is part of strategies and policies for reducing emissions from deforestation and forest degradation, as well as the role of conservation, sustainable management of forests, and enhancement of forest carbon stocks (REDD+).
A comprehensive national forest MRV system should consider 3 major components for measuring, monitoring and reporting anthropogenic GHG emissions by sources and removals by sinks in the forest sector:
• a Satellite Land Monitoring System to assess activity data (AD), forest area and forest area changes.
• a National Forest Inventory to assess carbon stocks and changes in carbon stocks (i.e. emission factors - EF);
• a National Greenhouse Gas (GHG) Inventory to estimate and report anthropogenic emissions by sources and removals by sinks;

The MRV system in México
Some characteristics of an MRV system to support REDD+ implementation:
• Multiscale: designed to measure, monitor, and report forest resources at a national and subnational scale.
• Should rely on both remote sensing and ground based forest inventory approaches.
• The MRV system must be transparent :• well documented robust methodologies
• consistent
• accurate (reducing uncertainties at least for key categories, and incorporating Quality Control and Quality Assessment in all steps).
• MRV system should provide timely and appropriate feedback to policymakers on the effectiveness of REDD+ strategies.

General process of carbon stock change estimation in Mexico and their uncertainties under a MRV system
One of the main objectives of Mexican MRV system is the update of GHG report in the LULUCF category

Importance of uncertainty estimation in a national GHG emissions report
Reference: IPCC 2006
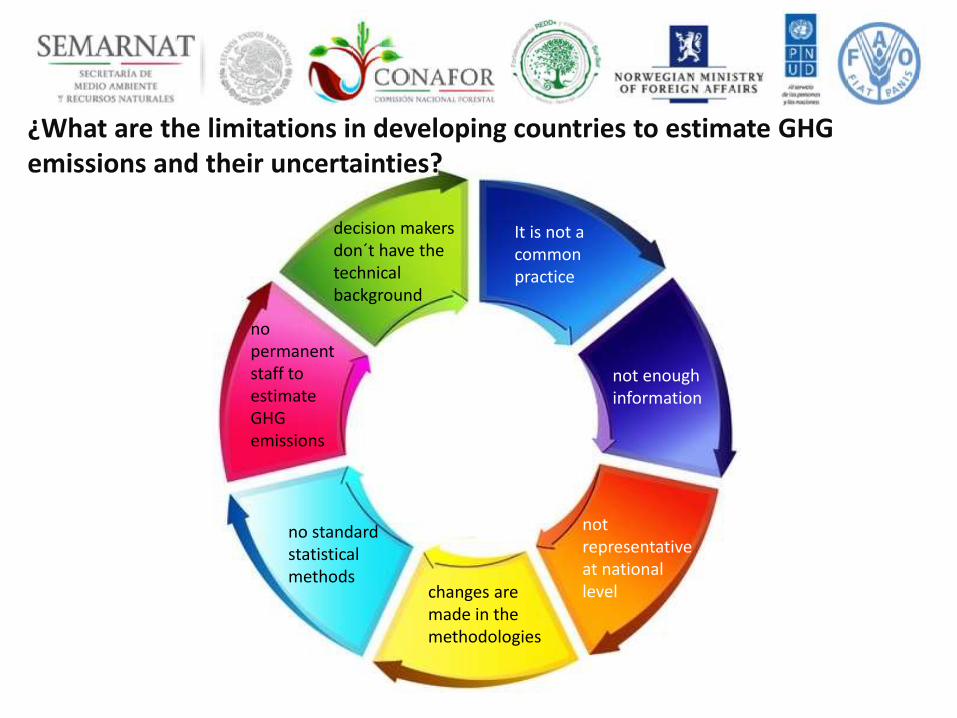
¿What are the limitations in developing countries to estimate GHG emissions and their uncertainties?
It is not a common practice
not enough information
not representative at national levelchanges are
made in the methodologies
no standard statistical methods
no permanent staff to estimate GHG emissions
decision makers don´t have the technical background

General methodologies of carbon stocks changes estimation in Mexico -inputs
Stratified, systematic random sample
Grid of km | 5x5 | 10x10 | 20x20 |
Sampling: 2004-2007Re sampling: 2009 - 2013
UMP = 26, 220Sitos = 81, 665
INEGI Land cover map Series lV (2007)INEGI Land cover map Series V (2012)
Land cover maps developed by the Statistics and Geography National Institute (INEGI)

General methodologies of carbon stock changes estimation in Mexico -categories
FL-OU
FL-FL
FL-FLd
FLd-FL
OU-FL
Forest Land (FL) converted to Other Uses (OU)
Forest Land remaining Forest Land
Forest Land remaining Forest Land but degraded (FLd)
Degraded Forest Land changing to no degraded Forest Land
Other Uses converted to Forest Land

Evolution of carbon emission estimation in Mexico and changes in trends
20064° GHG
19901° GHG
19982° GHG
20023° GHG
20105° GHG
FL-OUFL-FLdFLd-FLOU-FL
2009-2012 (14) re-sampling
INFyS
2004-2007 sampling
INFyS
FL-OUFL-FLdFLd-FLOU-FL
FL-FL

-180000
-160000
-140000
-120000
-100000
-80000
-60000
-40000
-20000
0
1980 1990 2000 2010 2020
Including FL-FL
Including FL-FL
0
10000
20000
30000
40000
50000
1985 1990 1995 2000 2005 2010 2015
Not including FL-FL
Not including FL-FL
• We found that FL-FL seems to be a large sink.
• When de total removals of LF remain LF is included in the LULUCF total emission, the emission trend at national level change and the LULUCF sector was estimated to be a sink.
• Its means, that LF-LF are a huge sink and is able to soak up all the emission coming from FL-OU and FL-FLd
Evolution of carbon emission estimation in Mexico and changes in trends

What are the political implications?
• The forest sector of Mexico seems to be a sink, and can be a strategic sector to reduce the total carbon emissions of Mexico
• For this reason, the Mexican government is interested in having a robust statistical support for these estimations and their uncertainties.
• If these results are well supported and their uncertainties are moderate, the total sink of FL-FL is able to soak up an important part of the total carbon emissions of Mexico!
-40,000,000 -30,000,000 -20,000,000 -10,000,000 - 10,000,000
FL-FL
FL-FLd
FLd-FL
OU-FL
FL-OU
FL-FL FL-FLd FLd-FL OU-FL FL-OU
Emissions -39,733,337 494,260 -1,733,354 -799,587 3,067,576
Emissions

So we need to be sure that this carbon stock change Is real for FL-FL• Is accurate and precise this estimation?
• We need a precise and accurate estimation
as the IPCC guidelines suggested
• Following the sampling design of the NFI, ratio estimator is a precise and accurate estimator:
6
475
8
387
2
953
5
931
Reference: IPCC 2006
R = 𝑖=1𝑛 y𝑖
𝑖=1𝑛 𝑎𝑖
Where: R =Ratio estimator at strata level
y𝑖 =Total carbon at sub-plot level (o UMS) 𝑖
𝑎𝑖 = Sub-plot sampled area (o UMS) 𝑖 (400m2)𝑛 = Number of sub − plots
𝑅 =5 + 6 + 4 + 7 + 7 + 8 + 3 + 8 + 3 + 2 + 9 + 5 + 1 + 5 + 9 + 3
0.04 × 16
𝑅 =85
0.64= 132.8

We need to be sure that this carbon stock change in FL-FL Is real
• What is the level of uncertainty of this estimation?
• Uncertainty estimation of EF at strata level
• Error propagation IPCC methods (2006)
• Analytical method 𝑈𝑡𝑜𝑡𝑎𝑙 =𝑈1∗𝐴1
2+ 𝑈2∗𝐴22+⋯+ 𝑈𝑛∗𝐴𝑛
2
𝐴1+𝐴2+⋯+𝐴𝑛
• where:
Utotal : total uncertainty.
Ui : Uncertainty of factor i, con i=1…n
𝑛: Number of factors
Ai : Uncertain quantities i.
• Monte Carlo simulation
𝑈 = 1 2 𝐼𝐶
𝑅=1.96 𝑉 𝑅
𝑅× 100
𝑉 𝑅 =1
𝑛 𝑛 − 1 𝑎2
𝑖=1
𝑛
𝑦𝑖2 − 2 𝑅
𝑖=1
𝑛
𝑦𝑖𝑎𝑖 + 𝑅2
𝑖=1
𝑛
𝑎𝑖2
Reference: IPCC 2006

For FL-FL, how was forest carbon stock change estimated and as well as its uncertainty?
“FL remaining as FL”• GHG in FL-FL needs the estimates of
carbon stock changes.
• Methods
Gain and loss
Stock change
Is a closer approach to TIER2
This approach is better suited to the data
available in Mexico
Is convenient when there is National Forest
Inventory
Reference: IPCC 2006

We estimate the carbon stock change at sub-plot level
C1=0.8
C5=1.2
C2=1C3=2.5
C4=1.5
C1=0.9
C5=1.5
C2=1.2
C3=2.5
C4=1.8
C3=2.7
∆𝐶1 = 8.1 − 7.0= 0.1
t1t2
𝐶1 = 0.8 + 1 + 2.5 + 1.5 + 1.2𝐶1 =7
𝐶1 = 0.9 + 1.2 + 2.7 + 1.8 + 1.5𝐶1 = 8.1
For FL-FL, how was forest carbon stock change estimated and as well as its uncertainty?

t1 t2
t2-t1
BPE
BE
PBPE
BE
P
PPBPE
BE
BPE-BE
BE-P
𝐶𝐴 𝑡1 𝐶𝐴 𝑡2
∆𝐶𝐴 = 𝐶𝐴 𝑡2 − 𝐶𝐴 𝑡1
∆𝐶𝑖 ∆𝑆1 = 𝑆1𝑡2 − 𝑆1𝑡1∆𝑆2 = 𝑆2𝑡2 − 𝑆2𝑡1∆𝑆3 = 𝑆3𝑡2 − 𝑆3𝑡1∆𝑆4 = 𝑆4𝑡2 − 𝑆4𝑡1
For FL-FL, how was forest carbon stock change estimated and as well as its uncertainty?
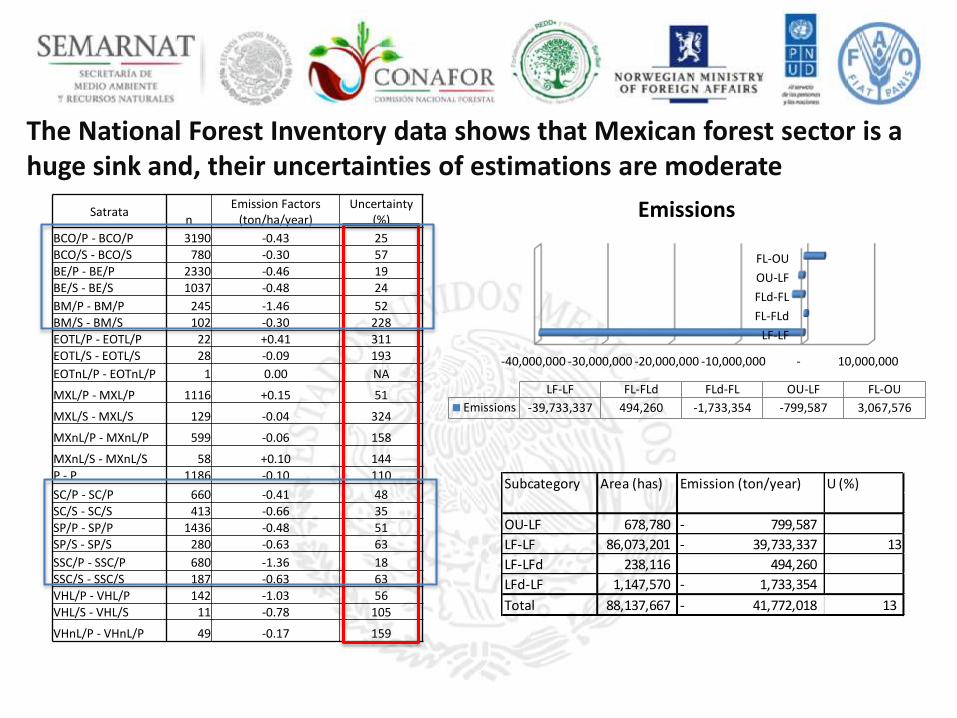
The National Forest Inventory data shows that Mexican forest sector is a huge sink and, their uncertainties of estimations are moderate
Satratan
Emission Factors(ton/ha/year)
Uncertainty(%)
BCO/P - BCO/P 3190 -0.43 25
BCO/S - BCO/S 780 -0.30 57
BE/P - BE/P 2330 -0.46 19BE/S - BE/S 1037 -0.48 24
BM/P - BM/P 245 -1.46 52
BM/S - BM/S 102 -0.30 228
EOTL/P - EOTL/P 22 +0.41 311
EOTL/S - EOTL/S 28 -0.09 193
EOTnL/P - EOTnL/P 1 0.00 NA
MXL/P - MXL/P 1116 +0.15 51
MXL/S - MXL/S 129 -0.04 324
MXnL/P - MXnL/P 599 -0.06 158
MXnL/S - MXnL/S 58 +0.10 144
P - P 1186 -0.10 110
SC/P - SC/P 660 -0.41 48
SC/S - SC/S 413 -0.66 35
SP/P - SP/P 1436 -0.48 51
SP/S - SP/S 280 -0.63 63
SSC/P - SSC/P 680 -1.36 18SSC/S - SSC/S 187 -0.63 63
VHL/P - VHL/P 142 -1.03 56
VHL/S - VHL/S 11 -0.78 105
VHnL/P - VHnL/P 49 -0.17 159
OU-LF 678,780 799,587-
LF-LF 86,073,201 39,733,337- 13
LF-LFd 238,116 494,260
LFd-LF 1,147,570 1,733,354-
Total 88,137,667 41,772,018- 13
Subcategory Area (has) Emission (ton/year) U (%)
-40,000,000 -30,000,000 -20,000,000 -10,000,000 - 10,000,000
LF-LF
FL-FLd
FLd-FL
OU-LF
FL-OU
LF-LF FL-FLd FLd-FL OU-LF FL-OU
Emissions -39,733,337 494,260 -1,733,354 -799,587 3,067,576
Emissions
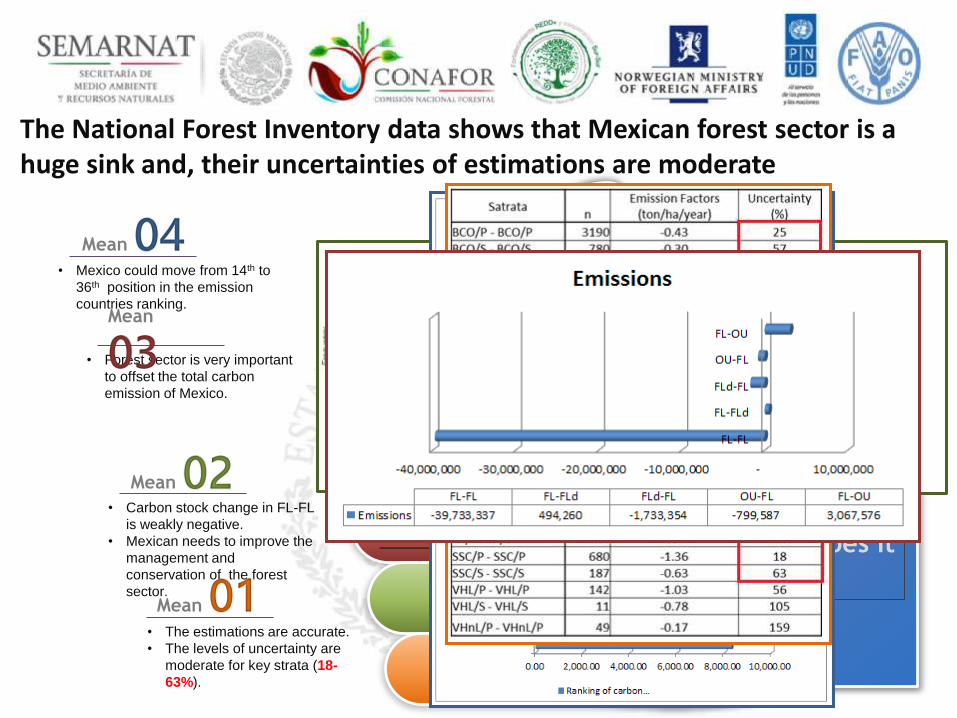
The National Forest Inventory data shows that Mexican forest sector is a huge sink and, their uncertainties of estimations are moderate
Mexico can move in the emission ranking
Forest carbon sector is important to reduce emissions of Mexico
FL-FL subcategori of Mexico is a sink
This estimations can be used by maker decisions
What does It
mean for
Mexico?
• Mexico could move from 14th to
36th position in the emission
countries ranking.
Mean04
• Forest sector is very important
to offset the total carbon
emission of Mexico.
Mean
03
• Carbon stock change in FL-FL
is weakly negative.
• Mexican needs to improve the
management and
conservation of the forest
sector.
Mean02
• The estimations are accurate.
• The levels of uncertainty are
moderate for key strata (18-
63%).
Mean01

Next steps
We need to try reduce the uncertainty and make more accurate our estimations of carbon stock change in the forest sector at national and subnational levels
• We need to increase our knowledge from other uncertainty sources
• We need to improve methods of measurement and estimation methodologies of NFI to reduce uncertainty
Reference: Chave, 2012

Thank you!