iucn water and nature initiative · 2013-09-12 · iucn water and nature initiative pangani basin...
TRANSCRIPT

IUCN WATER AND NATURE INITIATIVE
PANGANI BASIN WATER BOARD1
PANGANI RIVER BASIN FLOW ASSESSMENT
Final Project Summary Report
J. King, J. Turpie, C. Brown, B. Clark, H. Beuster and A. Joubert
December 2009
1 As of 2010, Pangani Basin Water Office is known as Pangani Basin Water Board

Published by: Pangani Basin Water Board (PBWB)
International Union for Conservation of Nature (IUCN)
Copyright: © 2010 International Union for Conservation of Nature and Pangani Basin Water Board
This publication may be produced in whole or part and in any form for education or non-profit uses, without
special permission from the copyright holder, provided acknowledgement of the source is made. IUCN would
appreciate receiving a copy of any publication which uses this publication as a source.
No use of this publication may be made for resale or other commercial purpose without the prior written
permission of IUCN.
Citation: PBWO/IUCN. 2009. Final Project Report. Pangani Basin Water Board, Moshi and
IUCN Eastern & Southern Africa Regional Program. 89 pp.
Available from: IUCN - ESARO Publications Service Unit, P. O. Box 68200 - 00200, Nairobi, Kenya; Telephone
++ 254 20 890605-12; Fax ++ 254 20 890615; E-mail: [email protected]
The designations of geographical entities in this book, and the presentation of the material, do not imply the
expression of any opinion whatsoever on the part of the participating organizations concerning the legal status of
any country, territory, or area, or of its authorities, or concerning the delimitation of its frontiers or boundaries.
The opinions expressed by the authors in this publication do not necessarily represent the view of PBWB, EU,
UNDP GEF, WANI or IUCN.

IUCN WATER AND NATURE INITIATIVE
PANGANI BASIN WATER BOARD
PANGANI RIVER BASIN FLOW ASSESSMENT
Final Project Summary Report

CONTRIBUTORS
J. King Water Matters
J. Turpie Anchor Environmental
C. Brown Southern Waters
B. Clark Anchor Environmental
H. Beuster Emzantsi Systems
A. Joubert Southern Waters

i
TABLE OF CONTENTS
TABLE OF CONTENTS i
LIST OF TABLES iv
LIST OF FIGURES v
1 INTRODUCTION 1
1.1 Background 1
1.2 Pangani River Basin Flow Assessment Objectives, Workplan and
Deliverables 2
1.2.1 Project objectives 2
1.2.2 Work plan 2
1.2.3 Deliverables 7
1.3 Layout of this report 7
2 SUMMARIES OF PANGANI FA REPORTS 9
2.1 Hydrology Report (Volume 1) 9
2.1.1 Hydrology 9
2.1.2 Hydrological Data Management 14
2.1.3 Use of the Hydrology in Support of Water Resources Management and
Environmental Flow Assessments 15
2.2 Hydrology Report (Volume 2) 16
2.2.1 Purpose 16
2.2.2 Application of the Systems Model for the EF Assessments 16
2.2.3 Scenario Identification 17
2.2.4 Scenario Results 19
2.2.5 Training Requirements 20
2.3 Basin Delineation Report 21
2.3.1 Introduction 21
2.3.2 Catchment location and characteristics 21
2.3.3 River and estuary zonation 22
2.3.4 Socio-economic zonation 24
2.3.5 Synchronisation of the socio-economic and ecological zones 25
2.3.6 Study sites 26
2.4 Scenario Selection Report 27
2.4.1 Introduction 27
2.4.2 Water-related issues in Pangani River Basin 27
2.4.3 Expected trends for different sectors in the Pangani River Basin 28
2.4.4 Development of scenarios for consideration in the Flow Assessment 28
2.4.5 Selection and range of variables 29
2.4.6 Spatial and temporal resolution 30
2.4.7 Scenarios identified 30
2.5 River Health Assessment Report 31
2.5.1 Introduction 31
2.5.2 Overview of results 31
2.5.3 R1 - Nduruma River (Zone: Mountain Stream) 33
2.5.4 R2 - Kikuletwa River (Zone: Upper Foothill) 34
2.5.5 R3 - Kikuletwa River (Zone: Lower Foothill) 35
ii
2.5.6 R4 - Ona River (Zone: Mountain Stream) 35
2.5.7 R6 - Ruvu River (Zone: Lower Foothill) 37
2.5.8 R7 - Muraini (Mvuleni) River (Zone: Upper Foothill) 38
2.5.9 R8 - Pangani River (Zone: Lower Foothill) 38
2.5.10 R9 - Pangani River (Zone: Lower Foothill) 39
2.5.11 R10 - Pangani River (Zone: Rejuvenated Bedrock Cascade) 40
2.5.12 R11 - Pangani River (Zone: Mature Lowland River) 41
2.5.13 R12 - Mkomazi River (Zone: Lower Foothill) 42
2.5.14 R13 - Luengera River (Zone: Lower Foothill) 42
2.6 Estuarine Health Assessment Report 43
2.6.1 Introduction 43
2.6.2 Survey results 44
2.6.3 Estuarine Health Assessment 49
2.7 Socio-economic State of the Basin Report 50
2.7.1 Introduction 50
2.7.2 Study area and zonation 51
2.7.3 Approach used 51
2.7.4 Findings 52
2.7.5 Conclusions 55
2.8 Task 5 Report: Understanding flow-ecosystem-user relationships 56
2.8.1 Introduction 56
2.8.2 Key flow-related changes that have occurred in the Pangani Basin 56
2.8.3 Conceptual frameworks 57
2.8.4 Development and population of FA tools 58
2.8.5 Identification of specialist studies for Task 6 59
2.9 Scenario Report 60
2.9.1 Background 60
2.9.2 The scenarios 60
2.9.3 Predicted response of the river ecosystem 64
2.9.4 Basin-wide summaries 68
3 SUMMARIES OF EXTERNAL SPECIALIST REPORTS 72
3.1 Climate change scenarios 72
3.1.1 Comment 73
3.2 Macroeconomics 73
3.2.1 Comment 74
3.3 Fish, fisheries and invertebrates 75
3.4 Hydroelectric power 77
3.5 Hydraulic study 77
3.6 Vegetation 79
4 PROJECT GOAL MONITORING AND EVALUATION 81
4.1 Goal monitoring 81
4.1.1 Baseline data on the condition of rivers, wetlands and the estuary
against which the impact of water-related decision-making can be monitored 81
4.1.2 Enhanced understanding among PBWO and MoW staff of the
relationship between flow, river health and the people who use the river 82
iii
4.1.3 Awareness of the trade-offs to be made between water development
and natural-resource protection 83
4.1.4 Simple tools to help guide water-resource management and water
allocations in the Pangani River Basin 83
4.1.5 Capacity building 84
4.1.6 Support of the National Water Policy (NAWAPO 2002) and the National
Environmental Management Act (2004). 85
4.2 Evaluation 85
4.3 Lessons learnt 85
5 CONCLUSIONS 87
6 References 89

iv
LIST OF TABLES
Table 1.1 Gantt chart showing activities and tasks for the Pangani Basin Flow
Assessment, excluding the ‘Slowdown Tasks’. 4
Table 1.2 Gantt chart showing the ‘Slowdown Tasks’, and their effect on the
project schedule. 5
Table 1.3 The deliverables for the Pangani Basin FA, excluding specialist
reports 8
Table 2.1 Key Point Water Balances 10
Table 2.2 Initial Selection of Six Scenarios 18
Table 2.3 Sectoral water allocations 20
Table 2.4 Synchronised ecological and socio-economic zones. 24
Table 2.5 Study sites selected for the river health assessment. 26
Table 2.6 System variables and the possible envelope of their characteristics
in 2025, including a ‘most likely’ description 29
Table 2.7 The 12 scenarios identified for further discussion 30
Table 2.8 Estuarine Health Score results for the Present State of the Pangani
Estuary 49
Table 2.9 Water supply priorities used in the hydrological model WEAP. PD =
Present Day. 62
Table 2.10 Colour coding to illustrate shift in condition from Present Day at the
FA river sites for the fifteen scenarios. pink: low decline in
condition; orange: moderate decline; red: severe decline; pale blue:
low improvement; dark blue: moderate improvement. 65
Table 2.11 Change in estuarine health for the 15 scenarios (PD = Present
Day). 66
Table 2.12 Change in area of NyM, fish catch and reed area for the 15
scenarios. 66
Table 2.13 Change in area of Kirua swamp, fish and vegetation abundance
area for the 15 scenarios. 67
Table 2.14 Summarised economic impacts of the fifteen scenarios in terms of
changes in Tsh millions from Present Day (DSS software Sept 2009) 69
Table 2.15 The status of key descriptors under each scenario 70
Table 3.1 Specialist topics, authors and reviewers 72
Table 5.1 Sustainable use of rivers: key attributes of implementation (King
and Brown in press) 88

v
LIST OF FIGURES
Figure 2.1 Catchment Discretisation 9
Figure 2.2 Comparison of Naturalised and Current Day Flows – Kikuletwa 12
Figure 2.3 Comparison of Naturalised and Current Day Flows - Mkomazi 12
Figure 2.4 Comparison of Naturalised and Current Day Flows – Ruvu 13
Figure 2.5 Comparison of Naturalised and Current Day Flows – Luengera 13
Figure 2.6 Comparison of Naturalised and Current Day Flows – Pangani
Estuary 14
Figure 2.7 Modelling sequence and linkages between the processes 16
Figure 2.8 River basins administered by the PBWO, including the Pangani
River Basin. Source: PBWO/IUCN. 22
Figure 2.9 River zones. The Rejuvenated Foothill zone is too small to show
but is situated in the vicinity of K3 to R7. 23
Figure 2.10 Socio-economic zones within the Pangani River Basin, in relation
to rivers, major dams and lakes, and villages and towns. 25
Figure 2.11 Map of the Pangani estuary showing the upper, lower and lateral
boundaries (solid lines), division into Upper, Middle and Lower
Zones (dotted lines) and the study sites. 27
Figure 2.12 Sites within the Pangani River Basin assessed for river health.
Zones are indicated. 32
Figure 2.13 Simple graphic showing the hypothesised reference (natural) and
present day status of the Pangani estuary. Note changes in
channel profile, depth and width, water clarity, and abundance of
fauna and flora. 50
Figure 2.14 Conceptual framework for planning at the basin level 58
Figure 2.15 Impacts on societal well-being for the 15 scenarios. 68
Figure 2.16 Changes relative to Present Day in million Tsh for the economic
values showing the relatively large impacts of hydroelectric power
and agriculture relative to natural resources and ecosystem
services. 69
Figure 2.17 Percentage change from present day in terms of ecosystem
integrity, social well-being and economic values. 71

vi
ACKNOWLEDGEMENTS
The authors wish to extend their thanks to:
• The Pangani Basin Water Office for logistical support.
• The IUCN Nairobi Office for administrative support.

1
1 INTRODUCTION
1.1 Background
Tanzania’s National Water Policy (NAWAPO 2002) provides that water for
maintenance of aquatic ecosystems will be accorded second highest priority in
allocation, after water for basic human needs. Tanzania has little experience and
capacity in environmental flow assessments to support this environmental policy
provision. The Pangani River Basin Management Project, supported by the IUCN
Water & Nature Initiative, UNDP/GEF and the European Union, has made a
commitment to conduct a flow assessment in the Pangani Basin as a means of
providing relevant technical information (hydrological, economic, ecological and
social) to the Pangani Basin Water Board to support the water-allocation process.
Support to the Pangani Basin Water Office (PBWO) started with a 4-day training
course on environmental flows held in Mbeya, in September 2003, organised by the
Ministry of Water and Livestock Development (now Ministry of Water and Irrigation)
and supported by the World Bank, through its Lower Kihansi Environmental
Management Project and River Basin Management Project (with sponsorship from
the Bank Netherlands Water Partnership Program), and by IUCN, through its Water
and Nature Initiative. A training course in environmental economics, supported by
the IUCN Water & Nature Initiative, was convened in October 2003. It focussed on
livelihood use of the river and estuary, and valuation of goods and services provided
by the freshwater ecosystems in the basin.
Subsequent to these exercises, IUCN and the PBWO initiated discussions with
Southern Waters (Southern Waters) and Anchor Environmental Consultants
(“Anchor”) in October 2004 about conducting a flow assessment in the Pangani River
Basin. Initial discussions focussed on conducting a detailed flow assessment using a
complex methodology applied in South Africa (the DRIFT Methodology) but key
limitations were the amount and nature of supporting hydrological data for the
Pangani River Basin, and a limited specialist capacity for conducting flow
assessments in Tanzania. Owing to these concerns it was decided that application
of a full DRIFT Methodology could be too data- and expert-intensive for what was
planned as the first FA application in Tanzania, and that it would in all likelihood fall
short on the overriding need of creating capacity for flow assessments within
Tanzania. Following this, a series of meetings and visits to key locations in the
Pangani River Basin were conducted by representatives from PBWO, IUCN and
Southern Waters between 13 and 18 December 2004, and a detailed proposal
developed for what was termed a “Pangani capacity-building Flow Assessment”. In
essence the proposal called for the establishment of a Flow Assessment Team
selected from within Tanzania, consisting of specialists in a range of river-related,
water-allocation and policy-making disciplines, which could work with international
flow-assessment advisors from or working through Southern Waters or Anchor.
Together, they would gradually develop an understanding of the hydrology of the
Pangani River Basin, the nature and functioning of the river system and the links

2
between the river and subsistence use of its resources. The two aims of the project
were to be hands-on capacity building of the PBWO and the Tanzanian group of
specialists (who in the future could act as a nucleus of expertise for other Tanzanian
basins), and the provision of technical information and decision support tools to
assist the Pangani Basin Water Office and the Pangani Basin Water Board in
managing water resources.
1.2 Pangani River Basin Flow Assessment Objectives, Workplan and
Deliverables
1.2.1 Project objectives
The objectives of the Pangani Basin Flow Assessment (FA) were to:
• generate baseline data on the condition of rivers, wetlands and the estuary
against which the impact of water-related decision-making can be monitored
in future;
• enhance the understanding among PBWO and MoW staff of the relationship
between flow, river health and the people who use the river;
• create an awareness of the trade-offs to be made between water
development and natural-resource protection;
• develop simple tools to help guide water-resource management and water
allocations in the Pangani River Basin;
• build capacity that will enable PBWO to act as a nucleus of expertise for FA-
related work in other areas;
• support the National Water Policy (NAWAPO 2002) and the National
Environmental Management Act (2004).
1.2.2 Work plan
As with many projects, the Pangani River Basin FA project developed and was
adjusted through its duration. The project was originally envisaged to span a total
period of just over two years – October 2005 to February 2008, but was extended
twice: once (“Slow-down I”) to incorporate an additional Training Workshop, and a
second time (“Slow-down ll”) to incorporate additional scenarios and intensive
training on the procedures used to assess those scenarios.
Accordingly, this report addresses three separate phases of the project:
• Phase 1: The project as proposed.
• Phase 2: Slowdown I
• Phase 3: Slowdown II.
A breakdown of timing of these phases is provided in Table 1.1 and Table 1.2,
respectively.

3
1.2.2.1 Phase 1: The project as proposed
The final agreed proposal for the Pangani River Basin FA comprised a total of ten
tasks.
Task 1: Hydrology: A desktop-exercise that described water-resource
developments in the catchment, obtained daily flow records for
the basin, simulated daily historical and present-day flow data,
developed a simple hydrological system model for the Pangani
River Basin, and generated relevant hydrological data for
selected scenarios.
Task 2: Study area delineation and site selection: The objectives of this task were to
divide the river into relatively homogeneous zones in terms of
biophysical characteristics (river reach analysis) and land-use,
and homogeneous zones across the basin in terms of social
factors; to select representative sampling sites in the river
zones, in the estuary and in each social zone; and to develop
simple (GIS) base maps for use in the following tasks.
Task 2.1: Scenario identification: The main objective of this task was to conceptualise
the kind of scenarios that would be created and evaluated later
in the project, as a guide for appropriate data collection.
Task 3: Health assessment of the rivers and estuary: Building on Task 2 and using
the sites selected there, this task comprised health
assessments of the river system and estuary. The
assessments were based on existing information and some
data collection.
Task 4: Baseline socio-economic assessment: Also building on Task 2 and using the
selected sites, this task included completion of a social field
survey using participatory methods and household surveys. It
described the communities, focussing on their relation to water
and water resources, their socio-economic well-being and
sensitivity to changes in river flow, and included a baseline
assessment of socio-economic conditions in the basin.
Task 5: Develop an understanding of the ecological and economic systems: This task
identified and evaluated key flow-related changes that have
occurred over time in the Pangani River Basin; developed
simple conceptual models for the changes that have occurred;
identified topics (e.g. climate change; hydropower; vegetation)
for more in-depth investigation; and developed Terms of
Reference for these in-depth investigations.
Task 6: Specialist Studies: In this task, appointed specialists completed research on
the priority topics and submitted separate reports. These were
initially reviewed by the Project Team and then also by
appointed specialist reviewers and IUCN/PBWO.

4
Table 1.1 Gantt chart showing activities and tasks for the Pangani Basin Flow Assessment, excluding the ‘Slowdown Tasks’.

5
Table 1.2 Gantt chart showing the ‘Slowdown Tasks’, and their effect on the project schedule.
J F M A M J J A S O N D J F M A M J J A S O N D J F M A M J J A S O N D
1 1 2 2
Original Tasks = original scheduling
Slow Down 1 Add. Tasks = rescheduling for Slown Down 1
Slow Down 2 Add. Tasks = rescheduling for Slown Down 2
= unscheduled delay
2009 2010
Task 12: Cape Town Mentoring
Task 13: Eight additional scenarios
Task 10: Awareness raising outside of the
Task 11: Training workshop (NEW TASK)
2008
Task 8: Scenario evaluation by whole team
Task 8: Practical application of scenario
Task 8: Scenario Evaluation Report
Task2007
Task 9: Final Reporting including glossy
Task 6: Specialist briefing meeting; Table of
Task 6: Develop an understanding of the
Task 6: Specialist reports received and sent
Task 7: Capture conceptual relationships,

6
Task 7: Develop conceptual relationships, create and evaluate scenarios: This task
included development of conceptual relationships between
flows and the river ecosystem, and between flows, river health
and livelihoods; development of a simple FA scenario-
evaluation tool using the information gathered in previous
tasks; population of the scenario-evaluation tool with the
conceptual flow-response relationships; training the National
Pangani FA Team in the use of the scenario-evaluation tool;
and preparation of a manual for operating the FA scenario-
evaluation tool.
Task 8: Practical application of scenario evaluation by National Pangani FA Team:
This was a capacity-building task wherein the National
Pangani FA Team evaluated one additional scenario and
evaluated the usefulness of the tool and manual developed in
Task 7. This task was eventually augmented by the Slowdown
II activities (see Task 12).
Task 9: Final Reporting: This task is the subject of this report, which synthesises
information from the previous tasks into a Final Project Report
of the Pangani River; and evaluates the extent to which the
project has achieved its goals.
Task 10: Awareness raising outside the National Pangani FA Team. This task, not
yet completed, comprises presentations to the Pangani Basin
Water Board, and the creation of text for two glossy
publications (One of these glossy brochures - the State of the
Basin Report – was compiled using the results of the river
(Section 2.5) and estuary health assessments (Section 2.6)
and social state of the basin (Section 2.7) reports; the other will
be completed in early 2010.
1.2.2.2 Phase 2: Slowdown I
Slowdown I involved the inclusion, mid-project via Task 11, of a training course for
officials from PBWO and the neighbouring Wami-Ruvu Basin.
Task 11: Training Course. This took place on 23-27 July 2007 in Morogoro. The aim
was to share information regarding the ongoing project, see
what other basins are doing (i.e. Wami Ruvu), and strengthen
and develop the community working on Environmental Flow
Assessments (EFA) in Tanzania, so that they can continue
working in the Pangani and beyond. The first day consisted of
background information about rivers and our basic
understanding of the physical, chemical and ecological factors
that relate to flows. The second day focused on understanding
the river and how to use this to guide decision-making on
water allocations. The third and fourth days focused on group

7
meetings to better understand specific issues in the specialist
fields.
1.2.2.3 Phase 3: Slowdown II
Slowdown II involved an expansion of work done in Task 8, via Task 12. It consisted
of a two-week mentoring session, plus some adjustments to the Pangani FA DSS
and the evaluation of an additional eight scenarios.
Task 12: Two-week mentoring in Cape Town: Five members of the Tanzanian Core
Team travelled to Cape Town for mentoring on the Pangani FA DSS,
from the hydrological model WEAP through to the Scenario Interface
DSS software, and interpretation of the results. The final three
contracted scenarios, plus one other, were run during this visit,
whereafter the Southern Waters/Anchor team completed the FIRST
DRAFT of the Scenario Report.
Task 13: Inclusion of additional information in the Pangani Flows DSS. This task
involved incorporation of some economic indicators into the scenario
outputs; final edits to the Pangani Flow DSS, protection of key
sequences and inclusion of these aspects in the User Manual.
Adjustments also included provision for a suite of 18 scenarios in the
DSS instead of the previous plan that was to cater for 12 scenarios.
Task 14: Analysis of eight additional scenarios: The trained members of the Core
Team were responsible for running the hydrological component of
these scenarios (i.e., WEAP and DRIFT-Hydro) and the results of
these hydrological analyses were checked by the Southern Waters
team. The remainder of the scenario analysis’ activities were
completed at a workshop held from 18-20th August 2009 in Stone
Town, Zanzibar, Tanzania. The results from these additional
scenarios were incorporated into the Final Scenario Report.
1.2.3 Deliverables
The deliverables for the Pangani Basin FA are listed in Table 1.3. Summaries of
each of the reports are also provided in Section 2.
1.3 Layout of this report
This report summarises the above set of reports in Chapter 2, briefly describes the
specialist reports in Chapter 3, and assess the achievements of the project in
Chapter 4. Chapter 5 concludes the report.

8
Table 1.3 The deliverables for the Pangani Basin FA, excluding specialist reports
Report
# Title Tasks addressed
Date first
submitted
REPORTS
Hydrology Report Volume 1 August 2006 1
Hydrology Report Volume 2 Task 1
August 2009
2 Basin Delineation Report Task 2 March 2006
3 Scenario Selection Report Task 2.1 March 2006
4 River Health Assessment Task 3 October 2006
5 Estuarine Health Assessment Task 3 October 2006
6 Socio-economic State of the Basin Task 4 November 2006
7 Task 5 Report Task 5 November 2006
8 Pangani FA Tool User Manual Task 7 May 2008
9 Scenario Report Tasks 7 and 8 June 2008
10 Final Project Report Task 9 September 2009
OTHER
- Pangani FA Tool Task 7 and 8 May 2008
- State of the Basin Glossy Report Task 10 December 2006
- Summary Report – text for Glossy
Report Task 10 December 2009
- Powerpoint Presentations Task 11, 12 As tasks
completed

9
2 SUMMARIES OF PANGANI FA REPORTS
2.1 Hydrology Report (Volume 1)
2.1.1 Hydrology
A hydrological model of the Pangani River Basin was configured, calibrated, and
used to produce long-term flow sequences at 15 key points in the system. The work
to develop and use the models was done in close collaboration with the (then) PBWO
Basin Hydrologist, Dr George Lugomela, with assistance from officials working in the
regional hydrology offices of the MoW. The Basin was discretised into five main
catchments that together comprise 15 sub-catchments. The main catchments have
significantly different hydrological characteristics, and it was considered important
that successful calibrations be achieved at the outlets of each of the main
catchments (the Ruvu, Kikuletwa, Mkomazi, Luengera and Pangani). The main
catchments are shown with solid black borders in Figure 2.1. The coloured
subdivisions represent the 15 sub-catchments for which long-term flow sequences
were developed.
Figure 2.1 Catchment Discretisation

10
To illustrate the extent to which the water resources of the Basin have been
developed, water balances were prepared for five key sites in the Basin. The sites
correspond to the downstream outlets of the major catchments, i.e. the Kikuletwa and
Ruvu catchments upstream of Nyumba ya Mungu Dam, the Mkomazi and Luengera
catchments, and the outlet of the entire Pangani River catchment at the Pangani
Estuary. The water balances are shown in Table 2.1.
Table 2.1 Key Point Water Balances
Component
Kik
ule
twa
Ru
vu
Mko
ma
zi
Lu
en
ge
ra
Ma
in s
tem
PA
NG
AN
I
RIV
ER
BA
SIN
Streamflow
reduction by
natural forests
Mm3/a A 180 201 35 28 14 458
Natural runoff
including
endorheic runoff
Mm3/a B 884 928 302 175 830 3 119
Natural upstream
inflows Mm
3/a C 0 0 0 0 2020 0
Endorheic runoff Mm3/a D 212 58 1425 1 695
Cumulative
natural runoff Mm
3/a
E = B+C-
D 884 928 90 117 1425 1 424
Current day
upstream inflows Mm
3/a F 0 0 0 0 1691 0
Current day
endorheic runoff Mm
3/a G 0 0 82 56 1163 1 302
Consumptive
water demand Mm
3/a H 751 276 487 13 74 1 600
Water supplied Mm3/a I 592 232 240 13 74 1 150
% demand met % J 79 84 49 100 100 72
Evaporation Mm3/a K 0 0 6 0 71 77
Return flows Mm3/a L 371 183 64 4 15 637
Cumulative
current day
runoff
Mm3/a
M = B +
F – G – I
– K + L
663 879 38 110 1 227 1 227
Hydropower
requirement Mm
3/a N 600
% utilisation % (1 – (M-
N)/E) x100 25 5 58 6 14 56
The water balances show that the Mkomazi catchment is most developed with about
58% of the catchment’s natural runoff utilised, followed by the Kikuletwa catchment
where about 25% of the natural runoff is currently utilised. The mass balances are

11
based on average annual figures, which disguise the fact that most of the utilisation
occurs in the dry season, when irrigation requirements are highest.
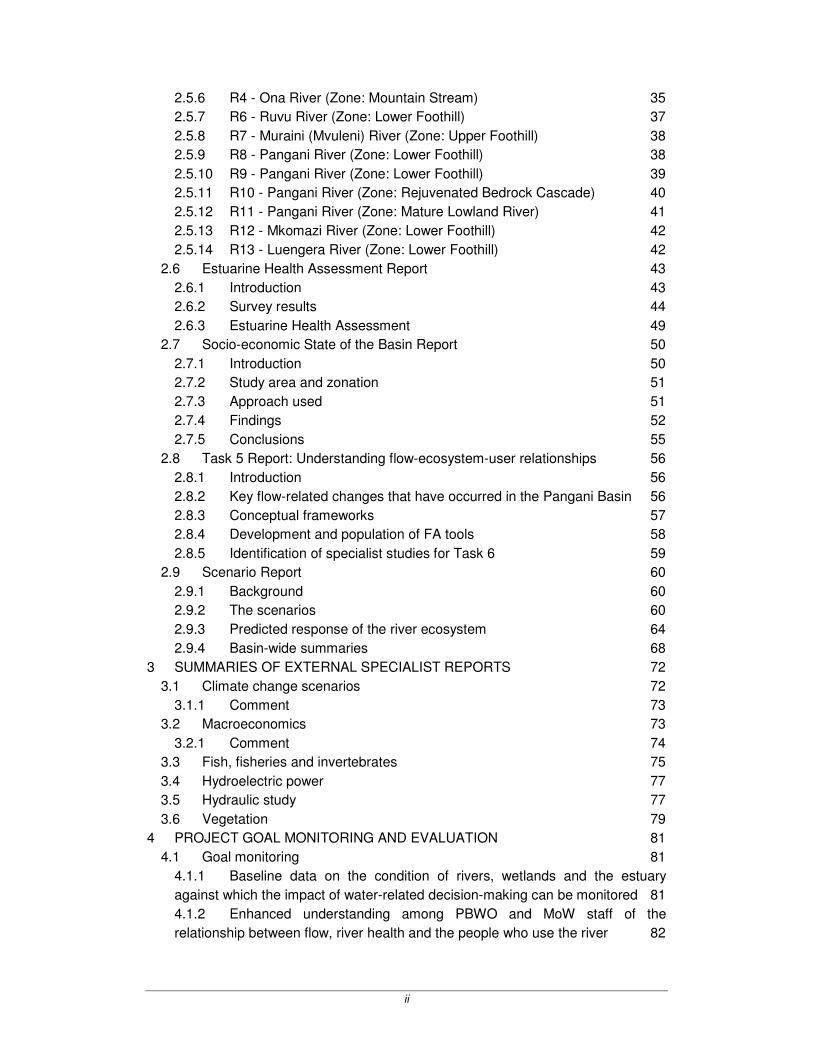
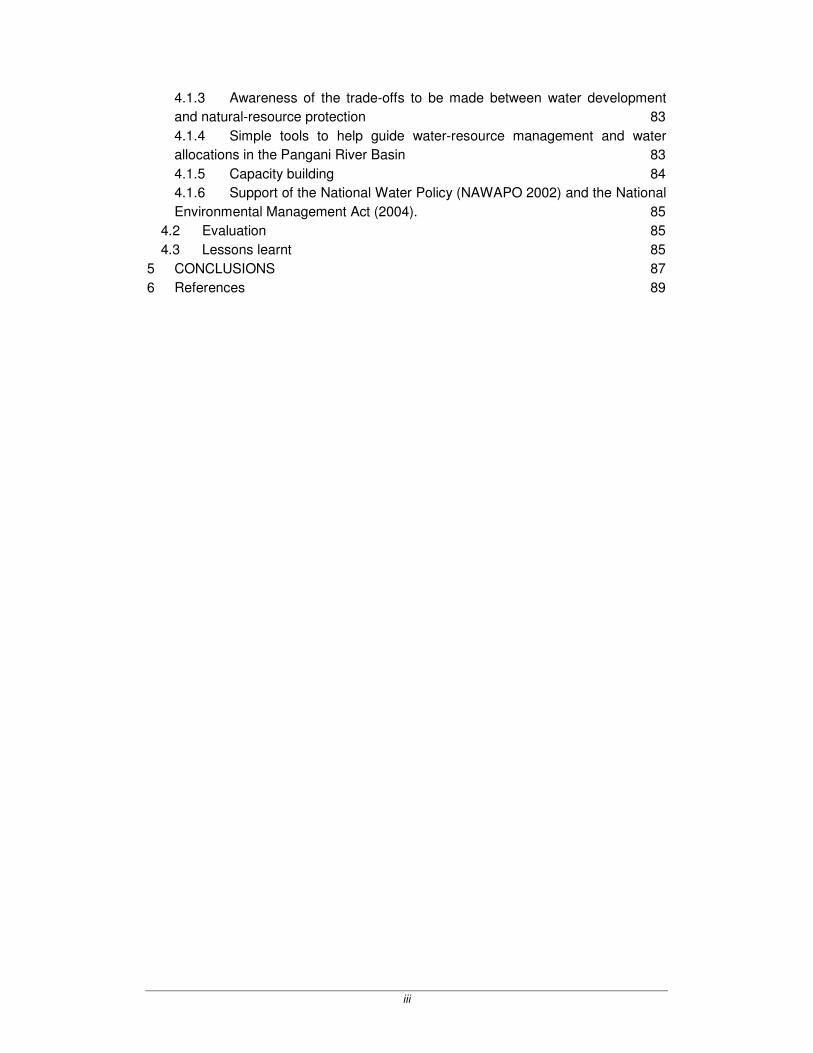
Figure 2.2 to Figure 2.6 show comparisons of monthly natural and current day runoff
at the five key points in the system. The charts provide summary statistics of the 76-
year long naturalised and current day runoff sequences, and show 5% (very wet),
50% (median), and 95% (very dry) monthly exceedence volumes.
The hydrology of the Kikuletwa catchment indicates that, in spite of large reductions
in dry-season flows, the river is still perennial (Figure 2.2). This is due to the
contributions of the springs to surface flows in the middle part of the catchment.
Upstream of the springs, some tributaries dry up completely in the dry season, even
in years with normal runoff conditions.
The high utilisation of the Mkomazi (Figure 2.3) is illustrated by the fact that this
formerly perennial river is now dry for a large percentage of time. A feature of the
Mkomazi catchment hydrology, not seen in the other catchments, is the occurrence
of large flood events in the short rainy season of November to December. The
magnitude of these floods has been reduced by the presence of Kalimawe Dam, in
the middle part of the catchment.
Dry season flows in the Ruvu (Figure 2.4) and Luengera (Figure 2.5) catchments
have been significantly reduced, but nowhere near the extent seen in the Kikuletwa
and Mkomazi catchments.
Current day inflows to the Pangani Estuary (Figure 2.6) show a marked reduction in
dry-season high flows and wet-season low flows, mostly due to flood interception at
Nyumba ya Mungu and Kalimawe Dams. Dry-season low flows show relatively small
reductions, in part due to contributions from the Luengera catchment, but also due to
hydropower releases from Nyumba ya Mungu Dam.
Overall utilisation of the water resources of the Basin is estimated to be about 56%,
with hydropower accounting for the largest portion of this use. Much of the remaining
runoff occurs in the form of floods and is therefore not exploitable. Utilisation is
expressed as a percentage of natural runoff, excluding endorheic runoff volumes.
The water balance therefore excludes groundwater volumes that can potentially be
extracted from aquifers that are not directly connected to the surface water systems.

12
1DB17 - Mkomazi at Gomba
0
5
10
15
20
25
30
35
40
Oct
Nov
Dec
Jan
Feb
Mar
Apr
May
Jun
Jul
Aug
Sep
Mo
nth
ly R
un
off
[M
m3]
5 %
50 %
95 %
Naturalised5 %
50 %
95 %
Current Day
Figure 2.2 Comparison of Naturalised and Current Day Flows – Kikuletwa
1DD1 - Kikuletwa at TPC
0
50
100
150
200
250
300
350
Oct
Nov
Dec
Jan
Feb
Mar
Apr
May
Jun
Jul
Aug
Sep
Mo
nth
ly R
un
off
[M
m3]
5 %
50 %
95 %
Naturalised5 %
50 %
95 %
Current Day
Figure 2.3 Comparison of Naturalised and Current Day Flows - Mkomazi
13
1DC1 - Ruvu at Railway Bridge
0
50
100
150
200
250
300
350
400
450
500
Oct
Nov
Dec
Jan
Feb
Mar
Apr
May
Jun
Jul
Aug
Sep
Mo
nth
ly R
un
off
[M
m3]
5 %
50 %
95 %
Naturalised5 %
50 %
95 %
Current Day
Figure 2.4 Comparison of Naturalised and Current Day Flows – Ruvu
1DA1 - Luengera at Korogwe
0
10
20
30
40
50
60
70
80
Oct
Nov
Dec
Jan
Feb
Mar
Apr
May
Jun
Jul
Aug
Sep
Mo
nth
ly R
un
off
[M
m3]
5 %
50 %
95 %
Naturalised5 %
50 %
95 %
Current Day
Figure 2.5 Comparison of Naturalised and Current Day Flows – Luengera

14
Comparison of Naturalised and Current Day Flows at Pangani Estuary
0
100
200
300
400
500
600
Oct
Nov
Dec
Jan
Feb
Mar
Apr
May
Jun
Jul
Aug
Sep
Mo
nth
ly R
un
off
[M
m3]
5 %
50 %
95 %
Naturalised5 %
50 %
95 %
Current Day
Figure 2.6 Comparison of Naturalised and Current Day Flows – Pangani Estuary
2.1.2 Hydrological Data Management
There is an extensive flow measurement network in the Pangani Basin. The
management of data-collection activities and maintenance of the network
infrastructure are, however, beset with difficulties that compromise the integrity of the
data. These include the management and updating of rainfall and flow records in
various copies of a HYDATA database, flow rating curves that do not adequately
cover the range of flows that are seen at the measuring stations, infrequent updating
of the rating curves, and equipment failures at the measuring stations. Previously,
the Ministry was responsible for the collection and management of hydrological (river
flow) data through the Regional Offices. This responsibility has now devolved to the
Basin Water Office and is done through the Field Offices (formerly regional offices).
Taking over the responsibility for data management in the Pangani Basin will
probably be one of the more significant challenges that the PBWO will have to
address. It will however provide an opportunity to put the necessary quality-
assurance procedures in place, and to provide much needed training.
For the purposes of the FA Project, 14 key river-flow measurement stations were
identified and the rating curves and data records for these stations were re-worked.
The PBWO arranged for Ministry and Field Office officials to participate in the
exercise so that data management skills, especially in the Field Offices could be
strengthened. The following short-term interventions are recommended:
• At the time of writing this report, the three Regional Offices were
maintaining separate copies of the database (in some instances more than
one copy in the same office), while the MoW maintains a master copy. To

15
avoid unnecessary duplication of effort, and to improve overall data quality
control, procedures for the synchronisation of the four HYDATA databases
should be developed and formalised.
• Some of the data problems that are experienced are due to inadequate
training in the use of HYDATA, especially with the management of flow
rating curves. It is recommended that refresher training be arranged with
the software developers. The HYDATA training should be backed up with
general PC (MS Windows) literacy training.
• The HYDATA software has several shortcomings, most notably that the
database is essentially a desktop (single user) system, and the inability of
the software to allow for variable time-step data recording. It is
recommended that multi-user alternatives be investigated. To promote
data exchange and pooling of skills, developments in neighbouring
countries and SADC should be taken into account.
2.1.3 Use of the Hydrology in Support of Water Resources Management
and Environmental Flow Assessments
The confidence with which the hydrology report can be used to inform planning
decisions is limited by a number of uncertainties, such as the reliability of flow
measurement records, the actual extent of irrigated agriculture and volumes of water
abstractions in the Basin, complex surface-groundwater interactions in the upper
parts of the Basin, and the extent of endorheic runoff in the Mkomazi and Luengera
catchments and the Pangani catchment downstream of Nyumba ya Mungu. In spite
of these uncertainties, the hydrology provides a clear indication of the extent of
water-resource development in the major sub-regions of the Basin and the impact
that this has had on flow regimes in the Basin.
This hydrological assessment provided an adequate basis for undertaking the
environmental flow assessments of the study, and also for supporting the water
allocation process in the long term. The long-term monthly hydrological data were
used for scenario planning to describe the effect that possible future demands may
have on the water supply to the various water sectors and sub-regions. The systems
modelling aspects of this work are discussed in Volume 2 of the Hydrology Report –
Development and Application of a Systems Model for the Pangani River Basin, and
in Section 2.2 of this report. The monthly sequences produced with the systems
model do not provide sufficient information to assess impacts on the aquatic
ecosystem that may stem from changes in the daily flow regimes. To address this
gap in the information, a simple approach was followed to disaggregate the simulated
monthly flow sequences into daily flow sequences with the aid of measured daily flow
records.

16
2.2 Hydrology Report (Volume 2)
2.2.1 Purpose
The purpose of the System Analysis component of the Flow Assessment (FA)
Initiative of the IUCN/PBWO was to simulate the flow sequences that would result
from future development scenarios in order to provide the hydrological information
required for assessing the ecological and socio-economic impacts of future
development pathways. Current Day flow sequences and the current levels of water
use in the Basin provide the Reference scenario against which development
scenarios are compared to evaluate their effects on the river system.
2.2.2 Application of the Systems Model for the EF Assessments
To provide the hydrological information required for the EFA, a WEAP systems
model was configured to provide current day (baseline) and scenario flow sequences
at the EFA sites. WEAP outputs were processed to provide stream flow and
inundation information for ecological health assessments at the river, swamp, lake
and estuary sites. In addition, information on water supplies to the different water
use sectors was provided for the socio and macro-economic assessments.
The modelling sequence and linkages between the processes are shown in Figure
2.7.
Figure 2.7 Modelling sequence and linkages between the processes

17
• Catchment hydrology: Estimates of naturalised (undeveloped) long-term runoff
and present-day water use and infrastructure were obtained from the SHELL
Pitman-based catchment model.
• Systems Model: The monthly time-step WEAP systems model was used to
configure a reference (Present Day), and the future development scenarios.
Inputs to the model include the undeveloped runoff sequences for the sub-
catchments produced by the catchment model, irrigation scheme and urban
abstractions, in-channel dams for irrigation water supply, and run-of-river and
storage-based hydropower schemes.
• Monthly reservoir levels: Monthly reservoir levels for NyM were exported from
WEAP and used in conjunction with the dam’s water level – surface area
relationship to provide input to the Lake EF assessment.
• Monthly estuary inflows and irrigation return flows: These were exported
directly from WEAP, and used as input to the Estuary FA tool to assess impacts
on the estuary.
• Water supplies to sectors and hydropower generation: These were exported
directly from WEAP, and used as input to the Socio-Economic FA tool. Volumes
of water supplied to irrigation were converted to equivalent areas of irrigation that
could be supplied at 75% assurance.
• Disaggregation: A custom utility was developed to disaggregate the simulated
monthly WEAP flow sequences to daily flow sequences. The use of the utility is
described in the Pangani Flows Decision Support System - User Manual
(PBWO/IUCN 2006).
• DRIFT-HYDRO: The hydrological manipulations required for determining the
implications of a daily flow regime on the river ecosystem (represented by a
series of river sites) are done using DRIFT-HYDRO. This is a stand-alone
software package that forms part of the suite of programmes and databases
making up DRIFT. Outputs are summary flow statistics for each site under each
scenario that can be interpreted by river and social scientists. Details of the flow
analyses are provided in the integrated Scenario Report: The analysis of water-
allocation scenarios for the Pangani River Basin (PBWO/IUCN, 2009).
2.2.3 Scenario Identification
The identification and selection of scenarios are discussed in the Scenario Selection
Report (PBWO/IUCN, 2006). A summary of the process is given in Section 2.4 of
this report. The final list of scenarios are shown here, and repeated in Section 2.4 for
ease of reference. Twelve scenarios were initially identified and it was agreed that
these be carried forward for further consideration by the FA team. Later, after further
consideration of the scenarios, it simulation work began on the six scenarios shown
in Table 2.2.

18
Table 2.2 Initial Selection of Six Scenarios
Name # 1st
priority
2nd
priority
3rd
priority
4th
priority
Residual Purpose
Maximise
Agriculture 1
Basic
Human
Needs
Domestic &
Industrial High Agric
Most Likely
HEP Environment
Demonstrates the impact on other sectors
if Agriculture expands as much as
possible
Maximise
HEP 2
Basic
Human
Needs
Domestic &
Industrial High HEP
Most Likely
Agriculture Environment
Demonstrates the impact on other sectors
if HEP production at maximum capacity is
always prioritised
Status quo
plus Climate
Change
3
Basic
Human
Needs
Domestic &
Industrial
Most Likely
Agriculture
Most Likely
HEP Environment
Demonstrates the impact on the present
situation of climate change
Maximise
River
Condition +
Water Policy
4
Basic
Human
Needs
Best
Possible
Environmen
t
Domestic &
Industrial
Most Likely
Agriculture HEP
Demonstrates the impacts on other
sectors of best possible ecosystem
condition given the current infrastructure
in the basin. Water Demand Manage-
ment applied to Domestic and Industrial
Water Policy
& Agriculture 5
Basic
Human
Needs
Moderate
Environmen
t
Domestic &
Industrial
Most Likely
Agriculture HEP
Demonstrates the most likely projections
of implementing NAWAPO and prioritising
Agriculture. Water Demand Management
applied to Domestic and Industrial
Water Policy
& HEP 6
Basic
Human
Needs
Moderate
Environmen
t
Domestic &
Industrial
Most Likely
HEP Agric
Demonstrates the most likely projections
of implementing NAWAPO and prioritising
HEP. Water Demand Management
applied to Domestic and Industrial
In November 2008, it was agreed to analyse an additional four scenarios. These
were done in May 2008 as part of a Core Team and PBWO training exercise. The
additional scenarios were:
7. Maximise Agriculture, less 20% wet season rainfall (Max Agric, less 20%).
8. Maximise Agriculture, less 30% wet season rainfall (Max Agric, less 30%).
9. Maximise HEP, less 20% wet season rainfall (Max HEP, less 20%).
10. Maximise HEP, less 30% wet season rainfall (Max HEP, less 30%).
Subsequent to the May 2008 workshop, a final five scenarios were added to the list.
The hydrological analyses for these scenarios were done in July and August 2009,
and the biophysical and socio-economic assessments were done by the Core Team
at a workshop in Stone Town, Zanzibar in August 2009. The final five scenarios
were:
11. Storage upstream of NyM, with Maximise Agriculture.
12. Storage downstream of NyM (Luengera), to compensate HEP.
13. Combination of storage upstream of NyM, with Maximise Agriculture AND
storage downstream of NyM (Luengera), to compensate HEP.
14. Mixed benefits, which includes storage upstream and downstream of NyM.
15. Storage upstream of NyM, with Optimised Present Day.

19
2.2.4 Scenario Results
If existing development trends in the Pangani River Basin prevail into the future, the
High Agriculture scenario is the most likely (“Business as Usual”) future for the basin.
The scenario was built on a number of assumptions, key of which are that the current
crop mix will prevail in the future, the application of the 1975 to 2005 growth rates to
project growth of irrigated areas, and that there will be an improvement in the
irrigation efficiency (Water Demand Management (WDM) in irrigation). This study
has assumed that through various means, the efficiency of water use will improve by
30% by 2025. The effects of this assumption were crucial to the results of the study,
in that it allowed expansion in the area under irrigation while water supply to
agriculture had to decrease as a result of the expected increase in urban demands.
It is important to note that the expansion in agriculture was made possible almost
entirely from this increase in efficiency. This suggests that increasing water-use
efficiency should be the top priority of water managers in the basin. This can
be brought about not only through the development of better irrigation infrastructure,
but also through water demand management (through pricing and payment collection
strategies). The assumptions used in this study did not take the potential impacts of
water demand management on urban or rural demands into account. Given the
scale of the anticipated growth in urban demand, the outcome of the alternative
scenarios might have looked considerably better if greater efficiency in urban use
through general demand management had also been assumed.
The foregoing indicates that regardless of the future assumption made, there is
actually very little room for expansion of irrigated agriculture under present
agricultural practices. The key to agricultural development in the basin lies in
unlocking the amount of water tied to irrigation at present. The improvement in
irrigation efficiency indicated that actual demand would be lower compared to present
demand in some sub-catchments. It therefore means that a high improvement in
water-use efficiency would free up a good amount of water for new agricultural
expansions and/or other needs. It is therefore the recommended that this is the
recourse, which the PBWO should promote and work on in order to address shortage
of water for irrigation in the Basin.
The hydrological consequences of each scenario were summarised in terms that
could be used for social and ecological interpretation. These flow summaries were
produced with DRIFT-HYDRO, and are provided in the integrated Scenario Report
(PBWO/IUCN 2009). The changes in river flow are summarised in Section 2.9.
The water allocations for urban, industrial, domestic and agriculture, and expected
HEP production are provided in Table 2.3.

20
Table 2.3 Sectoral water allocations
Urban, industrial
and domestic
Irrigation (@ 75%
assurance) HEP
Scenario
Mm3a
-1 Mm
3a
-1 MWh
PRESENT DAY 31.1 1 042 602 647
MAXIMISE AGRICULTURE 54.7 1 0322 428 134
MAXIMISE HEP 54.7 634 782 601
OPT PRESENT DAY, AGRIC 53.6 520 612 474
OPT PRESENT DAY, HEP 53.6 435 784 235
HIGH ENVIRONMENT, AGRIC 50.9 497 601 411
MODELLED CLIMATE CHANGE 54.7 1 0163 472 371
MAXIMISE AGRICULTURE – LESS 20% 54.7 873 225 815
MAXIMISE AGRICULTURE – LESS 30% 54.7 807 141 347
MAXIMISE HEP – LESS 20% 54.7 286 755 227
MAXIMISE HEP – LESS 30% 54.7 203 614 810
STORAGE U/S NYM WITH MAXIMISE
AGRICULTURE 54.7 1 031 420 688
STORAGE D/S NYM WITH MAXIMISE HEPE 54.7 934 478 802
COMBINATION OF U/S STORAGE WITH
MAXIMISE AGRICULTURE AND D/S
STORAGE WITH MAXIMIZE HEP
54.7 950 472 745
MIXED BENEFITS 54.7 932 436 558
STORAGE U/S NYM WITH OPTIMISE
PRESENT DAY 53.6 545 610 424
2.2.5 Training Requirements
The Pangani Basin Hydrologist was introduced to the use of the WEAP model and he
improved his skills regarding the model during simulation of the suite of development
scenarios. No additional specific training may therefore be necessary in respect of
this model because it is simple and relatively easy to master. However, the Basin
Hydrologist and Hydro-geologist need intensive training on the use of the Mike Basin
model because of its complexity. The model will be used for routine operational
decision support in the Basin, particularly in the water-allocation process. The base
configuration of Mike Basin has been done by the Mentor Hydrologist as part of the
FA Study. To fully utilize the Mike Basin operational capabilities, further refinement
of the model will be necessary subsequent to this study. As part of the preparation
for refining the base configuration, the Basin Hydrologist could apportion the
catchment hydrology from sub-catchment to major stream level and the water
demands from sub-catchment to water user’s association level.
It is further recommended that quotations for a training course in Mike Basin be
obtained from DHI of Denmark or RSA and arrangements be made for the Basin
2 Note, even though the volume of water allocated to agriculture is less than present day, it is expected to be used to
irrigate a greater area as a result of improvements in efficiency of use. 3 Note, even though the volume of water allocated to agriculture is less than Present Day, it is expected to be used to
irrigate a greater area as a result of improvements in efficiency of use.

21
Hydrologist and Hydrogeologist to attend the course. More information about Mike
Basin training can be obtained at www.dhigroup.com. It is also possible to invite the
trainers to come and provide training in the Basin or any other convenient location in
Tanzania. This approach would be particularly useful as more professionals from
other Basins and the Ministry of Water and Irrigation could attend. It could also
provide room for the course structure to be tailored to Pangani Basin related issues.
2.3 Basin Delineation Report
2.3.1 Introduction
Within a river basin, no study can address ever kilometre of river, or every person
living within the area. Thus, it is usual practice to search for representative areas
that can together represent the whole study area. These representative areas should
be reasonably homogeneous in character, at least in terms of the studies that will be
done. A delineation exercise for a river system would search for stretches of river
that differ from each other but are internally similar, whilst a social delineation might
search for areas that differ in livelihoods or wealth.
Once these homogeneous areas have been identified, one or more representative
sites can be chosen in each. These will become the focus of data-collection
activities, and the results from each will be extrapolated over the respective area.
For the Pangani, the basin was delineated by first separately delineating relatively
homogeneous zones and sub-zones along the river and estuary, and for socio-
economic activities in the basin. Thereafter, the resultant delineations were
synchronised to produce a scheme for all project work. Within this scheme,
representative sites were selected in the sub-zones deemed to be most relevant to
the study.
2.3.2 Catchment location and characteristics
The Pangani River Basin is situated in the north-east of Tanzania and covers a total
area of some 43 650 km2, about 3 900 km2 of which is in Kenya (Figure 2.8). Note:
The area under the PBWO jurisdiction (referred to as the Pangani Basin)
incorporates the Pangani River Basin, plus the Umba, Zigi-Mkulumuzi Coastal and
Msangazi river catchments.
The Pangani River Basin is bordered by Mt Kilimanjaro (5895 masl), Mt Meru (4565
masl) and the Pare and Usambara Mountains to the north and north-east,
respectively, and encompasses the Simanjiro and Kitwei plains to the south-west.
Lowlands (up to 900 masl) make up about 50% of the basin.

22
Figure 2.8 River basins administered by the PBWO, including the Pangani River
Basin. Source: PBWO/IUCN.
Rainfall patterns are largely related to altitude, with the highlands receiving about
1000-2000 mm annually, and the lowlands receiving 500-600 mm. Rainfall is
bimodal, occurring mainly in March-June, with short rains in November-December.
The Pangani River rises as a series of small streams on Mt Kilimanjaro and Mt Meru.
The two major rivers created by these streams are the Kikuletwa and Ruvu Rivers,
which converge at Nyumba ya Mungu Dam. The Pangani River drains Nyumba ya
Mungu Dam and is fed by the Mkomazi and Luengera Rivers before it meets the
Indian Ocean at the Pangani estuary, south of Tanga town.
2.3.3 River and estuary zonation
Ten river zones were identified for the study, each of which comprised one or more
river reaches (Figure 2.9). The ten zones are Mountain Torrent (>1200 m); Mountain
Stream (1000-1200 m); Upper Foothills; Rejuvenated Foothill, Swamps and Lakes;
Floodplains (Kirua swamp); Lower Foothills; Rejuvenated Bedrock Cascade, Mature
Lower River and Estuary. Within the zones are nested 31 river sub-zones and three
estuary sub-zones (Table 2.4).

23
Figure 2.9 River zones. The Rejuvenated Foothill zone is too small to show but is
situated in the vicinity of K3 to R7.
24
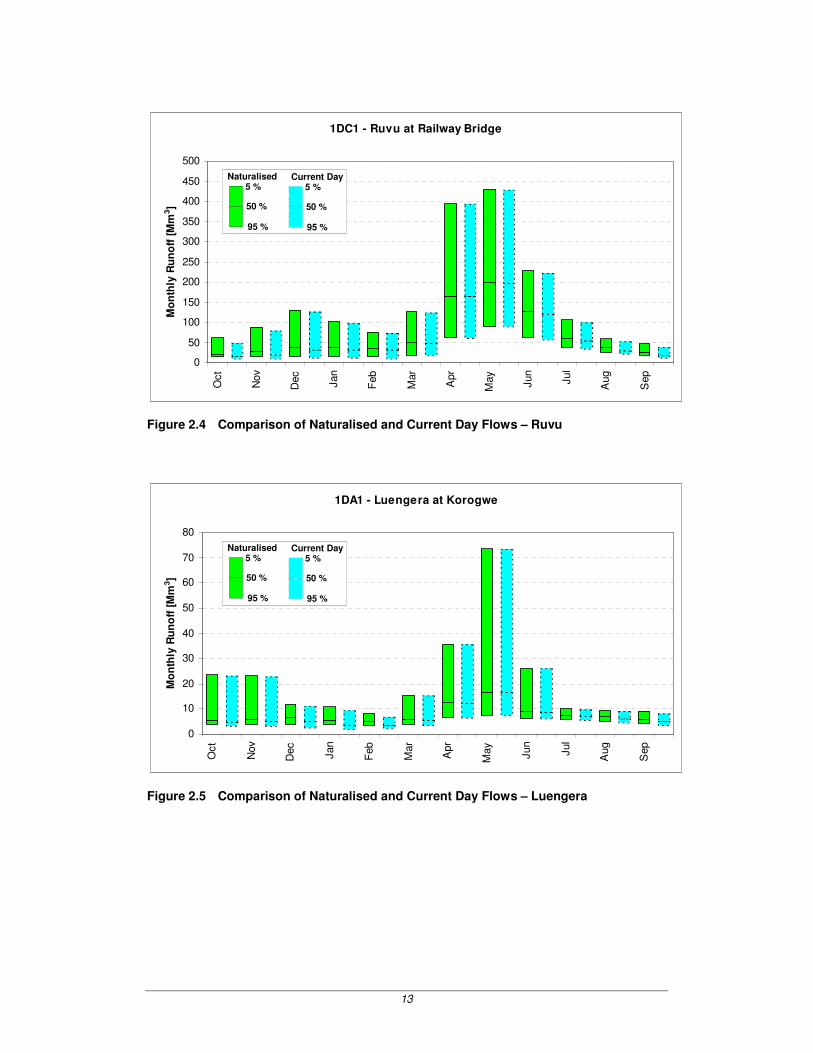
Table 2.4 Synchronised ecological and socio-economic zones.
Socio-economic
Zone
Socio-
economic Sub
zone
Harmonized River Zone River Sub
Zones River
Mountain Torrent (>1200 m) MT1 Nduruma River
Mountain Torrent (>1200 m) MT2 Sanya River
Mountain Torrent (>1200 m) MT3 Tengeru River Mountain
Mountain Torrent (>1200 m) MT4 Himo River
Mountain Stream (1000-1200 m) MS5 Himo River
Mountain Stream (1000-1200 m) MS1 Nduruma River
Mountain Stream (1000-1200 m) MS2 Sanya River
Mountain Stream (1000-1200 m) MS3 Tengeru River
Upper foothills UF1 Kikuletwa River
Upper foothills UF1 Sanya River
Upper foothills UF1 Tengeru River
Rejuvenated foothill RJ1 Kikuletwa River
Rejuvenated foothill RJ2 Ruvu River
Lower foothills LF1 Himo River
Northern
Highlands
Meru/
Kilimanjaro
Lower foothills LF1a Ruvu River
Mountain Stream (1000-1200 m) MS5 North and South Pare
Mountains
Upper foothills UF1 Muraini River
Lower foothills LF2 Muraini River
Pare
Lower foothills LF5 Mkomazi Riv er
Eastern
Highlands
Usambara Mountain Stream (1000-1200 m) MS6 Usambara Mountains
Shambalai Swamps and Lakes SW5 Shambalai Swamp
Swamps and Lakes SW3 Ruvu River Lake Jipe
Swamps and Lakes SW2 Lake Jipe
Swamps and Lakes SW1 U/s of Nyumba ya Mungu
Dam
Swamps and
Lakes Nyumba ya
Mungu Dam Swamps and Lakes SW4 Nyumba ya Mungu Dam
Floodplain FP Kirua Swamp
Pangani/Kirua Kirua Swamp Lower foothills LF3
Downstream of swamp to
Mswahe
Lower foothills LF4 Mswahe to downstream of
Mkomazi Confluence Pangani
Rejuvenated Bedrock Cascade RBC1 From LF4 to d/s Pangani
Falls
Mesic
Lowlands
Luengera Lower foothills LF6 Luengera River
Coast Mature lower river LR1 Pangani Fall to estuary
Estuary E1 Upper estuary
Estuary E2 Middle estuary Coastal
Estuary
Estuary E3 Lower estuary
2.3.4 Socio-economic zonation
The basin was delineated into six relatively homogenous socio-economic zones on
the basis of land use and relationships to aquatic ecosystems (Figure 2.10). The six
zones are Northern Highlands, Eastern Highlands, Swamps and Lakes, Pangani-
Kirua Swamp, Mesic Lowlands and Coast. Within the zones are nested 12 sub-

25
zones (Table 2.4). The arid western areas were not included because of relatively
low population density and distance from the Pangani River and tributaries.
Figure 2.10 Socio-economic zones within the Pangani River Basin, in relation to rivers,
major dams and lakes, and villages and towns.
2.3.5 Synchronisation of the socio-economic and ecological zones
The zones and sub-zones identified for the river/estuary and socio-economic
activities correspond at the sub-zonal level (Table 2.4). They were the units at which
representative study sites were chosen.
26
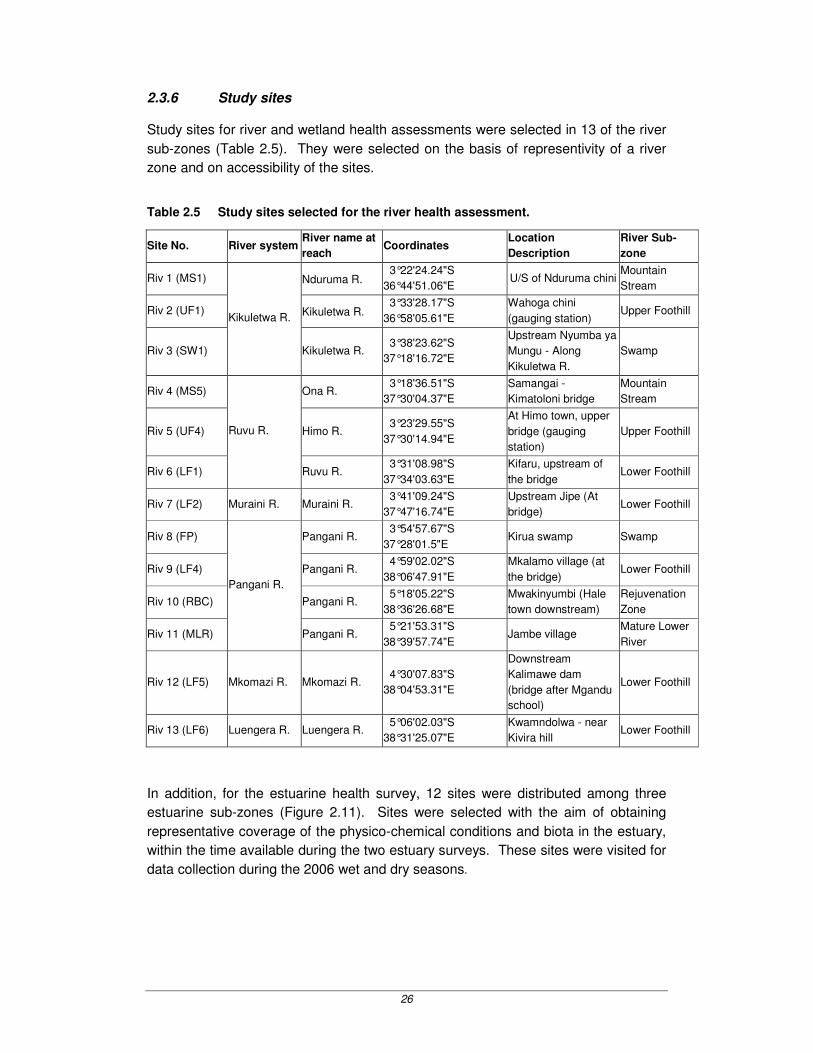
2.3.6 Study sites
Study sites for river and wetland health assessments were selected in 13 of the river
sub-zones (Table 2.5). They were selected on the basis of representivity of a river
zone and on accessibility of the sites.
Table 2.5 Study sites selected for the river health assessment.
Site No. River system River name at
reach Coordinates
Location
Description
River Sub-
zone
Riv 1 (MS1) Nduruma R. 3°22'24.24"S
36°44'51.06"E U/S of Nduruma chini
Mountain
Stream
Riv 2 (UF1) Kikuletwa R. 3°33'28.17"S
36°58'05.61"E
Wahoga chini
(gauging station) Upper Foothill
Riv 3 (SW1)
Kikuletwa R.
Kikuletwa R. 3°38'23.62"S
37°18'16.72"E
Upstream Nyumba ya
Mungu - Along
Kikuletwa R.
Swamp
Riv 4 (MS5) Ona R. 3°18'36.51"S
37°30'04.37"E
Samangai -
Kimatoloni bridge
Mountain
Stream
Riv 5 (UF4) Himo R. 3°23'29.55"S
37°30'14.94"E
At Himo town, upper
bridge (gauging
station)
Upper Foothill
Riv 6 (LF1)
Ruvu R.
Ruvu R. 3°31'08.98"S
37°34'03.63"E
Kifaru, upstream of
the bridge Lower Foothill
Riv 7 (LF2) Muraini R. Muraini R. 3°41'09.24"S
37°47'16.74"E
Upstream Jipe (At
bridge) Lower Foothill
Riv 8 (FP) Pangani R. 3°54'57.67"S
37°28'01.5"E Kirua swamp Swamp
Riv 9 (LF4) Pangani R. 4°59'02.02"S
38°06'47.91"E
Mkalamo village (at
the bridge) Lower Foothill
Riv 10 (RBC) Pangani R. 5°18'05.22"S
38°36'26.68"E
Mwakinyumbi (Hale
town downstream)
Rejuvenation
Zone
Riv 11 (MLR)
Pangani R.
Pangani R. 5°21'53.31"S
38°39'57.74"E Jambe village
Mature Lower
River
Riv 12 (LF5) Mkomazi R. Mkomazi R. 4°30'07.83"S
38°04'53.31"E
Downstream
Kalimawe dam
(bridge after Mgandu
school)
Lower Foothill
Riv 13 (LF6) Luengera R. Luengera R. 5°06'02.03"S
38°31'25.07"E
Kwamndolwa - near
Kivira hill Lower Foothill
In addition, for the estuarine health survey, 12 sites were distributed among three
estuarine sub-zones (Figure 2.11). Sites were selected with the aim of obtaining
representative coverage of the physico-chemical conditions and biota in the estuary,
within the time available during the two estuary surveys. These sites were visited for
data collection during the 2006 wet and dry seasons.

27
Upper estuary Middle estuary
Lowerestuary
1234
5
6
7
8
9
10
12
11
**
*
2 km
Figure 2.11 Map of the Pangani estuary showing the upper, lower and lateral
boundaries (solid lines), division into Upper, Middle and Lower Zones
(dotted lines)4 and the study sites.
2.4 Scenario Selection Report
2.4.1 Introduction
Within the Pangani River Basin, trade-offs between benefits provided by the aquatic
ecosystems and the benefits provided through off-stream water use such as irrigation
and hydropower will need to be decided by the stakeholders. The trade-offs may be
analysed by examining the potential consequences of a range of scenarios that
describe different development pathways into the future. Government and other
stakeholders can assess these, leading to identification of a preferred pathway and a
strategy to achieve it.
Task 2.1 of the Pangani River Basin Flow Assessment considered the main issues
and trends in the basin in order to develop a feasible set of scenarios for analysis.
The task began with a Stakeholder Workshop on 6 March 2006 to discuss the main
water-related issues and trends in the basin. The outputs of the workshop are
outlined below, followed by the preliminary set of scenarios chosen for analysis.
2.4.2 Water-related issues in Pangani River Basin
The Pangani River Basin is a water-stressed basin. Water supply is being reduced
by catchment degradation and possibly by climate change, while demand is
increasing due to population and economic growth, including land-use change.
Water quality is also being affected by effluent and solid-waste pollution. Partly due
to lack of information on the availability and use of water in the basin, water is over-
allocated, creating conflict among water users. Water shortages are felt in all the
economic sectors. This results in a depressed economic output during droughts.
Over-allocation of water has led to the drying up of perennial rivers and wetlands,
and intrusion of salt water into the estuary. The above problems are exacerbated by
4 The solid blue line marks the centre of the estuary. Proposed sampling sites for physico-chemical parameters,
phytoplankton, invertebrates and fish are numbered from 1-12. Historic water quality sampling sites are marked with
asterisks.

28
uncoordinated development planning that does not take water requirements into
account, as well as by poverty, which constrains people from investing in more
efficient technologies. In addition, there is a general lack of awareness about
catchment and water conservation issues among basin inhabitants, and a lack of
enforcement of legislation pertaining to water use and wastewater treatment.
2.4.3 Expected trends for different sectors in the Pangani River Basin
Stakeholders identified trends for different sectors in the different socioeconomic
zones of the Pangani River Basin (Figure 2.10). In the hydropower sector, there is a
general shortage of water for power production in the basin. Nevertheless, there is a
focus on increasing the capacity and generation in the basin, with planned HEP
developments in the Northern and Eastern Highlands as well as on the lower
Pangani River. There is a general trend of loss of agricultural production or limits to
its increase due to water shortages throughout the basin, with the affected crops
differing from area to area. An increasing population is putting pressure on domestic
water supplies, with shortages expected throughout the basin. It is expected that
people will start to rely more on groundwater and the domestic use of rainwater
tanks. Loss of biodiversity due to loss of aquatic ecosystem health is occurring
throughout the basin.
2.4.4 Development of scenarios for consideration in the Flow Assessment
Several relevant factors were identified that could vary in different ways in the future:
Supply variables:
• climate change;
• catchment management actions that affect quantity and quality of water:
o deforestation vs. afforestation,
o pollution-control measures,
o erosion-control measures;
Demand variables:
• water allocation to each sector:
o hydropower,
o agriculture,
o domestic and industry,
o mining,
o aquatic ecosystems;
• water-resource development:
o groundwater use,
o storage options;
• efficiency of use
o improved efficiency due to water-demand management (e.g. higher
water prices),

29
o improved efficiency due to investment in better irrigation systems or
crop varieties;
• population growth.
2.4.5 Selection and range of variables
It was necessary to limit this list in order to be able to generate a manageable
number of scenarios. The factors to be varied in the scenario analysis were selected
based on anticipated modelling capacity and available information (Table 2.6).
Preliminary estimates were then made of the upper boundary, lower boundary, and
most likely values of each of the selected parameters in the year 2025 in order to
ascertain the range of conditions that the scenarios should cover.
Table 2.6 System variables and the possible envelope of their characteristics in
2025, including a ‘most likely’ description
System
variable
Low extreme Most likely 2025 High extreme
Climate change Zero change (1 scenario) Best estimate of change (all
scenarios but one)
-
Domestic - Based on best estimate of
population growth
-
Industry - Linked to Tanzanian
economic growth
-
Afforestation/
deforestation
10% reforestation –
outcome of payment for
ecological services
Status quo – forest lost to
charcoal, but new forests
being planted
Deforestation follows
present trend but may
fall off due to
government protection,
to not >10% additional
loss of original forest
area
Irrigation 10% reduction in water
demand due to increasing
efficiency of use, followed
by a period of constant
demand
Growth at lower than 1995-
2005 rate, using groundwater
Small and large
storage dams plus
groundwater leads to
growth at present rate
but capped by water
availability
Hydropower Up to 25% reduction in
water supply at NyM, Hale
and Pangani Falls
Restoring supplies to existing
stations including canalising
Pangani through Kirua
swamps and construction of
Mandera HEP station
Restoring supply to
existing stations;
refurbish Kikuletwa;
construct Mandera and
mini-hydro stations
Environment Two condition levels to be determined

30
2.4.6 Spatial and temporal resolution
The spatial resolution of the scenario modelling was on the basis of the WEAP
hydrological model outputs generated for 16 points in the catchment. The scenarios
were considered on a 20-year time horizon to 2025, the base year being 2005.
2.4.7 Scenarios identified
A preliminary list of 12 scenarios was identified for further discussion.
Table 2.7 The 12 scenarios identified for further discussion
Supply variables Demand variables
Scenario Climate change
Afforest/ De-forestation
Basic Human Needs
Domestic Industrial
Irrigation Hydro-power
Aquatic eco-systems
1a. High agriculture, high HEP
Best estimate
Best estimate
1st
2nd
(most likely)
3rd
(High extreme)
4th
(High extreme)
Residual
1b. As for 1a but aquatic ecosystems 2
nd
priority
Best estimate
Best estimate
1st
3rd
(most likely)
4th
(High extreme)
Residual 2
nd
(Level 1)
2. High agriculture, HEP @ most likely
Best estimate
Best estimate
1st
2nd
(most likely)
3rd
(High extreme)
4th
(Most likely)
Residual
3a. High HEP, agriculture as close to HE as possible
Best estimate
Best estimate
1st
2nd
(most likely)
4 (High extreme)
3rd
(High extreme)
Residual
3b. .As for 3a but aquatic ecosystem 2
nd
priority
Best estimate
Best estimate
1st
3rd
(most likely)
Residual 4
th
(High extreme)
2nd
(Level 1)
4. High HEP + low agric
Best estimate
Best estimate
1st
2nd
(most likely)
4th
(Low extreme)
3rd
(High extreme)
Residual
5a. Status quo (best estimate for all)
Best estimate
Best estimate
1st
2nd
(most likely)
Most likely
Most likely
Residual
5b. Ditto with ecosystem 2
nd
priority (health at Level 1)
Best estimate
Best estimate
1st
3rd
(most likely)
4th
(shared residual)
4th
(shared residual)
2nd
(Level 1)
5c. As for 5a but with ecosystem 2
nd
priority (health Level 2)
Best estimate)
Best estimate
1st
3rd
(most likely)
4th
(shared residual)
4th
(shared residual)
2nd
(Level 2)
6. Status quo without climate change
None Best estimate
1st
2nd
(most likely)
Most likely
Most likely
Residual
7. Low extreme for all
Best estimate
Maximum afforestation
1st
2nd
(most likely)
Low extreme
Low extreme
Residual
8. As for 1 but afforestation @ maximum
Best estimate
Maximum afforestation
1st
2nd
(most likely)
3rd
(High extreme)
4th
(High extreme)
Residual
31
The numbers in the ‘demand variables’ columns indicate the priority of water
allocation. The descriptions in brackets refer to the previous table, indicating which
level of water demand would be included in the scenario modelling exercise.
This list was revisited through the course of the project and nine scenarios were
eventually chosen for assessment within Tasks 7 and 8.
2.5 River Health Assessment Report
2.5.1 Introduction
The health assessment of the river was based on site visits (with some data
collection) during the wet and dry seasons (2006), together with existing PBWO
water-quality data collected at key points along the river. Thirteen study sites (Figure
2.12) were selected to represent a range of zones (Mountain Stream; Upper Foothill;
Lower Foothill; Mature Lower River and Rejuvenated Bedrock Cascade).
The methods used for the assessment were based on those developed in the River
Health Programme of the National Aquatic Ecosystem Health Biomonitoring
Programme of South Africa. The method involved the collection of information
necessary to characterise a site, to provide an indication of catchment condition and
land-use, together with relevant abiotic (water quantity and quality) and biotic
(invertebrates, fish, riparian vegetation) information. Each of these biotic
components provided information of the health of the instream or riparian zone of the
river. A field manual and associated datasheets were compiled for use in the IUCN-
Pangani Basin River Health assessment.
The report section provides a description of the characteristics of each site, including
a description of channel classification and stream dimensions, and a photographic
record for each site during the wet and dry seasons.
2.5.2 Overview of results
In terms of water quantity, discharges were generally higher at sites in the wet
season compared to the dry season, with the exception of two lower foothill sites (R8
and R9), both below NYM dam. Sites R2, on the Kikuletwa River, and R7, on the
Muraini River, dried up during the dry season; the latter due to the seasonal nature of
the river. The site on the mature Lower River (R11) had highly variable flow within a
24-hour period in the dry season due to storage and releases from the Pangani Falls
Hydropower station.
Water quality varied from site to site - in response to both position in the catchment,
i.e. upper versus lower reaches, and to changing water quality due to anthropogenic
activities. Turbidity was higher than expected in the Upper Foothill Zone of the
Kikuletwa River (R2), and PBWO monitoring data indicated that levels were also high
in the Themi and Kware Rivers. The pH values showed no or very slight variation

32
Figure 2.12 Sites within the Pangani River Basin assessed for river health. Zones are
indicated.
among the sites and were mostly close to neutral. They were within the range of
6.61 to 8.42 in the wet season and generally increased slightly to a range of 7.14 to
8.93 in the dry season. Conductivity was lowest in the Mountain Stream and Upper
Foothill zones (6.7 to 14.0 mSm-1), except for R2 in the wet season, where it was
higher than expected (23.9 mSm-1). Conductivity increased markedly at two sites
(R3 - Kikuletwa River and R12 - Mkomazi River) from wet to dry seasons. PBWO
monitoring data also indicate that high conductivity was measured on the Kware and
Kikuletwa Rivers, as well as the Themi and Maji ya Chai Rivers downstream of the

33
Arusha-Moshi road. Dissolved oxygen (DO) concentrations ranged from 5.5 - 8.9
mgl-1 in the wet season and were generally lower in the dry season (5.0 - 7.8 mgl-1).
One site, R6, had extremely low levels of dissolved oxygen (< 0.6 mgl-1). In terms of
nutrients, the concentration of total nitrogen (TN) was elevated at a two sites in the
wet season, while total phosphorous (TP) was low at most sites.
This changed in the dry season with TP increasing at most sites resulting in a shift in
trophic status from the wet to dry seasons. Algae were present at more sites in the
dry season. The concentration of bicarbonates increased below NYM (R8) and from
wet to dry season at R3 - Kikuletwa River. Organic enrichment (Biological Oxygen
Demand and faecal coliforms), as determined from the PBWO water quality
monitoring data, was elevated at sites near Arusha and Moshi. High BOD values
were recorded on the Themi River downstream of Arusha and high faecal coliform
counts were observed on the Kikuletwa, Themi, Tenguru, Ngarenaro and Njoro
Rivers and Lake Jipe at Makuyuni.
A total of 54 aquatic invertebrate taxa (mostly family-level), 23 fish species and 233
plant species were recorded during the surveys. The status of the following abiotic
and biotic components – water quality; Index of habitat integrity (instream and
riparian); invertebrates, fish and riparian vegetation - was ascertained from the data
using common categories to indicate the level of modification from an expected
natural or baseline condition (A - Natural, unmodified system; B - Largely natural,
slightly modified system; C - Moderately modified system; D - Largely modified
system; E* - Only for IHI - Seriously modified system; and F* - Only for IHI - Critically
modified system).
In summary, river health varied from site to site, in response to both natural changes
within the catchment and anthropogenic impacts that had modified the water quantity
and/or quality of the river system.
2.5.3 R1 - Nduruma River (Zone: Mountain Stream)
Discharge Water
Quality
IHI
Instream
IHI
Riparian Invertebrates Fish
Riparian
vegetation
C B B F B B C
• Discharge: <40% of water was abstracted in the wet season and >80% in the dry
season. The dry season flows were reduced and the duration of these dry
season flows was extended, with less water in the river generally.
• Water quality: DO concentrations decreased and TP increased in the dry
season. Trophic status shifted from mesotrophic to eutrophic in the dry season.
• IHI Instream: Moderately modified because of water abstraction and flow
modification.

34
• IHI Riparian: Critically modified because of the decrease of indigenous
vegetation from the riparian zone, exotic vegetation encroachment and bank
erosion.
• Invertebrates: There was a reasonable diversity of invertebrates in both the wet
and dry seasons, with all three biotopes present. A total of 23 taxa was recorded,
including four families of mayflies, as well as dragonflies, caddisflies, beetles and
flies.
• Fish: Habitat was limited to fast flowing, shallow areas and deeper runs. One
fish species was caught, Garra dembeensis, which is adapted to living in fast
flowing streams.
• Riparian Vegetation: The riparian width was 30 m on the right hand bank and 5
m on the left hand bank. Trees, shrubs, sedges and grasses were represented.
Encroachment by exotic vegetation was widespread and smaller areas were
invaded by terrestrial plants.
2.5.4 R2 - Kikuletwa River (Zone: Upper Foothill)
Discharge Water
Quality
IHI
Instream
IHI
Riparian Invertebrates Fish
Riparian
vegetation
D D D F D D D
• Discharge: The river at this site was no longer perennial and in the dry season it
dries up. Floods were smaller but the number of floods has remained the same
when compared to historical events.
• Water quality: High turbidity value for an Upper Foothill site - most likely due to
removal of riparian vegetation and extensive livestock farming.
• IHI Instream: Largely modified because of water abstraction and flow
modification.
• IHI Riparian: Critically modified because of the decrease of indigenous
vegetation from the riparian zone, exotic vegetation encroachment and bank
erosion.
• Invertebrates: This site showed indications of a loss of invertebrates, with lower
SASS5 Scores in comparison to the other Upper Foothill sites. A total of 15 taxa
was recorded in the wet season - the site was dry during the dry season.
• Fish: In the wet season, habitat was limited to fast deep areas, with some
overhanging vegetation, undercut banks, gravel substrate and water column.
One species was recorded, Clarius gariepinus, although fisherman indicated that
two additional species of Tilapia also occur.
• Riparian Vegetation: The riparian zone at the sampling point was almost bare
due to removal of riparian vegetation and livestock watering. Downstream of the
site, the riparian width was 40 m on the right hand bank and 30 m on the left
hand bank. Trees, shrubs, sedges and grasses were represented.
Encroachment by exotic vegetation and terrestrial plants was limited.

35
2.5.5 R3 - Kikuletwa River (Zone: Lower Foothill)
Discharge Water
Quality
IHI
Instream
IHI
Riparian Invertebrates Fish
Riparian
vegetation
C/D B/C D E B C C
• Discharge: The river at this site had substantially less water during the dry
season compared to the wet season. The floods have not changed significantly
in terms of size or frequency. Dry-season flows were extended beyond the
expected dry season and the river was perennial because it is sustained by the
Chemka Springs upstream.
• Water quality: Conductivity, carbonates/bicarbonates, magnesium and TP
increased in the dry season.
• IHI Instream: Largely modified because of water abstraction, flow modification
and water quality.
• IHI Riparian: Seriously modified because of the decrease of indigenous
vegetation from the riparian zone and bank erosion.
• Invertebrates: The number of taxa and SASS Scores decreased from the wet to
the dry season. A total of 25 taxa was recorded. The fauna included worms,
crabs, water-mites, mayflies, dragon- and damselflies, bugs, caddisflies, beetles
and flies. Of note was the only record of the caddisfly family, Ecnomidae, in the
wet-season survey. Lack of vegetation in the dry season resulted in fewer taxa
being recorded.
• Fish: In the wet season, habitat was limited to fast, deep areas and in the dry
season to fast and slow, shallow areas. There was overhanging vegetation,
undercut banks, gravel and rocky substratum and water column. Five species
were recorded, although fisherman indicated that two additional species were
present.
• Riparian Vegetation: The riparian zone was divided into riparian and floodplain,
with widths 50 m, 50 m on the right hand bank and 40 m, 90 m on the left hand
bank for riparian and floodplain respectively. Trees, shrubs, reeds, sedges and
grasses were represented. There was no encroachment by exotic vegetation,
reeds or terrestrial plants.
2.5.6 R4 - Ona River (Zone: Mountain Stream)
Discharge Water
Quality
IHI
Instream
IHI
Riparian Invertebrates Fish
Riparian
vegetation
B/C A/B B C A A/B B
• Discharge: The river at this site was perennial, although flows were lower in the
dry season compared to the wet season. There was abstraction for local farming.
• Water quality: There were no apparent changes from wet to dry season.
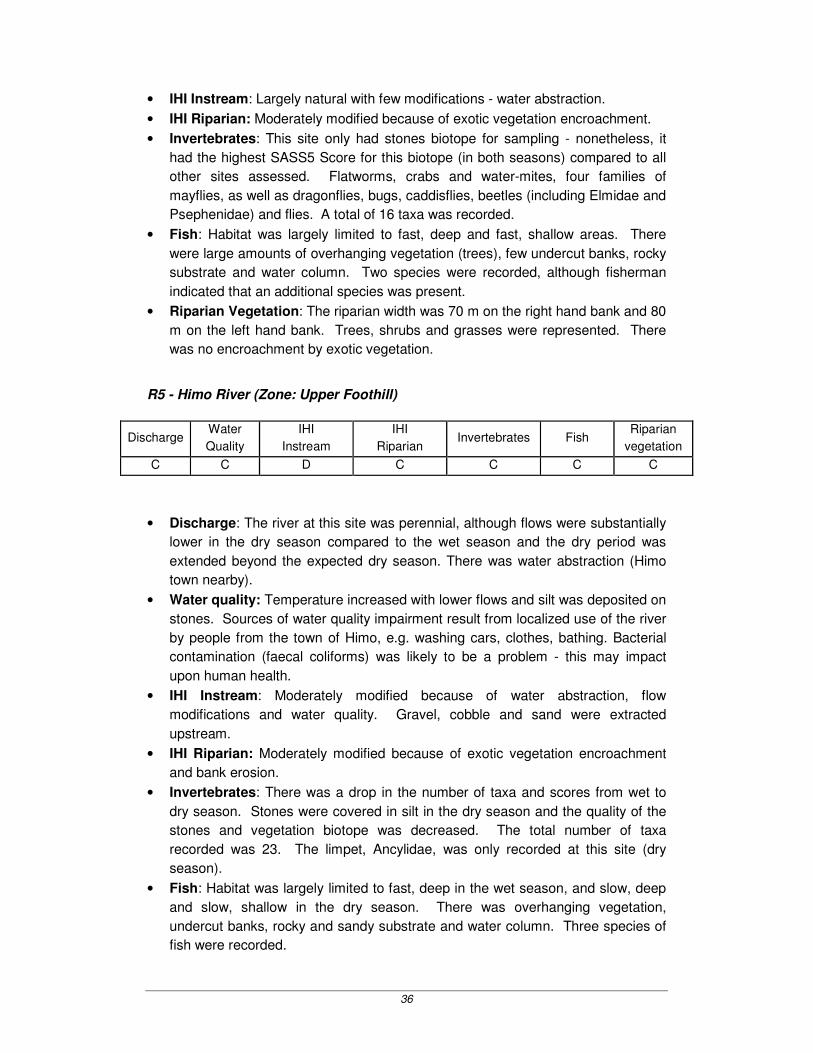
36
• IHI Instream: Largely natural with few modifications - water abstraction.
• IHI Riparian: Moderately modified because of exotic vegetation encroachment.
• Invertebrates: This site only had stones biotope for sampling - nonetheless, it
had the highest SASS5 Score for this biotope (in both seasons) compared to all
other sites assessed. Flatworms, crabs and water-mites, four families of
mayflies, as well as dragonflies, bugs, caddisflies, beetles (including Elmidae and
Psephenidae) and flies. A total of 16 taxa was recorded.
• Fish: Habitat was largely limited to fast, deep and fast, shallow areas. There
were large amounts of overhanging vegetation (trees), few undercut banks, rocky
substrate and water column. Two species were recorded, although fisherman
indicated that an additional species was present.
• Riparian Vegetation: The riparian width was 70 m on the right hand bank and 80
m on the left hand bank. Trees, shrubs and grasses were represented. There
was no encroachment by exotic vegetation.
R5 - Himo River (Zone: Upper Foothill)
Discharge Water
Quality
IHI
Instream
IHI
Riparian Invertebrates Fish
Riparian
vegetation
C C D C C C C
• Discharge: The river at this site was perennial, although flows were substantially
lower in the dry season compared to the wet season and the dry period was
extended beyond the expected dry season. There was water abstraction (Himo
town nearby).
• Water quality: Temperature increased with lower flows and silt was deposited on
stones. Sources of water quality impairment result from localized use of the river
by people from the town of Himo, e.g. washing cars, clothes, bathing. Bacterial
contamination (faecal coliforms) was likely to be a problem - this may impact
upon human health.
• IHI Instream: Moderately modified because of water abstraction, flow
modifications and water quality. Gravel, cobble and sand were extracted
upstream.
• IHI Riparian: Moderately modified because of exotic vegetation encroachment
and bank erosion.
• Invertebrates: There was a drop in the number of taxa and scores from wet to
dry season. Stones were covered in silt in the dry season and the quality of the
stones and vegetation biotope was decreased. The total number of taxa
recorded was 23. The limpet, Ancylidae, was only recorded at this site (dry
season).
• Fish: Habitat was largely limited to fast, deep in the wet season, and slow, deep
and slow, shallow in the dry season. There was overhanging vegetation,
undercut banks, rocky and sandy substrate and water column. Three species of
fish were recorded.

37
• Riparian Vegetation: The impact on the riparian vegetation was localized.
Downstream of the site the riparian width was 10 m on the right hand bank and
10 m on the left hand bank. Trees and shrubs dominated with a few sedges and
grasses present. There was very limited encroachment by exotic vegetation.
2.5.7 R6 - Ruvu River (Zone: Lower Foothill)
Discharge Water
Quality
IHI
Instream
IHI
Riparian Invertebrates Fish
Riparian
vegetation
B/C D D D D D C
• Discharge: The river at this site was perennial, although flows were lower in the
dry season compared to the wet season, and the dry period was extended
beyond the expected dry season. Annual flooding occurs and the low flows were
sustained by outflow from Lake Jipe. There was a wetland upstream of the site
although information on this was limited. Lake Jipe has experienced a decline in
water levels over the last decade.
• Water quality: Critically low dissolved oxygen levels during the wet and dry
seasons - extensive decaying material, low-gradient river downstream of Lake
Jipe. TP increased during the dry season. Aquatic macrophytes were recorded
in the dry season, indicating that TN was limited (Azolla pinnata has nitrogen
fixing bacteria associated with it).
• IHI Instream: Largely modified because of water quality impairment (DO) and
exotic macrophytes).
• IHI Riparian: Largely modified because of a decrease in indigenous vegetation
and bank erosion.
• Invertebrates: Biotopes were limited to vegetation and mud in the wet season
with gravel/cobble also available in the dry season. The scores dropped from wet
to dry season, although two more taxa were recorded in the dry season. Total
number of taxa was 16. Dominant invertebrates were air breathers (e.g. several
bug taxa) and those adapted to living in waters with low dissolved oxygen e.g.
Chironomus spp. and oligochaetes.
• Fish: Habitat was largely limited to fast, deep in the wet season, and slow, deep
in the dry season. There was overhanging vegetation (sedges and trees), few
undercut banks, macrophytes; rock, gravel and sand substratum and water
column. Five species were recorded in the wet season - possibly migrating
upstream to the swamp area for spawning. Two additional species were
recorded in the dry season. Fish were observed gulping for air, indicating stress
resulting from low DO concentrations.
• Riparian Vegetation: The riparian width was 10 m on the right hand bank and 18
m on the left hand bank. Trees, shrubs, reeds, sedges and grasses were
represented. There was very limited encroachment by exotic vegetation.

38
2.5.8 R7 - Muraini (Mvuleni) River (Zone: Upper Foothill)
Discharge Water
Quality
IHI
Instream
IHI
Riparian Invertebrates Fish
Riparian
vegetation
D B/C C C B/C - A
• Discharge: The river at this site was seasonal and it naturally ceases to flow in
the dry season. Water abstraction in the wet season was estimated at >60%. It
was likely that the dry season was extended beyond the expected dry season
because of the abstraction during the wet season. No information was available
on floods.
• Water quality: Turbidity and TSS were higher than expected for an Upper
Foothill site - this may be a consequence of the rain that preceded the
assessment.
• IHI Instream: Moderately modified because of water abstraction, flow
modifications and water quality.
• IHI Riparian: Moderately modified because of bank erosion.
• Invertebrates: The stones biotope was limited to a small, shallow, cobble riffle.
No marginal vegetation was available for sampling. A total of 13 taxa was
recorded. It was one of two sites in the survey where butterfly larvae,
Crambiidae, were recorded.
• Fish: Habitat was limited to slow, shallow pool areas. There was overhanging
vegetation, undercut banks in the pool area and gravel substratum. The water
column provided little cover. No fish were caught, although they were known to
occur downstream in the rainy season.
• Riparian Vegetation: The riparian width was 150 m on the right hand bank and
200 m on the left hand bank. Trees, shrubs and grasses were represented.
There was very limited encroachment by exotic vegetation. The riparian
vegetation has a closed canopy with minimal undergrowth herbaceous plants.
The dominant plants were the fig trees (Ficus spp.), which are adapted to
surviving in dry areas due to their ability to reserve/store water.
2.5.9 R8 - Pangani River (Zone: Lower Foothill)
Discharge Water
Quality
IHI
Instream
IHI
Riparian Invertebrates Fish
Riparian
vegetation
D C C C C A/B B
• Discharge: Flow was highly regulated by NYM dam and there was no significant
inflow between the dam and the site. Floods were held back at the dam, high
flows were irregular and flows were constant. Dry-season base flows were
higher than wet-season base flows. Flooding of Kirua swamps no longer occurs.

39
Depth of the river at this site has increased, perhaps due to trapping of sediment
by the dam.
• Water quality: TP increased in the dry season - causing a shift in trophic status
from mesotrophic to eutrophic. The NYM dam upstream is located on calcareous
soils - very high levels of carbonates and bicarbonates were released from the
dam. The elevated levels continue into the Mature Lower River.
• IHI Instream: Moderately modified because of water abstraction, flow
modifications and water quality.
• IHI Riparian: Moderately modified because of a decrease in indigenous
vegetation, and bank erosion.
• Invertebrates: Only marginal vegetation was available for sampling. Fifteen taxa
were recorded, including mayflies, damselflies, bugs, caddisflies, beetles and
flies.
• Fish: Habitat was limited to fast, deep areas. There was overhanging vegetation,
emergent macrophytes, gravel/sand/mud substratum and water column. Ten
species of fish were recorded. Migratory fish species were recorded, but the
fishing weir upstream may affect their availability and distribution.
• Riparian Vegetation: The riparian width was 10 m on the right hand bank and 15
m on the left hand bank. Trees, shrubs, reeds, sedges and grasses were all well
represented. There was no encroachment by exotic vegetation.
2.5.10 R9 - Pangani River (Zone: Lower Foothill)
Discharge Water
Quality
IHI
Instream
IHI
Riparian Invertebrates Fish
Riparian
vegetation
D C C D B B B
• Discharge: NyM Dam regulates the flow and there was no significant inflow
between the dam and the site. Floods were held back at the dam, high flows
were irregular and flows were constant. Dry-season base flows were higher than
wet-season base flows.
• Water quality: Higher nitrogen concentrations and chlorophyll a levels in the wet
season indicated that the system was modified in terms of water quality. TP
increased in the dry season causing a shift in trophic status from mesotrophic to
eutrophic. Upstream of the site there were extensive sisal plantations, cattle
ranches and localized agriculture in the riparian zone.
• IHI Instream: Moderately modified because of water abstraction, flow
modifications and water quality.
• IHI Riparian: Largely modified because of a decrease in indigenous vegetation.
• Invertebrates: There was a decrease in the number of taxa and SASS5 Score
from wet to dry season. This may have been a reflection of the difficulty in
sampling the biotopes under the higher dry-season flows. The total number of
taxa recorded was 17. The fauna included crabs, water-mites, mayflies, butterfly
larvae, dragon- and damselflies, bugs, caddisflies, beetles, flies and snails. Of

40
note were the five different types of cased-caddisfly in the family Leptoceridae in
the wet season.
• Fish: Habitat included fast, deep and fast, shallow (bedrock rapids) areas. There
was overhanging vegetation, rocky and sandy substrata and water column. Four
species of fish were recorded. There was a fishing weir across the river and
discussions with local fishermen indicated that seven species have been caught
at this site.
• Riparian Vegetation: The riparian width was 10 m on the right hand bank and 5
m on the left hand bank. Trees, shrubs, reeds, sedges and grasses were all
represented. There was no encroachment by exotic vegetation.
2.5.11 R10 - Pangani River (Zone: Rejuvenated Bedrock Cascade)
Discharge Water
Quality
IHI
Instream
IHI
Riparian Invertebrates Fish
Riparian
vegetation
D D D E D C/D D
• Discharge: Flow was regulated by NYM dam and there was an additional pool
(head pond) for storing water before entering the Hale Hydropower station. There
were several rivers joining the Pangani River upstream of this site, which
contributed to inflows. Floods seem to have the normal pattern. In the dry
seasons, the river below the HEP sometimes dries out due to the entire river
water being abstracted to generate HEP.
• Water quality: Conductivity, nitrites and TP increased in the dry season. The
system shifted from mesotrophic to hypertrophic. DO decreased especially in the
slower flowing areas of the river. Bacterial contamination (faecal coliforms) may
potentially be impacting human health at this site. Rubbish dumping occurred
within the riparian zone.
• IHI Instream: Largely modified because of water abstraction, flow modifications,
water quality, bank modifications and presence of solid wastes.
• IHI Riparian: Seriously modified because of decrease of indigenous vegetation,
exotic vegetation encroachment and bank erosion.
• Invertebrates: More taxa were recorded in the dry season (19 taxa) compared to
the wet season (13 taxa), although most of them were ones that were able to
tolerate reduced water quality (e.g. the worms Oligochaeta and water bugs
Corixidae and Notonectidae). Three taxa were recorded on the stones in the wet
season, including leeches (Hirudinea), while 12 taxa were recorded on stones in
the dry season (greater accessibility due to the lower water levels). The total
number of taxa recorded was 22.
• Fish: Habitat included fast, deep and fast, shallow (bedrock rapids) areas in the
wet season, but changed to slow, shallow areas in the dry season. There were
sparse undercut banks, rocky substrata and water column (decrease from wet to
dry season). Ten species of fish were recorded in the wet season, but no fish
were recorded in the dry season. This may be a reflection of the reduction in

41
water quality and quantity (backwater habitat not available in the dry season),
although problems with the electroshocker may also have contributed to this.
• Riparian Vegetation: The riparian width was 5 m on the right hand bank and 5 m
on the left hand bank. Trees, shrubs, sedges and grasses were represented.
There was limited encroachment by exotic vegetation. The riparian vegetation
was severely exploited and the impact from rural development was high.
2.5.12 R11 - Pangani River (Zone: Mature Lowland River)
Discharge Water
Quality
IHI
Instream
IHI
Riparian Invertebrates Fish
Riparian
vegetation
D C D E C C B
• Discharge: Flow was regulated by NYM dam and there were two additional
pools (head ponds) for storing water before entering the Pangani Falls
Hydropower station. Several rivers join the Pangani River upstream of this site,
which contribute to inflows. Flows below the intake depend on releases from the
HEP dam and were intermittent in the dry season. The river below dries up for
approximately 8 hours in every 24 hours.
• Water quality: Turbidity was elevated downstream of the HEP station due to
releases from the station. Nitrite increased in the dry season. The sub-site
R11A, which was on the natural river above the confluence with the outflow, had
higher TP in the dry season, which caused a shift in trophic status from
mesotrophic to hypertrophic.
• IHI Instream: Largely modified because of water abstraction, flow modifications
and water quality.
• IHI Riparian: Seriously modified because of decrease of indigenous vegetation
and exotic vegetation encroachment.
• Invertebrates: Three taxa were recorded in the wet season, including the shrimp
(Atyidae). A total of seven taxa was recorded. More taxa (6) were recorded in
the dry season, although these included highly tolerant worms, Oligochaeta, air-
breathing Corixidae, Notonectidae and Dytiscidae (beetles). Prawns were
recorded at R11A, on the natural river upstream of the confluence with the
outflow.
• Fish: Habitat included fast, deep areas in the wet season. In the dry season,
habitat was severely compromised through the drying up of the river. There was
overhanging vegetation (trees), macrophytes, gravel substrata and water column
in the wet season. Seven species of fish were recorded in the wet season, but
no fish were recorded in the dry season. Some of these were estuarine species.
Site R11A also had bedrock and overhanging vegetation was shrubs. Three
species of fish were caught at R11A in the dry season, including an eel, which is
a migratory species that matures in the river and then migrates to the ocean to
spawn.

42
• Riparian Vegetation: The riparian width was 70 m on the right bank and 5 m on
the left bank. Trees, shrubs, sedges and grasses were represented. There was
limited encroachment by exotic vegetation.
2.5.13 R12 - Mkomazi River (Zone: Lower Foothill)
Discharge Water
Quality
IHI
Instream
IHI
Riparian Invertebrates Fish
Riparian
vegetation
D C/D D F C/D C/D D
• Discharge: Dry-season flows were extended beyond the expected dry season
and the river may dry up at the end of the dry season. Floods occur but the size
has been reduced due to the presence of the Kalimawe Dam upstream. The
floodplain was not inundated to the extent that it used to be.
• Water quality: Conductivity and sulphate concentration were high in the wet and
dry season. Conductivity, sulphate and TP increased in the dry season and
trophic status changed from mesotrophic to eutrophic. DO decreased in the dry
season. There was extensive agriculture upstream of the site including sisal
production and maize and the entire floodplain was cultivated.
• IHI Instream: Largely modified because of water abstraction, flow modifications
and water quality.
• IHI Riparian: Critically modified because of the decrease of indigenous
vegetation. Cultivation of crops occurs within the floodplain.
• Invertebrates: Vegetation and mud were available for sampling. A total of 17
taxa were recorded: nine in the wet season and 14 in the dry season, although
most of them were relatively tolerant ones. Taxa including worms, mayflies,
damsel- and dragonflies, caddisflies, beetles, flies and snails.
• Fish: Habitat was largely slow, shallow areas. There was overhanging
vegetation (reeds, shrubs), gravel and sand substrata and water column was
limited. Overhanging vegetation provides important habitat at this site. Seven
species of fish were recorded: six in the wet and one in the dry season. Clarius
gariepinus (air-breathers) were present - they were tolerant of harsh conditions
such as extremely low flows (and drying up).
• Riparian Vegetation: The riparian width was 45 m on the right hand bank and
105 m on the left hand bank. Reeds and sedges dominated. There was
extensive encroachment by exotic vegetation, in addition to some terrestrial
plants.
2.5.14 R13 - Luengera River (Zone: Lower Foothill)
Discharge Water
Quality
IHI
In stream
IHI
Riparian Invertebrates Fish
Riparian
vegetation
C C C C C/D C B

43
• Discharge: Dry season flows were extended beyond the expected dry season
(due to water abstraction for agriculture) and the river dried up in 2004. Floods
occur but the size has been reduced in the past 15 years. There was an
extensive floodplain area that still appears to flood annually - wetlands were filled
with water in the adjacent floodplain.
• Water quality: TN was high in the wet season, possibly as a result of agriculture
(sisal, maize, rice) in the surrounding area. TP increased in the dry season and
trophic status changed from mesotrophic to eutrophic.
• IHI Instream: Moderately modified because of water abstraction, flow
modifications and water quality.
• IHI Riparian: Moderately modified because of decrease of indigenous
vegetation.
• Invertebrates: This site had a relatively high SASS5 Score and ASPT in the wet
season compared to other Lower Foothill sites that only had vegetation and mud
for sampling. A total of 18 taxa was recorded: 13 in the wet season, including
crabs, mayflies, damsel- and dragonflies, bugs, caddisflies, beetles and snails.
Fewer taxa were recorded in the dry season and scores were lower. Leeches
were recorded in the dry season.
• Fish: Habitat was largely slow, shallow areas. There was overhanging
vegetation (reeds and trees), mud substratum and water column. Five species of
fish were recorded. Local fishermen indicated that an additional three species
were recorded in this site.
• Riparian Vegetation: The riparian zone was divided into riparian and floodplain,
with widths 2 m, 120 m on the right hand bank and 5 m, 100 m on the left hand
bank for riparian and floodplain respectively. Trees, shrubs, reeds, sedges and
grasses were represented. There was no encroachment by exotic vegetation,
reeds or terrestrial plants.
2.6 Estuarine Health Assessment Report
2.6.1 Introduction
The Pangani estuary located at 05°26’S; 38°59’E is a moderately large estuary on
the East African coastline, with a total length of approximately 22 km. The health
assessment of the estuary was based on two physico-chemical, fauna and floral
surveys conducted during the high (May 2006) and low (September 2006) flow
seasons, and provided a preliminary assessment of the health of the estuary.
Information from this component of the study was used as the basis for predicting
potential changes in the health of the Pangani estuary under various flow regimes.

44
2.6.2 Survey results
2.6.2.1 Site selection
Ten primary sampling stations were identified along the length of the estuary at which
all the physico-chemical and biotic parameters were surveyed. These stations were
more or less evenly spaced along the estuary at a distance of 2-3 km apart, spanning
a total distance of 22.4 km. Certain parameters were also sampled at up to ten
intermediate stations along the estuary.
2.6.2.2 Geomorphology
A number of historic aerial photographs of the estuary was acquired and examined
for changes in channel morphology and mouth state. Photographs covered the years
1977, 1982 and 1988, and indicated no obvious changes had taken place in channel
morphology or mouth state during the intervening ten-year period.
2.6.2.3 Temperature, salinity, oxygen
A range of water quality parameters (temperature, salinity, oxygen, pH, and turbidity)
were measured over spring high and spring low tides at the surface and at 1 m depth
intervals to the bottom at 20 stations up the length of the Pangani estuary during the
high and low flow seasons. Data on these parameters indicated that water exchange
between the estuary and the sea over a spring high-low tide cycle is enormous owing
to the large riverine input and the huge tidal range at the mouth (>3 m). Virtually the
entire volume of the estuary is exchanged on each tidal cycle. The estuary is very
well mixed as a result of this, and oscillates between a river-dominated system at
spring low tide and a marine dominated system at high tide. At spring low tide under
high flow conditions, the estuary was highly compressed with strong outflow of river
water ensuring that the salinity averaged through the water column did not exceed 28
PSU, even at the mouth, from where it declined rapidly to 1.2 PSU at a position 7 km
upstream from the mouth. At spring high tide under high flow conditions, the sea
water pushed somewhat further up the estuary with salinities of up to 30 PSU
recorded as far as 9 km upstream, but declined rapidly to less than 2 PSU beyond
this point. At spring low tide under low flow conditions, salinities started off relatively
high at the mouth (34 PSU) but declined linearly from this point to a position 14 km
upstream where the water was almost completely fresh (2.4 PSU). At spring high
tide under low flow conditions the estuary was almost completely filled with seawater
with salinities remaining above 30 PSU for the first 14 km upstream of the mouth,
from where it declined rapidly to 4 PSU at the head (top) of the estuary (22 km
upstream). Little or no vertical stratification was evident in the water column during
either of the two sampling excursions. Oxygen concentrations in the estuary were
particularly low during the high flow season – mostly <3 mg l-1 (40% saturation),
dropping to <2.5 mg l-1 at the head of the estuary - but were somewhat higher in the
high flow season – 3.5-5.0 mg.l-1 (45-65% saturation). Temperatures were similar
between the high and low flow seasons and varied over a very narrow range
45
between spring high and spring low tide on each occasion (high flow: 27.1-28.1°C,
low flow: 27.1-27.5°C). Turbidity was generally very high in the system, especially
during the high flow season, a function of high suspended silt loads and high
phytoplankton production.
Low oxygen levels in the estuary are cause for concern and are probably a function
of high organic loading of the influent river water that is derived from land drainage
and possibly industrial and domestic effluent discharged to the system. Organic
material tends to settle out within the estuary for various reasons (mainly reduction in
flow rate and an increase in salinity) where it decomposes, using up available
oxygen. Low oxygen levels are likely to severely limit abundance, and affect the
composition of, fish and invertebrates within the system.
2.6.2.4 Nutrients
Historically, estuaries were mostly oligotrophic (nutrient poor) systems, with nitrogen
(N) and phosphorus (P) being the primary limiting nutrients that controlled primary
production in these systems. Mobilisation of N and P through land clearing,
application of fertilizer, discharge of human wastes, animal production, and
combustion of fossil fuels has fundamentally changed this situation, with the result
that eutrophication is now a worldwide problem affecting estuaries. The Pangani
estuary is certainly no exception; with nutrient data collected during the high and low
flow surveys indicating that the system is highly eutrophic (particularly problematic
during the high flow season). Nitrate concentration (NO3-) averaged across the
whole estuary ranged between 2652 ug l-1 (low flow season) and 4 041.3 ug l-1 (high
flow season), phosphate (PO4-) between 283 ug l-1 (high flow season) and 355 ug l-1
(low flow season), while ammonia averaged 2 650 ug l-1 in the low flow season (not
measured in the high flow season). These values are well above the generally
accepted levels at which these nutrients cease to become limiting (28 µg l-1 for
nitrogen and 0.5 µg l-1 for phosphorus). These values are also high compared with
nutrient concentrations in a range of other tropical and subtropical estuaries around
the world, and are mostly in the range of those that are considered to be severely
polluted.
2.6.2.5 Sediments
Coastal erosion is reported as being a significant problem in the area to the north of
the Pangani river mouth, as well as in the estuary mouth itself. Various reports
suggest that the shoreline has been retreating at a rate of up to 7.5-20 m per annum
since the 1960s. The mouth of the estuary is also reported to have deepened
substantially. This has been attributed to the impact of the various dams on the
estuary, particularly Nyumba ya Mungu, which is reported to trap up to 50% of the
sediments eroded from the catchment upstream of this point. While little hard
evidence was collected to support or reject these ideas during the field surveys,
extensive bank erosion evident in the middle and upper reaches of the estuary where

46
the river banks are undercut in many areas to the extent that trees are falling into the
river at numerous sites, does lend some support to these ideas. The banks of the
estuary from the mouth right up to the head of the estuary are also very steep and
inter-tidal areas very limited (possibly having been eroded away). If reports on the
deepening of the estuary mouth and widening of the channel are indeed true (which
seems likely), such a change in depth and sediment input must have had a profound
influence on the dynamics of the estuary. Water exchange between the estuary and
the sea would have increased considerably, for example, as would the tidal range
within the estuary and the upstream penetration of seawater.
Of contrasting concern are reports on the increase in amount of fine silt and mud
flowing down the rivers in the Tanga district, arising from soil erosion on agricultural
lands. The water flowing into the Pangani estuary during the high and low flow
surveys was noted to be highly turbid (Secchi depth = 19-24 cm) which supports
these observations. The high levels of organic matter in the sediments of the estuary
(8.2% in the intertidal and 5.2% in the sub-tidal sediments) also lend support to these
observations.
2.6.2.6 Chlorophyll a
Chlorophyll a concentrations in the Pangani estuary were measured by taking water
samples from the surface and bottom at ten stations along the estuary, filtering these
to extract the chlorophyll, which was then measured spectrophotometrically in the
laboratory. Chlorophyll a concentrations were mostly very high – the average for the
entire estuary in the high-flow season was 23.4 µg l-1 (peak 69.3 µg l-1) and 4.3 µg l-1
(peak at 13.3 µg l-1) in the low flow season. Comparing chlorophyll a concentrations
in the Pangani estuary with other tropical and sub-tropical systems from around the
world indicates that those in the Pangani estuary, particularly in the high flow season,
are anomalously high, exceeded by only one highly polluted estuary in South Africa.
These high phytoplankton concentrations are most likely linked with high nutrient
concentrations in the system, and confirm that the Pangani estuary is severely
eutrophic.
2.6.2.7 Vegetation
A survey of the vegetation of the Pangani estuary conducted in the dry season
indicated that vegetation changes dramatically along the estuary, these changes
being linked with changes in the salt concentration of the water. The lower reaches
of the estuary are dominated by mangroves of various species, but have largely been
replaced with coconut palms in the middle reaches of the estuary. Above the original
upper extent of the mangroves (approximately 14 km upstream from the mouth), the
plant communities on the banks of the estuary change abruptly to ones dominated by
reeds, grasses, and various shrubs and trees. Few of the hardwood trees that would
originally have dominated in the upper reaches of the estuary are still in evidence.
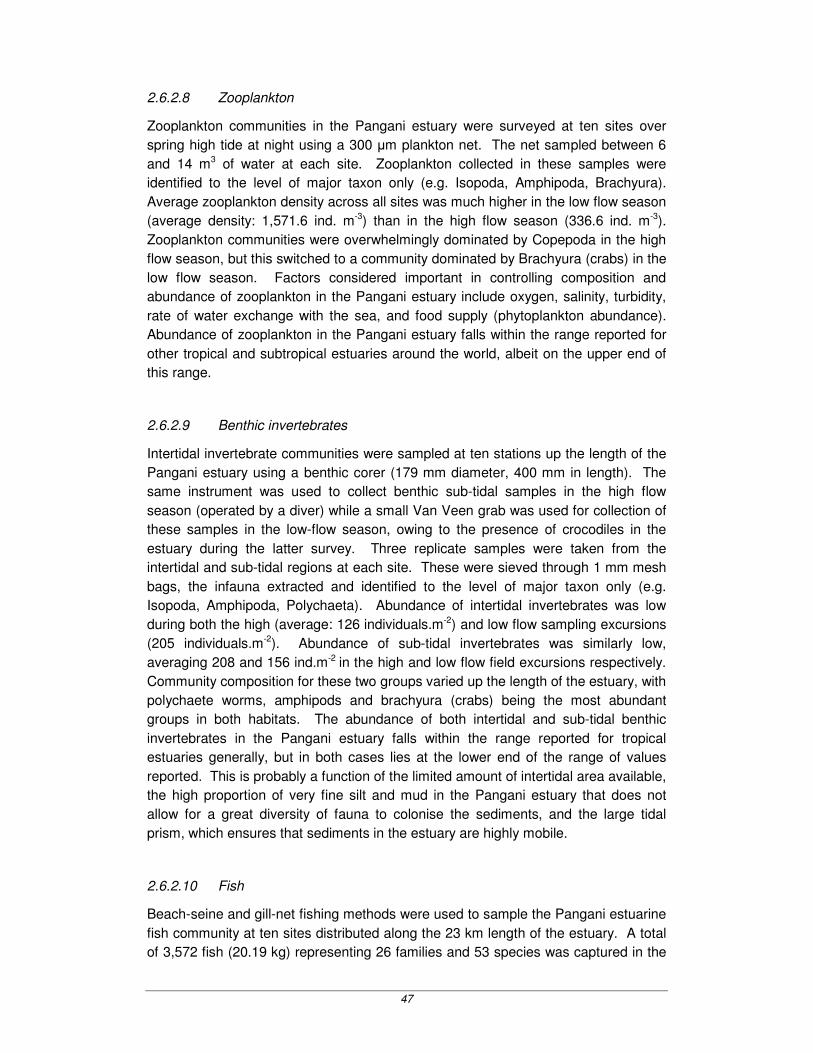
47
2.6.2.8 Zooplankton
Zooplankton communities in the Pangani estuary were surveyed at ten sites over
spring high tide at night using a 300 µm plankton net. The net sampled between 6
and 14 m3 of water at each site. Zooplankton collected in these samples were
identified to the level of major taxon only (e.g. Isopoda, Amphipoda, Brachyura).
Average zooplankton density across all sites was much higher in the low flow season
(average density: 1,571.6 ind. m-3) than in the high flow season (336.6 ind. m-3).
Zooplankton communities were overwhelmingly dominated by Copepoda in the high
flow season, but this switched to a community dominated by Brachyura (crabs) in the
low flow season. Factors considered important in controlling composition and
abundance of zooplankton in the Pangani estuary include oxygen, salinity, turbidity,
rate of water exchange with the sea, and food supply (phytoplankton abundance).
Abundance of zooplankton in the Pangani estuary falls within the range reported for
other tropical and subtropical estuaries around the world, albeit on the upper end of
this range.
2.6.2.9 Benthic invertebrates
Intertidal invertebrate communities were sampled at ten stations up the length of the
Pangani estuary using a benthic corer (179 mm diameter, 400 mm in length). The
same instrument was used to collect benthic sub-tidal samples in the high flow
season (operated by a diver) while a small Van Veen grab was used for collection of
these samples in the low-flow season, owing to the presence of crocodiles in the
estuary during the latter survey. Three replicate samples were taken from the
intertidal and sub-tidal regions at each site. These were sieved through 1 mm mesh
bags, the infauna extracted and identified to the level of major taxon only (e.g.
Isopoda, Amphipoda, Polychaeta). Abundance of intertidal invertebrates was low
during both the high (average: 126 individuals.m-2) and low flow sampling excursions
(205 individuals.m-2). Abundance of sub-tidal invertebrates was similarly low,
averaging 208 and 156 ind.m-2 in the high and low flow field excursions respectively.
Community composition for these two groups varied up the length of the estuary, with
polychaete worms, amphipods and brachyura (crabs) being the most abundant
groups in both habitats. The abundance of both intertidal and sub-tidal benthic
invertebrates in the Pangani estuary falls within the range reported for tropical
estuaries generally, but in both cases lies at the lower end of the range of values
reported. This is probably a function of the limited amount of intertidal area available,
the high proportion of very fine silt and mud in the Pangani estuary that does not
allow for a great diversity of fauna to colonise the sediments, and the large tidal
prism, which ensures that sediments in the estuary are highly mobile.
2.6.2.10 Fish
Beach-seine and gill-net fishing methods were used to sample the Pangani estuarine
fish community at ten sites distributed along the 23 km length of the estuary. A total
of 3,572 fish (20.19 kg) representing 26 families and 53 species was captured in the

48
39 beach seine hauls and 20 gill net sets that were conducted during the high (May
2006) and low (September 2006) flow seasons. Fish abundance was considerably
higher during the high-flow season (total catch 2,578 individuals) compared with the
low-flow survey (881 individuals) despite the total area sampled being smaller during
the former survey (3,120 versus 4 700 m-2). Overall, species from the families
Leiognathidae, Clupeidae, Engraulidae, Ambassidae Gerreidae, and Mugilidae
dominated the fish community, contributing 93% numerically and 76% by mass to the
total catch. Although less numerous, four larger species, Caranx sexfasciatus,
Lutjanus argentimaculatus and Epinephelus suillus contributed significantly (12%) to
the total mass caught. Community composition was similar in the high and low flow
seasons in spite of the huge change in abundance and biomass, with only slightly
fewer species recorded in the low flow survey (36 versus 32). All fish caught were
small, ranging between 3-35 cm TL, comprising either species that do not attain large
sizes or juveniles of marine species.
The fish species richness and biomass within the Pangani was found in these
preliminary surveys to be low compared with other tropical or temperate estuaries.
The 53 species recorded during this study is considerably less than that reported for
many similar sized, tropical and subtropical estuaries around the world. The species
count for the Pangani estuary is similar to the range reported for the suite of mostly
subtropical estuaries from South Africa (20-55) rather than the other tropical
estuaries in Africa (73-153) or elsewhere in the world (59-195). The average
biomass of fish within the Pangani estuary is also low relative to values reported for
other large tropical estuaries around the world, except for some of the smaller
systems that are reported as being moderately or highly polluted. Given that the
Indo-Pacific region is widely accepted to have the most diverse fish fauna globally,
the Pangani estuary, based on this preliminary survey, appears to have relatively low
species richness, abundance and biomass. This is most likely a function of the
relatively poor state of health in which the system currently resides.
2.6.2.11 Birds
Bird counts were undertaken opportunistically during the two field surveys, in
amongst the other surveys work. A total of only 13 species of birds was observed
during two partial and one full count of the Pangani estuary in the high-flow season
and a much increased total of 29 species in four partial and two full counts of the
estuary in the low-flow season. Actual numbers of birds counted were also low with
a maximum count of 113 individuals in the high-flow season and 288 in the low-flow
season. Avifauna on the estuary appears to be dominated by piscivorous species
(90% of the number of species recorded in the high-flow season, and 67% in the low-
flow season). One species of migratory wader was observed in the high-flow
season, and only eight observed in the low-flow season. This is very depauperate in
comparison with other subtropical and tropical estuaries where the number of bird
species recorded is mostly in the range of 40-70 (rising to over 100 in some large
systems) and the numbers of individuals present typically number in their thousands.

49
The range of trophic groups present on the Pangani estuary can also be considered
very low. The depauperate nature of the avifauna of the Pangani estuary is most
likely a function of limited habitat diversity (e.g. limited intertidal and shallow water
habitat, and a lack of submerged or emergent vegetation in the estuary), although
other factors may also play a role.
2.6.3 Estuarine Health Assessment
The health of the Pangani estuary was assessed following the methods of the
Department of Water Affairs and Forestry (DWAF) (2004). This entailed assigning a
score to each of a selection of habitat and biotitic parameters associated with the
estuary based on their perceived change from the natural or reference condition – i.e.
percentage of natural characteristics retained - and secondly combining these scores
into a Habitat Health Score and a Biotic Health Score, and finally into an overall
Estuarine Health Score. Habitat parameters included hydrology, hydrodynamics
and mouth condition, water quality and physical habitat alteration, while biotic
parameters included micro-algae, macrophytes, invertebrates, fish and birds. Each
of the individual habitat and biotic parameters was weighted equally within the two
assessment categories (habitat and biota) that in turn were weighed equally to derive
an overall estuarine health score. Scores derived for each of the parameters and
component, together with the overall health score for the Pangani estuary, are
presented in Table 2.8.
Table 2.8 Estuarine Health Score results for the Present State of the Pangani Estuary
Variable Score Weight Weighted Score
Hydrology 86 25 22
Hydrodynamics and mouth condition 40 25 10
Water quality 53 25 13
Physical habitat alteration 72 25 18
Habitat Health Score 63 50 21
Microalgae 40 20 8
Macrophytes 65 20 13
Invertebrates 60 20 12
Fish 50 20 10
Birds 40 20 8
Biotic Health Score 51 50 26
Estuarine Health Score 57
The overall all health score assigned to the Pangani estuary was 57, which places it
into the category of “largely modified” as per DWAF (2004). As far as the habitat
health scores were concerned, those parameters that were identified as being most
severely modified included hydrodynamics and mouth condition (mostly due to the
state of the mouth which is considered to be highly modified) and water quality (due
to the high nutrient loading and extremely low oxygen levels). Most of the

50
parameters relating to biotic health were moderately to severely affected by
anthropogenic activities, particularly the micro-algal (owing to very high
phytoplankton biomass in the system), avifaunal (extremely low diversity and
abundance), fish (low diversity and abundance) and invertebrate (low abundance)
components. Key abiotic and biotic changes in the present day condition of the
estuary from the reference (natural) condition are depicted in Figure 2.13.
Figure 2.13 Simple graphic showing the hypothesised reference (natural) and present
day status of the Pangani estuary. Note changes in channel profile, depth
and width, water clarity, and abundance of fauna and flora.
2.7 Socio-economic State of the Basin Report
2.7.1 Introduction
The aims of the socio-economic baseline assessment were:
• to provide an overview of the basin and its economy • to provide a description of the livelihoods of people living in proximity to rivers
in the basin, and • to estimate the contribution that aquatic ecosystem resources make to
people’s livelihoods.

51
2.7.2 Study area and zonation
The administrative Pangani Basin has an estimated population of about 3.4 million,
with about 2.6 million within the Pangani River Basin. Population density is highest in
the northern and eastern highlands, and is relatively sparse throughout most of the
rest of the basin area.
Land use is governed primarily by rainfall, with agriculture being concentrated in the
highlands and foothills. There is considerable large-scale/commercial cultivation of
coffee, sugar and flowers, as well as small-scale agriculture, mostly irrigated. The
latter concentrates on coffee, bananas and vegetables and dairy production in the
higher areas, and a wide variety of crops, including rice, on the foothills. Lower areas
include extensive commercial plantations, such as sisal, as well as small-scale
agriculture. Towards the coastal lowlands, the latter includes coconut, sweet and
Irish potatoes, pumpkins, cassava, okra, sisal and fruits. Although livestock are
important throughout the basin, pastoralism is particularly important in the arid
regions of the basin, with herds of cattle and goats being relatively large in these
areas.
The economy is typical of a developing country, with a low GDP per capita (Tshs
384,000 – 445,000 for the Regions in the basin). While agriculture contributes about
46% to national income, it is relatively more important for the basin regions, apart
from Arusha, for which other sectors such as tourism make a substantial contribution.
Most of the population is dependent on agriculture for subsistence and employment.
Within the agricultural sector, forestry, wildlife and fisheries are relatively minor within
the basin in terms of their economic contribution, but fisheries are an important
source of income and food locally. Of the other sectors, mining and hydropower
production are important outputs of the basin, but other sectors, such as industry
make a relatively small, although growing, contribution.
Irrigated agriculture is the biggest user of surface water in the basin, but urban and
industrial uses and hydropower are also major users. Water that remains in the
environment generates aquatic ecosystem goods and services. Households living
near aquatic ecosystems harvest a variety of resources, the most important being
fish.
The basin was delineated into six relatively homogenous socio-economic zones on
the basis of land use and relationships to aquatic ecosystems (Figure 2.1). The six
zones are Northern Highlands, Eastern Highlands, Lakes, Pangani-Kirua, Mesic
Lowlands and Coast.
2.7.3 Approach used
This project builds on a preliminary study of the use and value of water and aquatic
ecosystem resource use in selected areas of the basin conducted in 2003. While
aquatic ecosystems generate various types of value, this study concentrated only on

52
the value of water and aquatic natural resources to rural households in the basin.
We examine this from a household perspective only.
The study commenced with an initial review of existing published and unpublished
information and a two week-long visit to the basin in which information on the study
area was collated, the study area was delineated into sampling areas and the
sampling frame was designed. A total of 659 rural households were interviewed
throughout the study area and various focus group discussions were held to inform
different aspects of the study. Data were standardised and analysed to estimate the
value of natural resource use as well as agricultural production by rural households.
Values were related to the aquatic habitats of the study area as far as possible.
The study had a capacity-building component and involved a Tanzanian resource
economist working under the guidance of a South African mentor and in conjunction
with staff of the Pangani Basin Water Office. Several others also benefited from the
study in terms of experience gained, including senior staff at the Pangani Basin
Water Office and eight graduates of the University of Dar es Salaam and Sokoine
University of Agriculture who participated as enumerators in the study.
2.7.4 Findings
Households in the Pangani River Basin are characterised by considerable ethnic
diversity, with dominant groups changing throughout the basin. Households are
typically large, with an average of over 6.5 people in most areas. Average income
from employment and business not related to own agricultural or natural resource
production is in the order of only Tshs 10,000 – 48,000 per month. Almost all
household heads are farmers, having both crops and livestock. The main exceptions
are in the lakes zone and at the estuary, where only 71 – 74% are farmers, but where
fishing is more important. A high proportion of households collect a variety of natural
resources.
2.7.4.1 Agriculture
Small-scale farming is practiced throughout the basin, with much of the smallholder
farming area being irrigated, particularly in the higher-lying areas of the basin. There
is almost no crop rotation, reportedly due to acute shortages of arable land area.
The dominant crops are maize, beans, bananas and vegetables. In addition, coffee
is common in the northern highlands, rice in the eastern highlands, fiwi beans in the
lowland areas and cassava and coconuts are common around the estuary. Some
40–60% of farmers in the highland areas irrigate their fields, compared with much
lower proportions around the lakes and mesic lowland areas, and almost none in the
Pangani-Kirua and estuary zones. However, a large proportion of irrigation farmers
in the highlands felt that they did not have access to enough water. Income from
dryland farming is about Tshs 200,000 – 300,000 per household apart from the
northern highlands, where an average of over Tshs 600,000 was recorded. Irrigation

53
more than doubles the gross income generated by farming per unit area and
irrigation farmers tend to have slightly larger fields than others.
Most rural households in the Pangani Basin keep livestock, apart from in the estuary,
where the sample included an urban area, and only 61% had livestock. The most
common types of livestock are chickens, cattle, goats and sheep. Other animals
include donkeys, pigs, ducks and guineafowl. Income from livestock is significant,
ranging from about Tshs100,000 – 300,000 throughout most of the basin, apart from
the highlands, where dairy in particularly contributes to a livestock income of over
Tshs 500,000 on average, and in Pangani-Kirua, where livestock generate an
average of over Tshs 700,000 per household.
2.7.4.2 Water for domestic consumption
Household consumption ranged from about 90-120 litres per household per day,
apart from the northern highlands, where consumption was closer to 190 litres per
day, partly due to consumption by zero-grazing cattle. Over half of rural households
in the survey area had access to municipal water (taps), and 16% had access to
wells or boreholes. However, there is still considerable reliance on natural and semi-
natural (dams, canals) systems for water, with nearly half of households obtaining
water from these sources. The degree of reliance on natural or semi-natural sources
of water varies from 25% at the estuary to 92% in the Lakes zone.
2.7.4.3 River systems for cultural, religious and recreational use
Respondents indicated that river systems contributed significantly to religious and
recreational activities as well as for washing clothes.
2.7.4.4 Natural resources
Food and medicinal plants are harvested by about a third of households throughout
the basin, generating income of Tshs 12,000-52,000 per household. This is more
important in the more remote areas. Grasses, sedges, bulrushes and reeds are used
for thatching, fencing and making doors, with the use of different species varying
across the basin according to their availability. About a third of households harvest
these resources in any one year, generating income of Tshs 1500 at the estuary to
128,000 in the northern highlands. Palm leaves, mainly Hyphaene in the upper basin
and Phoenix toward the coast, are also an important resource, used for producing a
variety of goods such as baskets and mats. These resources generate up to Tshs
198,000 per year to user households.
Timber is only harvested by a few households, particularly in the uplands, and a few
households engage in the production of wood products such as furniture. Those that
do so earn substantial incomes. At least a third of households harvest poles in any
one year, and firewood is harvested by the majority of households throughout the

54
basin. Very little of this comes from aquatic ecosystems apart from at the estuary,
where about 10% reportedly comes from mangroves. These resources only
generate modest income, but are vital for construction and cooking. Charcoal
production tends to be done by only a small proportion of households, but can
generate substantial income.
Hunting is undertaken by a small proportion of households throughout the basin, but
the information on the amount of hunting is considered to be underestimated due to
the illegal nature of most activities. Waterbirds are reportedly an important
component of hunting.
Fishing is carried out throughout the basin. Fishing effort is greatest in the lakes
zone (at Nyumba ya Mungu Dam and Lake Jipe), with over half of the households
involved, and at the estuary (25%), but is relatively minor in the highlands apart from
the activity at Kalimawe Dam (eastern highlands). Freshwater catches are
dominated by tilapia and catfish, whereas estuary catches are far more diverse and
include crabs and prawns as an important component. Fish catches everywhere are
correlated with flow or water level, apart from crabs, which are caught in the low flow
period.
On average, households derive incomes of between Tshs 140,000 and 630,000 from
the use of natural resources. Income from aquatic ecosystem resources ranges from
under Tshs 15,000 in the northern highlands, to Tshs 560,000 in the lakes area.
Fisheries are the major source of income from aquatic resources, as can be seen
from the relatively large contribution of aquatic resources in the lakes, estuary and
eastern highland zones. The value of plants such as reeds and sedges are small,
but this belies the degree to which they are used. Their low value is due to their
relative abundance. The value of mangroves and waterfowl hunting is probably
underestimated because of the legality of use.
Households generally perceived crops and livestock to be their most important
sources of income. This was borne out to some extent in the estimation of income,
but varied between areas. According to the estimated values, river systems
(including fish) provide 0.5-6% of income in the highlands and 3-6% of income in the
lowlands. They provide about 35% and 13% of income, in the lake and estuary
zones, respectively. Households perceived the contribution of aquatic resources to
be somewhat higher than these estimates, possibly due to the fact that the market
value of natural resources does not always reflect their importance or their
replacement cost.
A total of 75% of rural households in the basin are within 10 km of major rivers, and
47% are within 5 km. The total value of aquatic ecosystem resources harvested in
the basin was estimated to be between Tshs 8.1 billion and 11.9 billion per year (US$
6.5 – 9.5 million). Over 60% of this value (Tshs 5.0 billion – 7.3 billion) was attributed
to fishing.
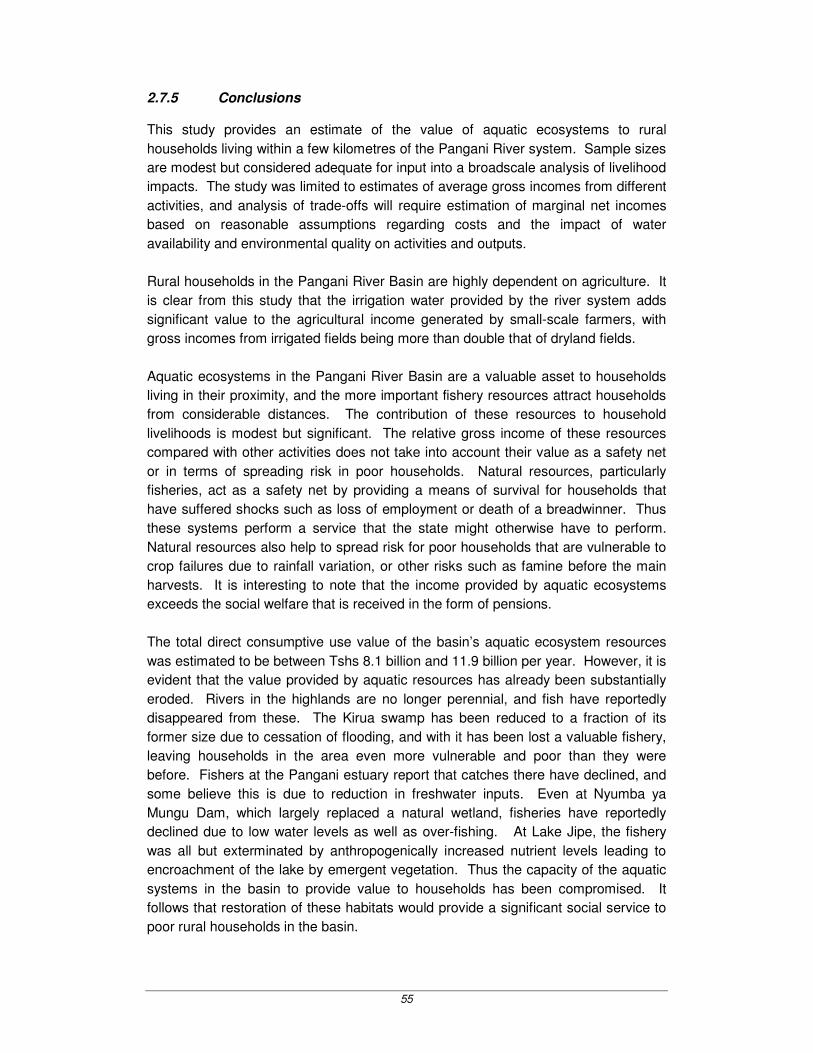
55
2.7.5 Conclusions
This study provides an estimate of the value of aquatic ecosystems to rural
households living within a few kilometres of the Pangani River system. Sample sizes
are modest but considered adequate for input into a broadscale analysis of livelihood
impacts. The study was limited to estimates of average gross incomes from different
activities, and analysis of trade-offs will require estimation of marginal net incomes
based on reasonable assumptions regarding costs and the impact of water
availability and environmental quality on activities and outputs.
Rural households in the Pangani River Basin are highly dependent on agriculture. It
is clear from this study that the irrigation water provided by the river system adds
significant value to the agricultural income generated by small-scale farmers, with
gross incomes from irrigated fields being more than double that of dryland fields.
Aquatic ecosystems in the Pangani River Basin are a valuable asset to households
living in their proximity, and the more important fishery resources attract households
from considerable distances. The contribution of these resources to household
livelihoods is modest but significant. The relative gross income of these resources
compared with other activities does not take into account their value as a safety net
or in terms of spreading risk in poor households. Natural resources, particularly
fisheries, act as a safety net by providing a means of survival for households that
have suffered shocks such as loss of employment or death of a breadwinner. Thus
these systems perform a service that the state might otherwise have to perform.
Natural resources also help to spread risk for poor households that are vulnerable to
crop failures due to rainfall variation, or other risks such as famine before the main
harvests. It is interesting to note that the income provided by aquatic ecosystems
exceeds the social welfare that is received in the form of pensions.
The total direct consumptive use value of the basin’s aquatic ecosystem resources
was estimated to be between Tshs 8.1 billion and 11.9 billion per year. However, it is
evident that the value provided by aquatic resources has already been substantially
eroded. Rivers in the highlands are no longer perennial, and fish have reportedly
disappeared from these. The Kirua swamp has been reduced to a fraction of its
former size due to cessation of flooding, and with it has been lost a valuable fishery,
leaving households in the area even more vulnerable and poor than they were
before. Fishers at the Pangani estuary report that catches there have declined, and
some believe this is due to reduction in freshwater inputs. Even at Nyumba ya
Mungu Dam, which largely replaced a natural wetland, fisheries have reportedly
declined due to low water levels as well as over-fishing. At Lake Jipe, the fishery
was all but exterminated by anthropogenically increased nutrient levels leading to
encroachment of the lake by emergent vegetation. Thus the capacity of the aquatic
systems in the basin to provide value to households has been compromised. It
follows that restoration of these habitats would provide a significant social service to
poor rural households in the basin.
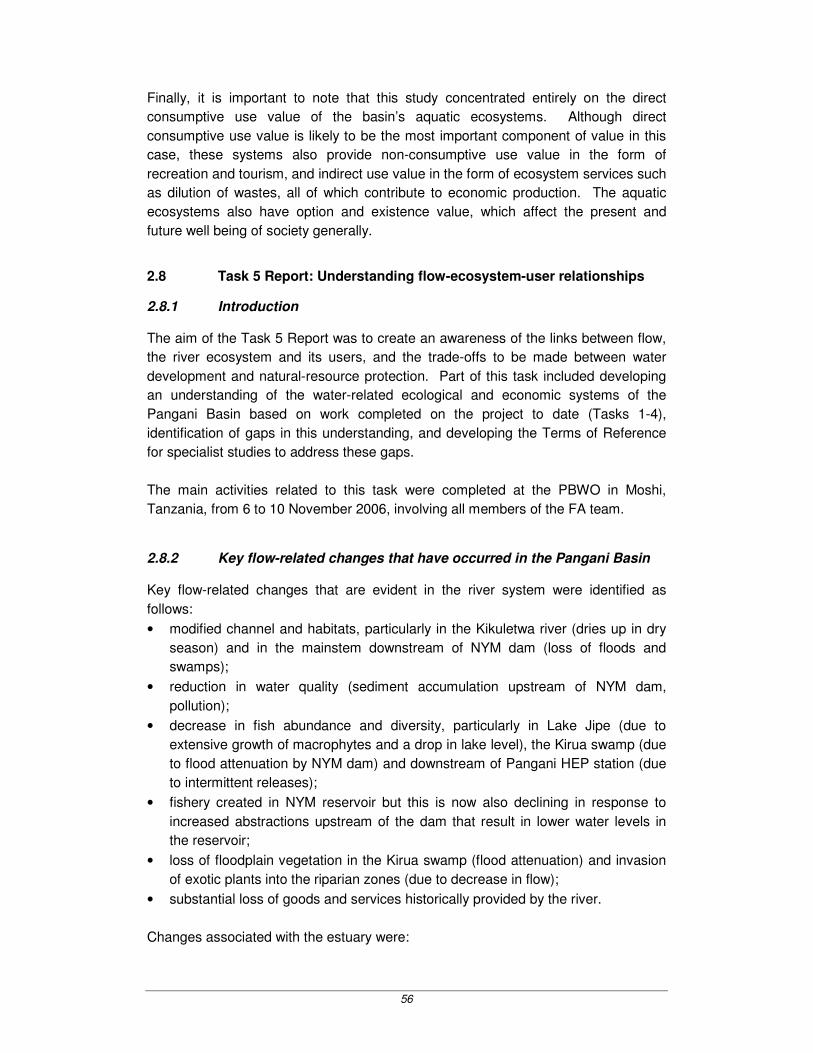
56
Finally, it is important to note that this study concentrated entirely on the direct
consumptive use value of the basin’s aquatic ecosystems. Although direct
consumptive use value is likely to be the most important component of value in this
case, these systems also provide non-consumptive use value in the form of
recreation and tourism, and indirect use value in the form of ecosystem services such
as dilution of wastes, all of which contribute to economic production. The aquatic
ecosystems also have option and existence value, which affect the present and
future well being of society generally.
2.8 Task 5 Report: Understanding flow-ecosystem-user relationships
2.8.1 Introduction
The aim of the Task 5 Report was to create an awareness of the links between flow,
the river ecosystem and its users, and the trade-offs to be made between water
development and natural-resource protection. Part of this task included developing
an understanding of the water-related ecological and economic systems of the
Pangani Basin based on work completed on the project to date (Tasks 1-4),
identification of gaps in this understanding, and developing the Terms of Reference
for specialist studies to address these gaps.
The main activities related to this task were completed at the PBWO in Moshi,
Tanzania, from 6 to 10 November 2006, involving all members of the FA team.
2.8.2 Key flow-related changes that have occurred in the Pangani Basin
Key flow-related changes that are evident in the river system were identified as
follows:
• modified channel and habitats, particularly in the Kikuletwa river (dries up in dry
season) and in the mainstem downstream of NYM dam (loss of floods and
swamps);
• reduction in water quality (sediment accumulation upstream of NYM dam,
pollution);
• decrease in fish abundance and diversity, particularly in Lake Jipe (due to
extensive growth of macrophytes and a drop in lake level), the Kirua swamp (due
to flood attenuation by NYM dam) and downstream of Pangani HEP station (due
to intermittent releases);
• fishery created in NYM reservoir but this is now also declining in response to
increased abstractions upstream of the dam that result in lower water levels in
the reservoir;
• loss of floodplain vegetation in the Kirua swamp (flood attenuation) and invasion
of exotic plants into the riparian zones (due to decrease in flow);
• substantial loss of goods and services historically provided by the river.
Changes associated with the estuary were:

57
• reduction in mean annual runoff entering the estuary, changes in the seasonality
of freshwater flows, and a reduction in flood frequency;
• reduction in coarse sediment carried down by the river, with concomitant impacts
on the state of the mouth and channel form;
• an increase in fine sediment (silt) carried down by the river, resulting in an
increase in muddiness and anoxic sediment conditions;
• a reduction in water quality, principally a reduction in oxygen concentrations and
an increase in the concentration of various inorganic nutrients;
• a reduction in the abundance and diversity of estuarine fauna and flora and in
goods and services delivered by the estuary (e.g. fish and agricultural
production).
Changes associated with the socio-economic conditions in the basin were:
• erosion of value provided by aquatic resources (e.g. fish) particularly at the Kirua
swamps, the estuary, Lake Jipe, and Nyumba ya Mungu Dam;
• erosion of benefits provided by aquatic resources, thus reducing the ability of
households to spread risk and to use the river as a safety net after shocks such
as loss of employment or death of a breadwinner.
2.8.3 Conceptual frameworks
A conceptual framework (Figure 2.14) was developed that would aid planning at a
basin level. This outlines the context of the Pangani Basin Flow Assessment within
integrated flow management of the basin.
The process starts with the selection of a range of possible development or other
water-management scenarios known or contemplated for the Pangani Basin, for
which flows are simulated using the basin hydrology models. Responding to this and
using a number of purpose-built tools, the effects of flow changes on ecosystem
health and the delivery of ecosystem good and services can be predicted, as can the
effects on peoples’ livelihoods and national and local economies. Using these
predictions, trade-offs between development and protection of the river system’s
resources can then be considered by decision-makers and other stakeholders in the
search for an optimal water-allocation solution. This optimal trade-off, finally decided
upon by the decision-makers, could be defined as the foundation of a Basin
Development Plan, against which individual proposed developments could then be
assessed.

58
New flow regimes
simulated
Changes in natural
environment
Impacts on the economy
Changes in livelihoods
B iophys ical analys is
Social and resource
economics analys is
Macro-economic analys is
Transformation of information:
Thr ee pillars of sustainable development
Government and Stakeholder
Consultation
Range of poss ible development
scenarios defined
Optimal trade-
off betweendevelopment and resource protection
Incorporation of thresholds of social and environmental
concern
Bas in Development
Plan
Individual projects assessed
Product
Activity
PANGANI INT EGRAT ED FLOW MANAGEMENT T OOL S
L imits of acceptable
flows
Figure 2.14 Conceptual framework for planning at the basin level
2.8.4 Development and population of FA tools
The Pangani Basin was divided into a series of hydrologically-discrete zones, for
which the purpose-built Flow Assessment (FA) tools (or models) were developed.
Each described the relationship between flow or water levels and a particular water-
related aspect of the basin:
• River ecosystem FA Tool;
• Kirua Floodplain FA Tool;
• Lake ecosystem FA Tool;
• Estuary FA Tool;
• People’s livelihoods FA Tool;
• Hydropower FA Tool;
• Macro-economics FA Tool.
The FA tools aid analysis of the development scenarios, providing predictions of
ecological, economic or social change linked to each, for decision-makers to
consider. Defined steps for the flow of data into and out of each tool were
developed, and team members responsible for each were identified.

59
2.8.5 Identification of specialist studies for Task 6
Members of the project team compiled a list of all specialist studies they felt were
necessary to provide a better understanding of the Pangani system and its users,
and which were possible within the time limits of the project. Nineteen specialist
studies were identified as important. As available funds for specialist studies were
limited, these were prioritised for funding in terms of how urgently the knowledge was
needed, and their importance to this flow assessment and to Integrated Water
Resources Management (IWRM) generally in the Pangani Basin. Other issues
considered in the prioritisation process included whether or not it would be possible
to derive good value from a desktop study only, the estimated number of person days
required to complete each study, the total duration of the project, and whether
capacity to do the study was available in Tanzania or would have to be sought
elsewhere. A final priority list of eight projects was created:
1. A macroeconomics study that can provide a detailed overview of the water-
related economy of the Pangani River Basin, and the contribution that this area
makes to the national economy.
2. Hydraulic assessment of the water levels (or depth) and inundated areas in Lake
Jipe, Nyumba ya Mungu, and the Kirua swamps associated with different
antecedent river flows and seasonal variations in aspects such as evaporation.
3. Assessment of the relationships between water level and/or flow and fishery
production for the major fisheries of the Pangani River Basin.
4. Assessment of the links between flow and distribution, biology and life history of
key fish and invertebrate species of economic or subsistence value in the
Pangani River system.
5. Assessment of the links between flow and the distribution, biology and life history
of key plant species of economic or subsistence value in the Pangani River
system.
6. A basin-wide assessment of past and present water quality of the Pangani
system
7. Assessment of the likely impacts of climate change on the hydrology of the
Pangani Basin.
8. Enhanced understanding of the variation in hydropower generated under different
flow scenarios.
Funding from Pangani Basin Flow Assessment resources was available for seven
priority studies. Topic 7 above, on water quality, was deemed to require a more in-
depth study than was possible in this project and was put aside for the present. For
the remaining seven topics, PBWO and IUCN published advertisements for
specialists in the Tanzanian press, referring interested readers to a website with
detailed Terms of Reference, and inviting proposals from interested consultant
researchers. An evaluation committee consisting of PBWO and IUCN staff evaluated
the proposals and the selected consultants were subsequently contracted to conduct
the studies (see Chapter 3).
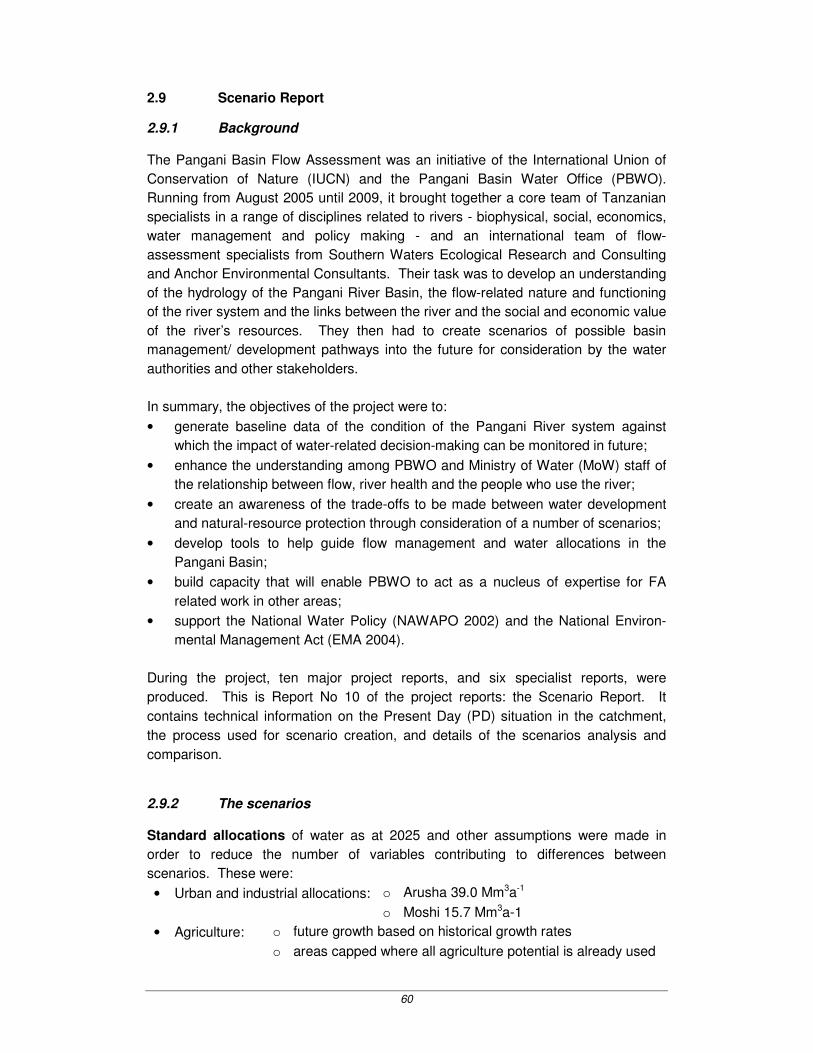
60
2.9 Scenario Report
2.9.1 Background
The Pangani Basin Flow Assessment was an initiative of the International Union of
Conservation of Nature (IUCN) and the Pangani Basin Water Office (PBWO).
Running from August 2005 until 2009, it brought together a core team of Tanzanian
specialists in a range of disciplines related to rivers - biophysical, social, economics,
water management and policy making - and an international team of flow-
assessment specialists from Southern Waters Ecological Research and Consulting
and Anchor Environmental Consultants. Their task was to develop an understanding
of the hydrology of the Pangani River Basin, the flow-related nature and functioning
of the river system and the links between the river and the social and economic value
of the river’s resources. They then had to create scenarios of possible basin
management/ development pathways into the future for consideration by the water
authorities and other stakeholders.
In summary, the objectives of the project were to:
• generate baseline data of the condition of the Pangani River system against
which the impact of water-related decision-making can be monitored in future;
• enhance the understanding among PBWO and Ministry of Water (MoW) staff of
the relationship between flow, river health and the people who use the river;
• create an awareness of the trade-offs to be made between water development
and natural-resource protection through consideration of a number of scenarios;
• develop tools to help guide flow management and water allocations in the
Pangani Basin;
• build capacity that will enable PBWO to act as a nucleus of expertise for FA
related work in other areas;
• support the National Water Policy (NAWAPO 2002) and the National Environ-
mental Management Act (EMA 2004).
During the project, ten major project reports, and six specialist reports, were
produced. This is Report No 10 of the project reports: the Scenario Report. It
contains technical information on the Present Day (PD) situation in the catchment,
the process used for scenario creation, and details of the scenarios analysis and
comparison.
2.9.2 The scenarios
Standard allocations of water as at 2025 and other assumptions were made in
order to reduce the number of variables contributing to differences between
scenarios. These were:
• Urban and industrial allocations: o Arusha 39.0 Mm3a-1
o Moshi 15.7 Mm3a-1
• Agriculture: o future growth based on historical growth rates
o areas capped where all agriculture potential is already used

61
o a 30% improvement in the efficiency of water use
o largest increase in use in Kikuletwa and Mkomazi
• HEP operating ranges o NyM 9.8 - 35.0 m3s-1
o Hale 8.5 - 45.0 m3s-1
o Pangani 9.0 - 45.0 m3s-1
• Climate change o applicable/not applicable
• River ecosystem o applicable/not applicable
Fifteen scenarios were selected for analysis:
1. Maximise Agriculture.
2. Maximise hydroelectric power (HEP).
3. Optimise PD flows for ecosystem support, with agriculture (Optimise PD
(Agric)).
4. Optimise PD flows for ecosystem support, with HEP (Optimise PD (HEP)).
5. High water allocation for ecosystem support (High Env.).
6. PD flows, with Climate Change (Climate Change from specialist report).
7. Maximise Agriculture, less 20% wet season rainfall (Max Agric, less 20%).
8. Maximise Agriculture, less 30% wet season rainfall (Max Agric, less 30%).
9. Maximise HEP, less 20% wet season rainfall (Max HEP, less 20%).
10. Maximise HEP, less 30% wet season rainfall (Max HEP, less 30%).
11. Storage upstream of NyM, with Maximise Agriculture.
12. Storage downstream of NyM (Luengera), with Maximise HEP.
13. Combination of storage upstream of NyM, with Maximise Agriculture AND
storage downstream of NyM (Luengera), with Maximise HEP.
14. Mixed benefits, which include storage upstream and downstream of NyM.
15. Optimise PD flows, with Agriculture and storage in the upper catchment
(Optimise PD (Agric with storage)).
The scenarios all included water allocations for Basic Human Needs (BHN),
Domestic and Industrial, Agriculture and HEP. For the scenarios where the
environment received more than residual water, pre-estimated environmental water
allocations (for the rivers, NYM Dam, Kirua Swamp and the Pangani Estuary) were
included. Scenarios differed from one another in respect of the order in which the
different demands are met from the available water supply, that is, the priority of
water allocation. Priorities are summarised in Table 2.9: thus, for example, Scenario
1 (Maximise Agriculture) consisted of maximising the irrigated area for agriculture
after allocating water for BHN and urban and industrial use.
Predictions were made regarding the likely consequences of changes in flow using
existing biophysical and socio-econonomic information, supplemented by specialist
understanding and local knowledge. The various streams of information and
predictions were organised within a custom-built Decision Support System (DSS).
Ultimately, each scenario – or development pathway - could be described in terms of
the predicted consequences to hydrology, river condition, the economics of the

62
natural resources of the river, HEP generation, irrigated agriculture, and social
impacts.
Table 2.9 Water supply priorities used in the hydrological model WEAP. PD = Present
Day.
Scenario Basic Human
Needs Urban
Agri-
culture HEP
Environ-
ment
Climate
change
1. Maximise agriculture 1 2 3 4 Residual n/a
2. Maximise HEP 1 2 4 3 Residual n/a
3. Optimise PD (Agric) 1 3 4 Residual 2 n/a
4. Optimise PD (HEP) 1 3 Residual 4 2 n/a
5. High Environment (Agric) 1 3 4 Residual 2 n/a
6. PD with Climate Change (Agric) 2 3 4 5 Residual 1
7. Max Agric, less 20% 2 3 4 5 Residual 1
8. Max Agric, less 30% 2 3 4 5 Residual 1
9. Max HEP, less 20% 2 3 5 4 Residual 1
10. Max HEP, less 30% 2 3 5 4 Residual 1
11. Storage upstream of NyM, with
Maximise Agriculture. 1 2 3 4 Residual n/a
Upper: 3 Upper: 4 12. Storage downstream of NyM
(Luengera), with Maximise HEP 1 2
Lower: 4 Lower: 3 Residual n/a
Upper: 3 Upper: 4 13. Combination of storage u/s of NyM,
with Max Agric AND storage d/s of
NyM, with Max HEP.
1 2 Lower: 4 Lower: 3
Residual n/a
Upper: 3 Upper: 4 Residual 14. Mixed benefits, include storage
upstream and downstream of NyM 1 2 Lower:
residual Lower: 4 3
n/a
15. Optimise PD (Agric with storage) 1 3 4 Residual 2 n/a
Some scenarios (Scenarios 6 to 10) also included projections of how flows would be
affected by global climate change. Climate change modeling was originally
undertaken by experts from the University of Dar es Salaam in order to assess how
climate change could affect the basin and the results incorporated into Scenario 6,
while Scenarios 7 to 10 included a range of reduced rainfall scenarios. International
review by UNDP and University of Cape Town (UCT) climate specialists revealed
that the climate-change modelling results had a high degree of uncertainty. More
investigations are presently being done by UCT. The scenarios in this report are
based on the original climate-change modeling and, because of the uncertainties, the
results from the climate-change scenarios should not be considered as the likely
climate future. For completeness, they remain in this report, but if the results from
the UCT climate-change modeling are significantly different to those of the initial
modeling exercise, then additional water-allocation scenarios will be run using the
new information.
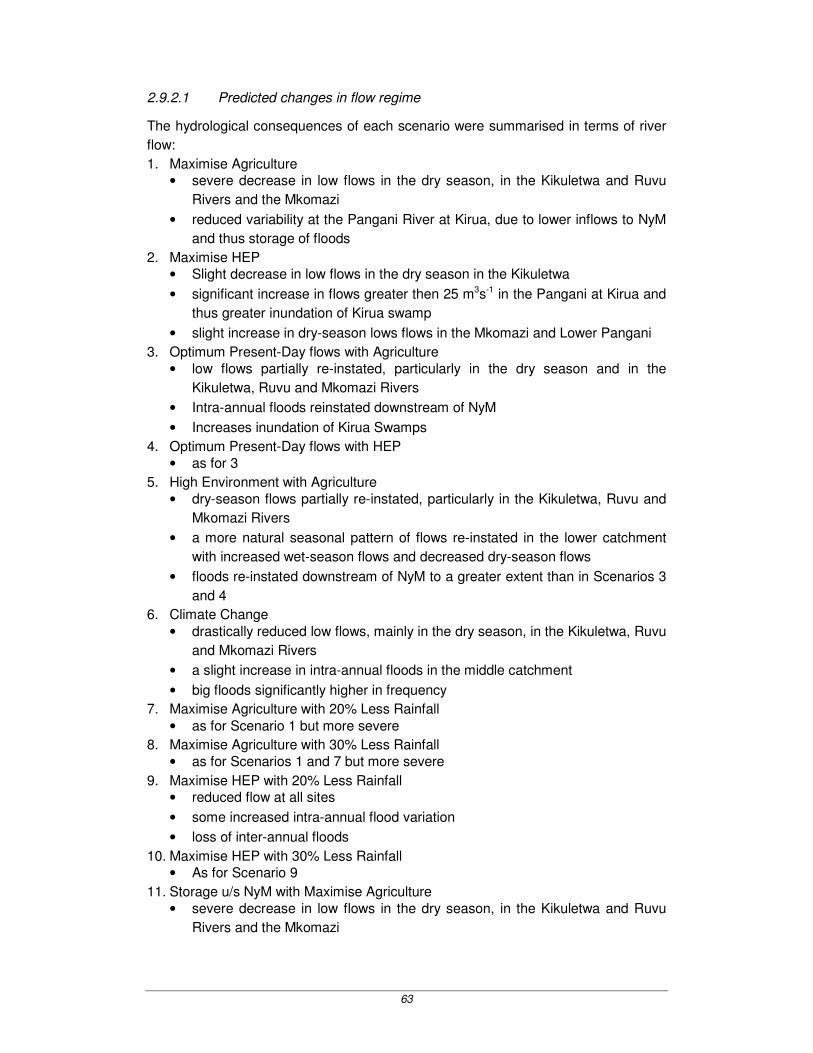
63
2.9.2.1 Predicted changes in flow regime
The hydrological consequences of each scenario were summarised in terms of river
flow:
1. Maximise Agriculture • severe decrease in low flows in the dry season, in the Kikuletwa and Ruvu
Rivers and the Mkomazi
• reduced variability at the Pangani River at Kirua, due to lower inflows to NyM
and thus storage of floods
2. Maximise HEP • Slight decrease in low flows in the dry season in the Kikuletwa
• significant increase in flows greater then 25 m3s-1 in the Pangani at Kirua and
thus greater inundation of Kirua swamp
• slight increase in dry-season lows flows in the Mkomazi and Lower Pangani
3. Optimum Present-Day flows with Agriculture • low flows partially re-instated, particularly in the dry season and in the
Kikuletwa, Ruvu and Mkomazi Rivers
• Intra-annual floods reinstated downstream of NyM
• Increases inundation of Kirua Swamps
4. Optimum Present-Day flows with HEP • as for 3
5. High Environment with Agriculture • dry-season flows partially re-instated, particularly in the Kikuletwa, Ruvu and
Mkomazi Rivers
• a more natural seasonal pattern of flows re-instated in the lower catchment
with increased wet-season flows and decreased dry-season flows
• floods re-instated downstream of NyM to a greater extent than in Scenarios 3
and 4
6. Climate Change • drastically reduced low flows, mainly in the dry season, in the Kikuletwa, Ruvu
and Mkomazi Rivers
• a slight increase in intra-annual floods in the middle catchment
• big floods significantly higher in frequency
7. Maximise Agriculture with 20% Less Rainfall • as for Scenario 1 but more severe
8. Maximise Agriculture with 30% Less Rainfall • as for Scenarios 1 and 7 but more severe
9. Maximise HEP with 20% Less Rainfall • reduced flow at all sites
• some increased intra-annual flood variation
• loss of inter-annual floods
10. Maximise HEP with 30% Less Rainfall • As for Scenario 9
11. Storage u/s NyM with Maximise Agriculture • severe decrease in low flows in the dry season, in the Kikuletwa and Ruvu
Rivers and the Mkomazi

64
• reduced variability at the Pangani River at Kirua, due to lower inflows to NyM
and thus storage of floods
12. Storage d/s NyM with Maximise HEP • severe decrease in low flows in the dry season, in the Kikuletwa and Ruvu
Rivers and the Mkomazi
• increased dry season lowflows in the Luengera
• increased inundation of Kirua
13. Combination of u/s storage with Maximise Agriculture and d/s storage with Maximise HEP • as for Scenario 12
14. Mixed benefits • severe decrease in low flows in the dry season, in the Kikuletwa and Ruvu
Rivers and the Mkomazi
• increased dry season lowflows in the Luengera
• significant increase in inundation of Kirua
15. Storage upstream of NyM, Optimise PD • low flows partially re-instated, particularly in the dry season and in the
Kikuletwa, Ruvu and Mkomazi Rivers
• intra-annual floods reinstated downstream of NyM
• increased inundation of Kirua Swamps
(Note: The differences in the predictions for large floods in Scenario 6 (Climate
Change -CC) and Scenarios 9 and 10 (Max HEP with 20% or 30% less rainfall) are a
result of the two different approaches used in hydrological simulation. The CC
scenario reflects results from the CC modelling exercise, which included increases as
well as decreases in rainfall in various areas, whilst the two Max HEP/Rainfall
scenarios simply take away rainfall.)
2.9.3 Predicted response of the river ecosystem
2.9.3.1 River
The four scenarios that redistribute river flow (Scenarios 3-5 and 15) and, for
Scenario 5, increase its volume, resulted in a low to moderate improvement in river
condition throughout the system compared to PD (Table 2.10) apart from a very
slight decrease at site 3 for Scenario 15.
The scenarios that include climate change (Scenarios 6-10) show an almost basin-
wide decline in river condition. Scenarios 7 and 8 (Max Agriculture with 20% or 30%
less rainfall) are predicted to result overall in the most severe decline.
Most scenarios indicate a low to moderate improvement in condition in the Kirua area
(site 6). This is so not only for the four scenarios aimed at improving river condition,
but also for those prioritising HEP as they leave more water in the river than do the
ones prioritising agriculture.

65
Of the scenarios that were not specifically designed to improve river condition,
Scenario 2 (Maximise HEP) caused least degradation to the river and actually
brought about some improvement to the lower reaches.
Table 2.10 Colour coding to illustrate shift in condition from Present Day at the FA
river sites for the fifteen scenarios. pink: low decline in condition; orange:
moderate decline; red: severe decline; pale blue: low improvement; dark blue:
moderate improvement.
Scenario Site 1 Site 2 Site 3 Site 4 Site 6 Site 7 Site 8 Site 9
1. Max Agric -0.193 -0.221 -0.107 -0.061 0.024 -0.971 0.000 -0.049
2. Max HEP -0.025 -0.007 -0.072 -0.013 0.186 -0.474 0.017 0.068
3. Opt PD (Agric) 0.000 0.055 0.000 0.010 0.319 0.050 0.036 0.000
4. Opt PD (HEP) 0.000 0.055 0.000 0.010 0.319 0.050 0.036 0.000
5. High Enviro 0.072 0.055 0.000 0.010 0.515 0.204 0.036 0.000
6. Climate change -0.149 -0.227 -0.131 -0.055 0.047 -0.583 -0.095 -0.044
7. Max Agric less 20% -0.587 -0.558 -0.155 -0.274 -0.204 -1.124 -0.509 -0.200
8. Max Agric less 30% -0.726 -0.610 -0.412 -0.289 -0.377 -1.143 -0.663 -0.388
9. Max HEP less 20% -0.383 -0.266 -0.205 -0.239 0.165 -0.311 -0.467 0.059
10. Max HEP less 30% -0.470 -0.337 -0.275 -0.276 0.056 -0.148 -0.500 -0.009
11. Storage u/s NyM Max Agric -0.138 -0.227 -0.132 -0.053 0.014 -0.971 -0.169 -0.061
12. Storage d/s NyM Max HEP -0.132 -0.227 -0.141 -0.027 -0.043 -0.990 -0.266 -0.044
13. Combo11&12 -0.138 -0.227 -0.132 -0.041 0.014 -0.915 -0.245 -0.040
14. Mixed Benefits -0.121 -0.227 -0.132 -0.067 0.115 -0.915 -0.215 -0.044
15. Add Store Opt PD 0.056 0.088 -0.023 0.016 0.235 0.006 0.017 0.097
The last group of scenarios mostly show a basin-wide decline in river condition,
although all but Scenarios 7, 8 and 12 do also improve the condition at Site 6 (Kirua
Swamp). Scenario 15 (Optimise PD and add storage in upper basin) allows a mild
improvement in river condition except at Site 3 (Upper Ruvu) where storage of flood
flows causes a mild decline.
2.9.3.2 Estuary
The estuary is predicted to show a similar decline in health under all scenarios
except those that optimise flows for ecosystem maintenance. The one exception to
this is again Scenario 2 (Maximise HEP), which also brings improvement to the
estuary.
Maximising agricultural production in the Pangani catchment (Scenario 1, 7, 8, 11
and 13) is projected to come at a cost in terms of changes in estuary health,
especially if this is coupled with reductions in rainfall (Table 2.11). Projected
changes in rainfall associated with the modelled climate change scenario (Scenario
6) are also expected to have a negative impact on estuary health.

66
On the other hand, maximising HEP under the PD rainfall is likely to enhance estuary
health significantly (Scenario 2), but this effect is likely to be largely negated by
projected reductions in rainfall under the two rainfall reduction scenarios (Scenarios 9
and 10).
Table 2.11 Change in estuarine health for the 15 scenarios (PD = Present Day).
Scenarios Health score (%) Integrity score
PD 57 0
1. Max Agric 46 -0.348
2. Max HEP 65 0.201
3. Opt PD (Agric) 61 0.161
4. Opt PD (HEP) 70 0.436
5. High Enviro 62 0.234
6. Climate change 51 -0.200
7. Max Agric less 20% 34 -0.853
8. Max Agric less 30% 31 -0.931
9. Max HEP less 20% 58 -0.020
10. Max HEP less 30% 57 -0.059
11. U/s storage, Max Agric 46 -0.373
12. D/s storage, Max HEP 48 -0.300
13. Combo 11 & 12 48 -0.319
14. Mixed Benefits 49 -0.266
15. Opt PD with storage 58 0.045
Redistribution of flow within the catchment (Scenarios 3 to 5 and 15) is expected to
have a low to modest positive impact on estuary health.
2.9.3.3 Nyumba ya Mungu
The average lake area decreases under all scenarios (Table 2.12).
Table 2.12 Change in area of NyM, fish catch and reed area for the 15 scenarios.
Scenarios Mean
lake level
Mean
lake area
%change
lake area
% incr./ decr.
in variability
%change in
total fish catch
%change
Reed area
current 16 104 0 0 0 0
1. Max Agric 12 66 -37 30% -28 79
2. Max HEP 11 60 -42 10% -32 90
3. Opt PD (Agric) 12 68 -35 49% -26 40
4. Opt PD (HEP) 11 58 -44 9% -34 28
5. High Enviro 12 64 -38 51% -29 59
6. Climate change 13 73 -30 34% -22 92
7. Max Agric less 20% 10 51 -51 -45% -41 21
8. Max Agric less 30% 10 48 -54 -65% -43 26
9. Max HEP less 20% 10 49 -53 -71% -42 -20
10. Max HEP less 30% 9 47 -54 -91% -43 -38

67
Scenarios Mean
lake level
Mean
lake area
%change
lake area
% incr./ decr.
in variability
%change in
total fish catch
%change
Reed area
11. U/s storage, Max Agric 11 64 -38 23% -29 70
12. D/s storage, Max HEP 11 60 -42 10% -32 91
13. Combo 11 & 12 11 59 -43 4% -33 82
14. Mixed Benefits 10 55 -47 -10% -36 69
15. Opt PD with storage 12 70 -33 69% -24 83
Lake level becomes more variable under most scenarios apart from the reduced
rainfall scenarios (Scenarios 7 to 10) and the Mixed benefits scenario (Scenario 14).
Fish catches are predicted to decrease for all scenarios, while the reed area will
increase. The decrease in NyM area generally coincides with an increase in
inundation of Kirua swamp.
2.9.3.4 Kirua swamp
The maximising HEP and Opt PD scenarios all (except for Max HEP less 30% rain)
increase the inundation area of Kirua Swamp relative to PD, but never to anything
close to the estimated natural area of 90 000 ha. Consequently, fish and vegetation
abundance both also increase for these scenarios. The maximising agriculture
scenarios all decrease the inundated area of the swamp and consequently fish and
vegetation abundance (Table 2.13).
Table 2.13 Change in area of Kirua swamp, fish and vegetation abundance area for the
15 scenarios.
Scenarios Area of Kirua
swamp
% of PD : fish
abundance
% of PD : swamp
and vegetation area
PD 4 488 100 100
1. Max Agric 1 745 40 39
2. Max HEP 13 629 294 304
3. Opt PD (Agric) 21 524 458 480
4. Opt PD (HEP) 21 524 458 480
5. High Enviro 22 853 485 509
6. Climate change 2 742 62 61
7. Max Agric less 20% 748 18 17
8. Max Agric less 30% 499 12 11
9. Max HEP less 20% 6 814 150 152
10. Max HEP less 30% 3 823 86 85
11. U/s storage, Max Agric 997 23 22
12. D/s storage, Max HEP 11 634 252 259
13. Combo 11 & 12 8 892 194 198
14. Mixed Benefits 22 853 485 509
15. Opt PD with storage 15 457 332 344

68
2.9.3.5 Societal well-being
Impacts on livelihoods, measured in terms of impact on household income and on
intangible (recreational and spiritual) values, were aggregated into a prediction of the
percentage change from PD in societal well-being. Apart from Scenario 6, there are
no scenarios that improve well-being anywhere in the highlands and lakes areas,
which together contain most of the basin population. Scenario 1 (Maximise Agricul-
ture) and the storage Scenarios 11 to 14 are the ones that decline least from the
present levels of social well-being in these areas and the basin as a whole under the
increased demand for water in 2025. Societal well-being in the Pangani-Kirua, Mesic
Lowlands and Estuary areas improves under some scenarios, mainly those
associated with optimising or maximising environmental flows and HEP.
In terms of percentage changes, the biggest losses in societal well-being were
associated with the Lakes area for all scenarios and the Pangani Kirua area under
the Maximise Agriculture with Less Rainfall scenarios (Figure 2.15). These
percentage losses come from a very low base level, as income in these two zones is
already very low under the PD scenario.
-28
-24
-20
-16
-12
-8
-4
0
4
8
Northern
Highlands
Eastern
Highlands
Lakes Area Pangani Kirua Mesic Lowlands Estuary
1. Max Agric
2. Max HEP
3. Opt PD (Agric)
4. Opt PD (HEP)
5. High Enviro
6. Climate change
7. Max Agric less 20%
8. Max Agric less 30%
9. Max HEP less 20%
10. Max HEP less 30%
11. Add store Max Agric
12. Add store below NyM
13. Combo1&2
14. Mixed Benefits
15. Add Store OPT PD
% c
ha
ng
e fro
m P
rese
nt D
ay
Figure 2.15 Impacts on societal well-being for the 15 scenarios.
2.9.4 Basin-wide summaries
Direct economic implications were measured in terms of impacts due to changes in
natural resources, ecosystem services, commercial agriculture and HEP production.
When measured as percentage changes in value relative to PD the largest increases
in value are for ecosystem services, occurring under the scenarios aimed to improve
ecosystem condition. HEP values tend to improve slightly under the same scenarios.
The values of both ecosystem services and HEP decline under the scenarios that
prioritise agriculture and those that incorporate Climate Change, whilst gains from
agriculture are minimal if any. Conversely, agricultural values decline under all
scenarios where HEP and the ecosystem are prioritised. Changes in natural

69
resource values are extremely small relative to PD for all scenarios. However, when
viewed in terms of absolute changes in Tsh, those for HEP completely overshadow
the others (Figure 2.16; Table 2.14).
-2 000 000
-1 500 000
-1 000 000
-500 000
0
500 000
1 000 000
Ch
an
ge
in
va
lue
Tsh
mil
lio
ns
HEP
-800
-600
-400
-200
0
200
400
600
800
1 000
Ch
an
ge
in
va
lue
Tsh
mil
lio
ns
Natural resources
-120 000
-100 000
-80 000
-60 000
-40 000
-20 000
0
20 000
40 000
Ch
an
ge
in
va
lue
Tsh
mil
lio
ns
Agriculture
-300
-200
-100
0
100
200
300
400
Ch
an
ge
in
va
lue
Tsh
mil
lio
ns
Ecosystem regulating services
Figure 2.16 Changes relative to Present Day in million Tsh for the economic values
showing the relatively large impacts of hydroelectric power and agriculture
relative to natural resources and ecosystem services.
Table 2.14 Summarised economic impacts of the fifteen scenarios in terms of
changes in Tsh millions from Present Day (DSS software Sept 2009)
SCENARIO Hydroelectric
Power Agriculture
Natural
Resources
Ecosystem
services Total
%
change
Present Day 2 380 642 202 391 34 809 327 2 618 170
1. Max Agric -606 842 15 540 175 -91 -591 218 -22.58
2. Max HEP 547 991 -38 871 -516 183 508 788 19.43
3. Opt PD (Agric) 31 962 -59 008 -1 296 -26 752 -1.02
4. Opt PD (HEP) 552 606 -69 370 -157 338 483 417 18.46
5. High Enviro -4 037 -62 798 661 322 -65 852 -2.52
6. Climate change -445 989 10 933 -136 -56 -435 248 -16.62
7. Max Agric less 20% -1 403 326 -1 420 230 -164 -1 404 680 -53.65
8. Max Agric less 30% -1 765 391 -10 500 806 -178 -1 775 263 -67.81
9. Max HEP less 20% 469 726 -80 879 -48 44 388 843 14.85
10. Max HEP less 30% 39 527 -94 457 430 -10 -54 509 -2.08
11. Add store Max Agric -634 385 16 576 -62 -106 -617 977 -23.60
12. Add store below NyM -423 001 11 743 136 78 -411 045 -15.70
13. Combo 11&12 -444 648 14 909 -542 -98 -430 379 -16.44
14. Mixed Benefits -575 842 12 225 -23 265 -563 376 -21.52
15. Add Store OPT PD 25 315 -51 365 605 184 -25 262 -0.96

70
The maximise HEP scenarios go hand in hand with increased inundation of Kirua
swamp (although the swamp is not inundated to the same extent as for the Opt PD
and High Enviro scenarios) (Table 2.15). The positive economic effects of increasing
HEP production therefore coincide with the positive environmental effects of some
degree of restoration of Kirua swamp and consequent increased fish catches and
reed area. To some extent this is at the ‘expense’ of the lake levels, which are
reduced in all scenarios, as are fish catches. The river as a whole is only expected to
experience better than PD conditions under the optimising PD and high environment
scenarios.
Table 2.15 The status of key descriptors under each scenario
Scenario
Urban
Industrial &
Domestic
Irrigation
area as
% of PD
Irrigation
(@75%
assurance)
Hydro-
power
Kirua
inundation
Fish
catch @
Kirua
River
condition
Mm3
a-1
% of PD Mm3 a
-1 MWH
% of
natural t
% change
from PD
Present Day 31.1 - 1 042 602 647 5 133 0
1. Max Agric 54.7 124 1 032 428 134 2 53 -4.3
2. Max HEP 54.7 81 634 782 601 15 389 -0.3
3. Opt PD (Agric) 53.6 64 520 612 474 24 606 1.4
4. Opt PD (HEP) 53.6 55 435 784 235 24 606 2.0
5. High Enviro 50.9 61 497 601 411 25 643 2.5
6. Climate change 54.7 122 1 016 472 371 3 82 -3.2
7. Max Agric less 20% 54.7 109 873 225 815 1 23 -9.9
8. Max Agric less 30% 54.7 101 807 141 347 1 16 -12.3
9. Max HEP less 20% 54.7 40 286 755 227 8 199 -3.7
10. Max HEP less 30% 54.7 28 203 614 810 4 113 -4.5
11. Storage u/s NyM with
Max Agric 54.7 125 1 031 420 688 1 31 -4.7
12. Storage d/s NyM with
Max HEP 54.7 118 934 478 802 13 334 -4.8
13. Combination of u/s storage
with Max Agric and d/s storage
with Max HEP
54.7 120 950 472 745 10 257 -4.5
14. Mixed benefits 54.7 118 932 436 558 25 643 -4.1
15. Opt. PD-Agric & storage 53.6 69 545 610 424 17 440 1.2
A basin-wide summary in terms of the three pillars of sustainable development shows
that for both river and estuary scenarios that maximise agriculture have the greatest
negative ecosystem impact, whilst those that boost HEP generation may help
improve river condition (Figure 2.17). Socially, all scenarios have a negative impact
on overall well-being in the upper zones and variable but smaller impacts in the lower
zones. Overall, the effects are negligible, but they are strongest in the Maximum
HEP scenario and Scenario 15. Economically, scenarios that improve river condition
also tend to increase HEP values. Ecosystem services and HEP both decline in

71
value under the scenarios that prioritise agriculture. Conversely, agricultural values
decline under all scenarios where HEP and the ecosystem are prioritised.
-80
-70
-60
-50
-40
-30
-20
-10
0
10
20
30
1.
Ma
x A
gri
c
2.
Ma
x H
EP
3.
Op
t P
D (
Ag
ric)
4.
Op
t P
D (
HE
P)
5.
Hig
h E
nv
iro
6.
Clim
ate
ch
an
ge
7.
Ma
x A
gri
c le
ss 2
0%
8.
Ma
x A
gri
c le
ss 3
0%
9.
Ma
x H
EP
less
20
%
10
. M
ax
HE
P le
ss 3
0%
11
. U
/s s
tora
ge
, M
ax
Ag
ric
12
. D
/s s
tora
ge
, M
ax
HE
P
13
. C
om
bo
1 &
2
14
. M
ixe
d B
en
efi
ts
15
. O
pt
PD
wit
h s
tora
ge
Ecosystem Integrity Social well-being Economics
% c
ha
ng
e f
rom
cu
rre
nt
Figure 2.17 Percentage change from present day in terms of ecosystem integrity,
social well-being and economic values.

72
3 SUMMARIES OF EXTERNAL SPECIALIST
REPORTS
Terms of reference (TOR) for the specialist studies were written by IUCN, PBWO and
the project mentors and amended if necessary after assessment by the international
reviewers appointed for each study. The appointed specialists submitted a
suggested Table of Contents for approval and then completed the studies during
2007. One specialist team wrote a combined report on two topics: fish and
invertebrate life cycles and fishers, making six specialist reports in total. The studies,
specialists and reviewers are shown in (Table 3.1). First drafts were subject to an
internal review by project leaders and final drafts by the international reviewers. The
final versions were not reviewed again.
Table 3.1 Specialist topics, authors and reviewers
Study topic Specialist(s) Reviewer(s)
Development of climate
change scenarios (2008)
H. Mkhandi, P. Valimba,
& T. Kimaro
Hans Beuster, Emzantsi
Systems, RSA; Mark Tadross,
University of Cape Town, RSA.
Jessica Troni, UNDP
Macro-economic model of
the Pangani River Basin
G. Kahyarara. University
of Dar es Salaam
Glenn-Marie Lange, Centre for
Economy, Environment and
Society, New York, USA
Fish and invertebrate life
histories and important
fisheries of the Pangani River
Basin
O. Hamerlynck, M.D.
Richmond, A,
Mohammed, & S.R.
Mwaitega. Samaki
Consultants
Denis Tweddle, South African
Institute for Aquatic Biodiversity,
RSA
Hydroelectric power
modelling study
K.P. Luteganya & S.
Kizzy
Hans Beuster, Emzantsi
Systems, RSA
Hydraulic study of Lake Jipe,
Nyumba ya Mungu reservoir
and Kirua Swamp
T.A. Kimaro, S.H.
Mkhandi,, J. Nobert, P.M.
Ndomba, P. Valimba &
F..W. Mtalo
Hans Beuster, Emzantsi
Systems, RSA
The vegetation of the
Pangani River Basin and its
association with flow regimes
P.K.T. Munishi & A.
Chikiti, Sokoine
University of Agriculture,
Morogoro
Fred Ellery, University of Kwa-
Zulu, Natal, RSA
The executive summaries are provided below.
3.1 Climate change scenarios
The Terms of Reference for this study were to provide modified rainfall and
evaporation series for each of the selected 16 catchments in the Pangani River Basin
under scenarios of climate change. Statistical downscaling was used to establish

73
multiple linear regression (MLR) models between observed monthly rainfall and
NCEP/NCAR re-analyses for the period 1961-2001. Established models gave
moderately good to better efficiencies for majority of catchments although rainfall in
some months could not be better predicted. However, downscaled monthly rainfall
using HadCM3 were poorly predicted and the use of GFDL CM2.1 improved
significantly rainfall prediction with no predictions of negative rainfalls. The resulting
downscaled rainfall indicated significant changes will be experienced during the
months October to January leading to declining predominantly orographic rainfall in
these months. An increase of rainfall is predicted during the long rains particularly in
April and May and the dry season (June-September) particularly in June suggesting
a protrusion of long rains into the dry season. Calibration of MLR models for
evaporation could not be achieved due to lack of time series of evaporation and more
time is required to establish the scarce available information from hardcopies.
However, the highest ratio of 1.368 temperature predictions of between December-
February (DJF) and June-August (JJA) and annual evaporation rise of 20% by the
year 2100 were used to modify available average monthly evaporation to provide
evaporation scenarios for 2020s, 2050s and 2080s.
3.1.1 Comment
Concerns over the techniques and findings of this study led to further review by a
climate-change specialist at the Climate System Analysis Group (CSAG), University
of Cape Town. The conclusions were:
• The CSAG review identified the same concern that was previously raised by
Jessica Troni (UN Regional Advisor: Climate Change Adaptation), namely
that the uncertainty in the results may be attributed in part to the reliability of
the statistical downscaling techniques that were employed. A relatively
simple, unproved regression technique was used.
• The CSAG furthermore pointed out that climate change modeling that formed
the basis of the Fourth Assessment Report of the IPCC indicate a general
(strong) wetting trend in central-east Africa. In contrast, the Pangani
specialist study indicated a drier wet season, and a combination of wetter and
drier months in the dry season.
Because of uncertainty regarding the very important likely effects of climate change,
this component of the project was terminated at this point, and will be followed up in
separate climate-change investigations.
3.2 Macroeconomics
This project has undertaken macro-economics study in the Pangani River Basin to
facilitate design of a user friendly macroeconomic model for estimating economic
effects of changes in water allocation. In order to map the social, economic and
ecological linkages of water supply based on different scenarios the study has
developed a simple macro-economic model. The model allows economic and
hydrological linkage that can provide a convincing measure for comparing economic

74
implications of alternative scenarios with the goal of reaching an optimal solution
economic feasibility of optimal water allocation. In particular the study i) assessed the
economic contribution of the Basin, ii) provided the general assessment of systems
of water allocation and management and iii) undertook the basin flow assessment. In
the course of study implementation a detailed overview of the economy of the
Pangani River Basin, and the contribution that this area makes to the national
economy was provided. Furthermore, quantification of the relationships between
water supply and sectoral outputs at a micro and macro-scale was conducted. Then
using a developed model the economic consequences of changes in water
allocation, which would take the form of changes in agricultural, hydropower and
fisheries production into account, as well as any other important water user sectors
were assessed. The model estimated here is very simple and does not require a
specialization in economics to run it. The software needed is very simple and the
model is based on a simple Excel spread sheet.
The macroeconomic model designed by this study divides the Pangani economy into
production sectors, together producing eight unique goods. These sectors are: (1)
Key sector--fishery sector that provides inputs (goods) to the different sectors such
as manufacturing and households; (2) a production sector producing agricultural
goods, industrial goods and services; (3) an energy sector providing electricity
services; (4) an household sector providing labour (employment) and market for the
other sectors of the economy. The culmination of the modelling exercise begins with
evaluation of economic consequences of different possible future scenarios with
regard to the allocation of water among different water user sectors and the
environment. In particular, the model provides baseline information on the economy
of the Pangani Basin and the means to evaluate the impacts of alternative water
allocation scenarios.
Estimates of the model for a scenario with are presented in this report. This scenario
considers a 25% increase in water allocation for irrigation and a 19% reduction of
water used for electric generation. The estimation results suggest that the
macroeconomic effect of the first scenario is to increase GDP by US dollars 9millions
and create 7400 jobs In estimating the macroeconomic model six scenarios are
considered. In this report we have results for the first scenario, while the rest will
follow later. The results for the scenario 1 presented show high agricultural priority
and reduction in hydroelectric power production as the major objective of the Basin.
3.2.1 Comment
Effectively, a useable model that predicted the effects on the nation’s economy was
not built and so economic predictions within the project were confined to
local/regional resource-economic issues.

75
3.3 Fish, fisheries and invertebrates
This report is the product of two, short, desk-based Specialist Studies of the Pangani
River Basin Flow Assessment (PRBFA) Initiative. Based on published literature,
information from the Internet and from a five-day field visit in June 2007, the report
describes the main aquatic biotopes of the Pangani River Basin, an area of over
43,000 km².
The relatively high conductivity within the largely volcanic basin is confirmed and a
description is given of the fish and invertebrates that reside in the different water
bodies - mountain streams, crater lakes, rivers, man-made reservoirs, floodplains
and the mangrove fringed estuary.
Finfish and invertebrates (in this case, crustaceans) of commercial importance are
further described, particularly in relation to their life histories and response to
changes in river flow variables. Included is an updated list of freshwater fish in the
Pangani system.
The fishery of Nyumba ya Mungu and of estuaries comparable to the Pangani are
described with data from various sources. Hydrological data are used to discern
linkages in fisheries output and water levels (river flow or surface area) and
conceptual relationships are developed, highlighting probable links between the
timing and magnitude of freshwater flows in the Pangani system and the flow-related
requirements and life-history characteristics of each species.
It should be kept in mind that 2006 and 2007 were exceptional years with regard to
rainfall, water levels and flows and that the findings of several field studies conducted
during that period probably do not reflect the average situation in the Pangani Basin.
For example, the conductivity situation as recorded in this study, which was
comparable to the early post-impoundment studies in Nyumba ya Mungu as reported
in Bailey (1996) needs close monitoring over extended time periods across the entire
Basin before conclusions can be drawn on the potential impacts of (increasing)
conductivity on the fish, invertebrates and fisheries.
The Pangani Basin as whole has a comparatively high fish biodiversity, probably a
reflection of the wide range of available habitats. Still, some of the most
characteristic species of African rivers and floodplains seem to be absent from the
Pangani (Citharinus, Distochodus, Alestes, Hydrocynus). Various Cichlidae and the
catfish Clarias gariepinus dominate the catches but virtually all species present are
harvested in any life stage accessible to fishing gears. Invertebrate biodiversity is
high in the Basin but knowledge is still incomplete. Harvesting is almost entirely
restricted to estuarine crustaceans (prawns and crabs).
The mountain-stream habitat was not directly assessed in this study. Its importance
for fisheries is marginal. Important biodiversity values may still be discovered in
76
these habitats for both fish (e.g. Kneriidae) and invertebrates. Maintaining forest
cover and instream flows seems essential for their survival and/or restoration.
In the foothills of Mt. Kilimanjaro Lake Chala is still pristine but highly vulnerable,
including its endemic fish. The Lake Jipe catchment has been plagued by water
quality and quantity problems for several decades now. Its fisheries have collapsed
and its endemic species has declined. Though the expansion of the vegetated
marshes in Lake Jipe and on the Ruvu River creates access problems for the fishers,
these natural habitats play a vital role as filters and thus protect the downstream
areas such as Nyumba ya Mungu from an overspill of the Jipe problems.
The main Pangani River, characterized by a high conductivity, has been strongly
modified by the creation of the Nyumba ya Mungu Reservoir. As far as the available
data are reliable, its fishery seems to be on a downward trend with catches over the
past ten years an order of magnitude lower than those in the 1970s. There are
indications that the fisheries react favourably to higher water levels and/or increased
reservoir surface area above a threshold of 687 masl and 110 km² respectively. In
the absence of reliable monthly catch data, the analyses have been necessarily
crude. A standardized long-term monitoring programme independent from the
fishery such as the one in Lake Kariba (operated by the power company) could
provide highly valuable data. Bottom siltation has been mentioned as a possible
cause in the decline of some species.
The Kirua swamps have basically lost their fisheries and the other ecosystem
services they provided when they were functional floodplains. The remaining
Pangani River bed is intensively fished through a series of weirs, which form barriers
to the migration of large individuals.
The Mkomazi River, though fed with high quality runoff, has become largely
intermittent and its water quality is low, except in proximity to the various fresh
mountain streams that supply it. The fisheries in Kalimawe Reservoir, Lake Karamba
and Lake Manga are important for local livelihoods but are sensitive to the declining
water supply as are their biodiversity values.
The fisheries of the Pangani estuary are not well described but seem to be in decline.
The coastline is eroding and, in the absence of important (peak) flows; the estuary
may come to resemble a marine bay with a low contribution to coastal fisheries.
A small number of species with different life history characteristics were chosen as
models for what could happen under future flow scenarios: the fishes Oreochromis
esculentus, Clarias gariepinus, Barbus sp. and Hilsa kelee (as a possible model for
estuarine clupeids or engraulids), the crab Scylla serrata and the prawn
Fenneropenaeus indicus. The response curves of flow-species relationships drawn
for each of these species under both pulsed flow and non-pulsed flow scenarios are
expected to be valid for a guild of associated species. Important break points such
as flow interruption, flows that reach river bank vegetation, flows that create

77
additional river channels and flows that result in significant floodplain or mangrove
inundation are identified. All main fish and invertebrate guilds would benefit from
increased flows, especially if these are pulsed to be in accordance with natural flood
peaks and if they achieve significant inundation of floodplains or mangrove systems.
3.4 Hydroelectric power
The study team developed a simple but effective model to simulate power generation
under various water-allocation scenarios in the Pangani Basin. The model uses
scenario flow sequences generated by the hydrological models as input, and
produces estimates of long-term energy production as output. The model is a
valuable addition to the suite of decision support tools that have been made available
to the water managers of the Basin.
The report provides a description of the methodology that was used to develop the
hydropower model, and presents the results of the scenario simulations in an
appendix.
3.5 Hydraulic study
Within the Pangani River Basin, trade-offs between benefits provided by the aquatic
ecosystems and the benefits provided through off-stream water use such as irrigation
and hydropower need to be decided by the stakeholders. The trade-offs are to be
analysed by examining the potential consequences of a range of scenarios regarding
the future management of the catchment and its water resources. As part of these
trade-offs the impacts on the fisheries and plants associated with the various dams,
lakes and flood plains in the basin will be considered. For these resources, the
primary determinant of abundance is the water level (or depth) and inundated area in
Lake Jipe, Nyumba ya Mungu Reservoir and Kirua swamps associated with different
inflow regimes. For the swamps, the primary determinant of fish and plant
abundance is also affected by the timing of inundation. This study is aimed at
providing predictive tools that can be used to determine the extent of inundation at
Lake Jipe, Nyumba ya Mungu Reservoir and Kirua swamps for given inflow and
outflow scenarios.
During the study Area/elevation and storage/elevation curves for Lake Jipe and Kirua
swamps were developed. These relationships were derived from calibrated NASA
Shuttle Radar Topographic Mission (SRTM) Digital Elevation Models (DEM). The
STRM DEM is available at 90 m resolution. The DEM was projected to cartesian
UTM coordinate system before being used to map the ground surface at the study
area. The topographic sheets (73/2, 73/4, 74/1 and 74/3) at 1:50,000 scale, sourced
from Surveys and Mapping Division of the Ministry of Land were used to calibrate
and validate the DEM. The data was processed using Geographical Information
System (GIS) software Arc-view 3.2® with tools for filling pits, stream flow generation
and delineation of water sheds.

78
It was established that the planimetric surface area of Lake Jipe varies from 21.7 km2
at elevation of 699.6 m.a.s.l. to 31.2 km2 at elevation of 702.0 m.a.s.l.. In the same
range of elevations storage of the lake varies between 3.0 to 63.0 Mm3.
Analysis of the cross-sectional data and developed storage/elevation/surface area
relationship of Kirua swamps indicated that the swamps geometry is comprised of
three main parts, namely:
• a defined river channel;
• extensive floodplains, and;
• a free board.
The channel terminates at an elevation of 620.0 m.a.s.l. This point is located 10.0 m
above the general altitude of the Kirua swamps outlet. Above this point, a unit
increase in elevation increases the inundated area by more than 22 times, and the
storage increases by more than 2 times.
Characterization of groundwater/surface water interaction was done using qualitative
and quantitative tools. The approach entailed activities such as correlations between
water levels in Lake Jipe and daily rainfall amounts for gauging stations located
within the sub-catchments, Lumi River water levels, and the flow discharges at the
Outlet. Besides, a water-balance analysis on annual time scale and over a longer
time scale was done to complement the regression analysis. The hydro-
meteorological data were sourced from the Ministry of Water and Water Resources
Engineering Department database, University of Dar es Salaam and Water
Development Division in Kenya.
The hydraulic study of Lake Jipe found that there is a strong positive correlation
(0.971) between water levels of Lake Jipe and water levels of Lumi River at Lumi
gauging station. The results of the correlation analysis showed that rainfall is weakly
correlated to base flow into Lake Jipe suggesting that catchment rainfall alone does
not account for groundwater flow into the lake. The analysis suggests that the main
source of inflow to Lake Jipe is the Lumi sub-catchment.
This study has successfully used an hydraulic modelling approach to map inundation
in Kirua swamps. At the middle section of the swamp, the river bank gets overtopped
by a 2 year-flood. At the inlet to the swamp overtopping of the river bank can be
caused by a 5-year flood. A floodplain inundation model relating inflows to surface
area/storage for entire Kirua Swamps was developed using a fully fledged hydraulic
model. As an example case, a flood of 50.0 m3 s-1 was simulated to inundate about
fifty percent (50 %) of the floodplain.
An inundation model relating inflows and outflows to surface area for Nyumba ya
Mungu reservoir was developed using a simple water-balance model that generates
storage and converts it to elevation and area using storage-elevation and area-
elevation curves. The performance of this model is dependent on the accuracy of the

79
water-balance model, which also reflects the accuracy of outflow measurement, and
inflow modelling. Reasonable results were obtained in estimation of areas based on
the balance inflows and outflows.
The Consultant has four major recommendations to improve the hydraulic modelling
results of Lake Jipe and the Kirua Swamps. For the case of Lake Jipe, the
Consultant recommends a bathymetric survey or spot measurements of bed
elevation of Lake Jipe to be done. Besides, water-level monitoring in Lake Chala and
Jipe should be continued and extended. The Consultant also recommends further
monitoring and modeling of groundwater and surface water interactions in lake Jipe
to study the role of groundwater recharge to the lake.
A proper water balance for Nyumba ya Mungu reservoir is important for mapping the
inundated area associated with different inflow and outflow scenarios. A
comprehensive study involving monitoring of inflows and outflows is recommended to
establish the proper model. In this case the outflows, evaporation, bypass flows and
inflows need to be monitored to give a proper account of water in the reservoir. The
current records have errors that complicate the development of a proper inundation
model, which depends heavily on accuracy of water balance.
3.6 Vegetation
The objectives of this vegetation study were to:
• describe the relationships between the timing and magnitude of freshwater
flows in the Pangani system and the biology and life-history characteristics of
its key plant species;
• use these relationships to infer what the historic abundance levels and
distribution patterns were for these species in the Pangani catchment (where
such information is lacking);
• predict how abundance and distribution patterns may change in the future
under altered flow patterns.
The study used existing vegetation data of the Pangani River Basin (IUCN 2006,
Kamugisha et al., 2007) to first describe the longitudinal distribution of the riverine
species within the vegetation communities, categorizing them into terrestrial and
aquatic, then describe the longitudinal and lateral distribution of the species within
vegetation communities in five longitudinal zones of the basin i.e. mountain stream,
upper foothill, lower foothill, lower mature river/rejuvenated bedrock cascade and the
estuary. Later, the drivers of change in this system were identified as well as the
ecologically and socio-economically important plant species.
Conceptual Models were then developed that showed how different species in the
different zones of the Pangani River basin are predicted to respond to different flow
regimes in different flow seasons i.e. median flow during the dry and short rain
seasons, 7-day minimum flow during the dry season and the short rain seasons and
duration of flow, median flow and small flood peaks during the long rains.

80
The Pangani river system has been classified into five zones, namely mountain
stream, upper foothill, lower foothill, rejuvenating bedrock cascade, mature lowland
river and the estuary (IUCN 2006). Each of these zones represents specific
characteristics of the system and has different vegetation species and community
composition and distribution.
The estuary’s principle vegetation types are sedges, palms and Mangroves. Sedges
and lilies are dominant in the upper reaches, while the middle and lower reaches are
dominated by palms and mangroves respectively. There is a strong zonation in
these communities up the length of the estuary, presumably a function of the salinity
distribution in the system. Of these zones, the lower foothill zone was the most
species rich in terms of total numbers and aquatic plant species, while the upper
foothill was the most species-rich in terms of terrestrial plant species.
The different zones of the basin show changes from natural vegetation cover to
modified vegetation especially along the riparian zones. Most of these changes
seem to be human induced resulting from degradation of natural vegetation giving
the exotics a more competitive ability. Exotic species therefore exclude natural
vegetation due to vigorous growth at a rate higher than the indigenous vegetation.
Some areas were observed to be critically modified as a result of encroachment by
exotic species resulting from removal of natural regeneration and bank erosion.
The ecologically important plant species that were identified in the basin included 33
indicator species, 18 keystone species and 11 ecosystem engineers. Socio-
economically important plant species include 33 species used as a source of food, 30
species used for medicinal purposes and 15 species used for construction material.
Response curves were created that depicted the relationships to flow of
representative species could in general terms be grouped according to species
growth forms and their lateral distribution on the river cross-section, giving three
growth forms (trees, shrubs and herbs) and three laterals/cross-sectional zones
(aquatic, wet bank and dry bank). Each of the three growth forms and their
representative species for each zone seem to respond differently depending on their
position on the river cross-section. The curves were used as input into the DSS.
Different flow regimes will influence the survival of plants differently depending on the
characteristics of the plant species. Further studies should focus on determining the
environmental correlates of different plant species distribution to be able to filter out
the impacts of different water regimes from other environmental factors. Clear
determination of the plant representative species in the four lateral sections of the
river i.e. water column, wet bank and dry bank is necessary for more clear
understanding of the different responses by different species.

81
4 PROJECT GOAL MONITORING AND
EVALUATION
4.1 Goal monitoring
The goals of the Pangani FA were as follows:
• generate baseline data on the condition of rivers, wetlands and the estuary
against which the impact of water-related decision-making can be monitored in
future;
• enhance the understanding among PBWO and MoW staff of the relationship
between flow, river health and the people who use the river;
• create an awareness of the trade-offs to be made between water development
and natural-resource protection;
• develop simple tools to help guide water-resource management and water
allocations in the Pangani River Basin;
• build capacity that will enable PBWO to act as a nucleus of expertise for FA-
related work in other areas;
• support the National Water Policy (NAWAPO 2002) and the National
Environmental Management Act (2004).
The efforts made to meet each of these goals and the activities linked to each are
discussed below.
4.1.1 Baseline data on the condition of rivers, wetlands and the estuary
against which the impact of water-related decision-making can be
monitored
Considerable effort went into the development of a monthly current-day hydrology for
the basin. The hydrological model that was configured and calibrated for the basin is
at a spatial resolution (i.e. number of sub-catchments and sizes of these) that is as
detailed as the availability of measured rainfall and streamflow records allows. The
model provides 82-year synthetic runoff sequences at key points in the basin, and
should provide a good basis for water-resource planning for the medium-term future.
The timing for a future update of the hydrology will be determined by the length of
new flow and rainfall measurement records (5-10 years of additional records may
allow improvements to the calibrations), significant land use changes, and/or drought
or wet conditions that are more extreme than those in the existing history. The EFA
methodology requires at least approximations of daily flow regimes at the EF sites.
This was accomplished by disaggregation of the monthly hydrology by using the
distributions of measured daily records. This method has shortcomings, as the
measured records include the effects of current water abstraction and dam operating
rules, and is an area where there is room for improvement.

82
The health assessment survey for the Pangani estuary represents the first detailed
study of the biota of any estuary in Tanzania, and one of the first in the East Africa
region. As such it provides invaluable data on the biota of estuaries in this country
and region. It also serves as an invaluable baseline against which the health and
importance of other estuaries in the country and the broader region can be assessed,
and against which future changes in this particular estuary can be benchmarked.
Data from this study also provide important insights into the links between freshwater
flow, water quality and the biota of estuaries in the region. The importance of
estuarine resources to local communities and the national economy was also
highlighted through this study.
Data on the baseline condition of rivers were sparse compared to what was produced
for the estuary because of the much greater areas covered. For instance, no
information was available on the lakes or Kirua Swamps. Descriptions of river health
and the response curves drawn up of flow-ecosystem relationships should be seen
as preliminary and tentative. Nevertheless, the river health assessment produced
some valid insights as to which parts of the basin are most impacted and the likely
causes of this. This provides a useful baseline set of data for assessing future
condition and monitoring management actions.
4.1.2 Enhanced understanding among PBWO and MoW staff of the
relationship between flow, river health and the people who use the
river
Learning by doing is an important and widely recognised way of building capacity. In
this project, all team members – national and international – learnt by working
together in close association. Tasks 5, 11 and 12 were directly designed to enhance
understanding of the flow-ecosystem-people relationships and it is to their credit that
PBWO-IUCN inserted the ‘slow-down’ phases to ensure that the complete team kept
on track together.
Staff from the PBWO and MoW participated in every phase of this study from the
initial planning stages, through the field data collection, model development, o the
final reporting, providing them with an opportunity to fully appreciate and understand
the complex links between flow, river health and social and economic well-being.
Managers and scientists rarely have the opportunity to be exposed to these issues
first hand or in such detail and hence seldom have the depth of understanding that
will have been gained by the team in this study. Few of the staff that participated
directly in the river and estuary components of the study had had any previous
experience in such surveys or in the assessment of estuary and river health or
importance. Their understanding of ecosystem functioning, health and importance
has thus been greatly enhanced through participation in this study.
In terms of the social component of the project, Pangani staff were involved in the
development of a household questionnaire prior to this project and also acted as

83
enumerators in the survey. We used the same questionnaire in this project, with
local specialists guiding the survey. The act of doing the interviews is the best way of
understanding the way in which people use and perceive the river.
4.1.3 Awareness of the trade-offs to be made between water development
and natural-resource protection
Scenarios analysed in this study explicitly examined trade-offs between water
allocation to different economic sectors (agriculture and hydropower) and the
environment, and the socio-economic implications of these tradeoffs. This made
explicit the fact that allocating additional water to one sector has implications for
other sectors, and has important socio-economic consequences at local, regional
and national levels. By prioritising hydropower production for example, it was evident
that significant economic benefits accrued at a national level while at the same time
the health of the river and estuary improved and hence was able to contribute more
to local livelihoods and well-being, but came at the expense of economic benefits
within the basin due to reduced agricultural production. Prioritising agriculture, on the
other hand, maximised socio-economic benefits within the basin but these came at
the expense of national economic benefits (associated with reduced hydropower),
river health (due to reduced quantity and quality water in the river), and local
livelihoods and social well being (due to reduced ecosystem health, water quality and
quantity in the river).
It would have been useful to have more time to discuss the trade-offs that were
illustrated by the scenarios, and articulate the probable impacts that people would
experience.
4.1.4 Simple tools to help guide water-resource management and water
allocations in the Pangani River Basin
We developed a tool which is simple in its assumptions and theoretical construct but
which is not particularly simple in its construction and operation. This is inevitable
because we are trying to evaluate the probable impacts of different water-allocation
strategies within a large, important and complex river basin.
Preparation of the hydrological data required for input into any new scenario is a
complex part of the process and requires a high level of expertise. Preparation of the
response curves of flow-ecosystem and ecosystem-people relationships is also
complex and requires specialist skills. At this stage of knowledge the curves were
built using a mixture of a generic understanding of these relationships, local data and
local wisdom. The Decisions Support System (DSS) that combined all these inputs
is complex and needs to be set up by experienced flow-assessment practitioners.
Once populated and running, the DSS produces straightforward outputs and
communicate them in a way that is relatively easy to interpret and use in broad-level
policy decisions.

84
4.1.5 Capacity building
The basin hydrology was developed as a collaborative effort between the
international hydrologist and the PBWO Basin Hydrologist. The process started with
a hydrological data collection exercise by the PBWO hydrologist (at the time this was
Dr George Lugomela), followed by a four-week long visit by the international
hydrologist during which the bulk of the model configuration and calibration work was
completed. The initial systems model configuration was done during a subsequent
two-week long visit by the international hydrologist. Shortly after this exercise, Dr
Lugomela was transferred to the MoW, and Mr Philipo Patrick was appointed as the
PBWO Basin Hydrologist. Dr Lugomela spent some time transferring his knowledge
of the basin hydrology to Mr Patrick, followed by a training workshop in Cape Town in
May 2008, during which the international hydrologist and Mr Patrick configured and
simulated a number of scenarios with the systems model. This training was
continued in 2009, with the simulation of the final set of scenarios. This time the
exercise was carried out in parallel, with Mr Patrick preparing the scenarios in Moshi,
Tanzania, and the international hydrologist repeating the exercise in Cape Town.
The intensive interaction between the international hydrologist and the two basin
hydrologists ensured that the basin hydrologists had a thorough grounding in the
basin hydrology and models. In retrospect, the presence of the international
hydrologist at the PBWO for an extended period of time presented an opportunity to
involve one or two other hydrologists from the MoW and/or other PBWO staff, but this
was not considered at the time and therefore was not fully exploited.
The ecological and social specialists within the Tanzanian team similarly participated
in a two-way learning exercise with their international colleagues. The national team
members participated in all parts of the project - data collection, literature reviews,
report writing – and ultimately led some of the analytical work. There is never
enough time in projects such as this to follow the necessary long-term capacity
building needed when implementing new concepts, but a careful programme of
training and awareness raising did allow all phases of the work to be done in a
national-international collaborative environment. With more time, it would have been
useful to have the national team write up all the reports, but as it was, the contractual
deadlines for delivering reports meant that sometimes the international team had to
complete reports in South Africa for later review by the Tanzanian team rather than
writing them together in Tanzania.
The project as a whole spanned a long period of time (6 years). There is a
continuing problem with long-term projects that team members may disappear to
other tasks, or be replaced meeting by meeting with new members in order to
maximise exposure to the activities. In the Pangani project, we were very fortunate
that there was a high level of continuity in respect of the staff members from the
PBWO and MoW who participated. Those that were able to participate through the
entire process seemed to benefit the most as they were able to build up a holistic

85
understanding of the entire flow assessment process. Those that joined the process
along the way may have found this more difficult to achieve. The capacity certainly
now exists within the PBWO and MoW to evaluate future scenarios for the Pangani
Basin and, with limited external assistance, to undertake a similar assessment for
one of the other large river basins in Tanzania.
4.1.6 Support of the National Water Policy (NAWAPO 2002) and the
National Environmental Management Act (2004).
The tools and understanding developed during the project speak directly to the
requirements of the water policy and NEMA. One scenario analysed in this study
prioritised the environment above other water-use sectors (agriculture and
hydropower) by explicitly allocating water to maintain the river ecosystem at a high
level of health, as required in terms of NAWAPO. Optimising the distribution of
existing flows to improve the existing river condition was also evaluated in further
scenarios. Through these scenarios, water volumes and water-quality requirements
to support healthy river, wetland and the estuarine ecosystems were clearly
articulated, and the costs and benefits of allocating water to the environment were
also made clear.
One area that needs further attention is that of national level versus basin level trade-
offs – that is, between contribution to the national economy (and its need to alleviate
poverty) and the welfare of people in the basin. This is a policy issue that we did not,
and should not, address, as it is a political issue.
4.2 Evaluation
To be provided by IUCN, as per arrangement.
4.3 Lessons learnt
Because of the delays caused by attempting to obtain acceptable climate-change
and other data, the project extended over several years with some large gaps
between activities. Such a project loses momentum, risks losing both international
and national team members, wastes time because old ground has to be re-covered
when activities start again, extends even further than planned because of the
difficulty of re-establishing timetables with project members now working elsewhere,
and risks losing the interest of stakeholders such as the PBWO and its Board and
Ministry. A sequence of shorter projects with well-defined end points would have
been preferable.
The specialist studies (Task 6) were designed to fill major gaps in knowledge
identified earlier in the project. The national team members did not do any of the
studies, as these were all outsourced. Their results were, to various extents, more or
less helpful in terms of the larger project goals. This may have been largely because
they were done on very small budgets by teams who did not well understand the

86
flows-assessment process or what data it required from them. In future similar
projects it would be advantageous to choose national team members who would also
take part in some way in any specialist studies, even if only as advisors.
One of the specialist studies was on the development of a national macro-economic
tool for assessing the economic implications of the scenarios. This is usually done
outside the flow assessment and linked in at a later stage. Such a plan was
unsuccessful in producing what was needed and, again, including this as part of the
flow assessment would have allowed the team members and the macro-economic
specialist to better liaise and produce the required product.
A stakeholder workshop was held early in the project to assess stakeholder concerns
(Scenario Selection Report; Table 1.3). Thereafter all discussions regarding the
scenarios to be considered in the project were with the PBWO and its Board. Further
consultation with a wider array of stakeholders might have revealed further scenarios
of interest to the wider basin population.
The process following scenario production remains undeveloped. The PBWO has
the opportunity to become a leader in how this work could proceed in terms of
awareness raising; stakeholder consultation; a transparent political decision-making
process; design and implementation of a basin water-resource management plan;
and monitoring and adaptive management.

87
5 CONCLUSIONS
Integrated Water Resource Management (IWRM) may be defined as ‘a process that
promotes the coordinated development and management of water, land and related
resources, in order to maximise the resultant economic and social welfare in an
equitable manner without compromising the sustainability of vital ecosystems’
(Global Water Partnership 2000). It is a relatively new concept that promotes
sustainable use of water, encouraging people to move away from traditional project-
driven ways of operating and toward a larger-scale basin or regional approach that
takes into account the overall distribution and scarcity of water resources and the
needs of other potential water users (King and Brown in press). In essence IWRM is:
• a political procedure, that aims for sustainability of use;
• a process of balancing all water demands and supplies, including those for
environmental maintenance;
• an iterative approach, that recognizes the need for adaptive management;
• a way of life.
The technical outputs of the Pangani FA project, such as long-term current-day
hydrological data, baseline data on the condition of rivers, wetlands and the estuary,
and the EF assessments for a wide range of future development pathways, are a
step toward IWRM, providing invaluable decision support for water-resource planning
decisions in the basin. The next step could be to integrate the findings into a
cohesive IWRM basin management plan.
Full development and implementation of IWRM basin plans go far beyond simply
allocating water to one or more water-use sectors. Implementation, in terms of truly
moving to manage for sustainability, is much wider and more complex (Table 5.1),
occurring over a considerable time-span (King and Brown 2009).
The time line of implementation as outlined in Table 5.1 may well be one to two
decades, even where the political will, funds and technical skills exist.
Moving toward that goal, the project has evaluated and highlighted the trade-offs that
need to be made, and indeed are implicitly already being made, in allocation of water
within the Pangani Basin and more broadly within the country. A basin IWRM plan
would need to address institutional issues, identify a preferred scenario i.e. a
preferred development pathway, and map out the water allocation decisions to be
made in order to place the basin onto this path.
A nucleus of expertise has been developed in Tanzania that can be used to help put
this in place for the Pangani basin and ultimately for other catchments around the
country. This project is just the beginning, however, and needs to be built on.
Tanzania can seek to enhance its capacity in this field by implementing
environmental flow assessments in other basins in the country as soon as possible,

88
with assistance as required. If this is not done, the national expertise and experience
gained will begin to dissipate and in all likelihood will be lost within a short space of
time.
Table 5.1 Sustainable use of rivers: key attributes of implementation (King and
Brown in press)
No. Attribute
1 Development of appropriate policy, legislation and basin agreements
2 Structured and continual engagement with stakeholders
3 Development of holistic flow-assessment methods
4 Re-organisation of institutions to meet new laws
5 Design of new kinds of infrastructure and operating rules to deliver and monitor
environmental flows
6 Development of regional regulatory mechanisms for licensing or re-licensing
7 Creation of awareness among governments and other stakeholders
8 Continual investment in research and capacity building
9 Delivery of the environmental flow
10 Monitoring and adaptive management

89
6 References
Global Water Partnership (GWP). 2003. Poverty reduction and IWRM. GWP
Technical Committee Background Paper 8, prepared for the Water and
Poverty Initiative. GWP, Stockholm, 16 January 2003.
King J.M. and Brown C.A. 2009. Integrated basin flow assessments: concepts and method development in Africa and South-east Asia. Freshwater Biology 55 (1): 127-146.