itjemast5(1): latest research from international transaction journal of engineering, management,...
TRANSCRIPT
Volume 5 Issue 1 (January 2014)
ISSN 2228-9860 eISSN 1906-9642
http://TuEngr.com
In This Issue Effects of Calcination Treatment of Diatomite on Dimethyl Ether Synthesis from Methanol
Effect of Blend Ratio on Cure Characteristics, Mechanical Properties, and Aging Resistance of Silica-filled ENR/SBR Blends
An Efficient Formulation of Off-line Model Predictive Control for Nonlinear Systems Using Polyhedral Invariant Sets
Effect of Modeling Parameters on System Hydrodynamics of Air Reactor in Chemical Looping Combustion Using CFD Simulation
Flow Behavior of Geldart A and Geldart C Particles in a Co-current Downflow Circulating Fluidized Bed Reactor
Optimization of Enzymatic Clarification from Corncob
Synthesis of Alkali Metal/CaO Sorbent for CO2 Capture at Low Temperature
Cover Photo is from published article ITJEMAST V5(1) of W. Pranee et al. (2014) “Effects of Calcination Treatment of Diatomite on Dimethyl Ether Synthesis from Methanol. Photos show scanning electron micrograph of diatomite with 1,000 magnification: Fresh DM (top) and DM500 (bottom).

International Transaction Journal of Engineering, Management, & Applied Sciences & Technologies
http://TuEngr.com
International Editorial Board Editor-in-Chief Ahmad Sanusi Hassan, PhD Associate Professor Universiti Sains Malaysia, MALAYSIA
Executive Editor Boonsap Witchayangkoon, PhD Associate Professor Thammasat University, THAILAND
Noble Editorial Board: Professor Dr.Mikio SATOMURA (Shizuoka University, JAPAN) Professor Dr.Chuen-Sheng Cheng (Yuan Ze University, TAIWAN) Professor Dr.I Nyoman Pujawan (Sepuluh Nopember Institute of Technology, INDONESIA) Professor Dr.Neven Duić (University of Zagreb, CROATIA) Professor Dr.Lee, Yong-Chang (Incheon City College SOUTH KOREA) Professor Dr.Dewan M. Nuruzzaman (Dhaka University of Engineering & Technology, BANGLADESH) Professor Dr. Lutero Carmo de Lima (State University of Ceará, BRAZIL )
Scientific and Technical Committee & Editorial Review Board on Engineering, Technologies and Applied Sciences: Associate Prof. Dr. Paulo Cesar Lima Segantine (University of São Paulo, BRASIL) Associate Prof. Dr. Kurt B. Wurm (New Mexico State University, USA ) Associate Prof. Dr. Truong Vu Bang Giang (Vietnam National University, Hanoi, VIETNAM ) Dr.H. Mustafa Palancıoğlu (Erciyes University, TURKEY) Associate Prof.Dr.Peter Kuntu-Mensah (Texas A&M University-Corpus Christi, USA) Associate Prof. Dr. Masato SAITOH (Saitama University, JAPAN ) Assistant Prof.Dr. Zoe D. Ziaka (International Hellenic University, GREECE ) Associate Prof.Dr. Junji SHIKATA (Yokohama National University, JAPAN) Assistant Prof.Dr. Akeel Noori Abdul Hameed (University of Sharjah, UAE) Assistant Prof.Dr. Rohit Srivastava (Indian Institute of Technology Bombay, INDIA) Madam Wan Mariah Wan Harun (Universiti Sains Malaysia, MALAYSIA ) Dr. David Kuria (Kimathi University College of Technology, KENYA ) Dr. Mazran bin Ismail (Universiti Sains Malaysia, MALAYSIA ) Dr. Salahaddin Yasin Baper (Salahaddin University - Hawler, IRAQ ) Dr. Foong Swee Yeok (Universiti Sains Malaysia, MALAYSIA)
2014 International Transaction Journal of Engineering, Management, & Applied Sciences & Technologies.
i
:: International Transaction Journal of Engineering, Management, & Applied Sciences & Technologies
Volume 5 Issue 1 (January, 2014) ISSN 2228-9860 http://TuEngr.com eISSN 1906-9642
FEATURE PEER-REVIEWED ARTICLES
Effects of Calcination Treatment of Diatomite on Dimethyl Ether
Synthesis from Methanol 01
Effect of Blend Ratio on Cure Characteristics, Mechanical Properties,
and Aging Resistance of Silica-filled ENR/SBR Blends 11
An Efficient Formulation of Off-line Model Predictive Control for
Nonlinear Systems Using Polyhedral Invariant Sets 25
Effect of Modeling Parameters on System Hydrodynamics of Air Reactor
in Chemical Looping Combustion Using CFD Simulation 39
Flow Behavior of Geldart A and Geldart C Particles in a Co-current
Downflow Circulating Fluidized Bed Reactor 57
Optimization of Enzymatic Clarification from Corncob 67
Synthesis of Alkali Metal/CaO Sorbent for CO2 Capture at Low
Temperature 77
2014 International Transaction Journal of Engineering, Management, & Applied Sciences & Technologies.
Contact & Offices: Associate Professor Dr. Ahmad Sanusi Hassan (Editor-in-Chief), School of Housing, Building and Planning, UNIVERSITI SAINS MALAYSIA, 11800 Minden, Penang, MALAYSIA. Tel: +60-4-653-2835 Fax: +60-4-657 6523, [email protected] Associate Professor Dr. Boonsap Witchayangkoon (Executive Editor), Faculty of Engineering, THAMMASAT UNIVERSITY, Klong-Luang, Pathumtani, 12120, THAILAND. Tel: +66-2-5643005 Ext 3101. Fax: +66-2-5643022 [email protected]
Postage Paid in Malaysia.
:: International Transaction Journal of Engineering, Management, & Applied Sciences & Technologies
http://TuEngr.com
Call-for-Papers:
ITJEMAST invites you to submit high quality papers for full peer-review and possible publication in areas pertaining to our scope including engineering, science, management and technology, especially interdisciplinary/cross-disciplinary/multidisciplinary subjects.
Next article continue on next page
International Transaction Journal of Engineering, Management, & Applied Sciences & Technologies
http://TuEngr.com
Effects of Calcination Treatment of Diatomite on Dimethyl Ether Synthesis from Methanol Watcharakorn Pranee a, Pornsawan Assawasaengrat b, Arthit Neramittagapong a, and Sutasinee Neramittagapong a*
a Department of Chemical Engineering, Faculty of Engineering, Khon Kaen University, Khon Kaen 40002, THAILAND b Department of Chemical Engineering, Faculty of Engineering, King Mongkut’s Institute of Technology Ladkrabang, Bangkok, 10520, THAILAND A R T I C L E I N F O
A B S T RA C T
Article history: Received 20 August 2013 Accepted 06 December 2013 Available online 09 December 2013 Keywords: DME; Renewable energy; Methanol; Acid catalyst.
The synthesis of dimethyl ether via methanol dehydration over diatomite catalysts was investigated. The reactions were carried out in a fixed bed reactor. The effects of calcinations of diatomite on its catalytic performance were studied. Diatomite calcined at 500°C (DM500) gave the higher BET surface than fresh diatomite (DM) due to the loss of ignition. The rate of reaction over DM500 catalyst was lower than fresh DM due to the loss of active sites on the catalyst surface. However, the decrease of basicity of DM500 surface showed the higher selectivity to DME than fresh DM. The DM500 catalyst exhibits better DME yield than fresh DM catalyst, although it can be used as a selective catalyst for DME synthesis from methanol.
2014 INT TRANS J ENG MANAG SCI TECH.
1. Introduction Dimethyl ether (DME) is one of the most promising energy resources because it has better
environmental performance and its properties are similar to traditional fuels (West, et al.,
2009). Especially, it also has a high cetane number about 55-60 which is significantly
alternated to the fossil fuel such as conventional diesel. In Thailand, it can be improved the
properties of natural gas by blending it up to 20% into LPG.
2014 International Transaction Journal of Engineering, Management, & Applied Sciences & Technologies.
*Corresponding author (S.Neramittagapong). Tel: +66-43-362240 E-mail: [email protected] 2014. International Transaction Journal of Engineering, Management, & Applied Sciences & Technologies. Volume 5 No.1 ISSN 2228-9860 eISSN 1906-9642. Online available at http://tuengr.com/V05/0001.pdf .
1
DME can be synthesized via direct synthesis from syngas and methanol dehydration. There
are many research focused on the methanol dehydration. There were various types of catalysts
such as NaH-ZSM-5 (Vishwanathan, et al., 2004), Au/ZnO/Lz-Y52 (Mpela, et al., 2007),
Al-modified Mordenite (Khandan, et al., 2008), and SAPO-11 (Dai, et al., 2011) which could
be used for methanol dehydration. It has been reported that there were many parameters
affected to DME yield from the methanol dehydration to DME such as the reaction
temperature, the methanol flow rate, the catalyst calcination temperature and the acidity of
catalysts. It has been concluded that the acid solid catalyst is the most active for catalyzing this
reaction; however, the moderate acidity of the surface has been showed the higher yield of
DME than the strong acidity catalyst. The zeolite has been selected to be the most active for this
reaction. It consists of two main elements which are silica and alumina (Jia, et al., 2008).
Their disadvantages bring about unstable catalysts and unexpected products. In this study, the
natural porous clay named diatomite has been used as the catalyst due to many acid sites over
skeletal form of its surface. Furthermore, it mainly consists of silica and alumina which are
similar to natural zeolite. In 2009, the researcher proposed the natural zeolite which was
calcined in the temperature range of 500 to 600°C (San, et al., 2009). From this investigation,
it has been found that the increasing of its surface area depends on the calcination temperatures.
Moreover, there are many types of zeolites, for example Zn/H-ZSM-5 (Yiwen, et al., 2010),
aluminophosphate and silico-aluminophosphate (Dai, et al., 2011), and SAPO-34 (Pop and
Theodorescu, 2000) which were calcined at the temperature range of 500 to 600°C.
The aim of this research is to study the way to use diatomite as a catalyst for DME
synthesis from methanol. It has been focused on the effects of the calcination method and the
reaction temperature to the DME yield.
2. Experimental
2.1 Catalysts Preparation Diatomite was collected from the northern area of Chiangmai Province in Thailand.
Diatomite was dried in the oven at 80°C for 24 h, and then it was ground with ball mill and
sieved using a 180-mm screen. Afterwards, it was calcined in th oven under air atmosphere at
500°C. The calcined diatomite was labeled as DM500 and diatomite without calcination was
called fresh DM.
2 Watcharakorn Pranee, Pornsawan Assawasaengrat, Arthit Neramittagapong, & Sutasinee Neramittagapong
2.2 Catalyst Characterization Diatomite microstructure and crystal morphology analysis were determined by scanning
electron microscope LEO 1455VP. Thermal gravimetric analysis (TGA) was set to analyze
the weight loss of catalysts. Catalysts were placed in alumina cell and heated with the
temperature-raising rate of 10°C/min starting from the room temperature to 100°C under
nitrogen flow and then the temperature was held at 100°C for 10 minutes. After that, the
temperature was increased from 100 to 700 °C with raising rate of 10°C/min under air flow.
The signal of TGA was detected by TGA-50H SHIMADZU. X-ray fluorescence analysis
(XRF) was used to determine the chemical composition and loss of ignition (LOI) of catalysts
to methanol dehydration to dimethyl ether with the parameters to supply in the measurement as
50 kV and 60 mA with rhodium X-ray source to analyze of SRS 340. The catalyst was
measured the Brunauer-Emmett-Teller (BET) specific surface area by Microelectronics
ASAP2010 physical adsorption apparatus in the condition for N2 adsorption at -196°C. The
X-ray diffraction (XRD) patterns were investigated by Miniflex goniometer fitted with using
Ni-filtered CuKα radiation and 2θ continuous-scanning mode and electrical parameters were
operated at 30 kV and 15 mA. The acidity of catalysts were measured by the
temperature-programmed desorption of ammonia (NH3-TPD) conducted on BEL JAPAN
model BELCAT-B with a thermal conductivity detector (TCD), in the prior experiment, 0.05 g
of catalyst was tested under 5% NH3 and the flow rate of carrier-gas helium at 30 ml/min from
100 to 950°C. And then the basicity of catalysts was measured by the
temperature-programmed desorption of carbondioxide (CO2-TPD) conducted on BEL JAPAN
model BELCAT-B with a thermal conductivity detector (TCD), during adsorption and
desorption, 0.05 g of catalyst was tested under CO2 with the flow rate of carrier-gas helium at
ml/min from 100 to 800°C.
2.3 Methanol Dehydration During the methanol dehydration, 0.5 g of activated catalysts (fresh DM and DM500) was
loaded into the fixed-bed quartz reactor while methanol was pumped through a syringe
peristaltic pump at 0.5 ml/min. The gas condition of MeOH:N2 was 1:4 (with N2 flow of 60
ml/min at the atmospheric pressure). The feed was flowed through a peristalsis pump system
and changed into the gas state before it was passed through the fixed-bed reactor system using
nitrogen gas flow as a carrier gas shown in Figure 1. All products of methanol dehydration
*Corresponding author (S.Neramittagapong). Tel: +66-43-362240 E-mail: [email protected] 2014. International Transaction Journal of Engineering, Management, & Applied Sciences & Technologies. Volume 5 No.1 ISSN 2228-9860 eISSN 1906-9642. Online available at http://tuengr.com/V05/0001.pdf .
3
were directly analyzed by on-line gas chromatography with FID and TCD detectors, whereas
Porapak T and Molecular Sieve 13X (Shimadzu, GC-14B and Shimadzu, C-R4A) were
equipped in these columns. The range of reaction temperature was set between the
temperatures of 250°C to 350°C in order to catalyze the reaction.
Figure 1: Schematic view of methanol dehydration to dimethyl ether set-up
3. Results and Discussion
Table 1: The physical properties of DM and DM500 catalysts
Catalyst Composition (% wt) Si/Al
SBET (m2/g) SiO2 Al2O3 Fe2O3 Other LOI
Fresh DM 80 9.6 2.5 1.8 6.14 8.3 25 DM500 82 10 4.2 2.5 0.72 8.1 37
Denote: LOI is loss of ignition and SBET is BET surface area
3.1 The effects of calcination treatment on the physical
The physical properties of catalysts are summarized in Table 1, the results of chemical
composition of fresh DM and DM500 by XRF shown that the calcined temperature could not
influence the chemical composition for metal compound and their surface areas, but it could
only decrease the organic compounds (as LOI composition in XRF data) in their compositions.
The fresh DM consisted of the organic compounds about 6.14% while the DM500 had only
about 0.72%. The LOI from XRF data of DM500 was followed by TGA data in Figure 2,
which there was no weight loss, while weight loss about 17% was present in fresh DM. The
Peristalsis pump Evaporator
Pressure
transmitter
GC-
FID
GC-
TCD
Mass flow
controller
Temperature controller
Fixed-bed reactor
He
H2
N2
Trapped
gas product
vent
Mass flow
controller
Mass flow
controller
4 Watcharakorn Pranee, Pornsawan Assawasaengrat, Arthit Neramittagapong, & Sutasinee Neramittagapong
BET surface area of fresh DM was increased from 25 to 37 m2/g (about 50% of enhancement as
compared with fresh DM) by calcined temperature treatment at 500°C. On the other hands,
there was no effect on silica alumina ratio (8.1-8.3).
Figure 2: TGA data of fresh DM and DM500
According to the research data of San, et al., (San, et al., 2009) for characterizing
composition and phases in Turkey diatomite, the XRD pattern is presented in all phases (quartz,
albite, tridymite, orthoclase, microcline, aluminium silicate and magnesium silicate) which are
similar to Chiangmai diatomite for this research. In amorphous phase of both catalysts;
aluminium silicate, magnesium silicate and microcline are the main phases in this skeletal form.
However, a significant crystalline phase is silica in the great majority of composition of quartz
phase as shown in Figure 5. The phases of these catalysts were not changed in order to
increase the calcinations temperature to 500°C.
Figure 3: XRD patterns of fresh DM and DM500: A = Aluminium silicate, M = Magnesium
silicate, Mi = Microline, O = Orthoclase, Q = Quartz and T = Tridymite
In the process of calcinations treatment at 500°C, there was no effect on morphology of
84
88
92
96
100
0 200 400 600
Wei
ght l
oss o
f cat
alys
t (%
)
Temperature (°C)
Q
5 20 35 50 65 80
Inte
nsity
(a.u
.)
2θ
Fresh DM
DM500
A
Fresh DM
DM500 Q
Q A
A
T
T
A
M
M
Mi
Mi
O
O
*Corresponding author (S.Neramittagapong). Tel: +66-43-362240 E-mail: [email protected] 2014. International Transaction Journal of Engineering, Management, & Applied Sciences & Technologies. Volume 5 No.1 ISSN 2228-9860 eISSN 1906-9642. Online available at http://tuengr.com/V05/0001.pdf .
5
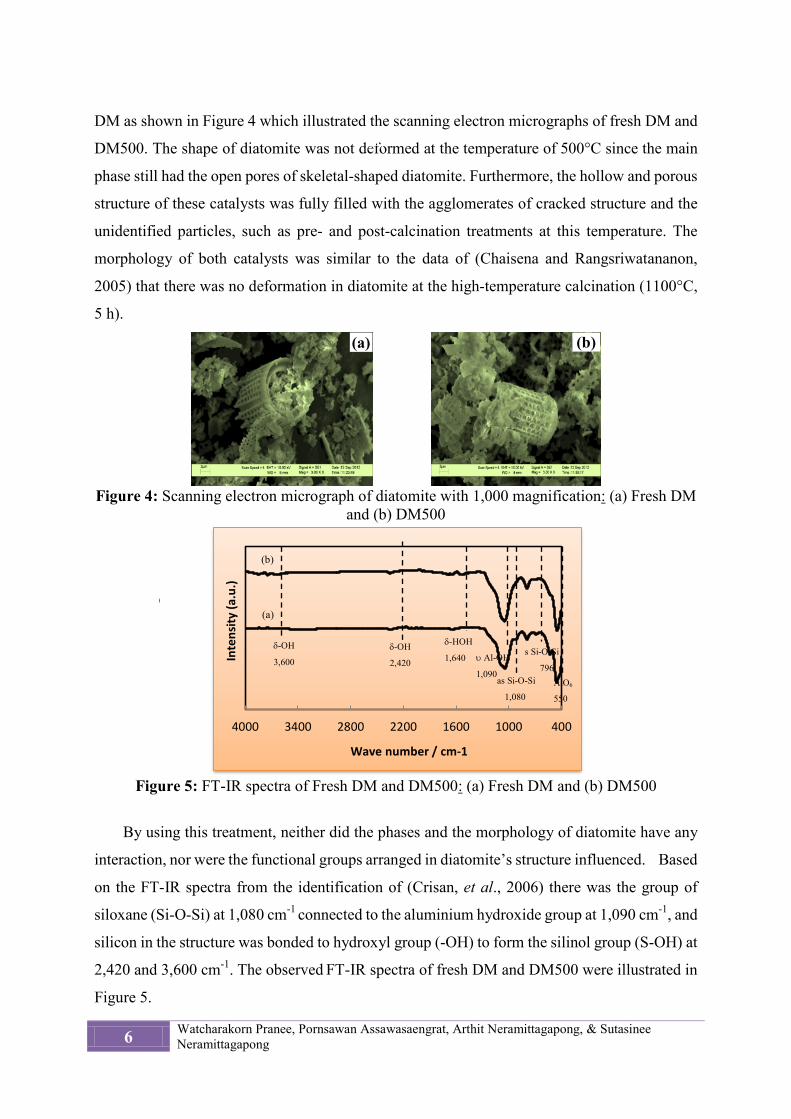
DM as shown in Figure 4 which illustrated the scanning electron micrographs of fresh DM and
DM500. The shape of diatomite was not deformed at the temperature of 500°C since the main
phase still had the open pores of skeletal-shaped diatomite. Furthermore, the hollow and porous
structure of these catalysts was fully filled with the agglomerates of cracked structure and the
unidentified particles, such as pre- and post-calcination treatments at this temperature. The
morphology of both catalysts was similar to the data of (Chaisena and Rangsriwatananon,
2005) that there was no deformation in diatomite at the high-temperature calcination (1100°C,
5 h).
Figure 4: Scanning electron micrograph of diatomite with 1,000 magnification: (a) Fresh DM
and (b) DM500
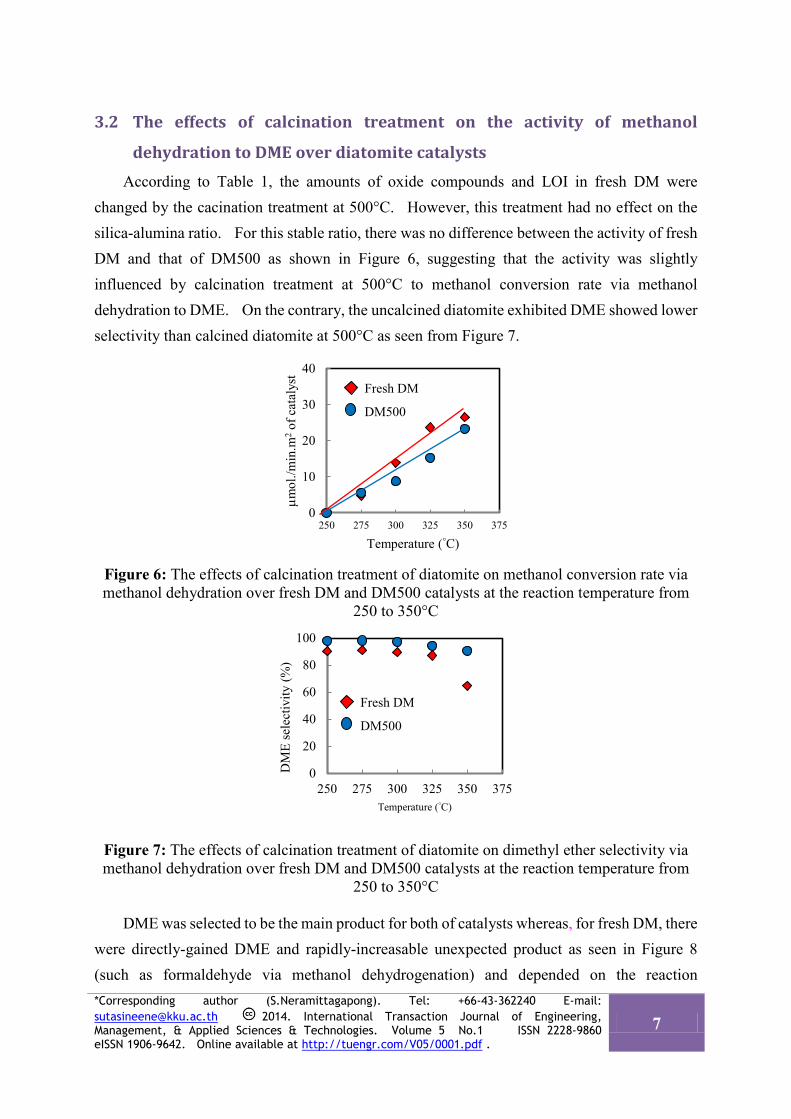
Figure 5: FT-IR spectra of Fresh DM and DM500: (a) Fresh DM and (b) DM500
By using this treatment, neither did the phases and the morphology of diatomite have any
interaction, nor were the functional groups arranged in diatomite’s structure influenced. Based
on the FT-IR spectra from the identification of (Crisan, et al., 2006) there was the group of
siloxane (Si-O-Si) at 1,080 cm-1 connected to the aluminium hydroxide group at 1,090 cm-1, and
silicon in the structure was bonded to hydroxyl group (-OH) to form the silinol group (S-OH) at
2,420 and 3,600 cm-1. The observed FT-IR spectra of fresh DM and DM500 were illustrated in
Figure 5.
400100016002200280034004000
Inte
nsity
(a.u
.)
Wave number / cm-1
(
δ-OH
2,420 υ Al-OH
1,090 as Si-O-Si
1,080
s Si-O-Si
796 AlO6
550
δ-OH
3,600
δ-HOH
1,640
(a)
(b)
(a)
(b) (a)
6 Watcharakorn Pranee, Pornsawan Assawasaengrat, Arthit Neramittagapong, & Sutasinee Neramittagapong
3.2 The effects of calcination treatment on the activity of methanol
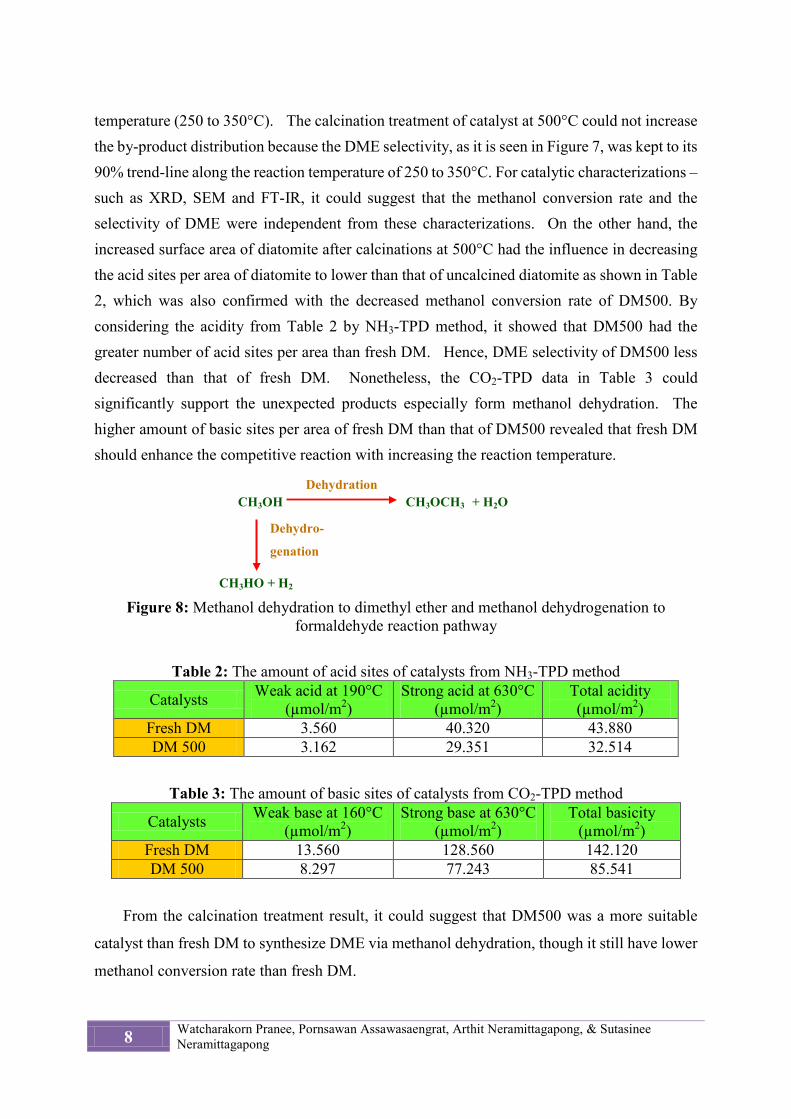
dehydration to DME over diatomite catalysts According to Table 1, the amounts of oxide compounds and LOI in fresh DM were
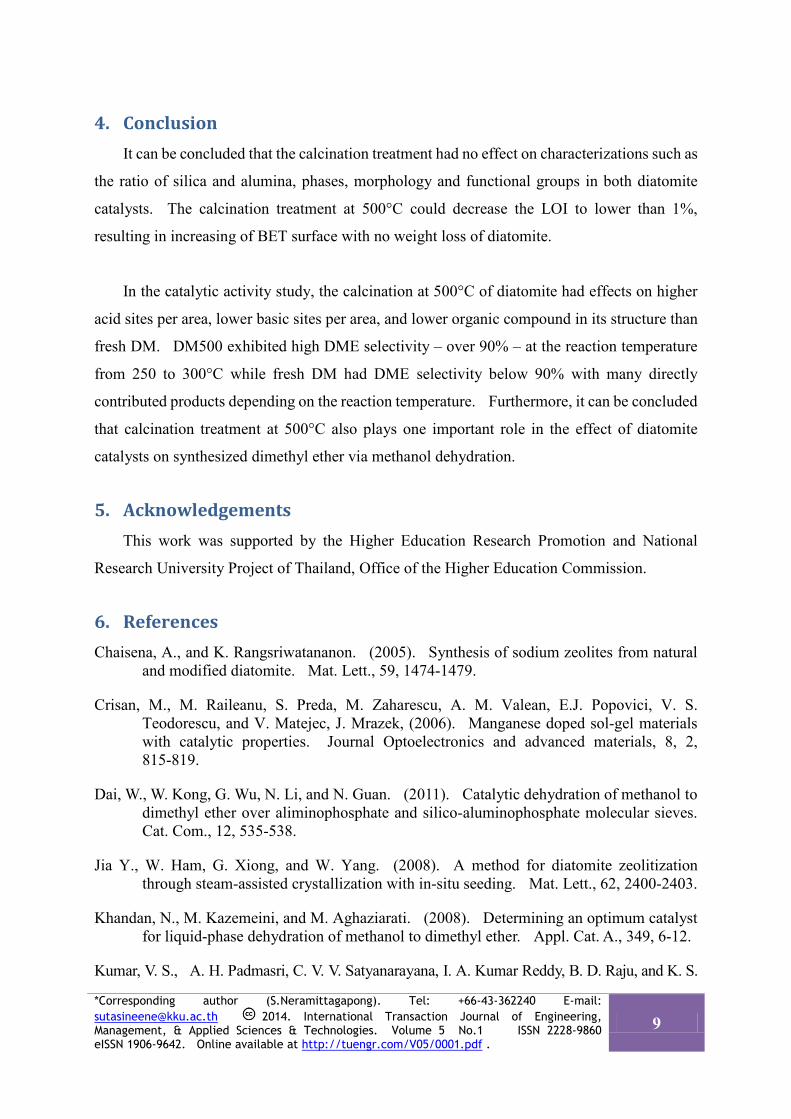
changed by the cacination treatment at 500°C. However, this treatment had no effect on the silica-alumina ratio. For this stable ratio, there was no difference between the activity of fresh DM and that of DM500 as shown in Figure 6, suggesting that the activity was slightly influenced by calcination treatment at 500°C to methanol conversion rate via methanol dehydration to DME. On the contrary, the uncalcined diatomite exhibited DME showed lower selectivity than calcined diatomite at 500°C as seen from Figure 7.
Figure 6: The effects of calcination treatment of diatomite on methanol conversion rate via methanol dehydration over fresh DM and DM500 catalysts at the reaction temperature from
250 to 350°C
Figure 7: The effects of calcination treatment of diatomite on dimethyl ether selectivity via methanol dehydration over fresh DM and DM500 catalysts at the reaction temperature from
250 to 350°C
DME was selected to be the main product for both of catalysts whereas, for fresh DM, there were directly-gained DME and rapidly-increasable unexpected product as seen in Figure 8 (such as formaldehyde via methanol dehydrogenation) and depended on the reaction
0
10
20
30
40
250 275 300 325 350 375
µmol
./min
.m2
of c
atal
yst
Temperature (°C)
0
20
40
60
80
100
250 275 300 325 350 375
DM
E se
lect
ivity
(%)
Temperature (°C)
Fresh DM
DM500
Fresh DM
DM500
*Corresponding author (S.Neramittagapong). Tel: +66-43-362240 E-mail: [email protected] 2014. International Transaction Journal of Engineering, Management, & Applied Sciences & Technologies. Volume 5 No.1 ISSN 2228-9860 eISSN 1906-9642. Online available at http://tuengr.com/V05/0001.pdf .
7
temperature (250 to 350°C). The calcination treatment of catalyst at 500°C could not increase the by-product distribution because the DME selectivity, as it is seen in Figure 7, was kept to its 90% trend-line along the reaction temperature of 250 to 350°C. For catalytic characterizations – such as XRD, SEM and FT-IR, it could suggest that the methanol conversion rate and the selectivity of DME were independent from these characterizations. On the other hand, the increased surface area of diatomite after calcinations at 500°C had the influence in decreasing the acid sites per area of diatomite to lower than that of uncalcined diatomite as shown in Table 2, which was also confirmed with the decreased methanol conversion rate of DM500. By considering the acidity from Table 2 by NH3-TPD method, it showed that DM500 had the greater number of acid sites per area than fresh DM. Hence, DME selectivity of DM500 less decreased than that of fresh DM. Nonetheless, the CO2-TPD data in Table 3 could significantly support the unexpected products especially form methanol dehydration. The higher amount of basic sites per area of fresh DM than that of DM500 revealed that fresh DM should enhance the competitive reaction with increasing the reaction temperature.
CH3OH CH3OCH3 + H2O
CH3HO + H2
Figure 8: Methanol dehydration to dimethyl ether and methanol dehydrogenation to formaldehyde reaction pathway
Table 2: The amount of acid sites of catalysts from NH3-TPD method
Catalysts Weak acid at 190°C (µmol/m2)
Strong acid at 630°C (µmol/m2)
Total acidity (µmol/m2)
Fresh DM 3.560 40.320 43.880 DM 500 3.162 29.351 32.514
Table 3: The amount of basic sites of catalysts from CO2-TPD method
Catalysts Weak base at 160°C (µmol/m2)
Strong base at 630°C (µmol/m2)
Total basicity (µmol/m2)
Fresh DM 13.560 128.560 142.120 DM 500 8.297 77.243 85.541
From the calcination treatment result, it could suggest that DM500 was a more suitable
catalyst than fresh DM to synthesize DME via methanol dehydration, though it still have lower
methanol conversion rate than fresh DM.
Dehydro-
genation
Dehydration
8 Watcharakorn Pranee, Pornsawan Assawasaengrat, Arthit Neramittagapong, & Sutasinee Neramittagapong
4. Conclusion It can be concluded that the calcination treatment had no effect on characterizations such as
the ratio of silica and alumina, phases, morphology and functional groups in both diatomite
catalysts. The calcination treatment at 500°C could decrease the LOI to lower than 1%,
resulting in increasing of BET surface with no weight loss of diatomite.
In the catalytic activity study, the calcination at 500°C of diatomite had effects on higher
acid sites per area, lower basic sites per area, and lower organic compound in its structure than
fresh DM. DM500 exhibited high DME selectivity – over 90% – at the reaction temperature
from 250 to 300°C while fresh DM had DME selectivity below 90% with many directly
contributed products depending on the reaction temperature. Furthermore, it can be concluded
that calcination treatment at 500°C also plays one important role in the effect of diatomite
catalysts on synthesized dimethyl ether via methanol dehydration.
5. Acknowledgements This work was supported by the Higher Education Research Promotion and National
Research University Project of Thailand, Office of the Higher Education Commission.
6. References Chaisena, A., and K. Rangsriwatananon. (2005). Synthesis of sodium zeolites from natural
and modified diatomite. Mat. Lett., 59, 1474-1479.
Crisan, M., M. Raileanu, S. Preda, M. Zaharescu, A. M. Valean, E.J. Popovici, V. S. Teodorescu, and V. Matejec, J. Mrazek, (2006). Manganese doped sol-gel materials with catalytic properties. Journal Optoelectronics and advanced materials, 8, 2, 815-819.
Dai, W., W. Kong, G. Wu, N. Li, and N. Guan. (2011). Catalytic dehydration of methanol to dimethyl ether over aliminophosphate and silico-aluminophosphate molecular sieves. Cat. Com., 12, 535-538.
Jia Y., W. Ham, G. Xiong, and W. Yang. (2008). A method for diatomite zeolitization through steam-assisted crystallization with in-situ seeding. Mat. Lett., 62, 2400-2403.
Khandan, N., M. Kazemeini, and M. Aghaziarati. (2008). Determining an optimum catalyst for liquid-phase dehydration of methanol to dimethyl ether. Appl. Cat. A., 349, 6-12.
Kumar, V. S., A. H. Padmasri, C. V. V. Satyanarayana, I. A. Kumar Reddy, B. D. Raju, and K. S.
*Corresponding author (S.Neramittagapong). Tel: +66-43-362240 E-mail: [email protected] 2014. International Transaction Journal of Engineering, Management, & Applied Sciences & Technologies. Volume 5 No.1 ISSN 2228-9860 eISSN 1906-9642. Online available at http://tuengr.com/V05/0001.pdf .
9
Rama Rao. (2006). Nature and mode of addition of phosphate precursor in the synthesis of aluminium phosphate and its influence on methanol dehydration to dimethyl ether. Cat. Com., 7, 745-751.
Mpela, A., D. Hildebrandt, D. Glasser, M. S. Scurrell, and G. J. Hutchings. (2007). Low-pressure Methanol/Dimethyether Synthesis from Syngas on Gold-based Catalysts. Gold Bulletin., 40, 3, 219-224.
Pop, G. and C. Theodorescu. (2000). SAPO-34 Catalyst For Dimethylether Production. Surf. Sci. and Catal., 287-292.
San, O., R. Goren, and C. Ozgur. (2009). Purification of diatomite powder by acid leaching for use in fabrication of porous ceramics. Int. J. Miner. Process., 93, 6-10.
West, R. M., D. J. Braden and J. A. Dumesic. (2009). Dehydration of butane over solid acid catalysts in high water environments. J. Cat., 262, 134-143.
Yiwen, F., T. Ji, H. Xiaochang, S. Weibin, S. Yibing, and S. Changyong, Chin. (2010). Aromatization of Dimethyl Ether over Zn/H-ZSM-5 Catalyst. J. Catal., 31(2), 264-266.
Watcharakorn Pranee is a Ph.D. student in Chemical Engineering Department at Khon Kaen University. He received his B.Sc. from King Mongkut’s Institute of Technology Ladkrabang in 2004. He earned his M.Eng. study from King Mongkut’s Institute of Technology Ladkrabang in 2007. His current interests involve applications of catalysis to engineering.
Dr.Pornsawan Assawasaengrat earned her D.Eng. in Chemical Engineering from Chulalongkorn University in 2002. She holds a second class honors degree of bachelor in Chemical Engineering from Chulalongkorn University. She is currently Head of Chemical Engineering Department at King Mongkut’s Institute of Technology Ladkrabang. She works in the area of chemical engineering, with emphasis on chemical reaction engineering and advanced materials. She focuses on the synthesis of adsorbents, adsorption, and separation.
Dr.Arthit Neramittagapong is an Assistant Professor in the Chemical Engineering Department at Khon Kaen University. He holds a B.Eng. in Chemical Engineering from Khon Kean University, M. Eng. in Chemical Engineering from Chulalongkorn University and D.Eng. in Environmental Chemistry and Engineering from Tokyo Institute of Technology. He has been working on the environmental catalysis, design of industrial catalysts, chemical reaction engineering, and hazardous waste treatment and pollution control.
Dr.Sutasinee Neramittagapong is an Assistant Professor in the Chemical Engineering Department at Khon Kaen University. She holds a B.Eng. in Chemical Engineering from Khon Kean University, M. Eng. in Chemical Engineering from Chulalongkorn University and D.Eng. in Environmental Chemistry and Engineering from Tokyo Institute of Technology. Her research works have been focused on the environmental catalysis, renewable energy, green productivity, synthesis of high value-added compounds from industrial or agriculture wastes, and hazardous waste treatment and pollution control.
Peer Review: This article has been internationally peer-reviewed and accepted for publication according to the guidelines in the journal’s website. Note: Original version of this article was accepted and presented at the Third International-Thai Chemical Engineering and Applied Chemistry (TIChE) Conference, jointly organized by Department of Chemical Engineering, Faculty of Engineering, Khon Kaen University and Thai Institute of Chemical Engineering and Applied Chemistry, at Pullman Khon Kaen Raja Orchid Hotel, Khon Kaen, THAILAND, October 17-18, 2013.
10 Watcharakorn Pranee, Pornsawan Assawasaengrat, Arthit Neramittagapong, & Sutasinee Neramittagapong
International Transaction Journal of Engineering, Management, & Applied Sciences & Technologies
http://TuEngr.com
Effect of Blend Ratio on Cure Characteristics, Mechanical Properties, and Aging Resistance of Silica-filled ENR/SBR Blends
Chanin Ngudsuntear a, Sunun Limtrakul a, Terdthai Vatanatham a, Adul Na Wichien b Garry L. Rempel c, and Wanvimon Arayapranee d*
a Department of Chemical Engineering, Kasetsart University, Bangkok, THAILAND b Rubber Research Institute of Thailand, Ministry of Agriculture, Chatuchak, Bangkok, THAILAND c Department of Chemical Engineering, University of Waterloo, Ontario, CANADA d Department of Chemical and Material Engineering, Rangsit University, Phathum Thani, THAILAND A R T I C L E I N F O
A B S T RA C T
Article history: Received 20 August 2013 Accepted 06 December 2013 Available online 09 December 2013 Keywords: Epoxidized natural rubber; Tensile properties; Oil resistance.
The effects of blend ratio on cure characteristics, tensile properties and the resistance to oil and thermal aging of epoxidized natural rubber (ENR) blended with styrene butadiene rubber (SBR) was investigated in the presence of silica selected as a reinforcing filler due to its unique characteristic to interact with ENR. The composition of ENR and SBR was varied from 0 to 100%. The results indicate that the Mooney viscosity and cure time, tc90 decreased with an increase of ENR in the blends. The silica-filled ENR exhibited higher tensile properties and high crosslink density compared to silica-filled SBR. The oil and thermal aging resistance of the ENR/SBR blend were increased with increasing ENR content.
2014 INT TRANS J ENG MANAG SCI TECH.
1. Introduction The blending of two or more polymers by physical or chemical means may improve a
variety of physical and chemical properties of the constituent polymers (Jovanovic et al.,
2013). The blending of rubbers plays an important role in enhancing the physical properties of
2014 International Transaction Journal of Engineering, Management, & Applied Sciences & Technologies.
*Corresponding author (W. Arayapranee). Tel: +66-2-997-2222 Ext.3330. E-mail address: [email protected] 2014. International Transaction Journal of Engineering, Management, & Applied Sciences & Technologies. Volume 5 No.1 ISSN 2228-9860 eISSN 1906-9642. Online available at http://tuengr.com/V05/0011.pdf .
11
the final vulcanized product. The rubber blends are frequently used in the rubber industry to
obtain the best combination of compound properties, processability, and cost. Natural rubber
(NR) is a renewable and sustainable material, which has various good properties, such as high
tensile strength, high elongation, and outstanding resilience, lending itself to be used in
various applications. NR is an unsaturated polymer that consists of mainly of cis-1,4-
polyisoprene. It nevertheless has some drawbacks such as poor oil resistance due to its
nonpolar nature; high sensitivity to heat, oxygen, and ozone due to its reactive double bonds.
A variety of synthetic counterparts are made to meet some specific requirements such as for
high temperature applications or for oil-in contact products. To extend the use of NR, a
variety of modification methods can be used to partly or completely alter the NR structure to
enhance its properties to meet some specific requirements. The modification of NR via
epoxidation reaction is probably the most common method used to prepare a product that has
some improved properties than those of the unmodified one. Epoxidation of NR is the
reaction of the carbon double bond with an active oxygen atom to yield a three membered
ring structure containing oxygen. Reduction of the unsaturated unit or converting part of the
carbon double bond of NR would improve its oil resistances and oxidative properties.
Epoxidized natural rubber (ENR) containing 50% mole epoxidation (ENR50) has similar oil
resistance to medium nitrile rubber and has properties which resemble those of synthetic
rubbers, whereas the tensile properties are near those of NR because the ENR50 still has some
remaining carbon double bonds but suffers from poor ozone resistance and heat aging
properties (Chuayjuljit et al., 2006; Ismail et al., 2000). SBR, nonpolar synthetic rubber,
describes families of synthetic rubbers derived from styrene and butadiene. It has good
abrasion resistance and thermal aging properties (Goyanes et al., 2008). The ENR/SBR blend
should be beneficial for improved thermal and oxidative stability.
The main aim of this work was to study the effect of blend ratio on cure characteristics,
mechanical properties, and aging resistance of silica-filled ENR/SBR rubber blends over a
range of blend ratios. The aging property studies are of interest for thermal aging at 100°C for
72 h and two types of oil, namely low polarity oil and high polarity oil at room temperature
for 72 h.
12 Chanin Ngudsuntear, Sunun Limtrakul, Terdthai Vatanatham, Adul Na Wichien, Garry L. Rempel, and Wanvimon Arayapranee
2. Research Methodology
2.1 Materials High ammonia natural rubber latex (dry rubber content, DRC = 60%) was purchased
from Thai Hua Rubber PCL., Rayong, Thailand. The latex is composed almost entirely of cis-
1,4-polyisoprene. 98% formic acid was produced by Merck. 50% hydrogen peroxide
(commercial grade), Teric 16A16, Methanol, and Sodium carbonate were purchased from
GSP products Co., LTD., Thailand. Styrene butadiene rubber (SBR-1502) rubber was
produced by BST Elastomers co., Ltd., Rayong, Thailand. Zinc Oxide (white seal) was
purchased from Thai lysaght Co., Ltd., Thailand. Silica (TOKUSIL 233) was produced by
Tokuyama Asia Pacific Pte., Ltd., Singapore. Benzothiazy l-2-cyclohexylsulfenamide (CBS,
Monflex) was produced by MONFLEX PTE., Ltd., Singapore. Polyethylene glycol (PEG-
4000) was purchased from Imperial industrial chemicals Co., Ltd., Thailand. Tetramethyl
thiumram disulfide (TMTD) was purchased from Vessel Chemical Co., Ltd., Thailand.
Wingstay-L and sulphur were purchased from GSP products Co., LTD., Thailand.
2.2 Preparation of in-situ epoxidized natural rubber The formulation of ENR is shown in Table 1 Initially, ENR was prepared from dilute
natural rubber latex (60% to 20% DRC with distilled water), 10% Teric16A16, as nonionic
surfactant, was added to a 1 liter three-necked flask reactor, in which a controlled speed stirrer
was mounted. The latex was stirred for 1 h, before a given amount of formic acid and
hydrogen peroxide were slowly dropped into the reactor respectively using a peristaltic pump
for a controlled addition rate. The latex was continuous stirred at 300 rpm for 6 h. A water
bath was used to maintain the temperature at 50ºC. After the reaction, the ENR latex was
coagulated by ethanol and the coagulum was washed repeatedly and dried thoroughly. 1H-
NMR spectra were recorded on a Bruker 300 MHz spectrometer and the conversion was
determined as mol % epoxide by calculation using equation (1)
mol % epoxide = 2.7
2.7 5.1
100%×+
II I
2.7
2.7 5.1
100%II I
×+
(1),
where I is the intensity of the 1H-NMR signals and the subscripts represent a value of the
chemical shift.
*Corresponding author (W. Arayapranee). Tel: +66-2-997-2222 Ext.3330. E-mail address: [email protected] 2014. International Transaction Journal of Engineering, Management, & Applied Sciences & Technologies. Volume 5 No.1 ISSN 2228-9860 eISSN 1906-9642. Online available at http://tuengr.com/V05/0011.pdf .
13
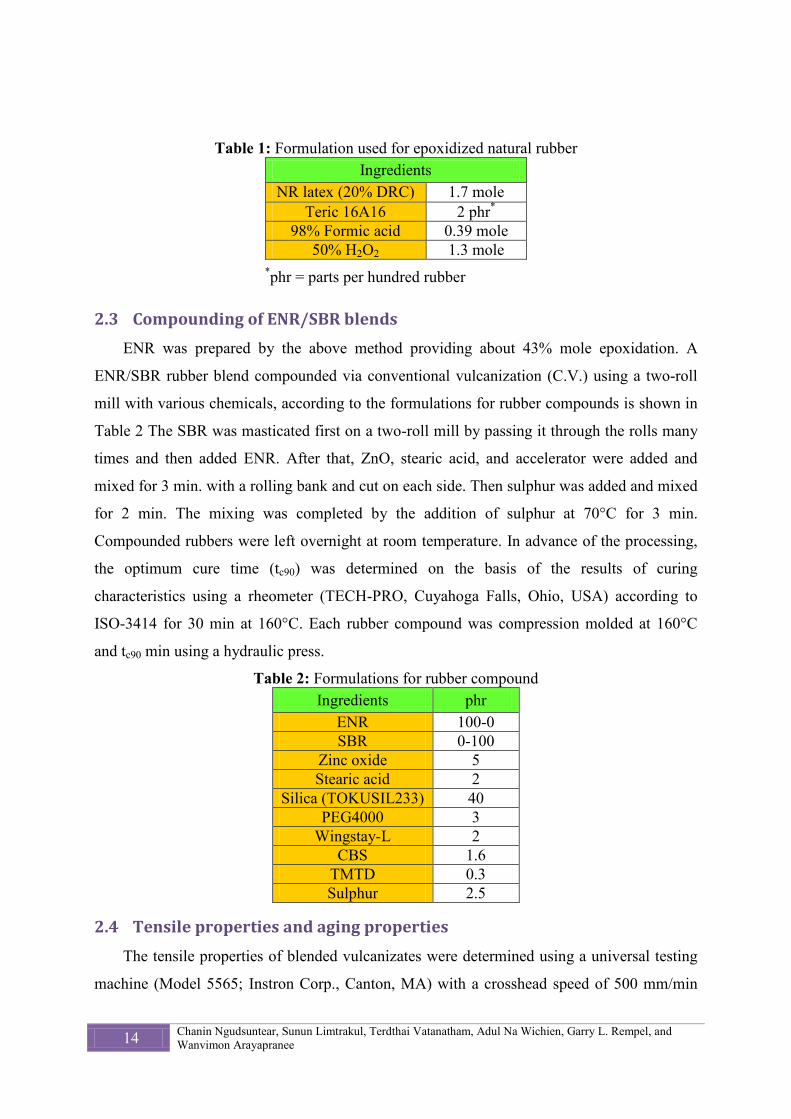
Table 1: Formulation used for epoxidized natural rubber Ingredients
NR latex (20% DRC) 1.7 mole Teric 16A16 2 phr*
98% Formic acid 0.39 mole 50% H2O2 1.3 mole
*phr = parts per hundred rubber
2.3 Compounding of ENR/SBR blends ENR was prepared by the above method providing about 43% mole epoxidation. A
ENR/SBR rubber blend compounded via conventional vulcanization (C.V.) using a two-roll
mill with various chemicals, according to the formulations for rubber compounds is shown in
Table 2 The SBR was masticated first on a two-roll mill by passing it through the rolls many
times and then added ENR. After that, ZnO, stearic acid, and accelerator were added and
mixed for 3 min. with a rolling bank and cut on each side. Then sulphur was added and mixed
for 2 min. The mixing was completed by the addition of sulphur at 70°C for 3 min.
Compounded rubbers were left overnight at room temperature. In advance of the processing,
the optimum cure time (tc90) was determined on the basis of the results of curing
characteristics using a rheometer (TECH-PRO, Cuyahoga Falls, Ohio, USA) according to
ISO-3414 for 30 min at 160°C. Each rubber compound was compression molded at 160°C
and tc90 min using a hydraulic press.
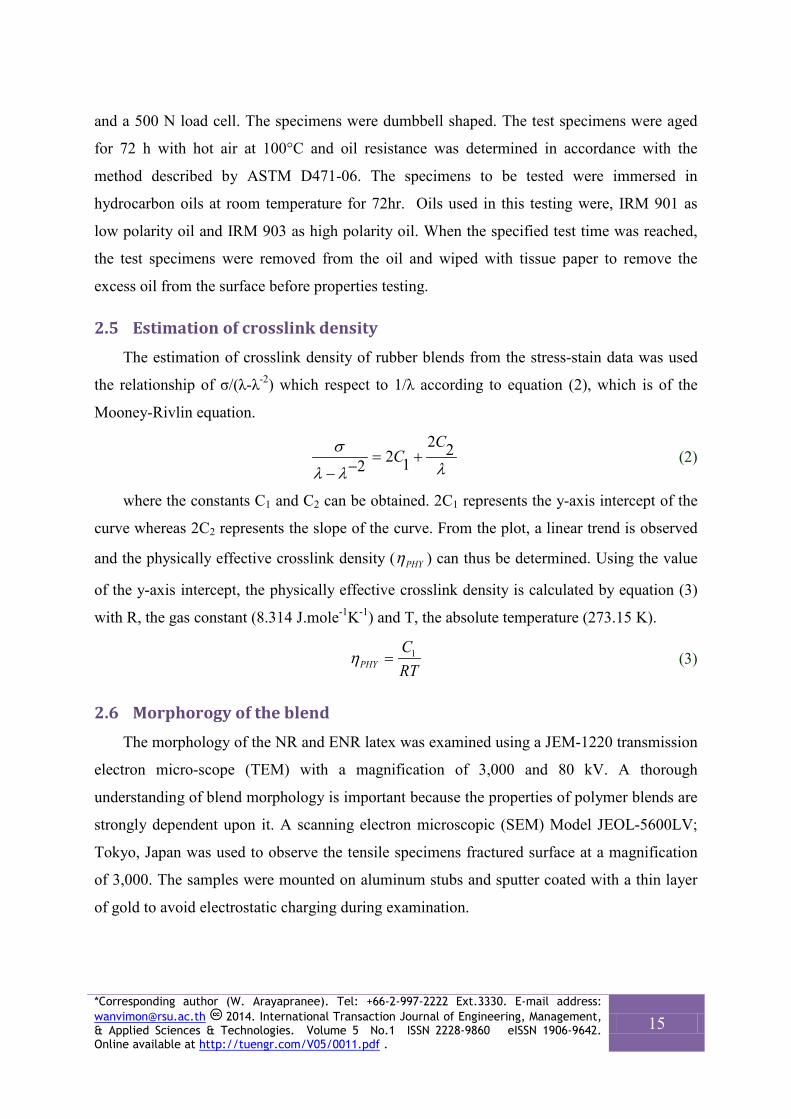
Table 2: Formulations for rubber compound Ingredients phr
ENR 100-0 SBR 0-100
Zinc oxide 5 Stearic acid 2
Silica (TOKUSIL233) 40 PEG4000 3
Wingstay-L 2 CBS 1.6
TMTD 0.3 Sulphur 2.5
2.4 Tensile properties and aging properties The tensile properties of blended vulcanizates were determined using a universal testing
machine (Model 5565; Instron Corp., Canton, MA) with a crosshead speed of 500 mm/min
14 Chanin Ngudsuntear, Sunun Limtrakul, Terdthai Vatanatham, Adul Na Wichien, Garry L. Rempel, and Wanvimon Arayapranee
and a 500 N load cell. The specimens were dumbbell shaped. The test specimens were aged
for 72 h with hot air at 100°C and oil resistance was determined in accordance with the
method described by ASTM D471-06. The specimens to be tested were immersed in
hydrocarbon oils at room temperature for 72hr. Oils used in this testing were, IRM 901 as
low polarity oil and IRM 903 as high polarity oil. When the specified test time was reached,
the test specimens were removed from the oil and wiped with tissue paper to remove the
excess oil from the surface before properties testing.
2.5 Estimation of crosslink density The estimation of crosslink density of rubber blends from the stress-stain data was used
the relationship of σ/(λ-λ-2) which respect to 1/λ according to equation (2), which is of the
Mooney-Rivlin equation.
2 22 12 = +−−
CCσ
λλ λ (2)
where the constants C1 and C2 can be obtained. 2C1 represents the y-axis intercept of the
curve whereas 2C2 represents the slope of the curve. From the plot, a linear trend is observed
and the physically effective crosslink density ( PHYη ) can thus be determined. Using the value
of the y-axis intercept, the physically effective crosslink density is calculated by equation (3)
with R, the gas constant (8.314 J.mole-1K-1) and T, the absolute temperature (273.15 K).
1=PHYCRT
η (3)
2.6 Morphorogy of the blend The morphology of the NR and ENR latex was examined using a JEM-1220 transmission
electron micro-scope (TEM) with a magnification of 3,000 and 80 kV. A thorough
understanding of blend morphology is important because the properties of polymer blends are
strongly dependent upon it. A scanning electron microscopic (SEM) Model JEOL-5600LV;
Tokyo, Japan was used to observe the tensile specimens fractured surface at a magnification
of 3,000. The samples were mounted on aluminum stubs and sputter coated with a thin layer
of gold to avoid electrostatic charging during examination.
*Corresponding author (W. Arayapranee). Tel: +66-2-997-2222 Ext.3330. E-mail address: [email protected] 2014. International Transaction Journal of Engineering, Management, & Applied Sciences & Technologies. Volume 5 No.1 ISSN 2228-9860 eISSN 1906-9642. Online available at http://tuengr.com/V05/0011.pdf .
15
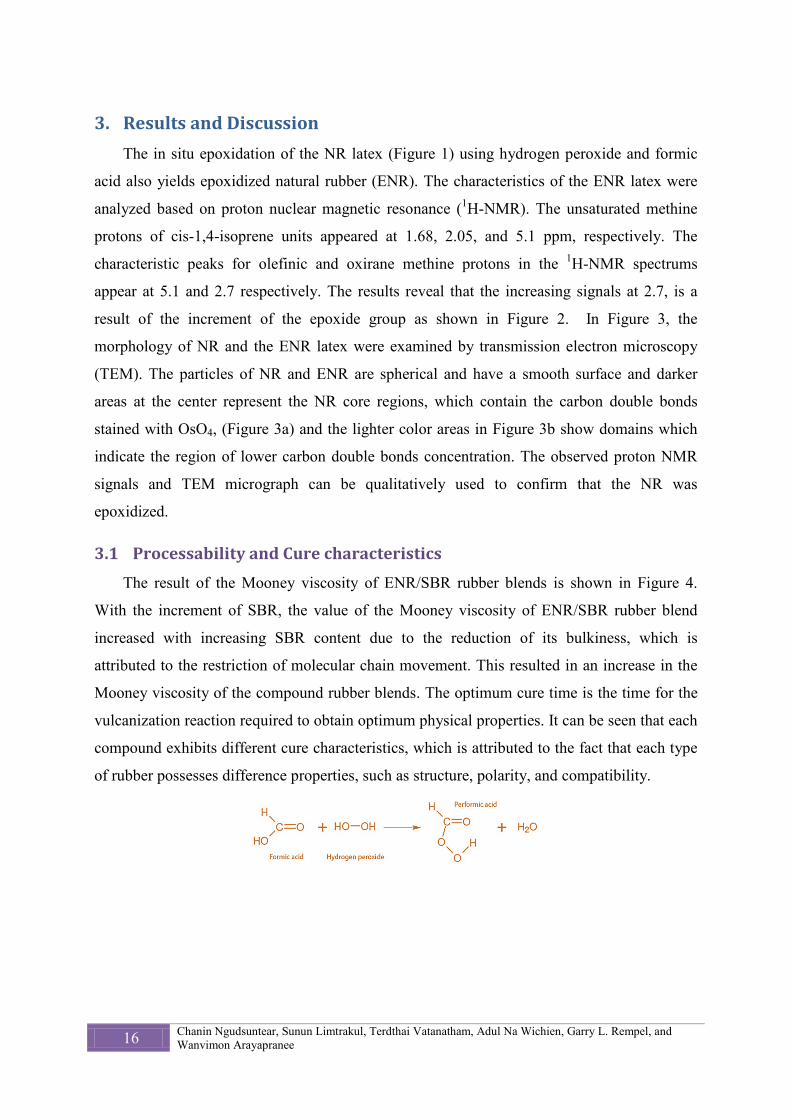
3. Results and Discussion The in situ epoxidation of the NR latex (Figure 1) using hydrogen peroxide and formic
acid also yields epoxidized natural rubber (ENR). The characteristics of the ENR latex were
analyzed based on proton nuclear magnetic resonance (1H-NMR). The unsaturated methine
protons of cis-1,4-isoprene units appeared at 1.68, 2.05, and 5.1 ppm, respectively. The
characteristic peaks for olefinic and oxirane methine protons in the 1H-NMR spectrums
appear at 5.1 and 2.7 respectively. The results reveal that the increasing signals at 2.7, is a
result of the increment of the epoxide group as shown in Figure 2. In Figure 3, the
morphology of NR and the ENR latex were examined by transmission electron microscopy
(TEM). The particles of NR and ENR are spherical and have a smooth surface and darker
areas at the center represent the NR core regions, which contain the carbon double bonds
stained with OsO4, (Figure 3a) and the lighter color areas in Figure 3b show domains which
indicate the region of lower carbon double bonds concentration. The observed proton NMR
signals and TEM micrograph can be qualitatively used to confirm that the NR was
epoxidized.
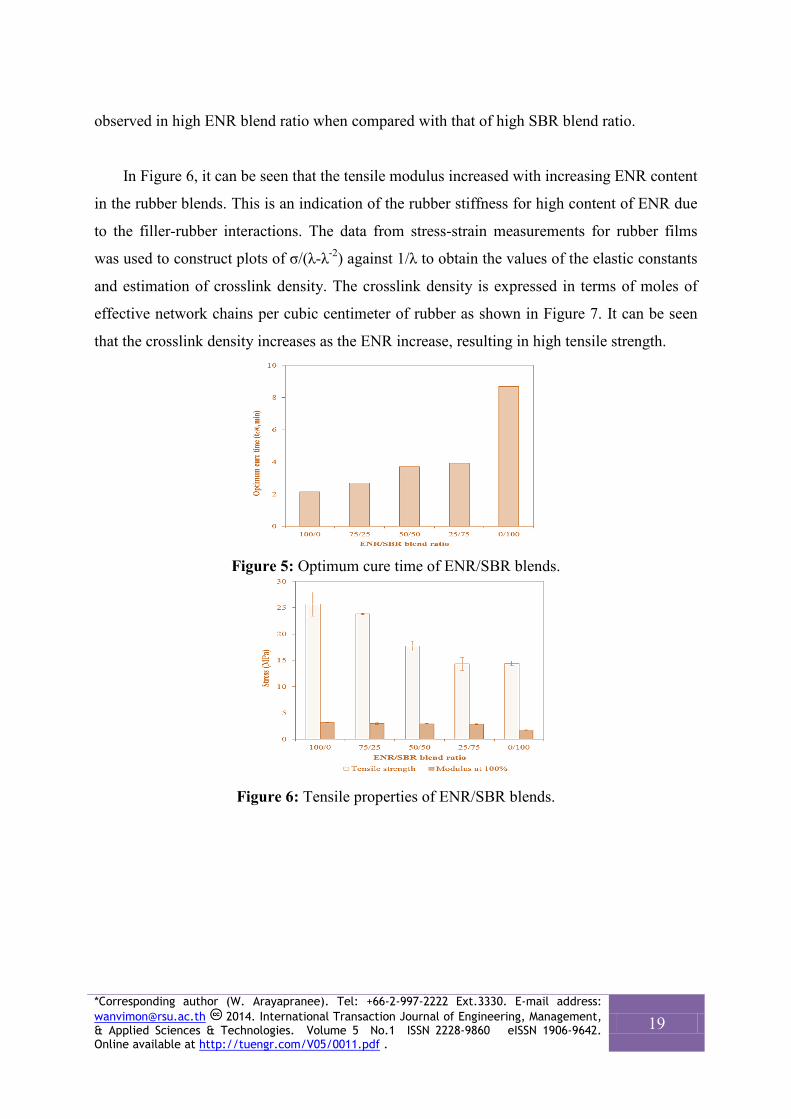
3.1 Processability and Cure characteristics The result of the Mooney viscosity of ENR/SBR rubber blends is shown in Figure 4.
With the increment of SBR, the value of the Mooney viscosity of ENR/SBR rubber blend
increased with increasing SBR content due to the reduction of its bulkiness, which is
attributed to the restriction of molecular chain movement. This resulted in an increase in the
Mooney viscosity of the compound rubber blends. The optimum cure time is the time for the
vulcanization reaction required to obtain optimum physical properties. It can be seen that each
compound exhibits different cure characteristics, which is attributed to the fact that each type
of rubber possesses difference properties, such as structure, polarity, and compatibility.
16 Chanin Ngudsuntear, Sunun Limtrakul, Terdthai Vatanatham, Adul Na Wichien, Garry L. Rempel, and Wanvimon Arayapranee
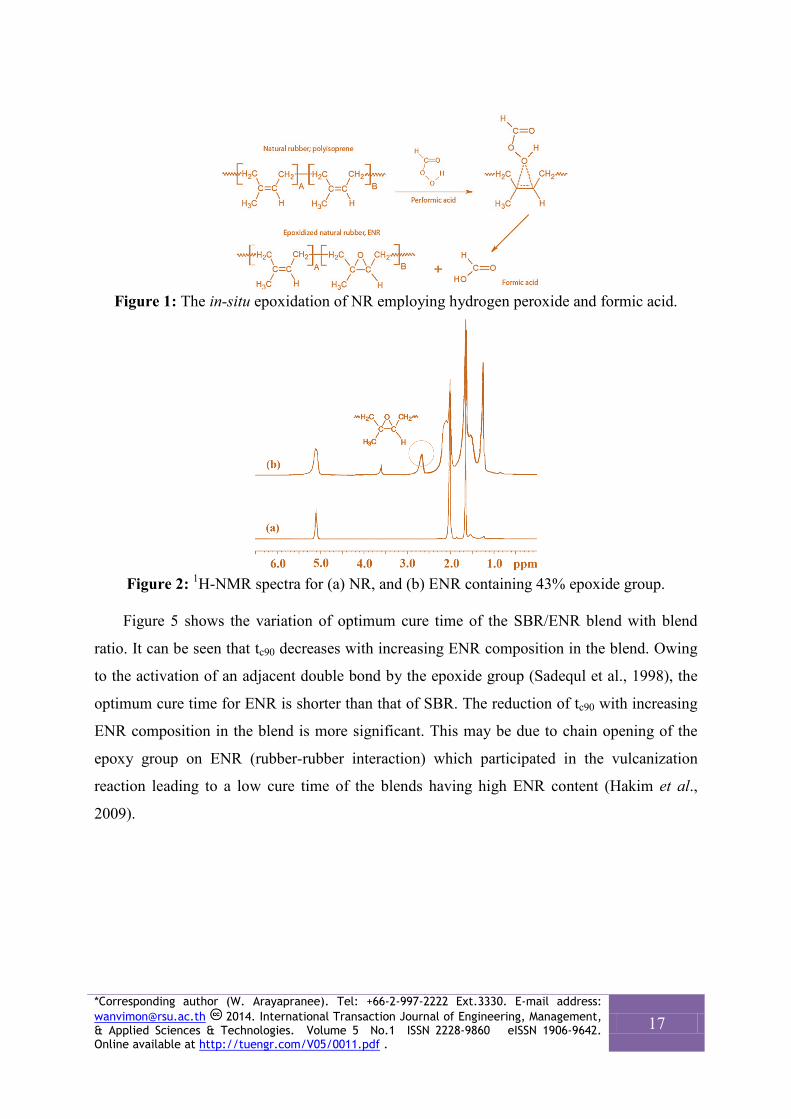
Figure 1: The in-situ epoxidation of NR employing hydrogen peroxide and formic acid.
Figure 2: 1H-NMR spectra for (a) NR, and (b) ENR containing 43% epoxide group.
Figure 5 shows the variation of optimum cure time of the SBR/ENR blend with blend
ratio. It can be seen that tc90 decreases with increasing ENR composition in the blend. Owing
to the activation of an adjacent double bond by the epoxide group (Sadequl et al., 1998), the
optimum cure time for ENR is shorter than that of SBR. The reduction of tc90 with increasing
ENR composition in the blend is more significant. This may be due to chain opening of the
epoxy group on ENR (rubber-rubber interaction) which participated in the vulcanization
reaction leading to a low cure time of the blends having high ENR content (Hakim et al.,
2009).
*Corresponding author (W. Arayapranee). Tel: +66-2-997-2222 Ext.3330. E-mail address: [email protected] 2014. International Transaction Journal of Engineering, Management, & Applied Sciences & Technologies. Volume 5 No.1 ISSN 2228-9860 eISSN 1906-9642. Online available at http://tuengr.com/V05/0011.pdf .
17
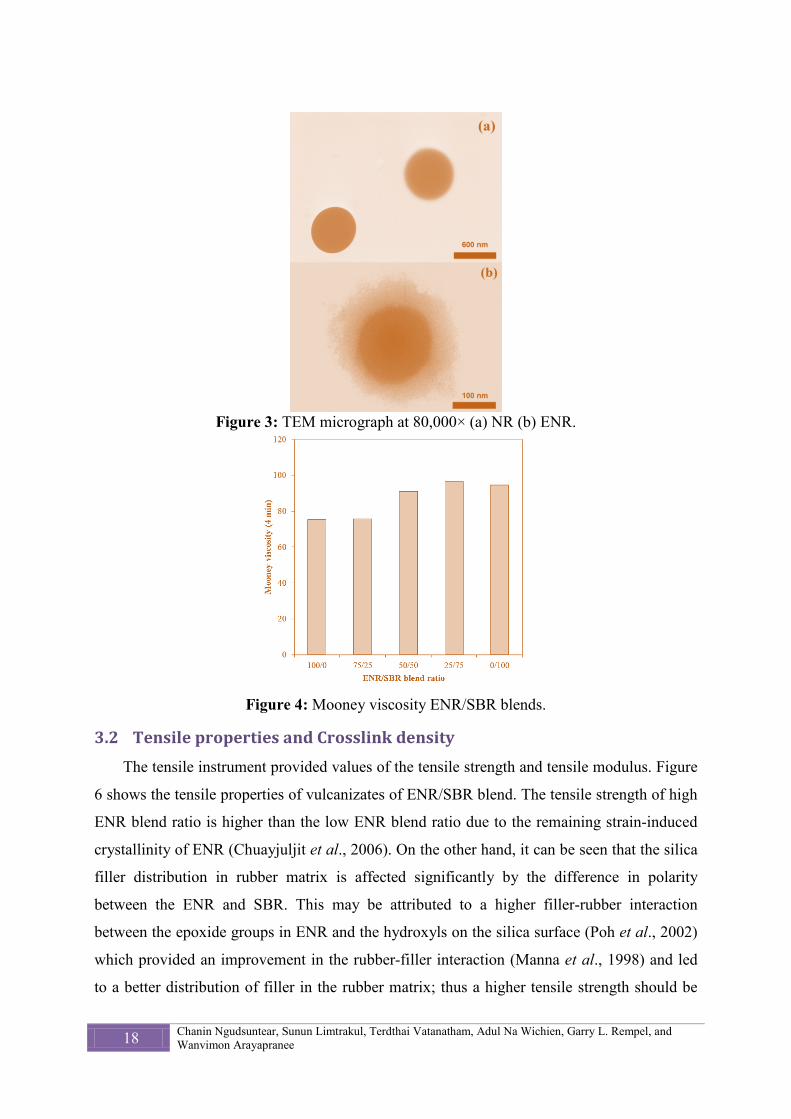
Figure 3: TEM micrograph at 80,000× (a) NR (b) ENR.
Figure 4: Mooney viscosity ENR/SBR blends.
3.2 Tensile properties and Crosslink density The tensile instrument provided values of the tensile strength and tensile modulus. Figure
6 shows the tensile properties of vulcanizates of ENR/SBR blend. The tensile strength of high
ENR blend ratio is higher than the low ENR blend ratio due to the remaining strain-induced
crystallinity of ENR (Chuayjuljit et al., 2006). On the other hand, it can be seen that the silica
filler distribution in rubber matrix is affected significantly by the difference in polarity
between the ENR and SBR. This may be attributed to a higher filler-rubber interaction
between the epoxide groups in ENR and the hydroxyls on the silica surface (Poh et al., 2002)
which provided an improvement in the rubber-filler interaction (Manna et al., 1998) and led
to a better distribution of filler in the rubber matrix; thus a higher tensile strength should be
18 Chanin Ngudsuntear, Sunun Limtrakul, Terdthai Vatanatham, Adul Na Wichien, Garry L. Rempel, and Wanvimon Arayapranee
observed in high ENR blend ratio when compared with that of high SBR blend ratio.
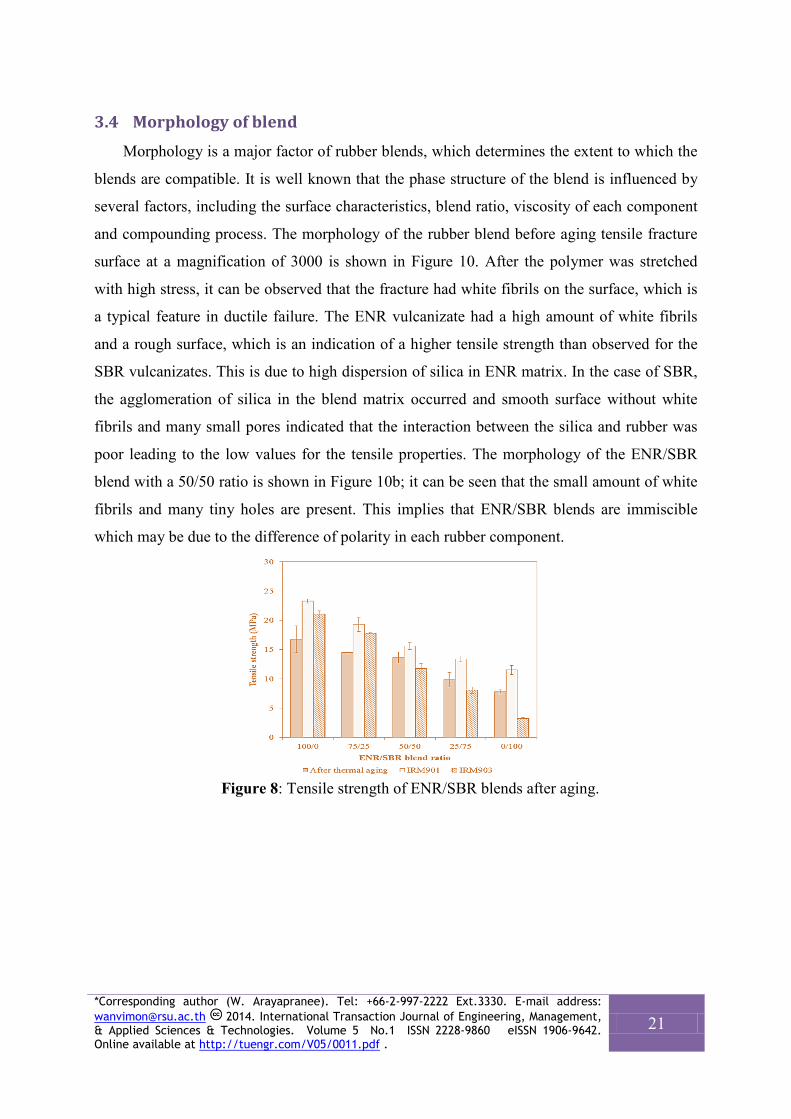
In Figure 6, it can be seen that the tensile modulus increased with increasing ENR content
in the rubber blends. This is an indication of the rubber stiffness for high content of ENR due
to the filler-rubber interactions. The data from stress-strain measurements for rubber films
was used to construct plots of σ/(λ-λ-2) against 1/λ to obtain the values of the elastic constants
and estimation of crosslink density. The crosslink density is expressed in terms of moles of
effective network chains per cubic centimeter of rubber as shown in Figure 7. It can be seen
that the crosslink density increases as the ENR increase, resulting in high tensile strength.
Figure 5: Optimum cure time of ENR/SBR blends.
Figure 6: Tensile properties of ENR/SBR blends.
*Corresponding author (W. Arayapranee). Tel: +66-2-997-2222 Ext.3330. E-mail address: [email protected] 2014. International Transaction Journal of Engineering, Management, & Applied Sciences & Technologies. Volume 5 No.1 ISSN 2228-9860 eISSN 1906-9642. Online available at http://tuengr.com/V05/0011.pdf .
19
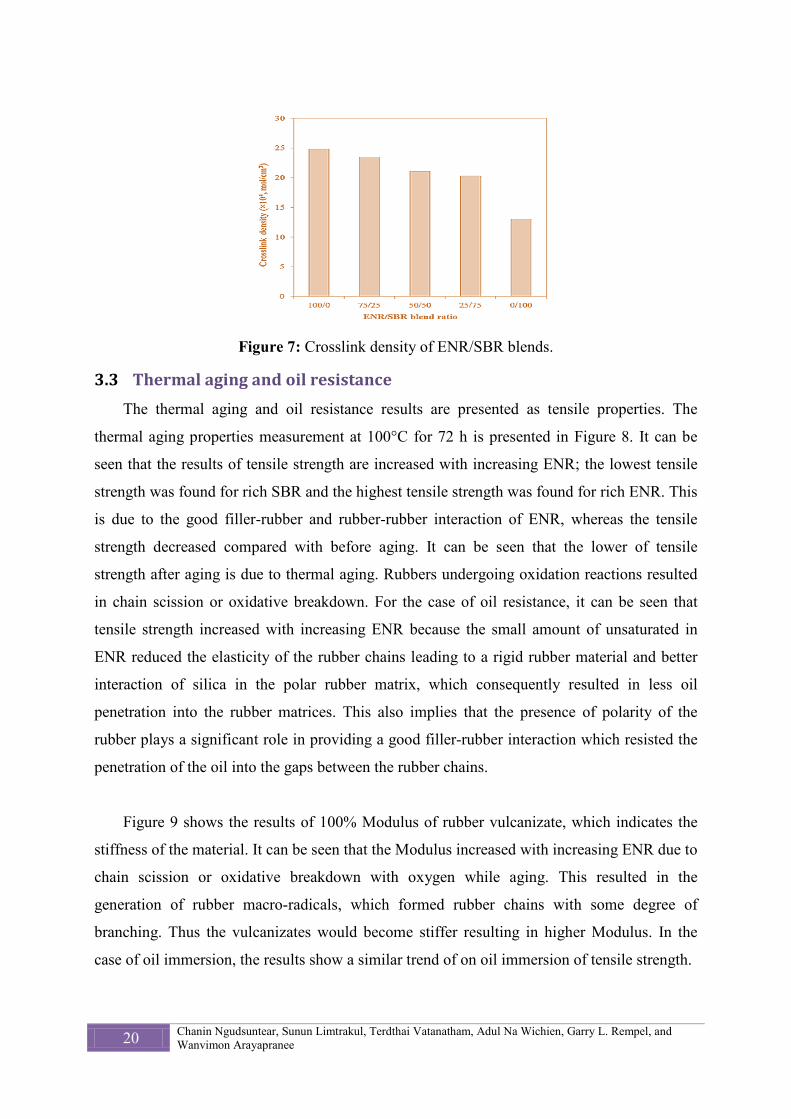
Figure 7: Crosslink density of ENR/SBR blends.
3.3 Thermal aging and oil resistance The thermal aging and oil resistance results are presented as tensile properties. The
thermal aging properties measurement at 100°C for 72 h is presented in Figure 8. It can be
seen that the results of tensile strength are increased with increasing ENR; the lowest tensile
strength was found for rich SBR and the highest tensile strength was found for rich ENR. This
is due to the good filler-rubber and rubber-rubber interaction of ENR, whereas the tensile
strength decreased compared with before aging. It can be seen that the lower of tensile
strength after aging is due to thermal aging. Rubbers undergoing oxidation reactions resulted
in chain scission or oxidative breakdown. For the case of oil resistance, it can be seen that
tensile strength increased with increasing ENR because the small amount of unsaturated in
ENR reduced the elasticity of the rubber chains leading to a rigid rubber material and better
interaction of silica in the polar rubber matrix, which consequently resulted in less oil
penetration into the rubber matrices. This also implies that the presence of polarity of the
rubber plays a significant role in providing a good filler-rubber interaction which resisted the
penetration of the oil into the gaps between the rubber chains.
Figure 9 shows the results of 100% Modulus of rubber vulcanizate, which indicates the
stiffness of the material. It can be seen that the Modulus increased with increasing ENR due to
chain scission or oxidative breakdown with oxygen while aging. This resulted in the
generation of rubber macro-radicals, which formed rubber chains with some degree of
branching. Thus the vulcanizates would become stiffer resulting in higher Modulus. In the
case of oil immersion, the results show a similar trend of on oil immersion of tensile strength.
20 Chanin Ngudsuntear, Sunun Limtrakul, Terdthai Vatanatham, Adul Na Wichien, Garry L. Rempel, and Wanvimon Arayapranee
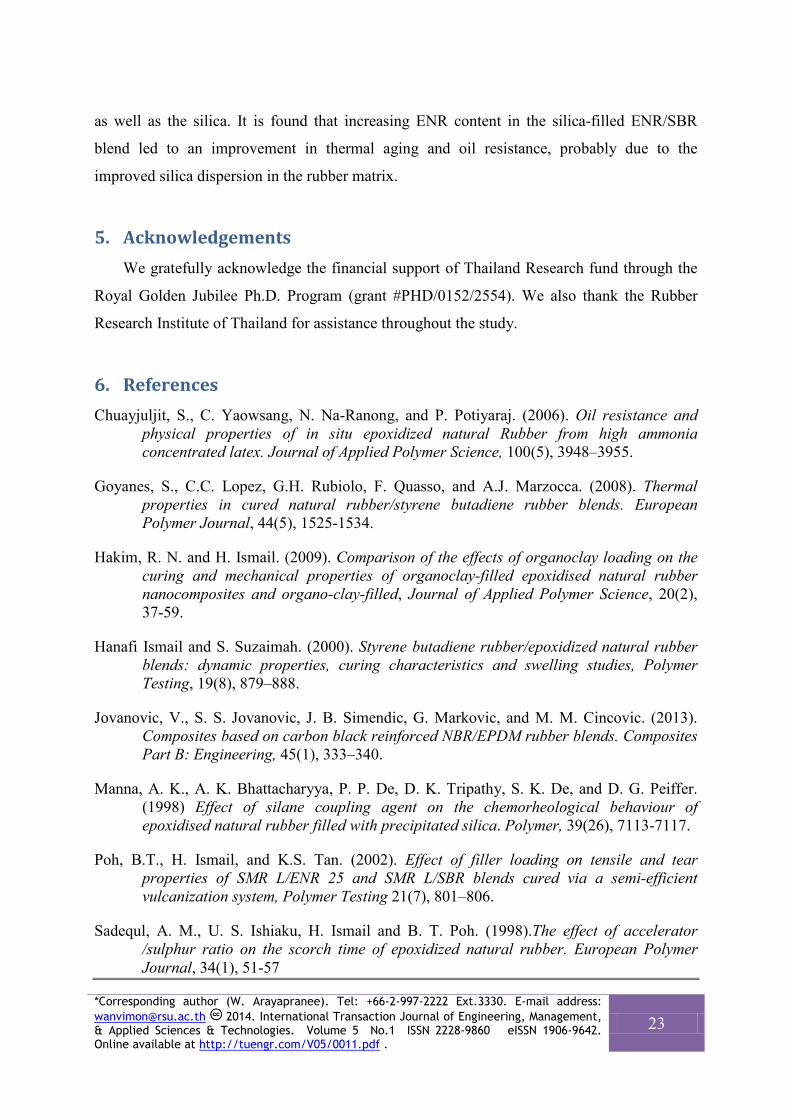
3.4 Morphology of blend Morphology is a major factor of rubber blends, which determines the extent to which the
blends are compatible. It is well known that the phase structure of the blend is influenced by
several factors, including the surface characteristics, blend ratio, viscosity of each component
and compounding process. The morphology of the rubber blend before aging tensile fracture
surface at a magnification of 3000 is shown in Figure 10. After the polymer was stretched
with high stress, it can be observed that the fracture had white fibrils on the surface, which is
a typical feature in ductile failure. The ENR vulcanizate had a high amount of white fibrils
and a rough surface, which is an indication of a higher tensile strength than observed for the
SBR vulcanizates. This is due to high dispersion of silica in ENR matrix. In the case of SBR,
the agglomeration of silica in the blend matrix occurred and smooth surface without white
fibrils and many small pores indicated that the interaction between the silica and rubber was
poor leading to the low values for the tensile properties. The morphology of the ENR/SBR
blend with a 50/50 ratio is shown in Figure 10b; it can be seen that the small amount of white
fibrils and many tiny holes are present. This implies that ENR/SBR blends are immiscible
which may be due to the difference of polarity in each rubber component.
Figure 8: Tensile strength of ENR/SBR blends after aging.
*Corresponding author (W. Arayapranee). Tel: +66-2-997-2222 Ext.3330. E-mail address: [email protected] 2014. International Transaction Journal of Engineering, Management, & Applied Sciences & Technologies. Volume 5 No.1 ISSN 2228-9860 eISSN 1906-9642. Online available at http://tuengr.com/V05/0011.pdf .
21
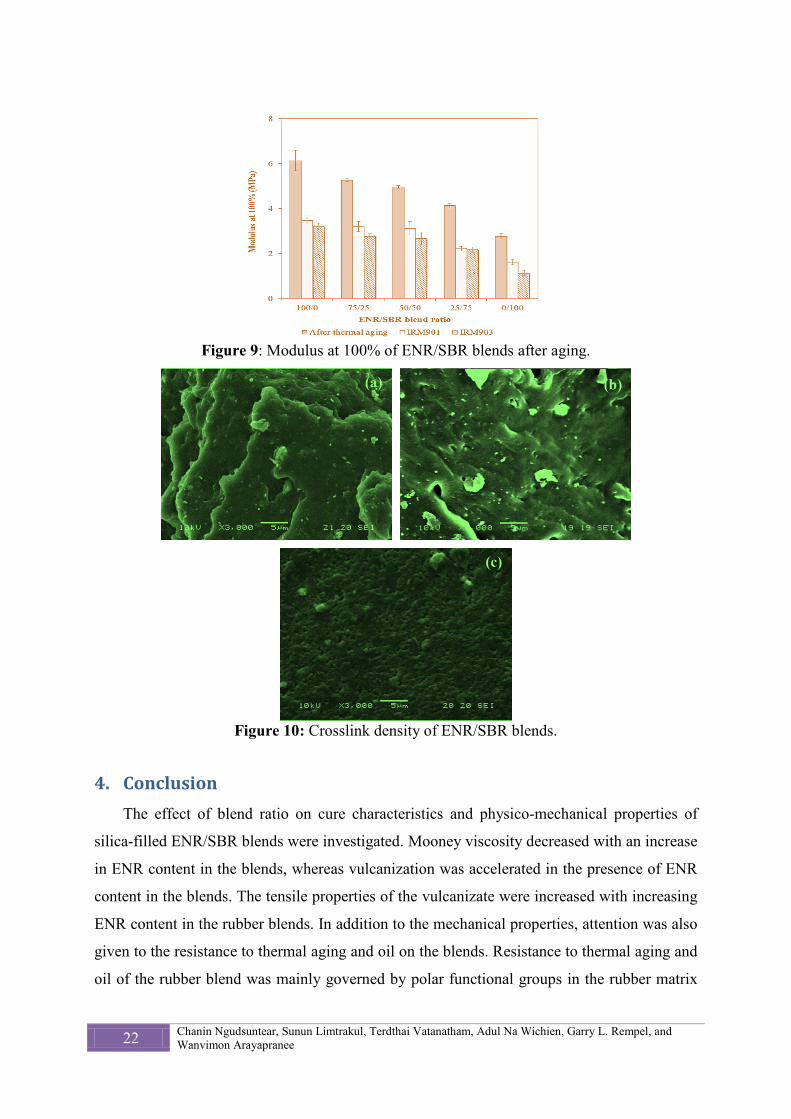
Figure 9: Modulus at 100% of ENR/SBR blends after aging.
Figure 10: Crosslink density of ENR/SBR blends.
4. Conclusion The effect of blend ratio on cure characteristics and physico-mechanical properties of
silica-filled ENR/SBR blends were investigated. Mooney viscosity decreased with an increase
in ENR content in the blends, whereas vulcanization was accelerated in the presence of ENR
content in the blends. The tensile properties of the vulcanizate were increased with increasing
ENR content in the rubber blends. In addition to the mechanical properties, attention was also
given to the resistance to thermal aging and oil on the blends. Resistance to thermal aging and
oil of the rubber blend was mainly governed by polar functional groups in the rubber matrix
22 Chanin Ngudsuntear, Sunun Limtrakul, Terdthai Vatanatham, Adul Na Wichien, Garry L. Rempel, and Wanvimon Arayapranee
as well as the silica. It is found that increasing ENR content in the silica-filled ENR/SBR
blend led to an improvement in thermal aging and oil resistance, probably due to the
improved silica dispersion in the rubber matrix.
5. Acknowledgements We gratefully acknowledge the financial support of Thailand Research fund through the
Royal Golden Jubilee Ph.D. Program (grant #PHD/0152/2554). We also thank the Rubber
Research Institute of Thailand for assistance throughout the study.
6. References Chuayjuljit, S., C. Yaowsang, N. Na-Ranong, and P. Potiyaraj. (2006). Oil resistance and
physical properties of in situ epoxidized natural Rubber from high ammonia concentrated latex. Journal of Applied Polymer Science, 100(5), 3948–3955.
Goyanes, S., C.C. Lopez, G.H. Rubiolo, F. Quasso, and A.J. Marzocca. (2008). Thermal properties in cured natural rubber/styrene butadiene rubber blends. European Polymer Journal, 44(5), 1525-1534.
Hakim, R. N. and H. Ismail. (2009). Comparison of the effects of organoclay loading on the curing and mechanical properties of organoclay-filled epoxidised natural rubber nanocomposites and organo-clay-filled, Journal of Applied Polymer Science, 20(2), 37-59.
Hanafi Ismail and S. Suzaimah. (2000). Styrene butadiene rubber/epoxidized natural rubber blends: dynamic properties, curing characteristics and swelling studies, Polymer Testing, 19(8), 879–888.
Jovanovic, V., S. S. Jovanovic, J. B. Simendic, G. Markovic, and M. M. Cincovic. (2013). Composites based on carbon black reinforced NBR/EPDM rubber blends. Composites Part B: Engineering, 45(1), 333–340.
Manna, A. K., A. K. Bhattacharyya, P. P. De, D. K. Tripathy, S. K. De, and D. G. Peiffer. (1998) Effect of silane coupling agent on the chemorheological behaviour of epoxidised natural rubber filled with precipitated silica. Polymer, 39(26), 7113-7117.
Poh, B.T., H. Ismail, and K.S. Tan. (2002). Effect of filler loading on tensile and tear properties of SMR L/ENR 25 and SMR L/SBR blends cured via a semi-efficient vulcanization system, Polymer Testing 21(7), 801–806.
Sadequl, A. M., U. S. Ishiaku, H. Ismail and B. T. Poh. (1998).The effect of accelerator /sulphur ratio on the scorch time of epoxidized natural rubber. European Polymer Journal, 34(1), 51-57
*Corresponding author (W. Arayapranee). Tel: +66-2-997-2222 Ext.3330. E-mail address: [email protected] 2014. International Transaction Journal of Engineering, Management, & Applied Sciences & Technologies. Volume 5 No.1 ISSN 2228-9860 eISSN 1906-9642. Online available at http://tuengr.com/V05/0011.pdf .
23
Chanin Ngudsuntear earned his bachelor degree in Chemical Engineering from Rangsit University in 2011. He has been studying for the Ph.D. Degree in the Department of Chemical Engineering at Kasetsart University, Thailand.
Dr.Sunun Limtrakul is an Associate Professor of Department of Chemical Engineering at Kasetsart University. She holds a B.Sc. in Industrial Chemistry from Chiengmai University, MS in Chemical Engineering from Chulalongkorn University and Ph.D. degrees in Chemical Engineering from Washington University. Dr. Sunun is interested in reaction engineering, modeling and simulation, transport phenomena, and polymer electrolyte membrane (PEM) fuel cell.
Dr. Terdthai Vatanatham earned his bachelor degree from Chulalongkorn University Thailand, Master degree in Structural Engineering from Pennsylvania State University Thailand and Ph.D. in Chemical Engineering from University of Akron. He is an Associate Professor at Kasetsart University, Thailand. He is interested in reaction engineering, equipment design, and PEM fuel cell.
Adul Na Wichien is a scientist, Professional Level, at Rubber Research Institute of Thailand (RRIT). He received his B.Eng. from Nakhon Sawan Rajabhat University. He focuses on applications and modified of natural rubber and its derivative and waste from agriculture.
Dr.Garry L Rempel is a Professor of Department of Chemical Engineering at University of Waterloo. He received his BSc and Ph.D. from University of British Columbia. He has authored or coauthored more than 300 publications and is the holder of 35 patents. He is interested in applied catalysis, green chemical engineering and advanced rubber technology
Dr.Wanvimon Arayapranee is an Associate Professor of Department of Chemical Engineering and Material Engineering at Rangsit University. She received her B.Sc. in Industrial Chemistry from Chiengmai Uniersity. She earned her Master’s degree in Chemical Engineering from King Mongkut’s University of Technology Thonburi and Ph.D. (Chemical Technology) from Chulalongkorn University. Dr.Wanvimon’s current interests involve polymer engineering and modification of natural rubber.
Peer Review: This article has been internationally peer-reviewed and accepted for publication according to the guidelines in the journal’s website. Note: Original version of this article was accepted and presented at the Third International-Thai Chemical Engineering and Applied Chemistry (TIChE) Conference, jointly organized by Department of Chemical Engineering, Faculty of Engineering, Khon Kaen University and Thai Institute of Chemical Engineering and Applied Chemistry, at Pullman Khon Kaen Raja Orchid Hotel, Khon Kaen, THAILAND, October 17-18, 2013.
24 Chanin Ngudsuntear, Sunun Limtrakul, Terdthai Vatanatham, Adul Na Wichien, Garry L. Rempel, and Wanvimon Arayapranee
International Transaction Journal of Engineering, Management, & Applied Sciences & Technologies
http://TuEngr.com
An Efficient Formulation of Off-line Model Predictive Control for Nonlinear Systems Using Polyhedral Invariant Sets
Pornchai Bumroongsri a*, Pornpun Arundechachai b, and Soorathep Kheawhom b
a Department of Chemical Engineering Faculty of Engineering, Mahidol University, THAILAND b Department of Chemical Engineering Faculty of Engineering, Chulalongkorn University, THAILAND A R T I C L E I N F O
A B S T R A C T
Article history: Received 20 August 2013 Accepted 06 December 2013 Available online 09 December 2013 Keywords: control law; real-time interpolation; scheduling parameter; MPC algorithm
In this research, an efficient formulation of off-line model predictive control for nonlinear systems is presented. The nonlinear systems are reformulated as linear parameter varying systems so their complexity is reduced without any loss of generality. The on-line computational burdens are decreased by pre-computing off-line the sequences of explicit control laws corresponding to the sequences of polyhedral invariant sets. At each sampling time, the current state and the scheduling parameter are measured. The real-time control law is then calculated by linear interpolation between the pre-computed control laws. The results indicate that the proposed algorithm can achieve better control performance compared to the previously developed off-line robust model predictive control algorithm because the scheduling parameter is incorporated into the controller design.
2014 INT TRANS J ENG MANAG SCI TECH. .
1. Introduction Chemical processes are multivariable processes that change one or more chemical
compounds to the desired products. Chemical processes are usually involved with many
complex chemical reactions which are nonlinear. In order to efficiently control nonlinear
chemical processes, a multivariable nonlinear control algorithm needs to be developed (Qin and
Badgwell, 2003; Ramesh, et al., 2009; Manenti, 2011).
2014 International Transaction Journal of Engineering, Management, & Applied Sciences & Technologies.
*Corresponding author (P.Bumroongsri). Tel: +66-2-8892138 Ext.6101. E-mail address: [email protected]. 2014. International Transaction Journal of Engineering, Management, & Applied Sciences & Technologies. Volume 5 No.1 ISSN 2228-9860 eISSN 1906-9642. Online available at http://tuengr.com/V05/0025.pdf .
25
Model predictive control (MPC) is an advanced control algorithm for multivariable
processes. MPC is widely used in many chemical processes because input and output
constraints are considered in a systematic manner (Morari and Lee, 1999; Mayne, et al., 2000;
Lee, 2011). A linear model is typically used in MPC formulation because the on-line
optimization problem can be easily solved. However, most of the chemical processes are
nonlinear. When the operating conditions undergo changes, the performance of linear MPC can
significantly deteriorate (Bumroongsri and Kheawhom, 2012a; Yu, et al., 2012; Suzuki and
Sugie, 2007).
In order to deal with nonlinear chemical processes, nonlinear MPC was developed by
Magni, et al. (2001). A full nonlinear model was used in MPC formulation. The complicated
nonlinear control problem had to be solved at each sampling instant so the algorithm was
computationally prohibitive in practical situations.
The reformulation of nonlinear systems into linear parameter varying (LPV) systems is a
promising technique to reduce the complexity of nonlinear systems. LPV systems are linear
systems whose dynamics depend on time-varying parameters that can be measured on-line.
Therefore, nonlinear systems can be reformulated as LPV systems without any loss of
generality (Park and Jeong, 2004; Toth, 2010; Jungers, et al., 2011). Off-line MPC for LPV
systems was previously developed by Bumroongsri and Kheawhom (2012b). Although the
on-line computational time was significantly reduced, the stabilizable region of the algorithm
was small because the ellipsoidal invariant sets were used in problem formulation.
In order to enlarge the size of stabilizable region, an off-line formulation of robust MPC
using polyhedral invariant sets was proposed by Bumroongsri and Kheawhom (2012c). The
polyhedral invariant sets were used in the problem formulation so a significantly larger
stabilizable region was obtained. Although the stabilizable region was enlarged, the
conservativeness was obtained because the scheduling parameter was not incorporated into the
controller design.
In this research, an efficient formulation of off-line MPC using polyhedral invariant sets is
presented. The sequences of explicit control laws corresponding to the sequences of polyhedral
invariant sets are pre-computed off-line. At each sampling instant, the current state and the
26 Pornchai Bumroongsri, Pornpun Arundechachai, and Soorathep Kheawhom
scheduling parameter are measured. The real-time control law is then calculated by linear
interpolation between the pre-computed control laws. The proposed algorithm can give a
relatively large stabilizable region because the polyhedral invariant sets are computed in the
off-line problem formulation. Moreover, the scheduling parameter is used in real-time
interpolation between the pre-computed control laws so better control performance compared
to an off-line robust MPC algorithm of Bumroongsri and Kheawhom (2012c) can be obtained.
This article is organized as follows. In section 2, the problem description is presented. The
proposed algorithm is presented in section 3. In section 4, the proposed algorithm is applied to a
case study and the results are discussed. Finally, the paper is concluded in section 5.
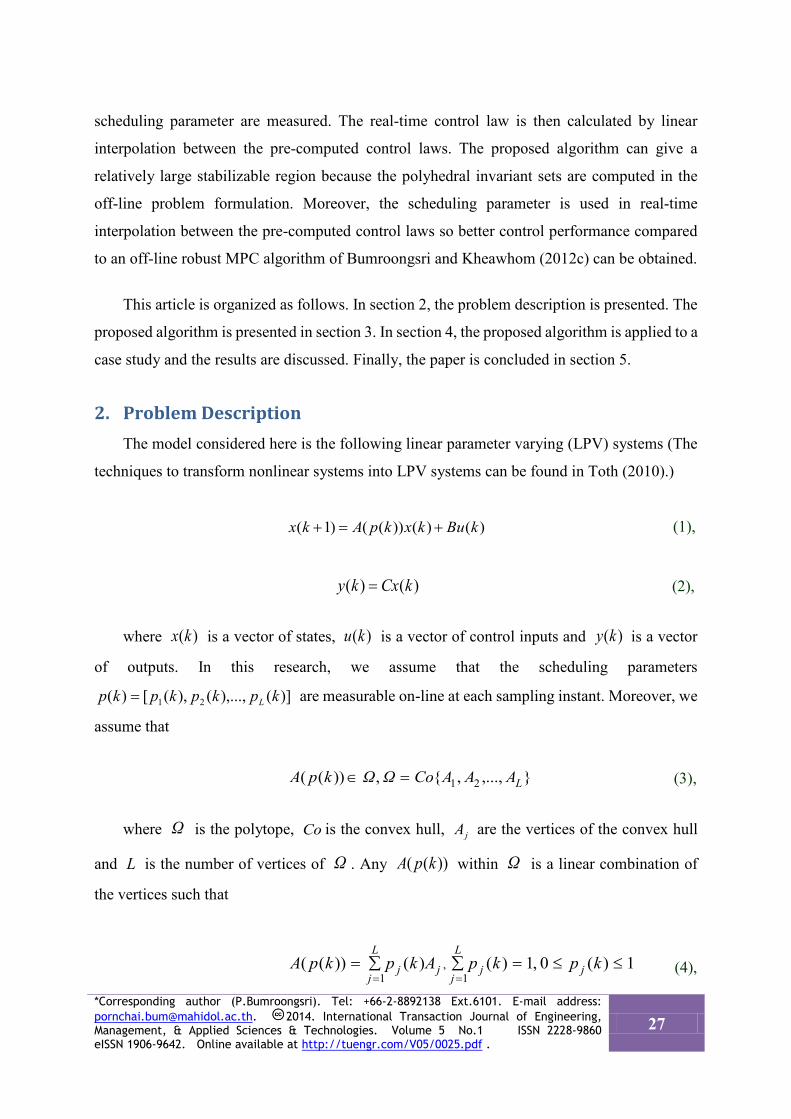
2. Problem Description The model considered here is the following linear parameter varying (LPV) systems (The
techniques to transform nonlinear systems into LPV systems can be found in Toth (2010).)
)()())(()1( kBukxkpAkx +=+ (1),
)()( kCxky = (2),
where )(kx is a vector of states, )(ku is a vector of control inputs and )(ky is a vector
of outputs. In this research, we assume that the scheduling parameters
)](),...,(),([)( 21 kpkpkpkp L= are measurable on-line at each sampling instant. Moreover, we
assume that
},...,,{ ,))(( 21 LAAACoΩΩkpA =∈ (3),
where Ω is the polytope, Co is the convex hull, jA are the vertices of the convex hull
and L is the number of vertices of Ω . Any ))(( kpA within Ω is a linear combination of
the vertices such that
1)(0 ,1)()())((1
,1
≤≤=∑∑===
kpkpAkpkpA j
L
jjj
L
jj (4),
*Corresponding author (P.Bumroongsri). Tel: +66-2-8892138 Ext.6101. E-mail address: [email protected]. 2014. International Transaction Journal of Engineering, Management, & Applied Sciences & Technologies. Volume 5 No.1 ISSN 2228-9860 eISSN 1906-9642. Online available at http://tuengr.com/V05/0025.pdf .
27
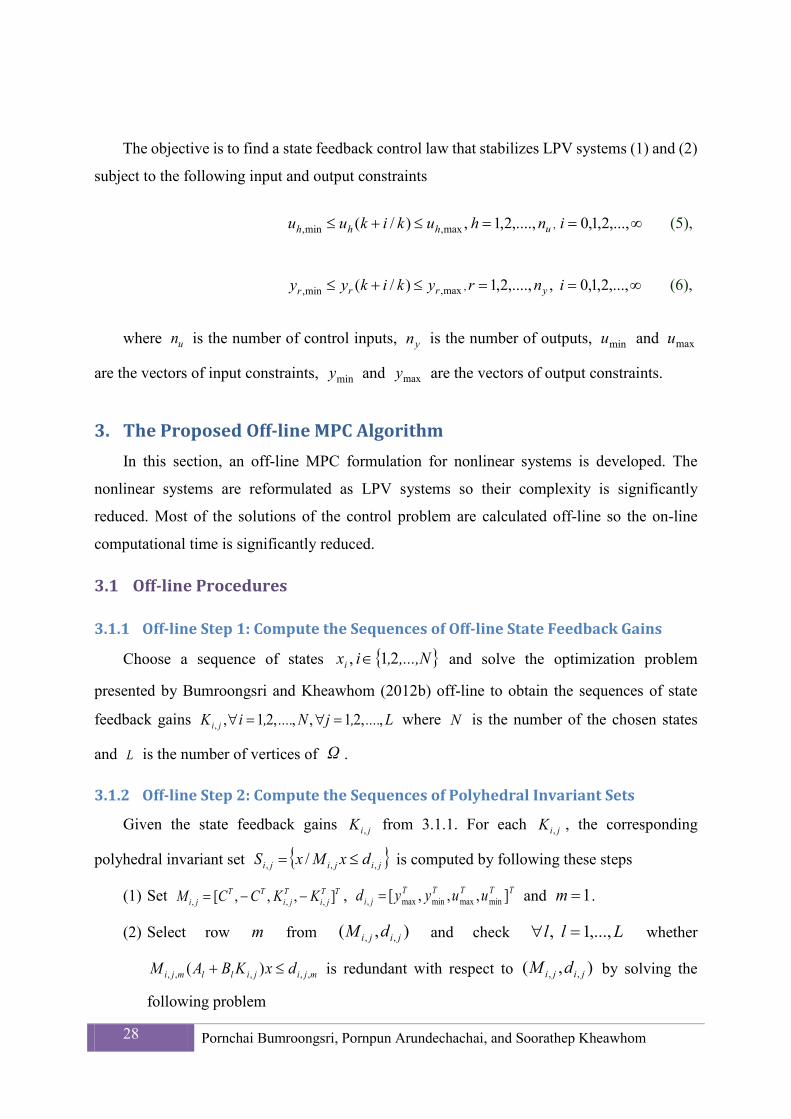
The objective is to find a state feedback control law that stabilizes LPV systems (1) and (2)
subject to the following input and output constraints
∞==≤+≤ ,...,2,1,0,....,2,1 ,)/( ,max,min, inhukikuu uhhh (5),
∞==≤+≤ ,...,2,1,0 ,,....,2,1)/( ,max,min, inrykikyy yrrr (6),
where un is the number of control inputs, yn is the number of outputs, minu and maxu
are the vectors of input constraints, miny and maxy are the vectors of output constraints.
3. The Proposed Off-line MPC Algorithm In this section, an off-line MPC formulation for nonlinear systems is developed. The
nonlinear systems are reformulated as LPV systems so their complexity is significantly
reduced. Most of the solutions of the control problem are calculated off-line so the on-line
computational time is significantly reduced.
3.1 Off-line Procedures
3.1.1 Off-line Step 1: Compute the Sequences of Off-line State Feedback Gains
Choose a sequence of states { },...,N,ixi 21 , ∈ and solve the optimization problem
presented by Bumroongsri and Kheawhom (2012b) off-line to obtain the sequences of state
feedback gains L....,jN....,iK ji ,,21 ,,,21,, =∀=∀ where N is the number of the chosen states
and L is the number of vertices of Ω .
3.1.2 Off-line Step 2: Compute the Sequences of Polyhedral Invariant Sets
Given the state feedback gains jiK , from 3.1.1. For each jiK , , the corresponding
polyhedral invariant set { }jijiji dxMxS ,,, / ≤= is computed by following these steps
(1) Set TTji
Tji
TTji KKCCM ] , , ,[ ,,, −−= , TTTTT
ji uuyyd ],,,[ minmaxminmax, = and 1=m .
(2) Select row m from ),( ,, jiji dM and check Lll ,...,1 , =∀ whether
mjijillmji dxKBAM ,,,,, )( ≤+ is redundant with respect to ),( ,, jiji dM by solving the
following problem
28 Pornchai Bumroongsri, Pornpun Arundechachai, and Soorathep Kheawhom
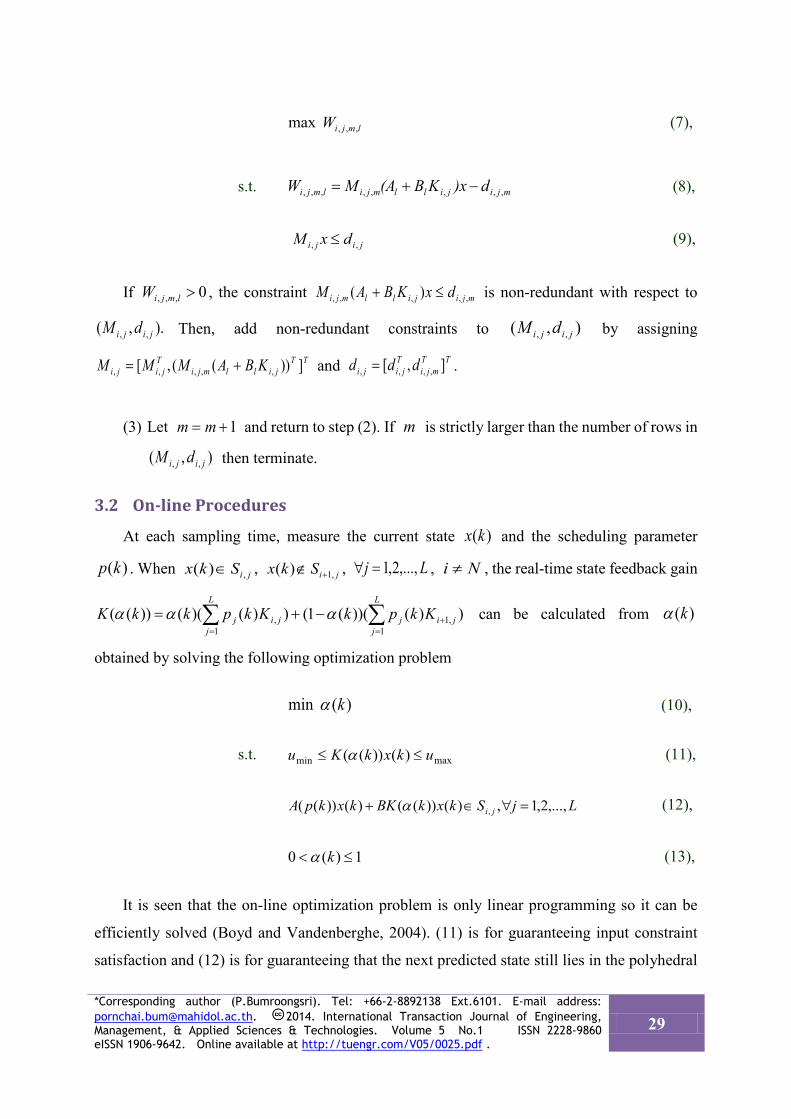
lmjiW ,,, max (7),
s.t. mjijillmjilmji d)xKB(AMW ,,,,,,,, −+= (8),
jiji dxM ,, ≤ (9),
If 0,,, >lmjiW , the constraint mjijillmji dxKBAM ,,,,, )( ≤+ is non-redundant with respect to
).,( ,, jiji dM Then, add non-redundant constraints to ),( ,, jiji dM by assigning
TTjillmji
Tjiji KBAMMM ]))((,[ ,,,,, += and TT
mjiT
jiji ddd ],[ ,,,, = .
(3) Let 1+= mm and return to step (2). If m is strictly larger than the number of rows in ),( ,, jiji dM then terminate.
3.2 On-line Procedures
At each sampling time, measure the current state )(kx and the scheduling parameter
)(kp . When jiSkx ,)( ∈ , jiSkx ,1)( +∉ , Lj ,...,2,1=∀ , Ni ≠ , the real-time state feedback gain
∑∑=
+=
−+=L
jjij
L
jjij KkpkKkpkkK
1,1
1, ))())((1())()(())(( ααα can be calculated from )(kα
obtained by solving the following optimization problem
)( min kα (10),
s.t. maxmin )())(( ukxkKu ≤≤ α (11),
LjSkxkBKkxkpA ji ,...,2,1,)())(()())(( , =∀∈+ α (12),
1)(0 ≤< kα (13),
It is seen that the on-line optimization problem is only linear programming so it can be
efficiently solved (Boyd and Vandenberghe, 2004). (11) is for guaranteeing input constraint
satisfaction and (12) is for guaranteeing that the next predicted state still lies in the polyhedral
*Corresponding author (P.Bumroongsri). Tel: +66-2-8892138 Ext.6101. E-mail address: [email protected]. 2014. International Transaction Journal of Engineering, Management, & Applied Sciences & Technologies. Volume 5 No.1 ISSN 2228-9860 eISSN 1906-9642. Online available at http://tuengr.com/V05/0025.pdf .
29
invariant sets computed off-line.
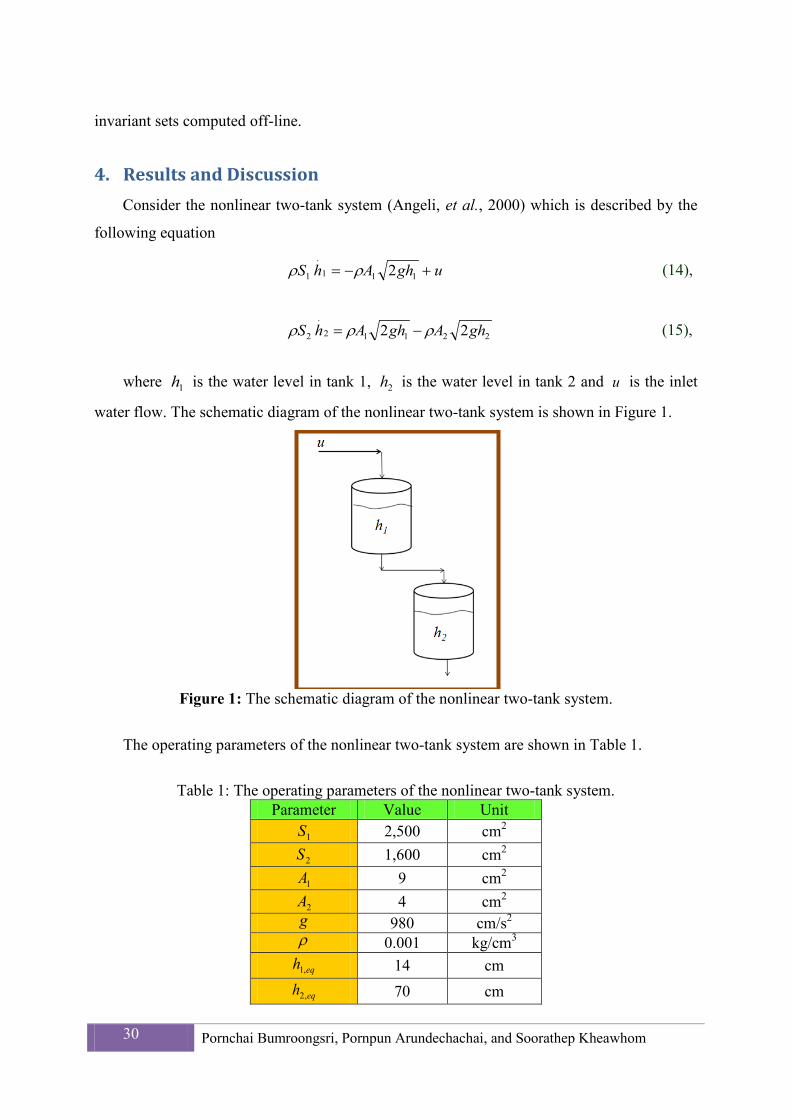
4. Results and Discussion Consider the nonlinear two-tank system (Angeli, et al., 2000) which is described by the
following equation
ughAhS +−= 111
.
1 2ρρ (14),
22112
.
2 22 ghAghAhS ρρρ −= (15),
where 1h is the water level in tank 1, 2h is the water level in tank 2 and u is the inlet
water flow. The schematic diagram of the nonlinear two-tank system is shown in Figure 1.
Figure 1: The schematic diagram of the nonlinear two-tank system.
The operating parameters of the nonlinear two-tank system are shown in Table 1.
Table 1: The operating parameters of the nonlinear two-tank system.
Parameter Value Unit 1S 2,500 cm2
2S 1,600 cm2
1A 9 cm2
2A 4 cm2 g 980 cm/s2
ρ 0.001 kg/cm3
eqh ,1 14 cm
eqh ,2 70 cm
30 Pornchai Bumroongsri, Pornpun Arundechachai, and Soorathep Kheawhom
Let eqhhh ,111 −= , eqhhh ,222 −= and equuu −= where subscript eq is used to denote
the corresponding variable at equilibrium condition, the objective is to regulate 2 h to the
origin by manipulating u . The input and output constraints are given as follows
5.1≤u kg/s, 131 ≤h cm, 502 ≤h cm (16),
By evaluating the Jacobian matrix of (14) and (15) along the vertices of the constraints set
(16), we have that all the solutions of (14) and (15) are also the solutions of the following
differential inclusion
01
2
14
12
.
2
1
.
1 uhhAp
hS
hSj
jj
+
∈
∑=ρ
ρ (17),
where 4,...,1, =jAj are given by
,22
02
min,22
min,11
min,11
1
−
−
=
hgA
hgA
hgA
Aρρ
ρ
−
−
=
min,22
max,11
max,11
2 22
02
hgA
hgA
hgA
Aρρ
ρ
,22
02
max,22
min,11
min,11
3
−
−
=
hgA
hgA
hgA
Aρρ
ρ
−
−
=
max,22
max,11
max,11
4 22
02
hgA
hgA
hgA
Aρρ
ρ(18),
and 4,...,1, =jp j are given by
−
−
−
−=
)/1()/1(
)/1()/1(.
)/1()/1(
)/1()/1(
min,2max,2
2max,2
min,1max,1
1max,11 hh
hh
hh
hhp
*Corresponding author (P.Bumroongsri). Tel: +66-2-8892138 Ext.6101. E-mail address: [email protected]. 2014. International Transaction Journal of Engineering, Management, & Applied Sciences & Technologies. Volume 5 No.1 ISSN 2228-9860 eISSN 1906-9642. Online available at http://tuengr.com/V05/0025.pdf .
31
−
−
−
−=
)/1()/1(
)/1()/1(.
)/1()/1(
)/1()/1(
min,2max,2
2max,2
min,1max,1
min,112 hh
hh
hh
hhp
−
−
−
−=
)/1()/1(
)/1()/1(.
)/1()/1(
)/1()/1(
min,2max,2
min,22
min,1max,1
1max,13 hh
hh
hh
hhp
−
−
−
−=
)/1()/1(
)/1()/1(.
)/1()/1(
)/1()/1(
min,2max,2
min,22
min,1max,1
min,114 hh
hh
hh
hhp (19),
The discrete-time model is obtained by discretization of (17) using Euler first-order
approximation (Seborg, et al., 2004) with a sampling period of 0.5 s and it is omitted here for
brevity.
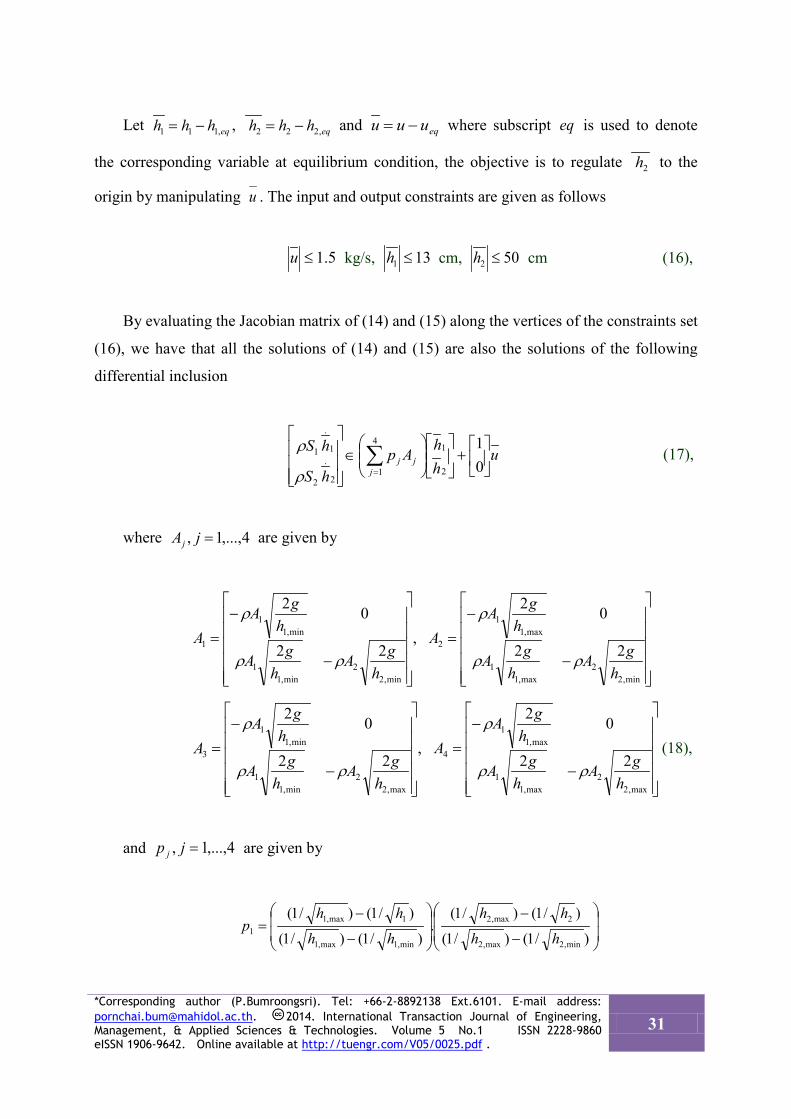
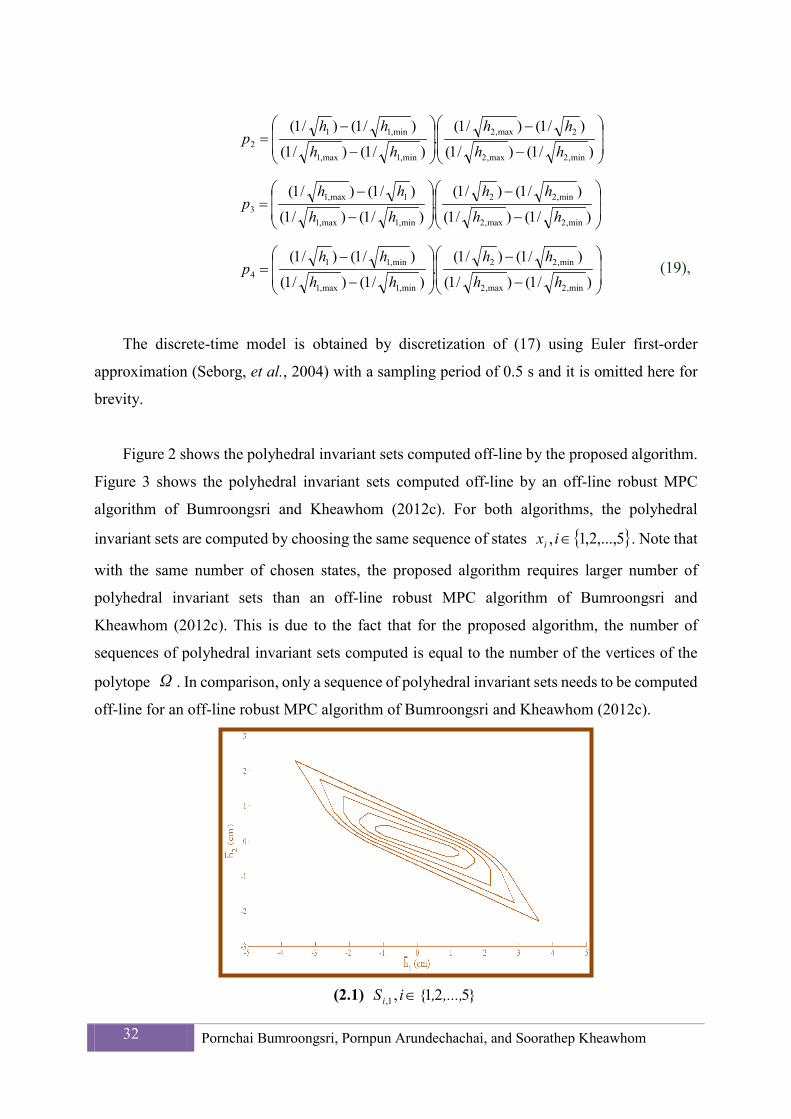
Figure 2 shows the polyhedral invariant sets computed off-line by the proposed algorithm.
Figure 3 shows the polyhedral invariant sets computed off-line by an off-line robust MPC
algorithm of Bumroongsri and Kheawhom (2012c). For both algorithms, the polyhedral
invariant sets are computed by choosing the same sequence of states { }5,...,2,1, ∈ixi . Note that
with the same number of chosen states, the proposed algorithm requires larger number of
polyhedral invariant sets than an off-line robust MPC algorithm of Bumroongsri and
Kheawhom (2012c). This is due to the fact that for the proposed algorithm, the number of
sequences of polyhedral invariant sets computed is equal to the number of the vertices of the
polytope Ω . In comparison, only a sequence of polyhedral invariant sets needs to be computed
off-line for an off-line robust MPC algorithm of Bumroongsri and Kheawhom (2012c).
(2.1) }521{,1, ,...,,iSi ∈
32 Pornchai Bumroongsri, Pornpun Arundechachai, and Soorathep Kheawhom
(2.2) }521{,2, ,...,,iSi ∈
(2.3) }521{,3, ,...,,iSi ∈
(2.4) }521{,4, ,...,,iSi ∈
Figure 2: The polyhedral invariant sets computed off-line by the proposed algorithm. *Corresponding author (P.Bumroongsri). Tel: +66-2-8892138 Ext.6101. E-mail address: [email protected]. 2014. International Transaction Journal of Engineering, Management, & Applied Sciences & Technologies. Volume 5 No.1 ISSN 2228-9860 eISSN 1906-9642. Online available at http://tuengr.com/V05/0025.pdf .
33
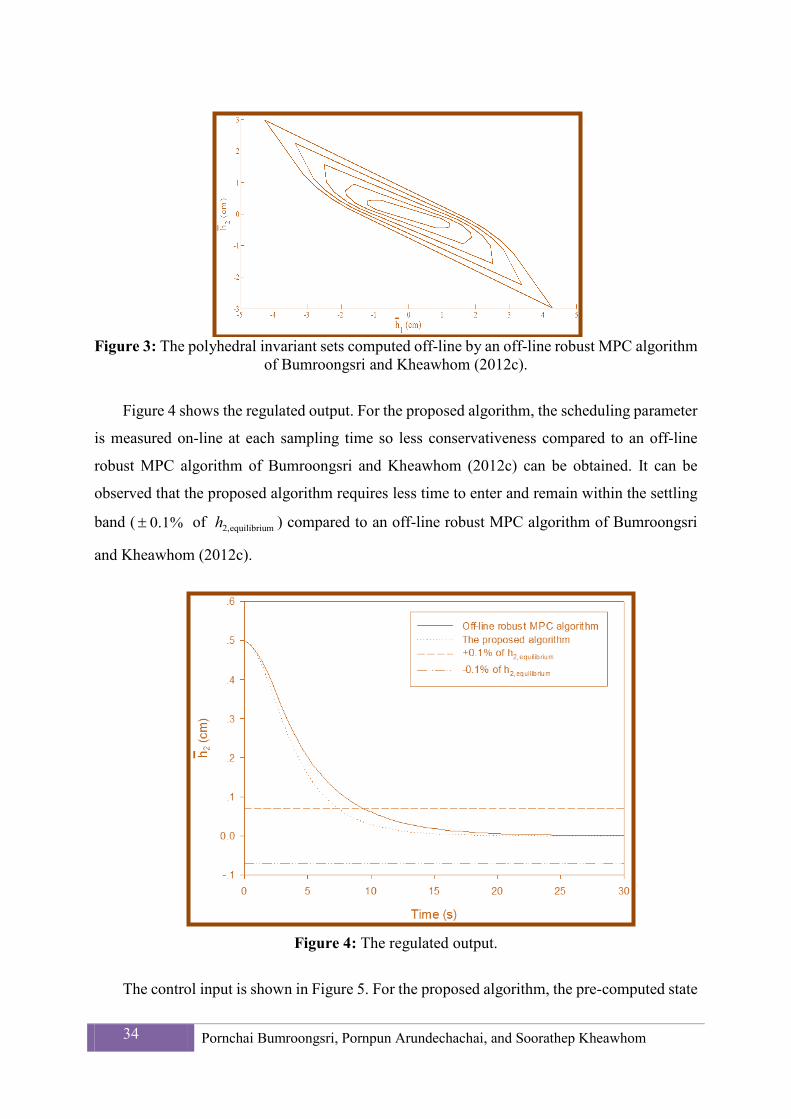
Figure 3: The polyhedral invariant sets computed off-line by an off-line robust MPC algorithm
of Bumroongsri and Kheawhom (2012c).
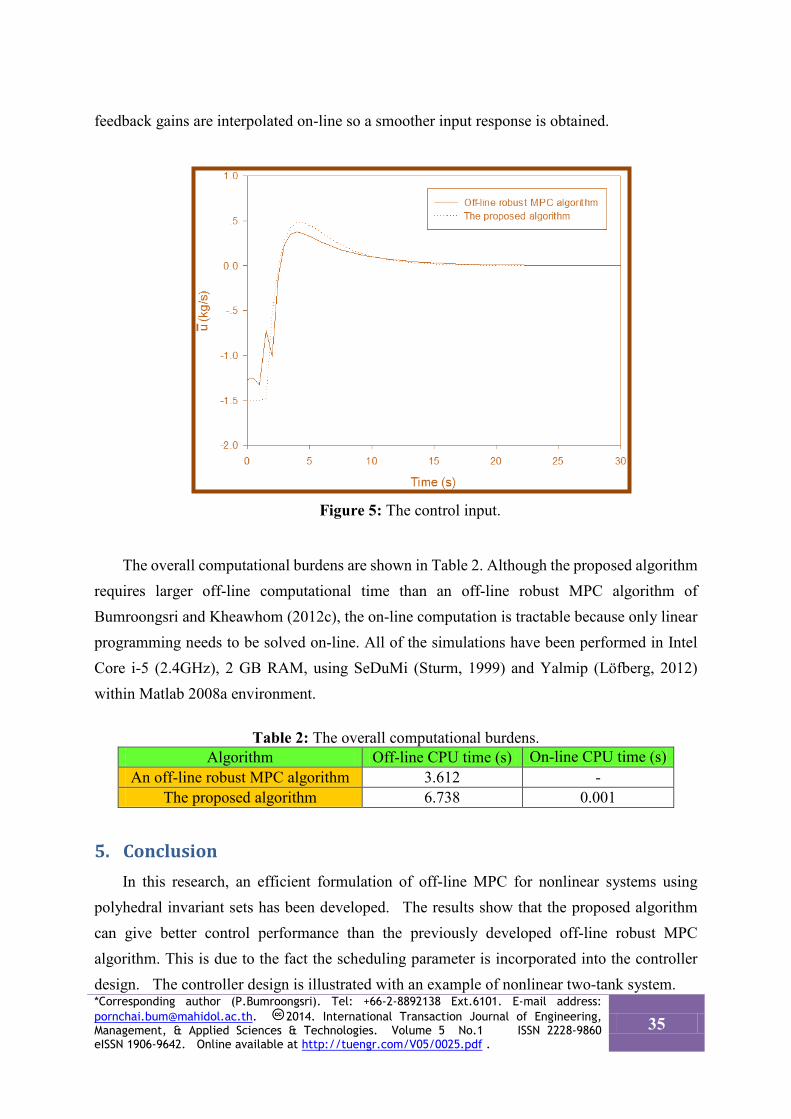
Figure 4 shows the regulated output. For the proposed algorithm, the scheduling parameter
is measured on-line at each sampling time so less conservativeness compared to an off-line
robust MPC algorithm of Bumroongsri and Kheawhom (2012c) can be obtained. It can be
observed that the proposed algorithm requires less time to enter and remain within the settling
band ( %1.0± of mequilibriu2,h ) compared to an off-line robust MPC algorithm of Bumroongsri
and Kheawhom (2012c).
Figure 4: The regulated output.
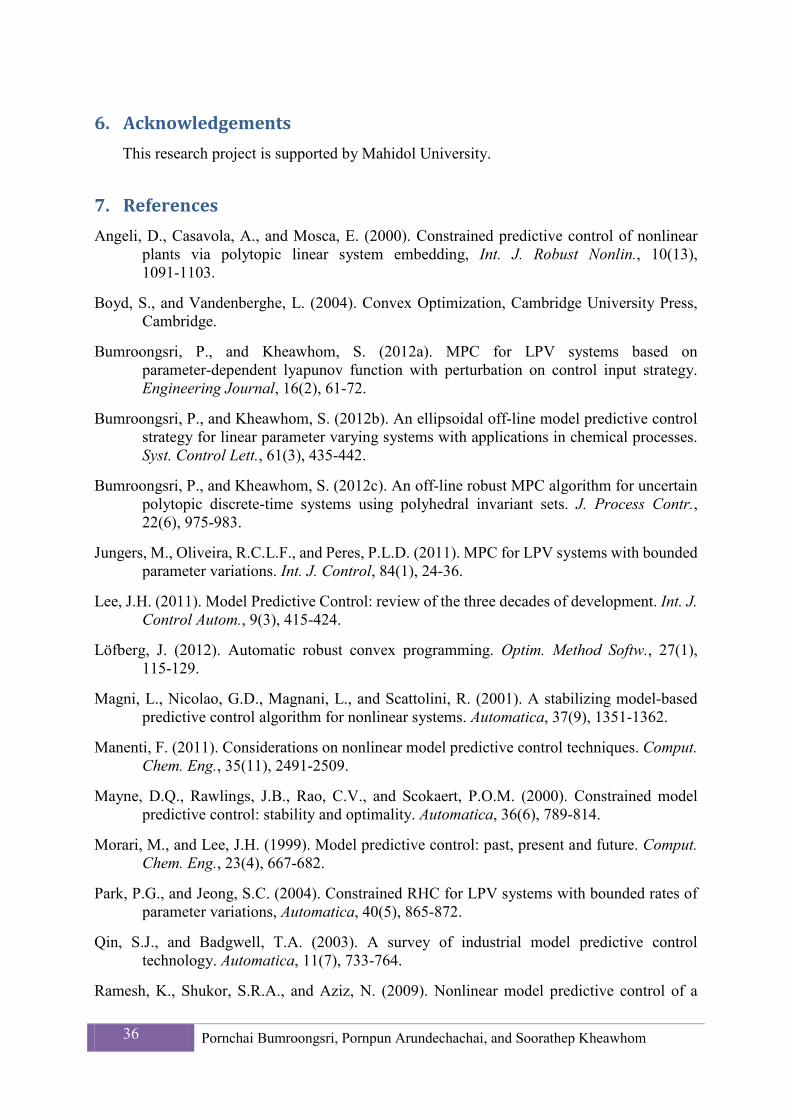
The control input is shown in Figure 5. For the proposed algorithm, the pre-computed state
34 Pornchai Bumroongsri, Pornpun Arundechachai, and Soorathep Kheawhom
feedback gains are interpolated on-line so a smoother input response is obtained.
Figure 5: The control input.
The overall computational burdens are shown in Table 2. Although the proposed algorithm requires larger off-line computational time than an off-line robust MPC algorithm of Bumroongsri and Kheawhom (2012c), the on-line computation is tractable because only linear programming needs to be solved on-line. All of the simulations have been performed in Intel Core i-5 (2.4GHz), 2 GB RAM, using SeDuMi (Sturm, 1999) and Yalmip (Löfberg, 2012) within Matlab 2008a environment.
Table 2: The overall computational burdens.
Algorithm Off-line CPU time (s) On-line CPU time (s) An off-line robust MPC algorithm 3.612 -
The proposed algorithm 6.738 0.001
5. Conclusion In this research, an efficient formulation of off-line MPC for nonlinear systems using
polyhedral invariant sets has been developed. The results show that the proposed algorithm can give better control performance than the previously developed off-line robust MPC algorithm. This is due to the fact the scheduling parameter is incorporated into the controller design. The controller design is illustrated with an example of nonlinear two-tank system. *Corresponding author (P.Bumroongsri). Tel: +66-2-8892138 Ext.6101. E-mail address: [email protected]. 2014. International Transaction Journal of Engineering, Management, & Applied Sciences & Technologies. Volume 5 No.1 ISSN 2228-9860 eISSN 1906-9642. Online available at http://tuengr.com/V05/0025.pdf .
35
6. Acknowledgements This research project is supported by Mahidol University.
7. References Angeli, D., Casavola, A., and Mosca, E. (2000). Constrained predictive control of nonlinear
plants via polytopic linear system embedding, Int. J. Robust Nonlin., 10(13), 1091-1103.
Boyd, S., and Vandenberghe, L. (2004). Convex Optimization, Cambridge University Press, Cambridge.
Bumroongsri, P., and Kheawhom, S. (2012a). MPC for LPV systems based on parameter-dependent lyapunov function with perturbation on control input strategy. Engineering Journal, 16(2), 61-72.
Bumroongsri, P., and Kheawhom, S. (2012b). An ellipsoidal off-line model predictive control strategy for linear parameter varying systems with applications in chemical processes. Syst. Control Lett., 61(3), 435-442.
Bumroongsri, P., and Kheawhom, S. (2012c). An off-line robust MPC algorithm for uncertain polytopic discrete-time systems using polyhedral invariant sets. J. Process Contr., 22(6), 975-983.
Jungers, M., Oliveira, R.C.L.F., and Peres, P.L.D. (2011). MPC for LPV systems with bounded parameter variations. Int. J. Control, 84(1), 24-36.
Lee, J.H. (2011). Model Predictive Control: review of the three decades of development. Int. J. Control Autom., 9(3), 415-424.
Löfberg, J. (2012). Automatic robust convex programming. Optim. Method Softw., 27(1), 115-129.
Magni, L., Nicolao, G.D., Magnani, L., and Scattolini, R. (2001). A stabilizing model-based predictive control algorithm for nonlinear systems. Automatica, 37(9), 1351-1362.
Manenti, F. (2011). Considerations on nonlinear model predictive control techniques. Comput. Chem. Eng., 35(11), 2491-2509.
Mayne, D.Q., Rawlings, J.B., Rao, C.V., and Scokaert, P.O.M. (2000). Constrained model predictive control: stability and optimality. Automatica, 36(6), 789-814.
Morari, M., and Lee, J.H. (1999). Model predictive control: past, present and future. Comput. Chem. Eng., 23(4), 667-682.
Park, P.G., and Jeong, S.C. (2004). Constrained RHC for LPV systems with bounded rates of parameter variations, Automatica, 40(5), 865-872.
Qin, S.J., and Badgwell, T.A. (2003). A survey of industrial model predictive control technology. Automatica, 11(7), 733-764.
Ramesh, K., Shukor, S.R.A., and Aziz, N. (2009). Nonlinear model predictive control of a
36 Pornchai Bumroongsri, Pornpun Arundechachai, and Soorathep Kheawhom
distillation column using NARX model. Comp. Aid Ch., 27, 1575-1580.
Seborg, D.E., Edgar, T.F., and Mellichamp, D.A. (2004). Process Dynamics and Control, John Wiley & Sons, New York.
Sturm, J.F. (1999). Using SeDuMi 1.02, a Matlab toolbox for optimization over symmetric cones. Optim. Method Softw., 11(1), 625-653.
Suzuki, H., and Sugie, T. (2007). Model predictive control for linear parameter varying constrained systems using ellipsoidal set prediction. Int. J. Control, 80(2), 314-321.
Toth, R. (2010). Modeling and Identification of Linear Parameter-Varying Systems, Springer, London.
Yu, S., Böhm, C., Chen, H., and Allgöwer, F. (2012). Model predictive control of constrained LPV systems. Int. J. Control, 85(6), 671-683.
Dr. P. Bumroongsri is a lecturer in the Department of Chemical Engineering, Mahidol University. He received his B.Eng. from Chulalongkorn University in 2008. He obtained his M.Eng and D.Eng from Chulalongkorn University in 2009 and 2012, respectively. His current interests involve robust MPC synthesis, modeling and optimization in chemical processes.
P. Arundechachai is a graduate student in the Department of Chemical Engineering, Chulalongkorn University. She received her B.Eng from the Department of Chemical Engineering, Kon Kaen University in 2011. Her research interests are in optimization and printed electronics.
Dr. S. Kheawhom is an Assistant Professor in the Department of Chemical Engineering, Chulalongkorn University. He earned his B. Eng from Chulalongkorn University in 1997. He continued his study at the University of Tokyo where he received his M.Eng and Ph.D. in 2001 and 2004, respectively. He has been working on the use of statistics and optimization, life cycle and printed electronics.
Peer Review: This article has been internationally peer-reviewed and accepted for publication according to the guidelines in the journal’s website. Note: Original version of this article was accepted and presented at the Third International-Thai Chemical Engineering and Applied Chemistry (TIChE) Conference, jointly organized by Department of Chemical Engineering, Faculty of Engineering, Khon Kaen University and Thai Institute of Chemical Engineering and Applied Chemistry, at Pullman Khon Kaen Raja Orchid Hotel, Khon Kaen, THAILAND, October 17-18, 2013.
*Corresponding author (P.Bumroongsri). Tel: +66-2-8892138 Ext.6101. E-mail address: [email protected]. 2014. International Transaction Journal of Engineering, Management, & Applied Sciences & Technologies. Volume 5 No.1 ISSN 2228-9860 eISSN 1906-9642. Online available at http://tuengr.com/V05/0025.pdf .
37

:: International Transaction Journal of Engineering, Management, & Applied Sciences & Technologies
http://TuEngr.com
Call-for-Papers:
ITJEMAST invites you to submit high quality papers for full peer-review and possible publication in areas pertaining to our scope including engineering, science, management and technology, especially interdisciplinary/cross-disciplinary/multidisciplinary subjects.
Next article continue on next page
International Transaction Journal of Engineering, Management, & Applied Sciences & Technologies
http://TuEngr.com
Effect of Modeling Parameters on System Hydrodynamics of Air Reactor in Chemical Looping Combustion Using CFD Simulation
Piriya Laiarpatorn a, Pornpote Piumsomboon a,b, Benjapon Chalermsinsuwan a,b,*
a Department of Chemical Technology, Faculty of Science, Chulalongkorn University, THAILAND b Center of Excellence on Petrochemical and Materials Technology, Chulalongkorn University, THAILAND A R T I C L E I N F O
A B S T RA C T
Article history: Received 25 October 2013 Received in revised form 25 October 2013 Accepted 25 October 2013 Available online 25 October 2013 Keywords: Computational fluid dynamics; Chemical looping combustion; Modeling parameter; Multiphase flow
The system hydrodynamics or flow behavior of gas and solid particles was simulated using computational fluid dynamic (CFD) model inside air reactor of chemical looping combustion (CLC). The two fluid model or Euler-Euler model was selected to use together with the kinetic theory of granular flow model (KGTF). In this study, the effect of modeling parameters including drag coefficient model, specularity coefficient and restitution coefficient between solid particles were explored. The EMMS drag model gave the highest solid volume fraction inside the system due to the particle cluster assumption in the model development. The specularity coefficient and restitution coefficient between solid particles had slightly effect on the results. In addition, the obtained results were compared with literature experiment by Shuai et al. (2012). The radial profiles of solid concentration from CFD simulation were consistent with the experimental data. The conventional core-annulus flow structure was still observed in the air reactor.
2014 INT TRANS J ENG MANAG SCI TECH.
1. Introduction Nowadays, the amount of released CO2 into the atmosphere is the main reason for global
warming problem. The recent literature shows that the circulating fluidized bed (CFB)
2014 International Transaction Journal of Engineering, Management, & Applied Sciences & Technologies.
*Corresponding author (B.Chalermsinsuwan). E-mail address: [email protected] 2014. International Transaction Journal of Engineering, Management, & Applied Sciences & Technologies. Volume 5 No.1 ISSN 2228-9860 eISSN 1906-9642. Online available at http://tuengr.com/V05/0039.pdf .
39
technology has been widely applied in many industrial purposes. One of the applications is to
use CFB technology for CO2 capture from power generation using the chemical looping
combustion (CLC) (Shuai et al., 2012). In other CO2 capture processes, the separation of CO2
from the N2 requires significant energy and expense. However, CO2 separation is easily
achieved in CLC which provides a self sequestration of CO2 stream (Mahalatkar et al.,
2011a). The typical CLC is consisting of two fluidized bed reactors connecting together
(Shuai et al., 2012; Samruamphianskun et al., 2012). Fuel reactor is used for providing
oxygen from metal bed material for combustion reaction while air reactor is employed for
reducing the metal bed material before sending them back to the fuel reactor. Generally, the
metal bed material is an oxygen carrier for oxidizing or transferring oxygen in the air reactor.
For the research study about computational fluid dynamics simulation (CFD), Mahalatkar et
al. (2011b) successfully studied the CFD modeling of methane combustion in fuel reactor of
CLC system. The result demonstrated that CFD modeling could be an effective approach for
the designing of such reactor. Their CFD model precisely predicted the trends of flue gas
concentrations. For the CFD simulation of air reactor in CLC, Shuai et al. (2012) simulated
CFB with cluster structure-dependent (CSD) drag coefficient model. They observed that the
CSD drag coefficient model accurately predicted dynamic formation and dissolution of solid
particle clusters. The derivation of this model is based on the particle cluster concept in a
heterogeneous gas-solid particles flow system. Then, the model was used to predict system
hydrodynamics in CLC. The contour of solid particles was dense near the wall and dilute at
the center which generally called the core-annulus flow structure. Lu et al. (2011) revealed
that EMMS-based drag coefficient showed good physical predictability flow behavior of both
Geldart A and B in the riser. Still, in the previous literature, the suitable or optimum operating
condition for simulation of air reactor in CLC reactor system was not clearly studied.
In this study, the flow behavior of gas and solid particles was investigated using CFD
model inside air reactor of CLC. The main objective was to explain the obtained system
hydrodynamics dynamics inside CLC system. The selected numerical model to simulate flow
behavior of gas and solid particles was the two-fluid model or Euler-Euler model. This model
treats each phases as fully interpenetrating continua (Cruz et al., 2006; Samruamphianskun et
al., 2012). Different modeling parameters were varied to explore the effect of each parameter.
The obtained CFD simulation results were validated with the experimental results published
in the literature study.
40 Piriya Laiarpatorn, Pornpote Piumsomboon, and Benjapon Chalermsinsuwan
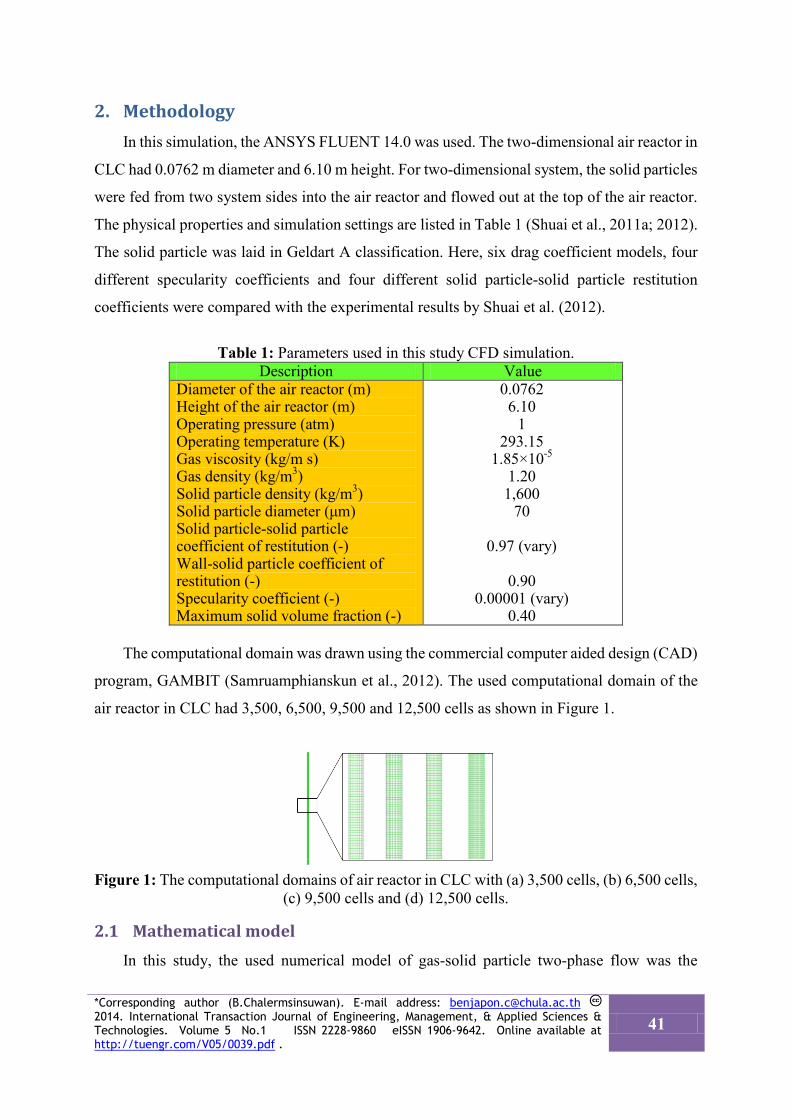
2. Methodology In this simulation, the ANSYS FLUENT 14.0 was used. The two-dimensional air reactor in
CLC had 0.0762 m diameter and 6.10 m height. For two-dimensional system, the solid particles
were fed from two system sides into the air reactor and flowed out at the top of the air reactor.
The physical properties and simulation settings are listed in Table 1 (Shuai et al., 2011a; 2012).
The solid particle was laid in Geldart A classification. Here, six drag coefficient models, four
different specularity coefficients and four different solid particle-solid particle restitution
coefficients were compared with the experimental results by Shuai et al. (2012).
Table 1: Parameters used in this study CFD simulation.
Description Value Diameter of the air reactor (m) Height of the air reactor (m) Operating pressure (atm) Operating temperature (K) Gas viscosity (kg/m s) Gas density (kg/m3) Solid particle density (kg/m3) Solid particle diameter (μm) Solid particle-solid particle coefficient of restitution (-) Wall-solid particle coefficient of restitution (-) Specularity coefficient (-) Maximum solid volume fraction (-)
0.0762 6.10
1 293.15
1.85×10⁻⁵ 1.20 1,600
70
0.97 (vary)
0.90 0.00001 (vary)
0.40
The computational domain was drawn using the commercial computer aided design (CAD)
program, GAMBIT (Samruamphianskun et al., 2012). The used computational domain of the
air reactor in CLC had 3,500, 6,500, 9,500 and 12,500 cells as shown in Figure 1.
Figure 1: The computational domains of air reactor in CLC with (a) 3,500 cells, (b) 6,500 cells,
(c) 9,500 cells and (d) 12,500 cells.
2.1 Mathematical model In this study, the used numerical model of gas-solid particle two-phase flow was the
*Corresponding author (B.Chalermsinsuwan). E-mail address: [email protected] 2014. International Transaction Journal of Engineering, Management, & Applied Sciences & Technologies. Volume 5 No.1 ISSN 2228-9860 eISSN 1906-9642. Online available at http://tuengr.com/V05/0039.pdf .
41
Euler-Euler (Eulerian) model. With this model, the conservation equations of mass and
momentum for the gas and solid particle phases were separately considered based on their
system hydrodynamic properties. For hydrodynamics study, the energy conservation for the gas
and solid phases was ignored (Shuai et al., 2011b; Chalermsinsuwan et al., 2012). The
temperature of gas phase and solid particle phase then was assumed to be a constant. The
conservation equations of mass, momentum and solid particle phase fluctuating energy with
their constitutive equations are summarized below. In this study, the constitutive equations
based on the kinetic theory of granular flow were needed to close the conservation equations.
2.1.1 Conservation equations
The mass conservation is balanced by the convective mass flux for the gas phase (g) and
the solid particle phase (s):
𝜕𝜕𝑡�𝜀𝑔𝜌𝑔� + ∇�𝜀𝑔𝜌𝑔𝑉𝑔� = 0 (1)
𝜕𝜕𝑡
(𝜀𝑠𝜌𝑠) + ∇(𝜀𝑠𝜌𝑠𝑉𝑠) = 0 (2)
where 𝜀 is the concentration of each phase, V is the velocity, 𝜌 is the density and t is the
time. Here, the mass exchange between the phases due to chemical reaction was not considered.
The momentum conservation equation is balanced by the convective mass fluxes and the
other forces such as pressure, gravity, stress tensor and momentum interphase exchange
coefficient.
𝜕𝜕𝑡�𝜀𝑔𝜌𝑔𝑉𝑔� + ∇�𝜀𝑔𝜌𝑔𝑉𝑔𝑉𝑔� = −𝜀𝑔∇𝑃 + ∇𝜏𝑔 + 𝜀𝑔𝜌𝑔𝑔 − 𝛽𝑔𝑠�𝑉𝑔 − 𝑉𝑠� (3)
𝜕𝜕𝑡
(𝜀𝑠𝜌𝑠𝑉𝑠) + ∇(𝜀𝑠𝜌𝑠𝑉𝑠𝑉𝑠) = −𝜀𝑠∇𝑃 + ∇𝜏𝑠 + 𝜀𝑠𝜌𝑠𝑔 + 𝛽𝑔𝑠�𝑉𝑔 − 𝑉𝑠� (4)
where g is the gravity acceleration, P is the pressure, 𝛽 is the interphase momentum
transfer coefficient or drag model and 𝜏 is the stress tensor.
The fluctuating kinetic energy conservation equation for the solid particles, as derived
from the kinetic theory of granular flow (Gidaspow, 1994; Gidaspow and Jiradilok, 2009;
Chalermsinsuwan et al., 2012), can be expressed as:
42 Piriya Laiarpatorn, Pornpote Piumsomboon, and Benjapon Chalermsinsuwan
32�𝜕𝜕𝑡
(𝜀𝑠𝜌𝑠𝜃) + ∇(𝜀𝑠𝜌𝑠𝜃)𝑉𝑠� = (−∇𝑃𝑠𝐼 + 𝜏𝑠) ∶ ∇𝑉𝑠 + ∇(𝐾𝑠∇𝜃) − 𝛾𝑠 (5)
where 𝜃 is the solid fluctuating kinetic energy, 𝐾𝑠 is the conductivity of solid fluctuating
kinetic energy, I is unit vector and 𝛾𝑠 is the collisional dissipation of solid fluctuating kinetic
energy.
2.1.2 Constitutive equations
The constitutive equations based on the kinetic theory of granular flow were needed to
close the conservation equations for solving this system of equations.
The stress tensor for gas and solid particle phases are described as:
𝜏𝑔 = 𝜀𝑔𝜇𝑔 �∇𝑉𝑔 + �∇𝑉𝑔�𝑇� −
23𝜀𝑔𝜇𝑔�∇𝑉𝑔�𝐼 (6)
𝜏𝑠 = 𝜀𝑠𝜇𝑠[∇𝑉𝑠 + (∇𝑉𝑠)𝑇] − 𝜀𝑠 �𝜉𝑠 −23𝜇𝑠� ∇𝑉𝑠𝐼 (7)
where 𝜇 is the viscosity of each phase and 𝜉𝑠 is the bulk viscosity of solid phase.
The particle pressure can be divided into two portions. The kinetic portion describes the
influence of particle translations, whereas the collisional portion accounts for the momentum
transfer by direct collisions.
𝑃𝑠 = 𝜀𝑠𝜌𝑠𝜃[1 + 2𝑔0𝜀𝑠(1 + 𝑒)] (8)
where 𝑔0 is the radial distribution function and e is the restitution coefficient between solid
particles.
The shear viscosity accounts for the tangential forces. The shear viscosity of solid particles
was then calculated using the formula below:
𝜇𝑠 =45𝜀𝑠𝜌𝑠𝑑𝑝𝑔0(1 + 𝑒)�
𝜃𝜋
+10𝜌𝑠𝑑𝑝
96(1 + 𝑒)𝑔0𝜀𝑠�1 +
45𝑔0𝜀𝑠(1 + 𝑒)�
2
(9)
where 𝑑𝑝 is the particle diameter.
*Corresponding author (B.Chalermsinsuwan). E-mail address: [email protected] 2014. International Transaction Journal of Engineering, Management, & Applied Sciences & Technologies. Volume 5 No.1 ISSN 2228-9860 eISSN 1906-9642. Online available at http://tuengr.com/V05/0039.pdf .
43
The bulk viscosity formulates the resistance of solid particles to comparison and
expansion.
𝜉𝑠 =43𝜀𝑠𝜌𝑠𝑑𝑝𝑔0(1 + 𝑒)�
𝜃𝜋
(10)
The radial distribution function is the probability of collisions between solid particles when
they become dense:
𝑔0 = �1 − �𝜀𝑠
𝜀𝑠,𝑚𝑎𝑥�13�
�
−1
(11)
where 𝜀𝑠,𝑚𝑎𝑥 is the volume fraction of solid phase at maximum packing condition.
The conductivity of the solid fluctuating kinetic energy specifies the diffusion of granular
energy as:
𝐾𝑠 =150𝜌𝑠𝑑𝑝√𝜃𝜋384(1 + 𝑒)𝑔0
�1 +65𝜀𝑠𝑔0(1 + 𝑒)�
2
+ 2𝜌𝑠𝜀𝑠2𝑑𝑝(1 + 𝑒)𝑔0�𝜃𝜋
(12)
The rate of dissipation of fluctuation kinetic energy due to solid particle collision is
expressed as:
𝛾𝑠 = 3(1 − 𝑒2)𝜀𝑠2𝜌𝑠𝑔0𝜃 �4𝑑𝑝�𝜃𝜋� (13)
2.1.3 Drag coefficient model
In this study, the commercial ANSYS FLUENT 14.0 program with six drag or interphase
exchanged coefficient models was explored. The drag coefficient model is the mathematical
function which represents the dynamics of solid particles that is described by the product of the
interphase momentum exchange coefficient and the slip velocity in the momentum transport
equations. The high and low values of drag coefficient model imply more and less
anti-translation force of solid particles inside the system, respectively. In this study, the
employed drag models were Wen and Yu model, Gidaspow model, Huilin-Gidaspow model,
Gibilaro model, Syamlal and O’Brien model and EMMS model (Fluent, Inc., 2011a, 2011b).
44 Piriya Laiarpatorn, Pornpote Piumsomboon, and Benjapon Chalermsinsuwan
The Syamlal-O’Brien model is based on measurements of the terminal velocities of solid
particles in fluidized or settling beds, with correlations that are a function of the volume
fraction and relative Reynolds number (Fluent, Inc., 2011a, 2011b).
𝛽𝑔𝑠 =34
(1 − 𝜀𝑔)𝜀𝑔𝑉𝑟,𝑠2 𝑑𝑝
𝜌𝑔𝑅𝑒𝑠𝑉𝑟,𝑠
𝐶𝐷�𝑉𝑔 − 𝑉𝑠� (14)
With
𝑉𝑟,𝑠 = 0.5 �𝐴 − 0.06𝑅𝑒𝑠 + �(0.06𝑅𝑒𝑠)2 + 0.12𝑅𝑒𝑠(2𝐵 − 𝐴) + 𝐴2� (15)
where 𝑉𝑟,𝑠 is terminal velocity correlation for the solid particle phase.
𝑅𝑒𝑠 =𝜀𝑔�𝑉𝑔 − 𝑉𝑠�𝑑𝑝
𝜇𝑔;𝐶𝐷 = �0.63 +
4.8�𝑅𝑒𝑠/𝑉𝑟,𝑠
�2
(16)
𝐴 = 𝜀𝑔4.14; for𝜀𝑔 ≤ 0.85, 𝐵 = 0.8𝜀𝑔1.28 and for 𝜀𝑔 > 0.85, 𝐵 = 𝜀𝑔2.65
The Wen and Yu model is appropriate for dilute system simulation (Wen and Yu, 1966).
𝛽𝑔𝑠 = 3
4(1−𝜀𝑔)𝜀𝑔
𝑑𝑝𝜌𝑔�𝑉𝑔 − 𝑉𝑠�𝐶𝐷0𝜀𝑔−2.65 (17),
where 𝐶𝐷 = 24𝜀𝑔𝑅𝑒𝑠
[1 + 0.15 ��1 − 𝜀𝑔�𝑅𝑒𝑠�0.687
,𝑅𝑒𝑠 = 𝜌𝑔𝑑𝑝�𝑉𝑠−𝑉𝑔�𝜇𝑔
The Gidaspow model is a combination of the Wen and Yu model equation for dilute phase
calculation and the Ergun equation for dense phase calculation (Gidaspow et al., 1992; Huilin
et al., 2003).
For 𝜀𝑔 > 0.8:
𝛽𝑔𝑠 =34�1 − 𝜀𝑔�𝜀𝑔
𝑑𝑝𝜌𝑔𝐶𝐷𝜀𝑔−2.65�𝑉𝑠 − 𝑉𝑔� (18)
For 𝜀𝑔 ≤ 0.8
𝛽𝑔𝑠 =150(1 − 𝜀𝑔)2𝜇𝑔
𝜀𝑔𝑑𝑝2+
1.75𝜌𝑔�1 − 𝜀𝑔��𝑉𝑠 − 𝑉𝑔�𝑑𝑝
(19)
*Corresponding author (B.Chalermsinsuwan). E-mail address: [email protected] 2014. International Transaction Journal of Engineering, Management, & Applied Sciences & Technologies. Volume 5 No.1 ISSN 2228-9860 eISSN 1906-9642. Online available at http://tuengr.com/V05/0039.pdf .
45
Huilin-Gidaspow model is also a combination of the Wen and Yu model and Ergun
equation. However, the smooth switch is provided by the function when the solid volume
fraction is less than 0.2. (Du et al., 2006):
𝛽𝑔𝑠 = Ψ𝛽𝑔𝑠−𝐸𝑟𝑔𝑢𝑛| + (1 −Ψ)𝛽𝑔𝑠−𝑊𝑒𝑛 𝑎𝑛𝑑 𝑌𝑢 (20)
Where Ψ = 12
+ arctan (262.5�1−𝜀𝑔�−0.2))𝜋
Gibilaro model provides the continuous single compact equation over the entire range of
voidages for a fluidized bed system (Du et al., 2006):
𝛽𝑔𝑠 = �18𝑅𝑒
+ 0.33�𝜌𝑓�𝑉𝑠 − 𝑉𝑔�
𝑑𝑝�1 − 𝜀𝑔�𝜀𝑔 − 1.8 (21)
with 𝑅𝑒 = 𝜀𝑔𝜌𝑔𝑑𝑝�𝑉𝑠−𝑉𝑔�𝜇𝑔
The last drag model is energy minimization multi-scale (EMMS) model that develops
based on the particle cluster concept. This drag model includes the effect of heterogeneous
structure parameters into the momentum interphase coefficient model (Chalermsinsuwan et al,
2009; 2010).
For 𝜀𝑔 ≤ 0.74:
𝛽𝑔𝑠 = 150�1 − 𝜀𝑔�
2𝜇𝑔
𝜀𝑔𝑑𝑝2+ 1.75
�1 − 𝜀𝑔�𝜌𝑔�𝑉𝑔 − 𝑉𝑠�𝑑𝑝
(22)
For 𝜀𝑔 > 0.74:
𝛽𝑔𝑠 =34�1 − 𝜀𝑔�𝜀𝑔
𝑑𝑝𝜌𝑔�𝑉𝑔 − 𝑉𝑠�𝐶𝐷0𝜔�𝜀𝑔� (23)
With
0.74 < 𝜀𝑔 ≤ 0.82;
𝜔�𝜀𝑔� = −0.5769 +0.0214
4�𝜀𝑔 − 0.7463�2
+ 0.0044 (24)
46 Piriya Laiarpatorn, Pornpote Piumsomboon, and Benjapon Chalermsinsuwan
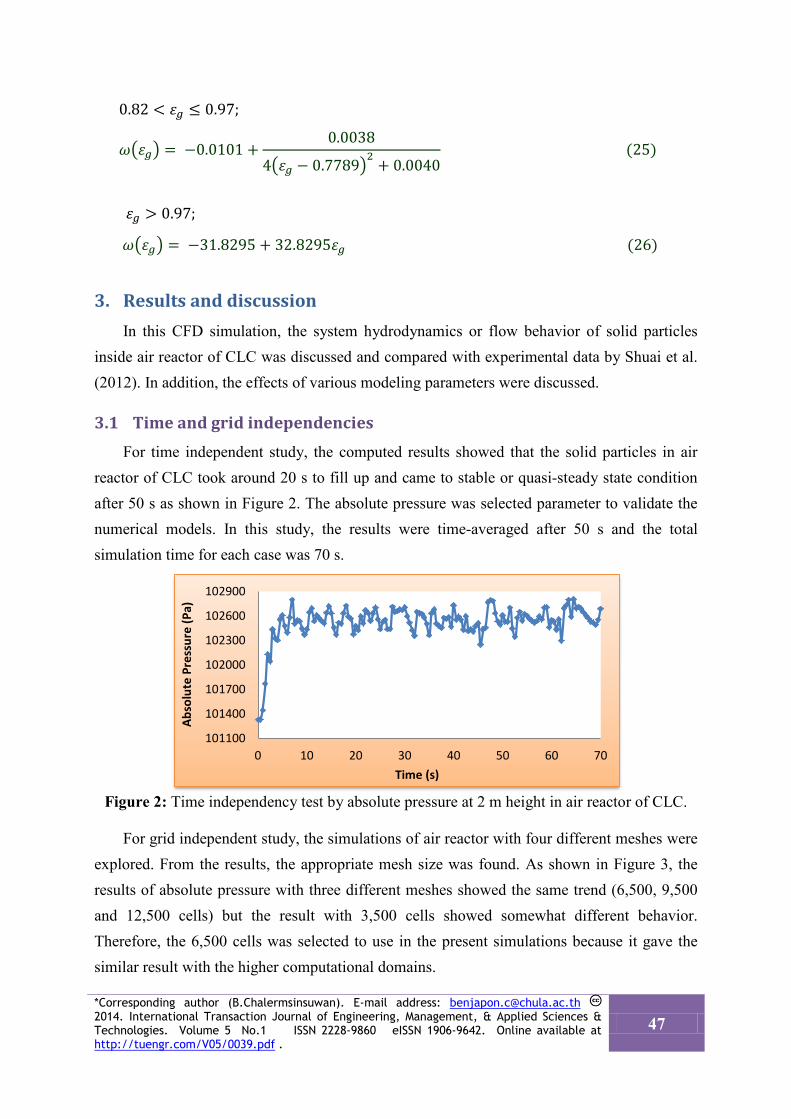
0.82 < 𝜀𝑔 ≤ 0.97;
𝜔�𝜀𝑔� = −0.0101 +0.0038
4�𝜀𝑔 − 0.7789�2
+ 0.0040 (25)
𝜀𝑔 > 0.97;
𝜔�𝜀𝑔� = −31.8295 + 32.8295𝜀𝑔 (26)
3. Results and discussion In this CFD simulation, the system hydrodynamics or flow behavior of solid particles
inside air reactor of CLC was discussed and compared with experimental data by Shuai et al. (2012). In addition, the effects of various modeling parameters were discussed.
3.1 Time and grid independencies For time independent study, the computed results showed that the solid particles in air
reactor of CLC took around 20 s to fill up and came to stable or quasi-steady state condition after 50 s as shown in Figure 2. The absolute pressure was selected parameter to validate the numerical models. In this study, the results were time-averaged after 50 s and the total simulation time for each case was 70 s.
Figure 2: Time independency test by absolute pressure at 2 m height in air reactor of CLC.
For grid independent study, the simulations of air reactor with four different meshes were
explored. From the results, the appropriate mesh size was found. As shown in Figure 3, the results of absolute pressure with three different meshes showed the same trend (6,500, 9,500 and 12,500 cells) but the result with 3,500 cells showed somewhat different behavior. Therefore, the 6,500 cells was selected to use in the present simulations because it gave the similar result with the higher computational domains.
101100
101400
101700
102000
102300
102600
102900
0 10 20 30 40 50 60 70
Abso
lute
Pre
ssur
e (P
a)
Time (s)
*Corresponding author (B.Chalermsinsuwan). E-mail address: [email protected] 2014. International Transaction Journal of Engineering, Management, & Applied Sciences & Technologies. Volume 5 No.1 ISSN 2228-9860 eISSN 1906-9642. Online available at http://tuengr.com/V05/0039.pdf .
47
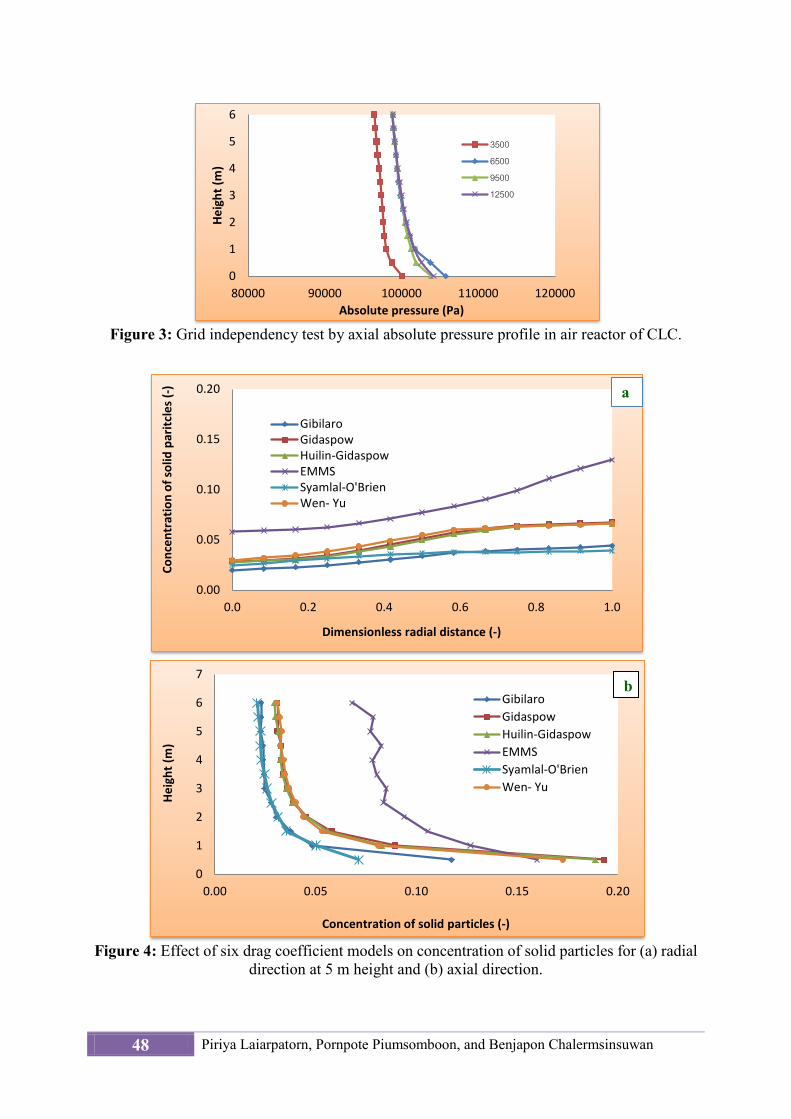
Figure 3: Grid independency test by axial absolute pressure profile in air reactor of CLC.
Figure 4: Effect of six drag coefficient models on concentration of solid particles for (a) radial
direction at 5 m height and (b) axial direction.
0
1
2
3
4
5
6
80000 90000 100000 110000 120000
Heig
ht (m
)
Absolute pressure (Pa)
3500
6500
9500
12500
0.00
0.05
0.10
0.15
0.20
0.0 0.2 0.4 0.6 0.8 1.0
Conc
entr
atio
n of
solid
par
itcle
s (-)
Dimensionless radial distance (-)
GibilaroGidaspowHuilin-GidaspowEMMSSyamlal-O'BrienWen- Yu
a
0
1
2
3
4
5
6
7
0.00 0.05 0.10 0.15 0.20
Heig
ht (m
)
Concentration of solid particles (-)
GibilaroGidaspowHuilin-GidaspowEMMSSyamlal-O'BrienWen- Yu
b
48 Piriya Laiarpatorn, Pornpote Piumsomboon, and Benjapon Chalermsinsuwan
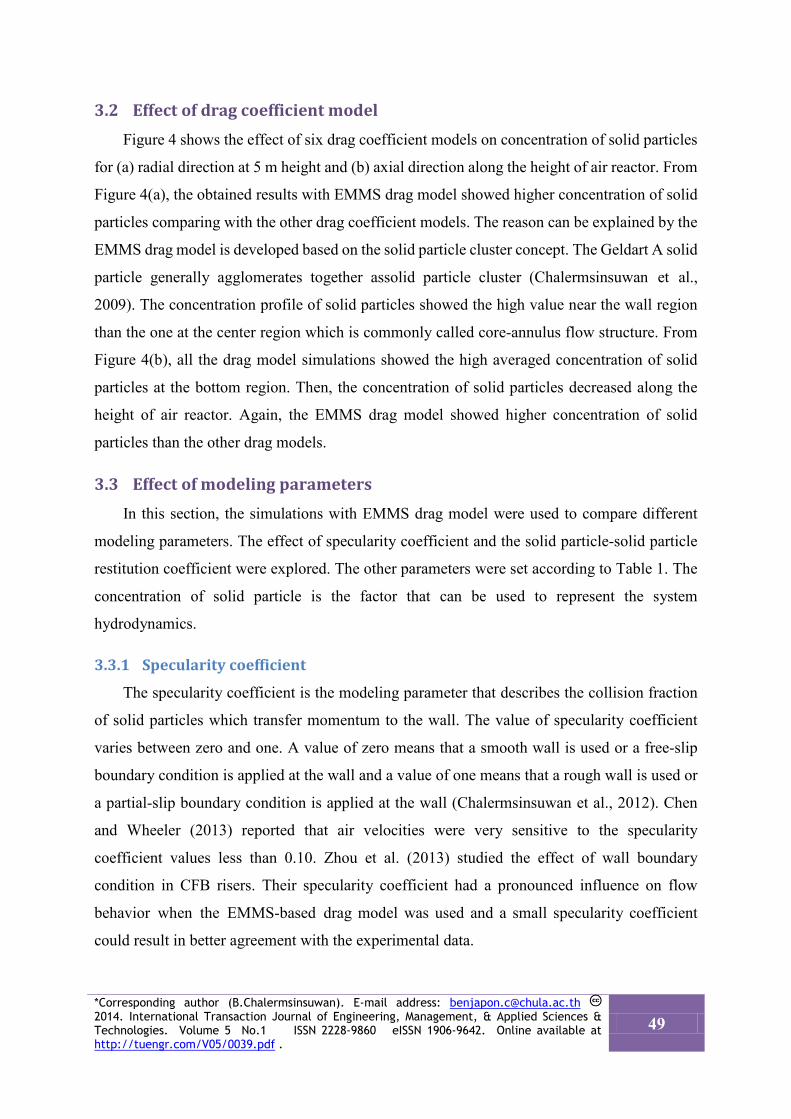
3.2 Effect of drag coefficient model Figure 4 shows the effect of six drag coefficient models on concentration of solid particles
for (a) radial direction at 5 m height and (b) axial direction along the height of air reactor. From
Figure 4(a), the obtained results with EMMS drag model showed higher concentration of solid
particles comparing with the other drag coefficient models. The reason can be explained by the
EMMS drag model is developed based on the solid particle cluster concept. The Geldart A solid
particle generally agglomerates together assolid particle cluster (Chalermsinsuwan et al.,
2009). The concentration profile of solid particles showed the high value near the wall region
than the one at the center region which is commonly called core-annulus flow structure. From
Figure 4(b), all the drag model simulations showed the high averaged concentration of solid
particles at the bottom region. Then, the concentration of solid particles decreased along the
height of air reactor. Again, the EMMS drag model showed higher concentration of solid
particles than the other drag models.
3.3 Effect of modeling parameters In this section, the simulations with EMMS drag model were used to compare different
modeling parameters. The effect of specularity coefficient and the solid particle-solid particle
restitution coefficient were explored. The other parameters were set according to Table 1. The
concentration of solid particle is the factor that can be used to represent the system
hydrodynamics.
3.3.1 Specularity coefficient
The specularity coefficient is the modeling parameter that describes the collision fraction
of solid particles which transfer momentum to the wall. The value of specularity coefficient
varies between zero and one. A value of zero means that a smooth wall is used or a free-slip
boundary condition is applied at the wall and a value of one means that a rough wall is used or
a partial-slip boundary condition is applied at the wall (Chalermsinsuwan et al., 2012). Chen
and Wheeler (2013) reported that air velocities were very sensitive to the specularity
coefficient values less than 0.10. Zhou et al. (2013) studied the effect of wall boundary
condition in CFB risers. Their specularity coefficient had a pronounced influence on flow
behavior when the EMMS-based drag model was used and a small specularity coefficient
could result in better agreement with the experimental data.
*Corresponding author (B.Chalermsinsuwan). E-mail address: [email protected] 2014. International Transaction Journal of Engineering, Management, & Applied Sciences & Technologies. Volume 5 No.1 ISSN 2228-9860 eISSN 1906-9642. Online available at http://tuengr.com/V05/0039.pdf .
49
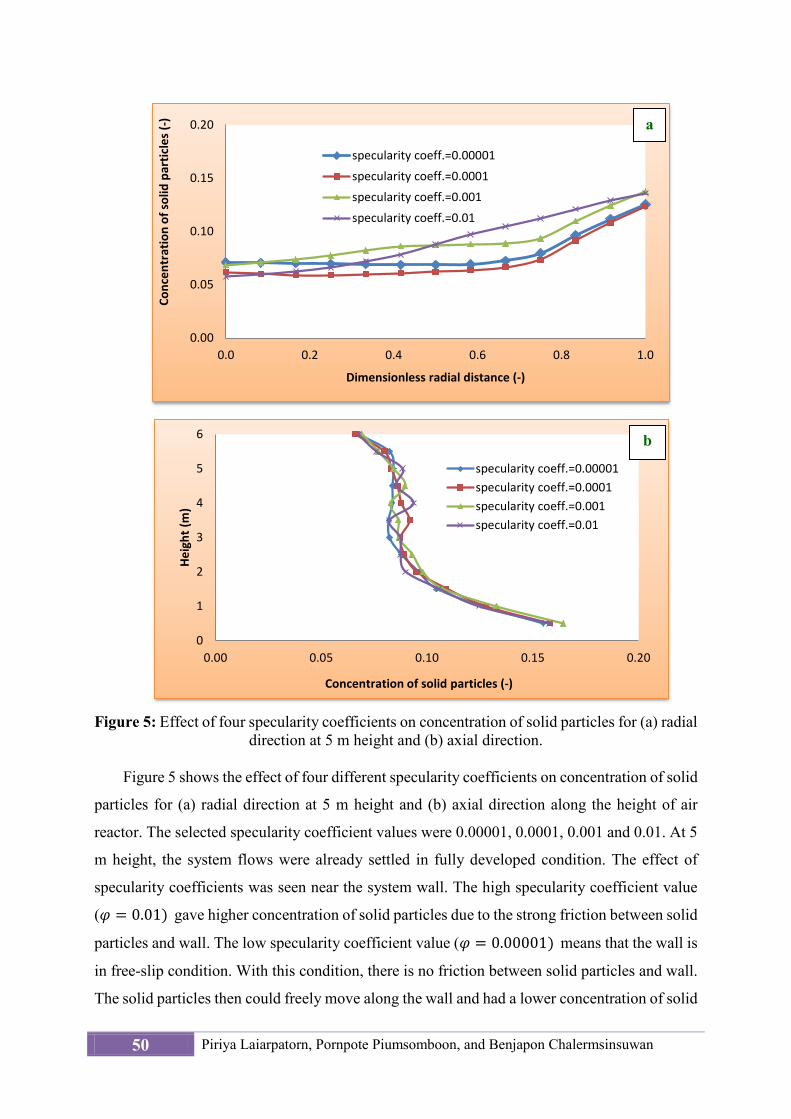
Figure 5: Effect of four specularity coefficients on concentration of solid particles for (a) radial
direction at 5 m height and (b) axial direction.
Figure 5 shows the effect of four different specularity coefficients on concentration of solid
particles for (a) radial direction at 5 m height and (b) axial direction along the height of air
reactor. The selected specularity coefficient values were 0.00001, 0.0001, 0.001 and 0.01. At 5
m height, the system flows were already settled in fully developed condition. The effect of
specularity coefficients was seen near the system wall. The high specularity coefficient value
(𝜑 = 0.01) gave higher concentration of solid particles due to the strong friction between solid
particles and wall. The low specularity coefficient value (𝜑 = 0.00001) means that the wall is
in free-slip condition. With this condition, there is no friction between solid particles and wall.
The solid particles then could freely move along the wall and had a lower concentration of solid
0.00
0.05
0.10
0.15
0.20
0.0 0.2 0.4 0.6 0.8 1.0
Conc
entr
atio
n of
solid
par
ticle
s (-)
Dimensionless radial distance (-)
specularity coeff.=0.00001specularity coeff.=0.0001specularity coeff.=0.001specularity coeff.=0.01
0
1
2
3
4
5
6
0.00 0.05 0.10 0.15 0.20
Heig
ht (m
)
Concentration of solid particles (-)
specularity coeff.=0.00001specularity coeff.=0.0001specularity coeff.=0.001specularity coeff.=0.01
a
b
50 Piriya Laiarpatorn, Pornpote Piumsomboon, and Benjapon Chalermsinsuwan
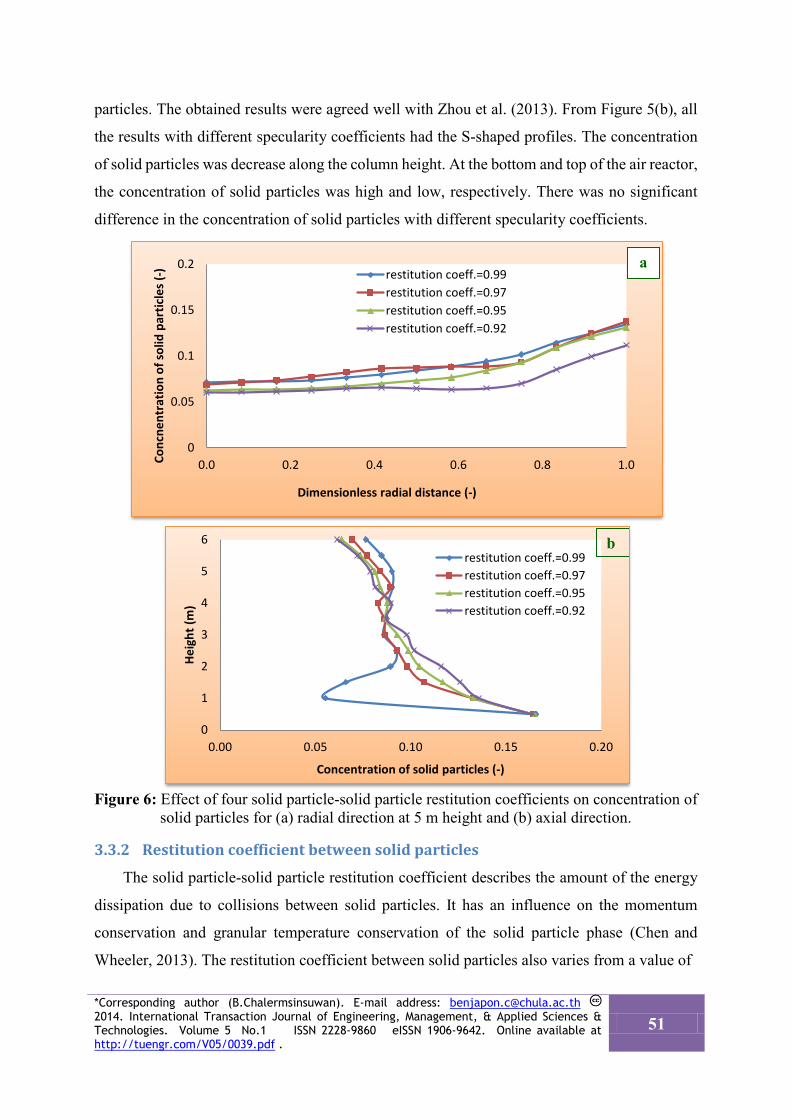
particles. The obtained results were agreed well with Zhou et al. (2013). From Figure 5(b), all
the results with different specularity coefficients had the S-shaped profiles. The concentration
of solid particles was decrease along the column height. At the bottom and top of the air reactor,
the concentration of solid particles was high and low, respectively. There was no significant
difference in the concentration of solid particles with different specularity coefficients.
Figure 6: Effect of four solid particle-solid particle restitution coefficients on concentration of
solid particles for (a) radial direction at 5 m height and (b) axial direction.
3.3.2 Restitution coefficient between solid particles
The solid particle-solid particle restitution coefficient describes the amount of the energy
dissipation due to collisions between solid particles. It has an influence on the momentum
conservation and granular temperature conservation of the solid particle phase (Chen and
Wheeler, 2013). The restitution coefficient between solid particles also varies from a value of
0
0.05
0.1
0.15
0.2
0.0 0.2 0.4 0.6 0.8 1.0Conc
nent
ratio
n of
solid
par
ticle
s (-)
Dimensionless radial distance (-)
restitution coeff.=0.99restitution coeff.=0.97restitution coeff.=0.95restitution coeff.=0.92
0
1
2
3
4
5
6
0.00 0.05 0.10 0.15 0.20
Heig
ht (m
)
Concentration of solid particles (-)
restitution coeff.=0.99restitution coeff.=0.97restitution coeff.=0.95restitution coeff.=0.92
b
a
*Corresponding author (B.Chalermsinsuwan). E-mail address: [email protected] 2014. International Transaction Journal of Engineering, Management, & Applied Sciences & Technologies. Volume 5 No.1 ISSN 2228-9860 eISSN 1906-9642. Online available at http://tuengr.com/V05/0039.pdf .
51
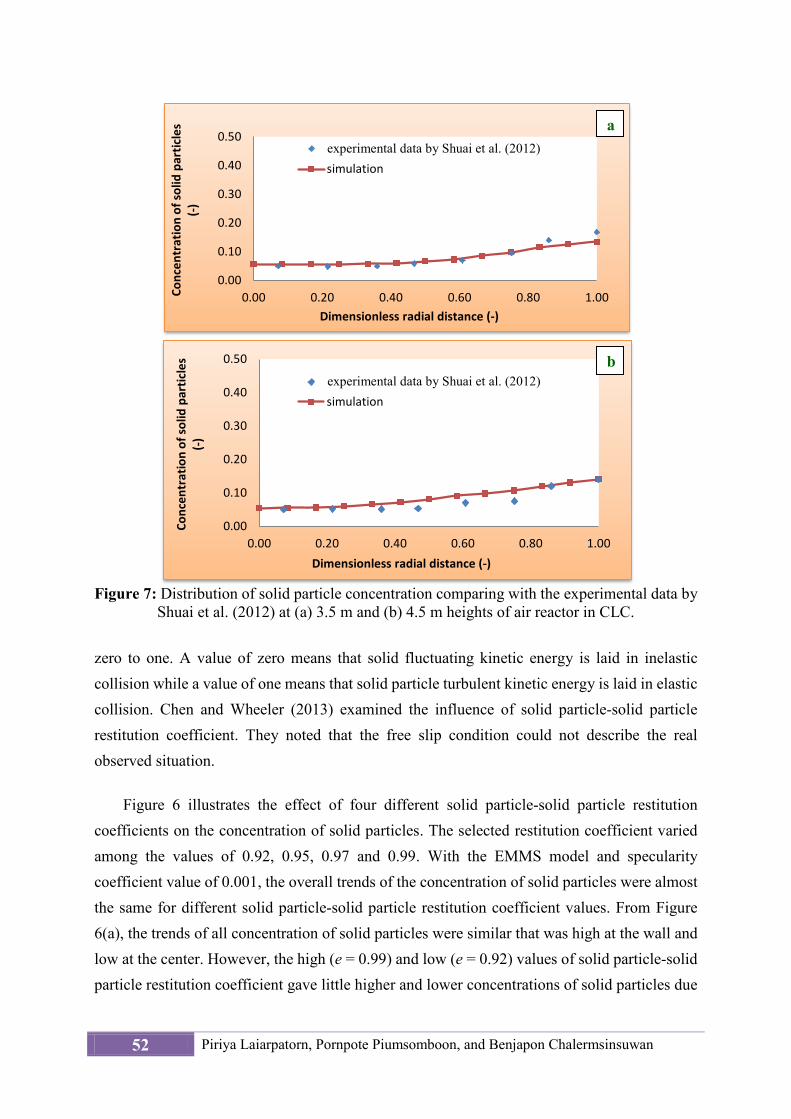
Figure 7: Distribution of solid particle concentration comparing with the experimental data by
Shuai et al. (2012) at (a) 3.5 m and (b) 4.5 m heights of air reactor in CLC.
zero to one. A value of zero means that solid fluctuating kinetic energy is laid in inelastic collision while a value of one means that solid particle turbulent kinetic energy is laid in elastic collision. Chen and Wheeler (2013) examined the influence of solid particle-solid particle restitution coefficient. They noted that the free slip condition could not describe the real observed situation.
Figure 6 illustrates the effect of four different solid particle-solid particle restitution
coefficients on the concentration of solid particles. The selected restitution coefficient varied among the values of 0.92, 0.95, 0.97 and 0.99. With the EMMS model and specularity coefficient value of 0.001, the overall trends of the concentration of solid particles were almost the same for different solid particle-solid particle restitution coefficient values. From Figure 6(a), the trends of all concentration of solid particles were similar that was high at the wall and low at the center. However, the high (e = 0.99) and low (e = 0.92) values of solid particle-solid particle restitution coefficient gave little higher and lower concentrations of solid particles due
0.00
0.10
0.20
0.30
0.40
0.50
0.00 0.20 0.40 0.60 0.80 1.00Conc
entr
atio
n of
solid
par
ticle
s (-)
Dimensionless radial distance (-)
Experimental data by Shuai et al., 2011simulation
0.00
0.10
0.20
0.30
0.40
0.50
0.00 0.20 0.40 0.60 0.80 1.00
Conc
entr
atio
n of
solid
par
ticle
s (-)
Dimensionless radial distance (-)
Experimental data by Shuai et al., 2011simulation
experimental data by Shuai et al. (2012)
experimental data by Shuai et al. (2012)
a
b
52 Piriya Laiarpatorn, Pornpote Piumsomboon, and Benjapon Chalermsinsuwan
to the amount of elastic solid particle collision and energy loss. This explanation is confirmed in Figure 6(b) which shows high concentration of solid particles at the bottom and low at the top of the air reactor. The result supports to the experimental data by Chen and Wheeler (2013) that high value of solid particle-solid particle restitution coefficient resulted in high concentration of solid particles in the top section.
3.4 Comparison with Shuai et al. (2012) experiments In order to compare the quantitative result with the results by Shuai et al. (2012), the result
with optimum modeling condition was shown in Figure 7. The suitable condition that got closely quantitative result with the experimental data used the EMMS drag model with the specularity coefficient of 0.01 and the solid particle-solid particle restitution coefficient of 0.97. The results gave high and low concentrations of solid particles at the wall and center, respectively. The profile of concentration of solid particles was the conventional core-annulus flow structure.
4. Conclusion This study used CFD commercial program, ANSYS FLUENT 14.0, to simulate the flow
behavior of gas and solid particles in the air reactor of CLC with different modeling parameters. The drag coefficient model, specularity coefficient and solid particle-solid particle restitution coefficient were explored. The solid volume fraction result with EMMS drag model was higher than the other drag models due to the effect of solid particle cluster in model development. The specularity coefficient and restitution coefficient between solid particles had slightly effect on the results. The EMMS drag model, the specularity coefficient of 0.01 and solid particle-solid particle restitution coefficient of 0.97 gave similar result with the experiment by Shuai et al. (2012). It correctly predicted the trends of the observed radial concentration of solid particles. Then, the system hydrodynamics of solid particles was shown. All the results had the similar trend that dense solid particles were formed near the wall and dilute solid particles were occurred at the center. The simulation showed the formation of the core-annular flow structure in the air reactor (Huilin and Gidaspow, 2003).
5. Acknowledgements This study was financially supported by the Grants from PETRO-MAT and SC-CU, also
partially supported by TRF and CHED (MRG5580140), the Grants for Development of New Faculty Staff by CU and the CU Graduate School Thesis Grant.
*Corresponding author (B.Chalermsinsuwan). E-mail address: [email protected] 2014. International Transaction Journal of Engineering, Management, & Applied Sciences & Technologies. Volume 5 No.1 ISSN 2228-9860 eISSN 1906-9642. Online available at http://tuengr.com/V05/0039.pdf .
53
6. References Chalermsinsuwan, B., P. Piumsomboon, D. Gidaspow. (2009) Kinetic theory based
computation of PSRI riser: Part I–Estimate of mass transfer coefficient. Chemical Engineering Science, 64, 1195–1211.
Chalermsinsuwan, B., P. Kuchonthara and P. Piumsomboon. (2010) CFD modeling of tapered circulating fluidized bed reactor risers: Hydrodynamic descriptions and chemical reaction responses. Chemical Engineering and Processing, 49, 1144–1160.
Chalermsinsuwan, B., T. Chanchuey, W. Buakhao, D.Gidaspow and P. Piumsomboon. (2012) Computational fluid dynamics of circulating fluidized bed downer: Study of modeling parameters and system hydrodynamic characteristics. Chemical Engineering Journal, 189-190, 314–335.
Chen X. and C. Wheeler. (2013) Computational Fluid Dynamics (CFD) modelling of transfer chutes: A study of the influence of model parameters. Chemical Engineering Science, 95, 194–202.
Cruz, E., F.R. Steward and T. Pugsley. (2006) New closure models for CFD modeling of high-density circulating fluidized beds. Powder Technology, 169, 115–122.
Du, W., X. Bao, J. Xu and W. Wei. (2006) Computational fluid dynamic (CFD) modeling of spouted bed: Assessment of drag coefficient correlations. Chemical Engineering Science, 61, 1401–1420.
Fluent Inc. (2011a) Fluent 14.0 User's Guide, Fluent Inc., USA.
Fluent Inc. (2011b) Fluent 14.0 Theory Guide, Fluent Inc., USA.
Gidaspow, D., R. Bezburuah, and J. Ding. (1992) Hydrodynamics of Circulating Fluidized Beds, Kinetic Theory Approach. In Fluidization VII, Proceedings of the 7th Engineering Foundation Conference on Fluidization, 75–82.
Gidaspow, D. (1994) Multiphase Flow, Fluidization: Continuum, Kinetic Theory Description. Acedemic Press, Boston.
Gidaspow, D. and V. Jiradilok. (2009) Computational Techniques the Multiphase CFD Approach to Fluidization and Green Energy Technologies. Energy Science, New York.
Huilin L. and D. Gidaspow. (2003) Hydrodynamics of binary fluidization in a riser: CFD simulation using two granular temperatures. Chemical Engineering Science, 58, 3777–3792.
Huilin, L., D. Gidaspow, J. Bouillard, L.Wentie. (2003) Hydrodynamic simulation of gas-solid flow in a riser using kinetic theory of granular flow. Chemical Engineering Journal, 95, 1–13.
Lu, B., W. Wang and J. Li. (2011) Eulerian simulation of gas-solid flows with particles of Geldart group A, B and D using EMMS-based meso-scale model. Chemical Engineering Science, 66. 4624–4635.
Mahalatkar, K., J. Kuhlman, E. Huckaby and T. O’Brien. (2011a) Computational fluid dynamic simulations of chemical looping fuel reactors utilizing gaseous fuels. Chemical Engineering Science, 66, 469–479.
54 Piriya Laiarpatorn, Pornpote Piumsomboon, and Benjapon Chalermsinsuwan
Mahalatkar, K., J. Kuhlman, E. Huckaby and T. O’Brien. (2011b) CFD simulation of a chemical-looping fuel reactor utilizing solid fuel. Chemical Engineering Science, 66, 3617–3627.
Samruamphianskun, T., P. Piumsomboon and B. Chalermsinsuwan. (2012) Effect of ring baffle configurations in a circulating fkuidized bed riser using CFD simulation and experimental design analysis. Chemical Engineering Journal, 210, 237–251.
Shuai, W., L. Huilin, L. Guodong, S. Zhiheng, X. Pengfei and D. Gidaspow. (2011a) Modeling of cluster structure-dependent drag with Eulerian approach for circulating fluidized beds. Powder Technology, 208, 98–110.
Shuai, W., L. Guodong, L. Huilin, C. Juhui, H. Yurong and W. Jiaxing. (2011b) Fluid dynamic simulation in a chemical looping combustion with two interconnected fluidized beds. Fuel Processing Technology, 92, 385–393.
Shuai, W., G. Jianmin, L. Huilin, L. Goudong, X. Pengfei and S. Liyan. (2012) Simulation of flow behavior of particles by cluster structure-dependent drag coefficient model for chemical looping combustion process: Air reactor. Fuel Processing Technology, 104, 219–233.
Wen, C.-Y. and Y. H. Yu. (1966) Mechanics of Fluidization. Chemical Engineering Progress Symposium Series, 62, 100–111.
Zhou, X., J. Gao, C. Xu and X. Lan. (2013) Effect of wall boundary condition on CFD simulation of CFB risers. Particuology, 11, 556–565.
Piriya Laiarpatorn is a master degree student of Department of Chemical Technology at Faculty of Science, Chulalongkorn University. She received her B.Eng. from Chiangmai University in 2012. Her research interest relates to computational fluid dynamics simulation.
Dr. Pornpote Piumsomboon is an Associate Professor of Department of Chemical Technology at Faculty of Science, Chulalongkorn University. He hold a B.Sc. in chemical engineering from Chulalongkorn University, M.E. in chemical engineering and industrial engineering from Lamar University in USA and Ph.D. degree in chemical engineering from the University of New Brunswick in Canada. His research interest relates to proton exchange membrane fuel cell and circulating fluidized bed technology. He has published more than 30 articles in professional journals and published 2 books.
Dr. Benjapon Chalermsinsuwan is an Assistant Professor of Department of Chemical Technology at Faculty of Science, Chulalongkorn University. He hold a B.Sc. in chemical engineering from Chulalongkorn university and Ph.D. degree in chemical technology from Chulalongkorn university. His research interest relates to computational fluid dynamics simulation, experimental design and analysis, carbon dioxide capture and circulating fluidized bed technology.
Peer Review: This article has been internationally peer-reviewed and accepted for publication according to the guidelines in the journal’s website. Note: Original version of this article was accepted and presented at the Third International-Thai Chemical Engineering and Applied Chemistry (TIChE) Conference, jointly organized by Department of Chemical Engineering, Faculty of Engineering, Khon Kaen University and Thai Institute of Chemical Engineering and Applied Chemistry, at Pullman Khon Kaen Raja Orchid Hotel, Khon Kaen, THAILAND, October 17-18, 2013.
*Corresponding author (B.Chalermsinsuwan). E-mail address: [email protected] 2014. International Transaction Journal of Engineering, Management, & Applied Sciences & Technologies. Volume 5 No.1 ISSN 2228-9860 eISSN 1906-9642. Online available at http://tuengr.com/V05/0039.pdf .
55

:: International Transaction Journal of Engineering, Management, & Applied Sciences & Technologies
http://TuEngr.com
Call-for-Papers:
ITJEMAST invites you to submit high quality papers for full peer-review and possible publication in areas pertaining to our scope including engineering, science, management and technology, especially interdisciplinary/cross-disciplinary/multidisciplinary subjects.
Next article continue on next page
International Transaction Journal of Engineering, Management, & Applied Sciences & Technologies
http://TuEngr.com
Flow Behavior of Geldart A and Geldart C Particles in a Co-current Downflow Circulating Fluidized Bed Reactor
Parinya Khongprom a,b*, Piyanat Soontarose a,b, Sirilux Manchandrarat a,b, Sunun Limtrakul c, and Terdthai Vatanatham c
a Department of Industrial Chemistry Faculty of Applied Science, King Mongkut’s University of Technology North Bangkok, THAILAND b Integrated Nanoscience Research Center, Science and Technology Research Institute, King Mongkut’s University of Technology North Bangkok, THAILAND c Department of Chemical Engineering, Faculty of Engineer, Kasetsart University, THAILAND A R T I C L E I N F O
A B S T RA C T
Article history: Received 20 August 2013 Accepted 06 December 2013 Available online 09 December 2013 - Keywords: Geldart particle; Downer reactor; Simulation; CFD; Two-fluid model.
The purpose of this research is to study the effect of Geldart A and C particles on the hydrodynamics behavior in a 9.3 m height, 0.1 m diameter co-current downflow circulating fluidized bed (downer reactor) using CFD simulation. Two-fluid model with kinetic theory of granular flow was adopted to predict flow behavior in the system. The simulation results show that hydrodynamics behavior in the downer strongly depends on the type of the particle. Geldart C particle exhibits a more uniform distribution along the lateral direction as compared with Geldart A particle. In addition, the effects of operating conditions were also studied. The uniformity of lateral direction of solids fraction increases with decreasing of solids circulation rate (Gs) or increasing of inlet superficial gas velocity (Ug). However, the radial distributions of gas and solids velocity are more uniform when Ug decreases especially for Geldart C particle.
2014 INT TRANS J ENG MANAG SCI TECH. .
2014 International Transaction Journal of Engineering, Management, & Applied Sciences & Technologies.
*Corresponding author (P. Khongprom). Tel/Fax: +66-2-5552000 Ext.4811. E-mail addresses: [email protected] 2014. International Transaction Journal of Engineering, Management, & Applied Sciences & Technologies. Volume 5 No.1 ISSN 2228-9860 eISSN 1906-9642. Online available at http://tuengr.com/V05/0057.pdf .
57
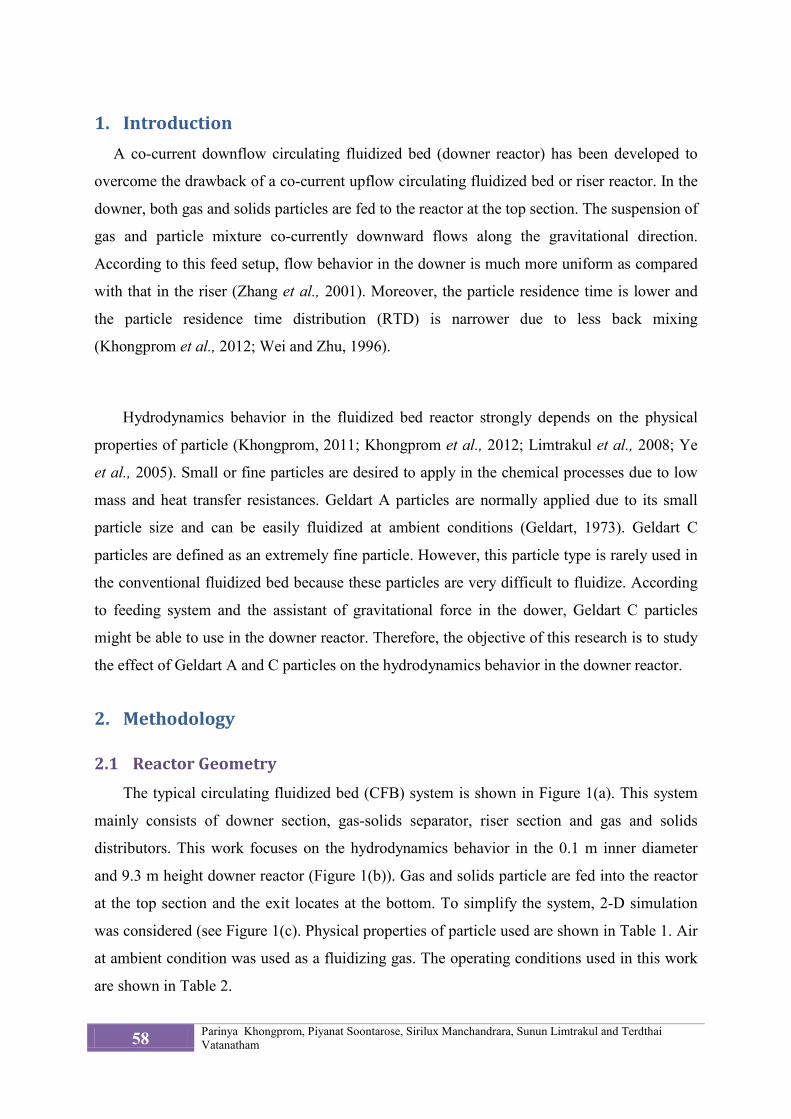
1. Introduction A co-current downflow circulating fluidized bed (downer reactor) has been developed to
overcome the drawback of a co-current upflow circulating fluidized bed or riser reactor. In the
downer, both gas and solids particles are fed to the reactor at the top section. The suspension of
gas and particle mixture co-currently downward flows along the gravitational direction.
According to this feed setup, flow behavior in the downer is much more uniform as compared
with that in the riser (Zhang et al., 2001). Moreover, the particle residence time is lower and
the particle residence time distribution (RTD) is narrower due to less back mixing
(Khongprom et al., 2012; Wei and Zhu, 1996).
Hydrodynamics behavior in the fluidized bed reactor strongly depends on the physical
properties of particle (Khongprom, 2011; Khongprom et al., 2012; Limtrakul et al., 2008; Ye
et al., 2005). Small or fine particles are desired to apply in the chemical processes due to low
mass and heat transfer resistances. Geldart A particles are normally applied due to its small
particle size and can be easily fluidized at ambient conditions (Geldart, 1973). Geldart C
particles are defined as an extremely fine particle. However, this particle type is rarely used in
the conventional fluidized bed because these particles are very difficult to fluidize. According
to feeding system and the assistant of gravitational force in the dower, Geldart C particles
might be able to use in the downer reactor. Therefore, the objective of this research is to study
the effect of Geldart A and C particles on the hydrodynamics behavior in the downer reactor.
2. Methodology
2.1 Reactor Geometry The typical circulating fluidized bed (CFB) system is shown in Figure 1(a). This system
mainly consists of downer section, gas-solids separator, riser section and gas and solids
distributors. This work focuses on the hydrodynamics behavior in the 0.1 m inner diameter
and 9.3 m height downer reactor (Figure 1(b)). Gas and solids particle are fed into the reactor
at the top section and the exit locates at the bottom. To simplify the system, 2-D simulation
was considered (see Figure 1(c). Physical properties of particle used are shown in Table 1. Air
at ambient condition was used as a fluidizing gas. The operating conditions used in this work
are shown in Table 2.
58 Parinya Khongprom, Piyanat Soontarose, Sirilux Manchandrara, Sunun Limtrakul and Terdthai Vatanatham
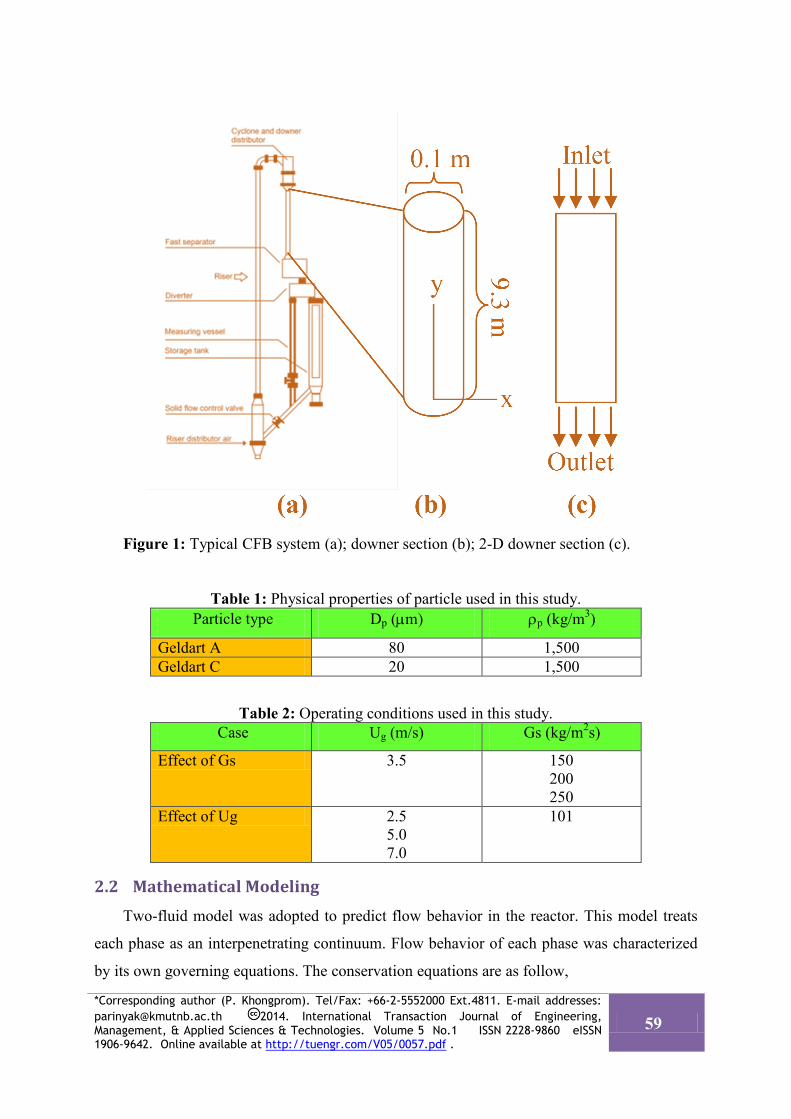
Figure 1: Typical CFB system (a); downer section (b); 2-D downer section (c).
Table 1: Physical properties of particle used in this study. Particle type Dp (µm) ρp (kg/m3)
Geldart A 80 1,500 Geldart C 20 1,500
Table 2: Operating conditions used in this study. Case Ug (m/s) Gs (kg/m2s)
Effect of Gs 3.5 150 200 250
Effect of Ug 2.5 5.0 7.0
101
2.2 Mathematical Modeling Two-fluid model was adopted to predict flow behavior in the reactor. This model treats
each phase as an interpenetrating continuum. Flow behavior of each phase was characterized
by its own governing equations. The conservation equations are as follow,
*Corresponding author (P. Khongprom). Tel/Fax: +66-2-5552000 Ext.4811. E-mail addresses: [email protected] 2014. International Transaction Journal of Engineering, Management, & Applied Sciences & Technologies. Volume 5 No.1 ISSN 2228-9860 eISSN 1906-9642. Online available at http://tuengr.com/V05/0057.pdf .
59
The continuity equation for phase q is expressed as:
( ) ( ) 0=⋅∇+
∂∂
qqqqq ut
ραρα (1)
where t stands for time (s), qα the volume fraction, qρ the density (kg/m3), and qu the
velocity vector (m/s).
Momentum conservation equation for gas phase is
( ) ( ) )(, gpgpgtuggggggggggg uugpuuut
−+⋅∇+⋅∇++∇−=⋅∇+∂∂ βττρααραρα (2)
where p is gas pressure (Pa), g gravitational acceleration (m/s2), gτ and gtu ,τ the viscous
stress tensor and the Reynolds stress tensor, respectively (Pa), gpβ the interphase momentum
transfer coefficient (kg/m3s).
Momentum conservation equation for solids phase (p) is
( ) ( ))(
,
pgpg
ppptupppppppppp
uu
gppuuut
−
++⋅∇+⋅∇+∇−∇−=⋅∇+∂∂
β
ρατταραρα (3)
Interphase momentum transfer coefficient (Gidaspow’s drag model) is defined as
For αg ≤ 0.80: ( )p
pggg
pg
gggp d
uu
d
−−+
−=
ρα
αµα
β)1(
75.11
150 2
2
(4)
For αg > 0.80: ( ) 65.21
43 −−
−= gDpgg
p
gggp Cuu
dαρ
ααβ (5)
where g
ppggg duu
µ
αρ
−=Re (6)
where µ is gas viscosity (kg/m.s), dp particle diameter (m), CD drag coefficient (-).
Granular temperature conservation can be expressed in the form
60 Parinya Khongprom, Piyanat Soontarose, Sirilux Manchandrara, Sunun Limtrakul and Terdthai Vatanatham
( ) ( ) ( ) ( ) pppppppppppppp kuIput
φγταραρ +−Θ∇⋅∇+∇+−=
Θ⋅∇+Θ∂∂
ΘΘ :
23 (7)
where Θp is granular temperature (m2/s2), I unit tensor (-), kΘp diffusion coefficient of
granular temperature (kg/m.s), Θγ collisional dissipation of solid fluctuating energy (kg/ms3),
pφ energy exchange between phases (kg/ms3).
The detail of this model has been discussed in previous works (Khongprom, 2011;
Khongprom et al., 2012).
k-ε turbulent model was used to explain the turbulent in the system. k equation for q
phase is defined as
( ) ( ) ( )
qqq
qtuqppqp
pp
ptuqppq
qqpppqpqqqqqkqqk
qtuqqqqqqqq
uuKuuK
kCkCKGkkukt
ασα
µα
σαµ
εραασµ
αραρα
∇−+∇−
−−+−+
∇⋅∇=⋅∇+
∂∂
,,
,,
).().(
(
(8)
where kq is the turbulent kinetic energy (m2/s2), Gk production of turbulent kinetic energy
(kg/ms3), εq turbulent dissipation rate (m2/s3), Kpq turbulent momentum transfer coefficient
(kg/m3s), pσ turbulent Prandtl number.
Turbulent dissipation rate (ε) is expressed in the form
( ) ( ) [
[
∇−+∇−−−
+−+
∇⋅∇=⋅∇+
∂∂
qqq
qtuqppqq
ptuqppqqqpppqpqs
qqqqkqq
qtuqqqqqqqq
uuKuuKkCkCKC
CGCk
ut
ασα
µα
ραµ
ερααε
εσµ
αεραερα εεε
,,3
2,1,
).()()(
(9)
where εq is turbulent dissipation rate (m2/s3), C1ε, C2ε, C3ε turbulent constants.
The kinetic theory of granular flow was used to predict the fluid properties of solids
phase such as solids viscosity and solids pressure. The detail of this model was described
somewhere else (Gidaspow, 1994). *Corresponding author (P. Khongprom). Tel/Fax: +66-2-5552000 Ext.4811. E-mail addresses: [email protected] 2014. International Transaction Journal of Engineering, Management, & Applied Sciences & Technologies. Volume 5 No.1 ISSN 2228-9860 eISSN 1906-9642. Online available at http://tuengr.com/V05/0057.pdf .
61
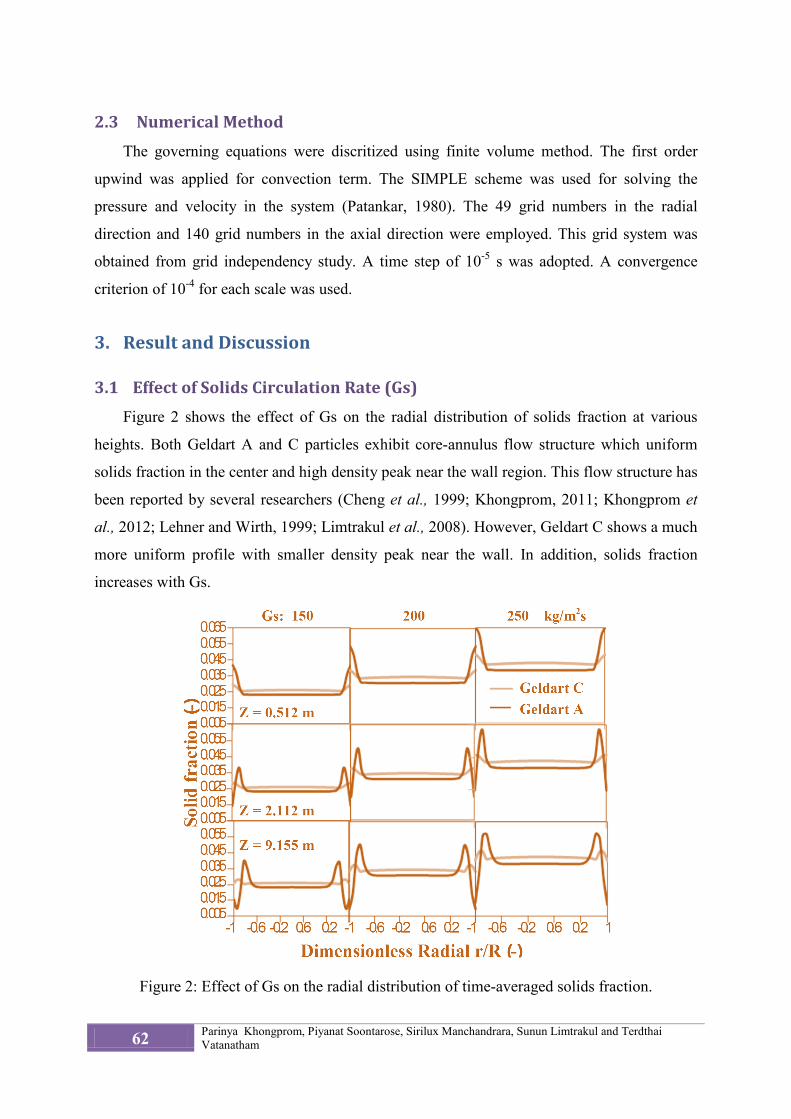
2.3 Numerical Method The governing equations were discritized using finite volume method. The first order
upwind was applied for convection term. The SIMPLE scheme was used for solving the
pressure and velocity in the system (Patankar, 1980). The 49 grid numbers in the radial
direction and 140 grid numbers in the axial direction were employed. This grid system was
obtained from grid independency study. A time step of 10-5 s was adopted. A convergence
criterion of 10-4 for each scale was used.
3. Result and Discussion
3.1 Effect of Solids Circulation Rate (Gs) Figure 2 shows the effect of Gs on the radial distribution of solids fraction at various
heights. Both Geldart A and C particles exhibit core-annulus flow structure which uniform
solids fraction in the center and high density peak near the wall region. This flow structure has
been reported by several researchers (Cheng et al., 1999; Khongprom, 2011; Khongprom et
al., 2012; Lehner and Wirth, 1999; Limtrakul et al., 2008). However, Geldart C shows a much
more uniform profile with smaller density peak near the wall. In addition, solids fraction
increases with Gs.
Figure 2: Effect of Gs on the radial distribution of time-averaged solids fraction.
62 Parinya Khongprom, Piyanat Soontarose, Sirilux Manchandrara, Sunun Limtrakul and Terdthai Vatanatham
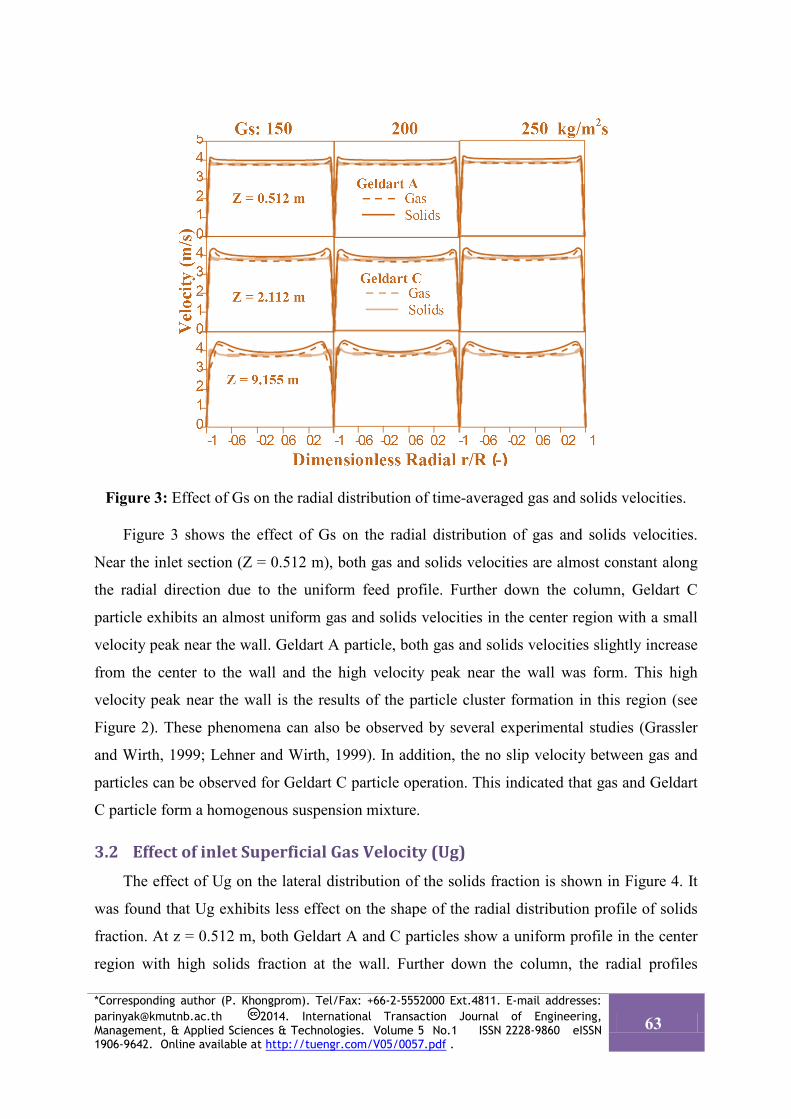
Figure 3: Effect of Gs on the radial distribution of time-averaged gas and solids velocities.
Figure 3 shows the effect of Gs on the radial distribution of gas and solids velocities.
Near the inlet section (Z = 0.512 m), both gas and solids velocities are almost constant along
the radial direction due to the uniform feed profile. Further down the column, Geldart C
particle exhibits an almost uniform gas and solids velocities in the center region with a small
velocity peak near the wall. Geldart A particle, both gas and solids velocities slightly increase
from the center to the wall and the high velocity peak near the wall was form. This high
velocity peak near the wall is the results of the particle cluster formation in this region (see
Figure 2). These phenomena can also be observed by several experimental studies (Grassler
and Wirth, 1999; Lehner and Wirth, 1999). In addition, the no slip velocity between gas and
particles can be observed for Geldart C particle operation. This indicated that gas and Geldart
C particle form a homogenous suspension mixture.
3.2 Effect of inlet Superficial Gas Velocity (Ug) The effect of Ug on the lateral distribution of the solids fraction is shown in Figure 4. It
was found that Ug exhibits less effect on the shape of the radial distribution profile of solids
fraction. At z = 0.512 m, both Geldart A and C particles show a uniform profile in the center
region with high solids fraction at the wall. Further down the column, the radial profiles
*Corresponding author (P. Khongprom). Tel/Fax: +66-2-5552000 Ext.4811. E-mail addresses: [email protected] 2014. International Transaction Journal of Engineering, Management, & Applied Sciences & Technologies. Volume 5 No.1 ISSN 2228-9860 eISSN 1906-9642. Online available at http://tuengr.com/V05/0057.pdf .
63
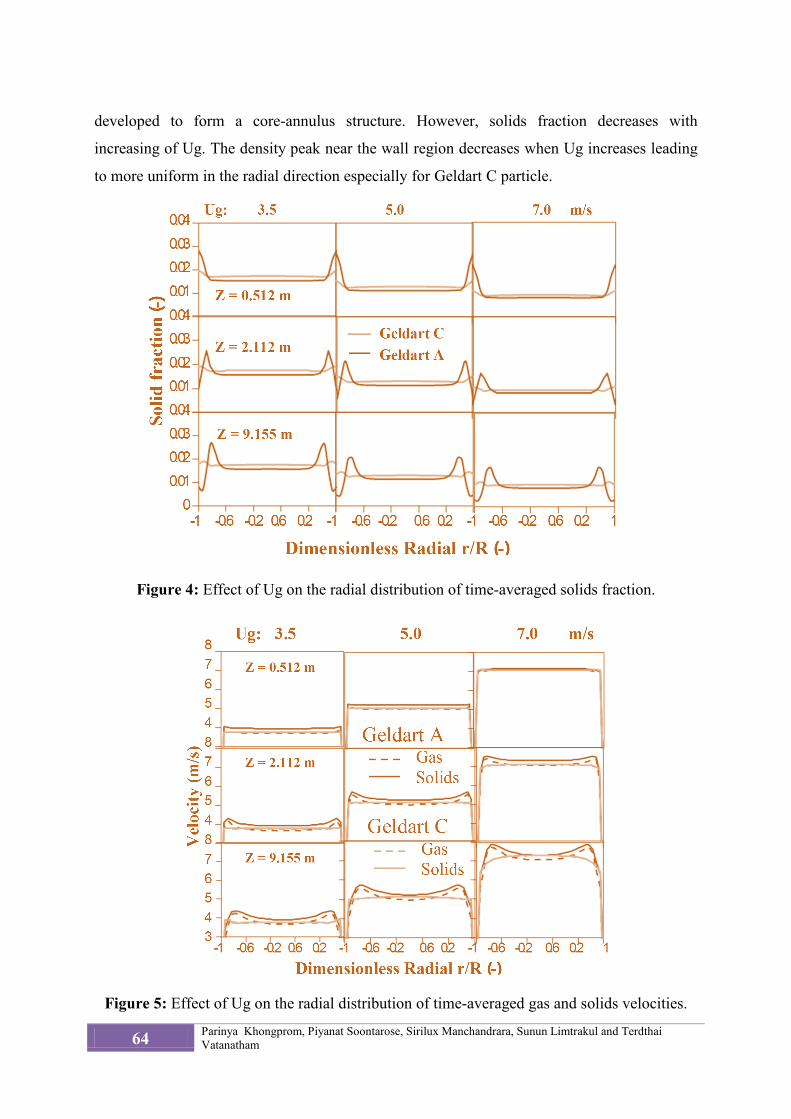
developed to form a core-annulus structure. However, solids fraction decreases with
increasing of Ug. The density peak near the wall region decreases when Ug increases leading
to more uniform in the radial direction especially for Geldart C particle.
Figure 4: Effect of Ug on the radial distribution of time-averaged solids fraction.
Figure 5: Effect of Ug on the radial distribution of time-averaged gas and solids velocities.
64 Parinya Khongprom, Piyanat Soontarose, Sirilux Manchandrara, Sunun Limtrakul and Terdthai Vatanatham
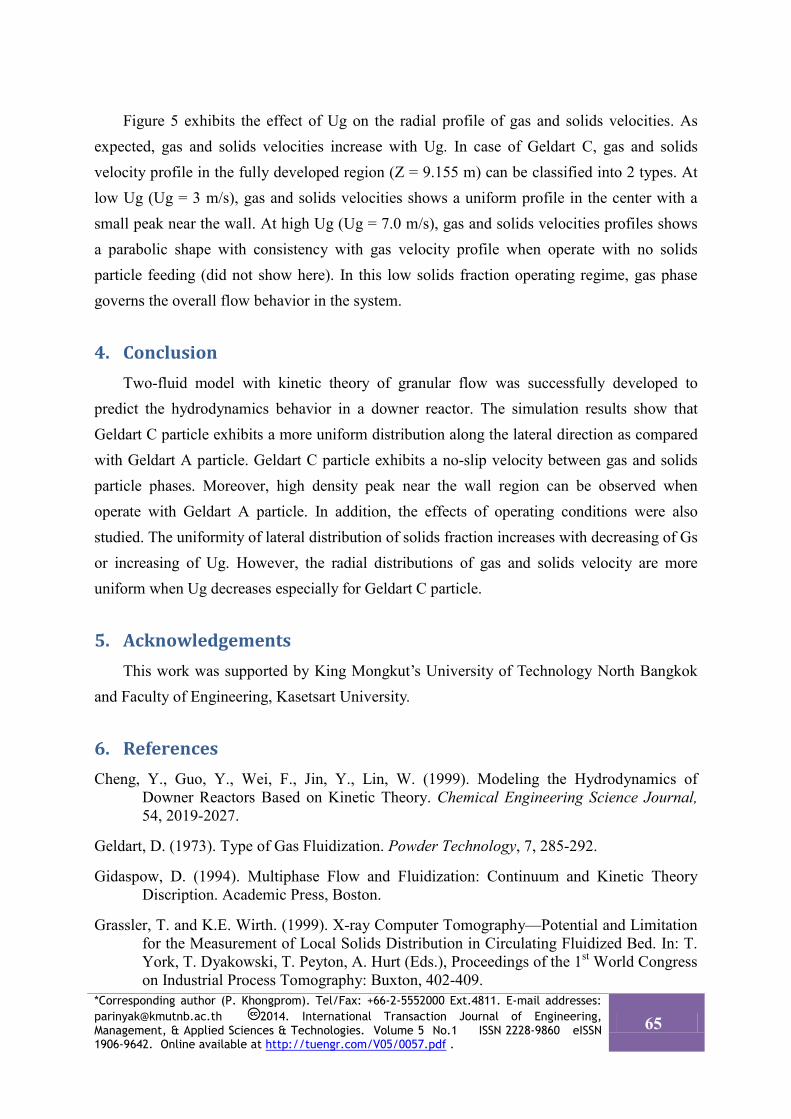
Figure 5 exhibits the effect of Ug on the radial profile of gas and solids velocities. As expected, gas and solids velocities increase with Ug. In case of Geldart C, gas and solids velocity profile in the fully developed region (Z = 9.155 m) can be classified into 2 types. At low Ug (Ug = 3 m/s), gas and solids velocities shows a uniform profile in the center with a small peak near the wall. At high Ug (Ug = 7.0 m/s), gas and solids velocities profiles shows a parabolic shape with consistency with gas velocity profile when operate with no solids particle feeding (did not show here). In this low solids fraction operating regime, gas phase governs the overall flow behavior in the system.
4. Conclusion Two-fluid model with kinetic theory of granular flow was successfully developed to
predict the hydrodynamics behavior in a downer reactor. The simulation results show that Geldart C particle exhibits a more uniform distribution along the lateral direction as compared with Geldart A particle. Geldart C particle exhibits a no-slip velocity between gas and solids particle phases. Moreover, high density peak near the wall region can be observed when operate with Geldart A particle. In addition, the effects of operating conditions were also studied. The uniformity of lateral distribution of solids fraction increases with decreasing of Gs or increasing of Ug. However, the radial distributions of gas and solids velocity are more uniform when Ug decreases especially for Geldart C particle.
5. Acknowledgements This work was supported by King Mongkut’s University of Technology North Bangkok
and Faculty of Engineering, Kasetsart University.
6. References Cheng, Y., Guo, Y., Wei, F., Jin, Y., Lin, W. (1999). Modeling the Hydrodynamics of
Downer Reactors Based on Kinetic Theory. Chemical Engineering Science Journal, 54, 2019-2027.
Geldart, D. (1973). Type of Gas Fluidization. Powder Technology, 7, 285-292.
Gidaspow, D. (1994). Multiphase Flow and Fluidization: Continuum and Kinetic Theory Discription. Academic Press, Boston.
Grassler, T. and K.E. Wirth. (1999). X-ray Computer Tomography—Potential and Limitation for the Measurement of Local Solids Distribution in Circulating Fluidized Bed. In: T. York, T. Dyakowski, T. Peyton, A. Hurt (Eds.), Proceedings of the 1st World Congress on Industrial Process Tomography: Buxton, 402-409.
*Corresponding author (P. Khongprom). Tel/Fax: +66-2-5552000 Ext.4811. E-mail addresses: [email protected] 2014. International Transaction Journal of Engineering, Management, & Applied Sciences & Technologies. Volume 5 No.1 ISSN 2228-9860 eISSN 1906-9642. Online available at http://tuengr.com/V05/0057.pdf .
65
Lehner, P. and K.E. Wirth. (1999). Characterization of the Flow Pattern in a Downer Reactor. Chemical Engineering Science Journal, 54, 5471-5483.
Limtrakul, S., N. Thanomboon, T. Vatanatham, and P. Khongprom. (2008). DEM Modeling and Simulation of a Down-Flow Circulating Fluidized Bed. Chemical Engineering Communications Journal, 195, 1328-1344.
Khongprom, P. (2011). Modeling and Simulation of Hydrodynamics, and Heat and Mass Transfer in a Down-Flow Circulating Fluidized Bed Reactor. PhD. Thesis, Kasetsart University, Bangkok, Thailand.
Khongprom, P., A. Aimdilokwong, S. Limtrakul, T. Vatanatham, P.A. Ramachandran. (2012). Axial Gas and Solids Mixing in a Down Flow Circulating Fluidized Bed Reactor Based on CFD Simulation. Chemical Engineering Science Journal, 73, 8-19.
Patankar, S.V. (1980). Numerical Heat Transfer and Fluid Flow. Hemisphere, New York.
Wei, F., and J.-X. Zhu. (1996). Effect of Flow Direction on Axial Solids Dispersion in Gas-Solid Concurrent Upflow and Downflow System. Chemical Engineering Journal and Biochemical Engineering Journal, 64, 345-352.
Ye, M., M.A. vander Hoef, and J. A.M. Kuipers. (2005). The Effect of Particle and Gas Properties on the Fluidization of Geldart A Particles. Chemical Engineering Science Journal, 60, 4567-4580.
Zhang, H., W-X. Huang, and J-X. Zhu. (2001). Gas-Solid Flow Behavior: CFB Riser vs Downer. AIChE Journal, 47, 2000-2011.
Dr. P. Khongprom is a lecturer a Department of Industrial Chemistry, Faculty of Applied, King Mongkut’s University of Technology Northy Bangkok. He received his B.Eng. of Chemical Engineering from Prince of Songkla University with Honors in 2001. He obtained his PhD also in Chemical Engineering from Kasetsart University in 2011. Dr. Khongprom current interests in modeling and simulation of hydrodynamics heat and mass transfer in a multiphase flow reactor.
Dr.Sunun Limtrakul is an Associate Professor of Department of Chemical Engineering at Kasetsart University. She holds a B.Sc. in Industrial Chemistry from Chiengmai University, MS in Chemical Engineering from Chulalongkorn University and Ph.D. degrees in Chemical Engineering from Washington University. Dr. Sunun is interested in reaction engineering, modeling and simulation, transport phenomena, and polymer electrolyte membrane (PEM) fuel cell.
Dr. Terdthai Vatanatham earned his bachelor degree from Chulalongkorn University Thailand, Master degree in Structural Engineering from Pennsylvania State University and Ph.D. in Chemical Engineering from University of Akron. He is an Associate Professor at Kasetsart University, Thailand. Dr. Terdthai is interested in reaction engineering, equipment design, and PEM fuel cell.
Peer Review: This article has been internationally peer-reviewed and accepted for publication according to the guidelines in the journal’s website. Note: Original version of this article was accepted and presented at the Third International-Thai Chemical Engineering and Applied Chemistry (TIChE) Conference, jointly organized by Department of Chemical Engineering, Faculty of Engineering, Khon Kaen University and Thai Institute of Chemical Engineering and Applied Chemistry, at Pullman Khon Kaen Raja Orchid Hotel, Khon Kaen, THAILAND, October 17-18, 2013.
66 Parinya Khongprom, Piyanat Soontarose, Sirilux Manchandrara, Sunun Limtrakul and Terdthai Vatanatham
International Transaction Journal of Engineering, Management, & Applied Sciences & Technologies
http://TuEngr.com
Optimization of Enzymatic Clarification from Corncob Sininart Chongkhong a*, and Woraluk Kongjindamunee a
a Department of Chemical Engineering Faculty of Engineering, Prince of Songkla University, THAILAND A R T I C L E I N F O
A B S T RA C T
Article history: Received 16 August 2013 Accepted 06 December 2013 Available online 09 December 2013 Keywords: Alpha-amylase; Glucose content; Hydrolysis; Central composite design;
A major content that was 22.76% total carbohydrate of the corncob could be simply hydrolyzed into reducing sugars by using alpha-amylase. The clarification process using alpha-amylase was optimized by response surface methodology (RSM) in this work. Independent variables including: enzyme amount of 0.05-0.2 %w, time of 60-240 min and temperatures of 80-100 °C were investigated. Their effects were found on the reducing sugar (Glucose content) by a second order central composite design (CCD). The optimum condition was 0.2 %w alpha-amylase, 87.6 °C for 150 min. It could provide the highest amount of 6.21 g/L glucose content in the clarified product.
2014 INT TRANS J ENG MANAG SCI TECH.
1. Introduction Ethanol is an alternative energy source as the clean and safe transportation fuels that can be
produced domestically in response today’s high-energy demand. This renewable energy has been interesting and rapidly developing to be used for substituting on fossil fuels and reducing pollution. Agricultural residues are used economically as raw materials for the ethanol production (Liu et al., 2010; Chena et al., 2007). The raw materials can be conveniently classified into three types: (i) sugars such as sugar beet, sweet sorghum and sugar cane, (ii) easily degradable carbohydrates such as corn, rice, wheat barley and corncob, (iii) cellulose such as rice bran, rice straw, wood chips, sawdust and waste from industries (Kreuger et al.,
2014 International Transaction Journal of Engineering, Management, & Applied Sciences & Technologies.
*Corresponding author (Sininart Chongkhong). Tel.: +66-7428-7293; fax: +66 7455 8833
E-mail addresses:[email protected]. 2014. International Transaction Journal of Engineering, Management, & Applied Sciences & Technologies. Volume 5 No.1 ISSN 2228-9860 eISSN 1906-9642. Online available at http://tuengr.com/V05/0067.pdf
67
2011; Zhu et al., 2006). The production steps are pretreatment, hydrolysis and fermentation, respectively. The pretreatment are necessary for increasing the porosity of the materials that are active to next steps. Then the hydrolysis, cellulose and/or carbohydrate molecules are converted into reducing sugars or broken down into corresponding monomers. After that the fermentation is carried out to transform the reducing sugars (fermentable sugars) into ethanol (Balata et al.,2008). Corncob is a cheap raw that can give a suitable reducing sugar (glucose) content for ethanol production. The components per 100 g of corncob are 22.76 g total carbohydrate, 7.11 g crude fiber, 1.17 g crude protein, 0.15 g fat, 0.44 g ash and 75.48 g moisture (Agro-Industry department center for export, 2011). The alpha-amylases breaks down the long-chain carbohydrates by acting at random locations of the carbohydrate chain. In this process, the pH is adjusted to be about 6.0 - 6.5 and the reaction is performed for about 2 hours at 95°C (Aiyer, 1995; Das et al., 2011; Reed and Nagodawithana, 1995). The optimum condition for the hydrolysis of prebiotic extracted jackfruit seeds using alpha-amylase enzyme was 0.17 %w enzyme amount at 80 °C for 240 min. The highest reducing sugar content in the product was 3.04 g/L (Bancha et al.,2011).
Response surface methodology (RSM) is a statistical technique to identify the effect of
individual variable for the optimization of multivariable system. It is widely used in optimizing the bioprocesses by the statistical experimental design method. This method can be employed to determine the optimum processes i.e. pretreatment, hydrolysis and fermentation. In addition, it can enhance production yield, reduce process variability, save time and cost (Wang et al., 2008; Bandaru et al., 2006).
Crucial factors (alpha-amylase amount, time and temperature) for clarification process
from corncob in this work would be optimized by RSM to obtain the highest glucose content in the product.
2. Materials and Methods
2.1 Materials and chemicals The corncob of sweet corn, sugar specie, was obtained from a local market in Hat-Yai,
Songkhla province, Thailand. The composition of the corncob is shown in Table 1. Alpha-amylase from Aspergillus oryzae was purchased from the Sigma-Aldrich company. Dinitrosalicylic solution (DNS) was used for the analysis of the glucose (reducing sugar) in the products (Miller, 1959). DNS was the mixture of 1% dinitrosalicylic acid, 0.2% phenol, 0.05% sodium sulfite, 1% sodium hydroxide and 20% sodium potassium tartrate that were a laboratory
68 Sininart Chongkhong and Woraluk Kongjindamunee
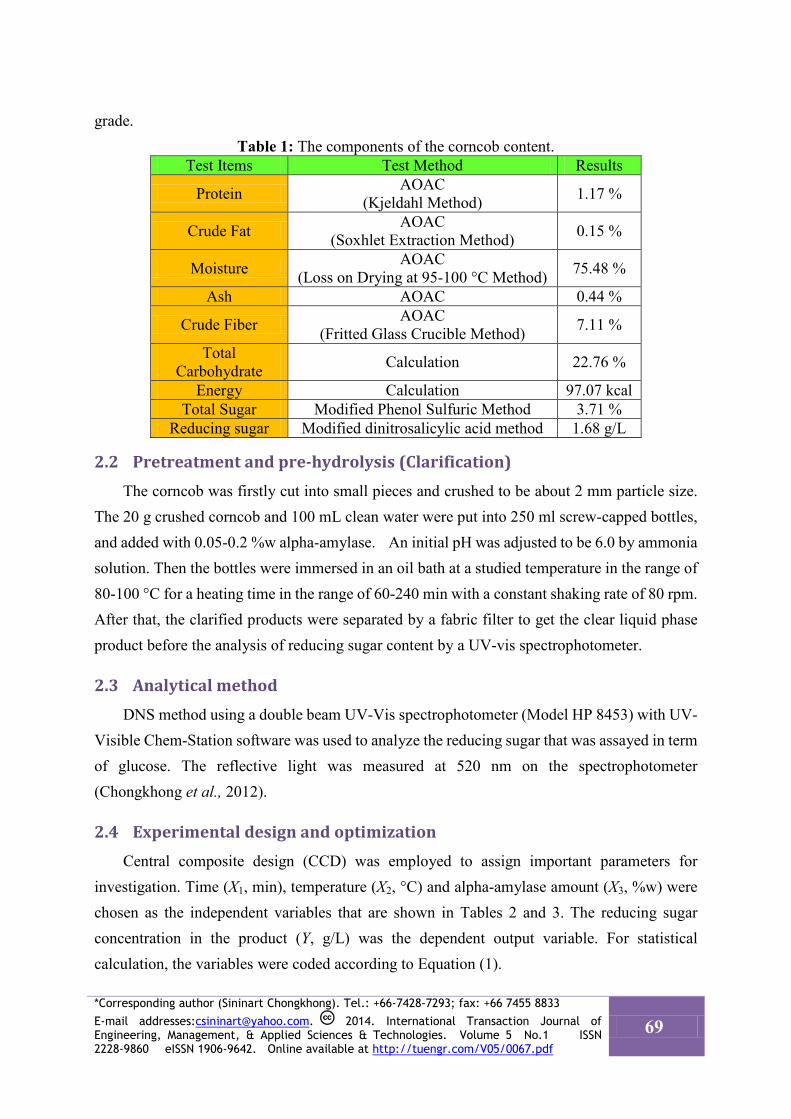
grade. Table 1: The components of the corncob content.
Test Items Test Method Results
Protein AOAC (Kjeldahl Method)
1.17 %
Crude Fat AOAC (Soxhlet Extraction Method) 0.15 %
Moisture AOAC (Loss on Drying at 95-100 °C Method) 75.48 %
Ash AOAC 0.44 %
Crude Fiber AOAC (Fritted Glass Crucible Method) 7.11 %
Total Carbohydrate Calculation 22.76 %
Energy Calculation 97.07 kcal Total Sugar Modified Phenol Sulfuric Method 3.71 %
Reducing sugar Modified dinitrosalicylic acid method 1.68 g/L
2.2 Pretreatment and pre-hydrolysis (Clarification) The corncob was firstly cut into small pieces and crushed to be about 2 mm particle size.
The 20 g crushed corncob and 100 mL clean water were put into 250 ml screw-capped bottles, and added with 0.05-0.2 %w alpha-amylase. An initial pH was adjusted to be 6.0 by ammonia solution. Then the bottles were immersed in an oil bath at a studied temperature in the range of 80-100 °C for a heating time in the range of 60-240 min with a constant shaking rate of 80 rpm. After that, the clarified products were separated by a fabric filter to get the clear liquid phase product before the analysis of reducing sugar content by a UV-vis spectrophotometer.
2.3 Analytical method DNS method using a double beam UV-Vis spectrophotometer (Model HP 8453) with UV-
Visible Chem-Station software was used to analyze the reducing sugar that was assayed in term of glucose. The reflective light was measured at 520 nm on the spectrophotometer (Chongkhong et al., 2012).
2.4 Experimental design and optimization Central composite design (CCD) was employed to assign important parameters for
investigation. Time (X1, min), temperature (X2, °C) and alpha-amylase amount (X3, %w) were chosen as the independent variables that are shown in Tables 2 and 3. The reducing sugar concentration in the product (Y, g/L) was the dependent output variable. For statistical calculation, the variables were coded according to Equation (1).
*Corresponding author (Sininart Chongkhong). Tel.: +66-7428-7293; fax: +66 7455 8833
E-mail addresses:[email protected]. 2014. International Transaction Journal of Engineering, Management, & Applied Sciences & Technologies. Volume 5 No.1 ISSN 2228-9860 eISSN 1906-9642. Online available at http://tuengr.com/V05/0067.pdf
69
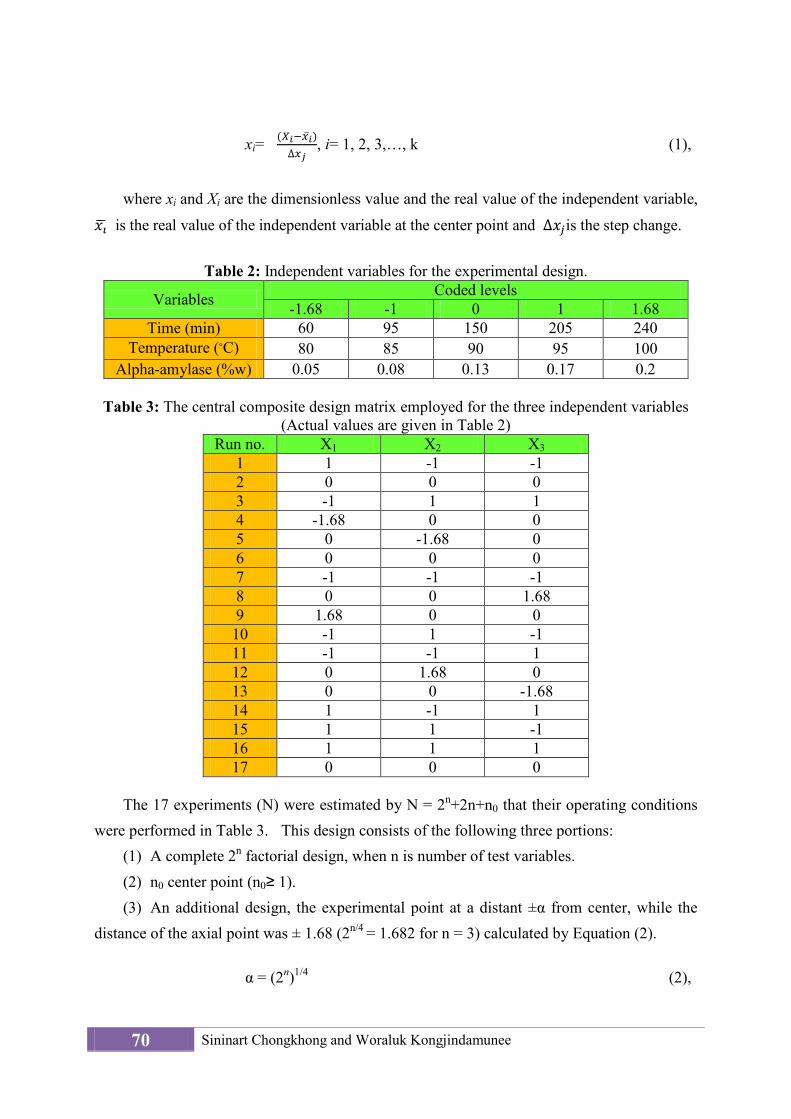
xi= (𝑋𝑖−�̅�𝑖)
∆𝑥𝑗, i= 1, 2, 3,…, k (1),
where xi and Xi are the dimensionless value and the real value of the independent variable,
𝑥𝚤� is the real value of the independent variable at the center point and ∆𝑥𝑗is the step change.
Table 2: Independent variables for the experimental design.
Variables Coded levels -1.68 -1 0 1 1.68
Time (min) 60 95 150 205 240 Temperature (๐C) 80 85 90 95 100
Alpha-amylase (%w) 0.05 0.08 0.13 0.17 0.2
Table 3: The central composite design matrix employed for the three independent variables (Actual values are given in Table 2)
Run no. X1 X2 X3 1 1 -1 -1 2 0 0 0 3 -1 1 1 4 -1.68 0 0 5 0 -1.68 0 6 0 0 0 7 -1 -1 -1 8 0 0 1.68 9 1.68 0 0 10 -1 1 -1 11 -1 -1 1 12 0 1.68 0 13 0 0 -1.68 14 1 -1 1 15 1 1 -1 16 1 1 1 17 0 0 0
The 17 experiments (N) were estimated by N = 2n+2n+n0 that their operating conditions
were performed in Table 3. This design consists of the following three portions: (1) A complete 2n factorial design, when n is number of test variables. (2) n0 center point (n0≥ 1). (3) An additional design, the experimental point at a distant ±α from center, while the
distance of the axial point was ± 1.68 (2n/4 = 1.682 for n = 3) calculated by Equation (2).
α = (2n)1/4 (2),
70 Sininart Chongkhong and Woraluk Kongjindamunee
where α is the distance of the axial points and n is the number of independent variables. The coefficient of the polynomial model was calculated by Equation (3).
Y = b0 + b1X1 + b2X2 + b3X3 + b11X1
2+ b22X22+b33X3
2 +b12X1X2 + b23X2X3
+ b13X1X3 (3),
where Y is the predicted reducing sugar, X1, X2, X3 are the independent variables, b0 is the
offset term, b1, b2, b3 are the linear effects, b11, b22, b33 are the square effects, and b12, b23, b13 are
the cross effects of the interaction terms (Khuri and Mukhopadhyay, 2010; Bezerra et al.,
2008).
3. Result and Discussion
3.1 Components of corncob Components of the fresh corncob are shown in Table 1. The major components are 22.76 %
carbohydrate that can be hydrolyzed to fermentable sugars before transforming into ethanol and 75.48 % moisture that can support the good growth of microorganisms and save water material used in the fermentation process. This showed that the corncob was a potential material for the ethanol fermentation.
3.2 Response surface analysis for the optimization of three factors The important factors for this clarification, hydrolysis process, to produce the reducing
sugars are time, temperature and alpha-amylase amount. This method evaluates the effects of the hydrolysis process, design model used to study interaction of the three factors and to find the optimum condition. The experimental conditions are shown in Tables 2 and 3. The results for central composite design (CCD) are shown in Table 4, the second-order polynomial equation giving the reducing sugar as a function of time (X1,min), temperature (X2,°C) and alpha-amylase amount (X3,%w) was shown as Equation (4).
Y=-100.01+0.061X1+2.235X2+19.90X3-0.0000176X1
2-0.01190X22
+85.42X32-0.000540X1X2 -0.040X1X3-0.339X2X3 (4),
The RSM predicted and experimental values of the reducing sugar are given in Table 4. To test the fit of the CCD model, the regression equation and determination coefficient (R2) were
*Corresponding author (Sininart Chongkhong). Tel.: +66-7428-7293; fax: +66 7455 8833
E-mail addresses:[email protected]. 2014. International Transaction Journal of Engineering, Management, & Applied Sciences & Technologies. Volume 5 No.1 ISSN 2228-9860 eISSN 1906-9642. Online available at http://tuengr.com/V05/0067.pdf
71
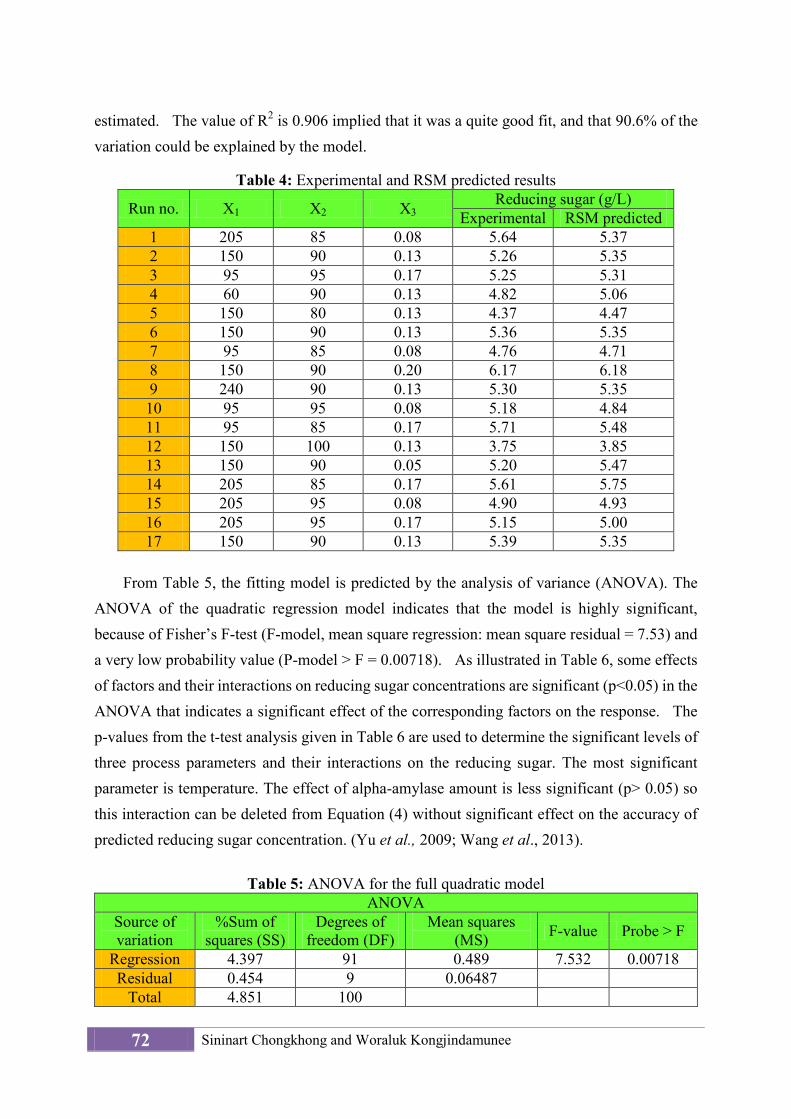
estimated. The value of R2 is 0.906 implied that it was a quite good fit, and that 90.6% of the variation could be explained by the model.
Table 4: Experimental and RSM predicted results
Run no. X1 X2 X3 Reducing sugar (g/L)
Experimental RSM predicted 1 205 85 0.08 5.64 5.37 2 150 90 0.13 5.26 5.35 3 95 95 0.17 5.25 5.31 4 60 90 0.13 4.82 5.06 5 150 80 0.13 4.37 4.47 6 150 90 0.13 5.36 5.35 7 95 85 0.08 4.76 4.71 8 150 90 0.20 6.17 6.18 9 240 90 0.13 5.30 5.35 10 95 95 0.08 5.18 4.84 11 95 85 0.17 5.71 5.48 12 150 100 0.13 3.75 3.85 13 150 90 0.05 5.20 5.47 14 205 85 0.17 5.61 5.75 15 205 95 0.08 4.90 4.93 16 205 95 0.17 5.15 5.00 17 150 90 0.13 5.39 5.35
From Table 5, the fitting model is predicted by the analysis of variance (ANOVA). The
ANOVA of the quadratic regression model indicates that the model is highly significant, because of Fisher’s F-test (F-model, mean square regression: mean square residual = 7.53) and a very low probability value (P-model > F = 0.00718). As illustrated in Table 6, some effects of factors and their interactions on reducing sugar concentrations are significant (p<0.05) in the ANOVA that indicates a significant effect of the corresponding factors on the response. The p-values from the t-test analysis given in Table 6 are used to determine the significant levels of three process parameters and their interactions on the reducing sugar. The most significant parameter is temperature. The effect of alpha-amylase amount is less significant (p> 0.05) so this interaction can be deleted from Equation (4) without significant effect on the accuracy of predicted reducing sugar concentration. (Yu et al., 2009; Wang et al., 2013).
Table 5: ANOVA for the full quadratic model
ANOVA Source of variation
%Sum of squares (SS)
Degrees of freedom (DF)
Mean squares (MS) F-value Probe > F
Regression 4.397 91 0.489 7.532 0.00718 Residual 0.454 9 0.06487
Total 4.851 100
72 Sininart Chongkhong and Woraluk Kongjindamunee
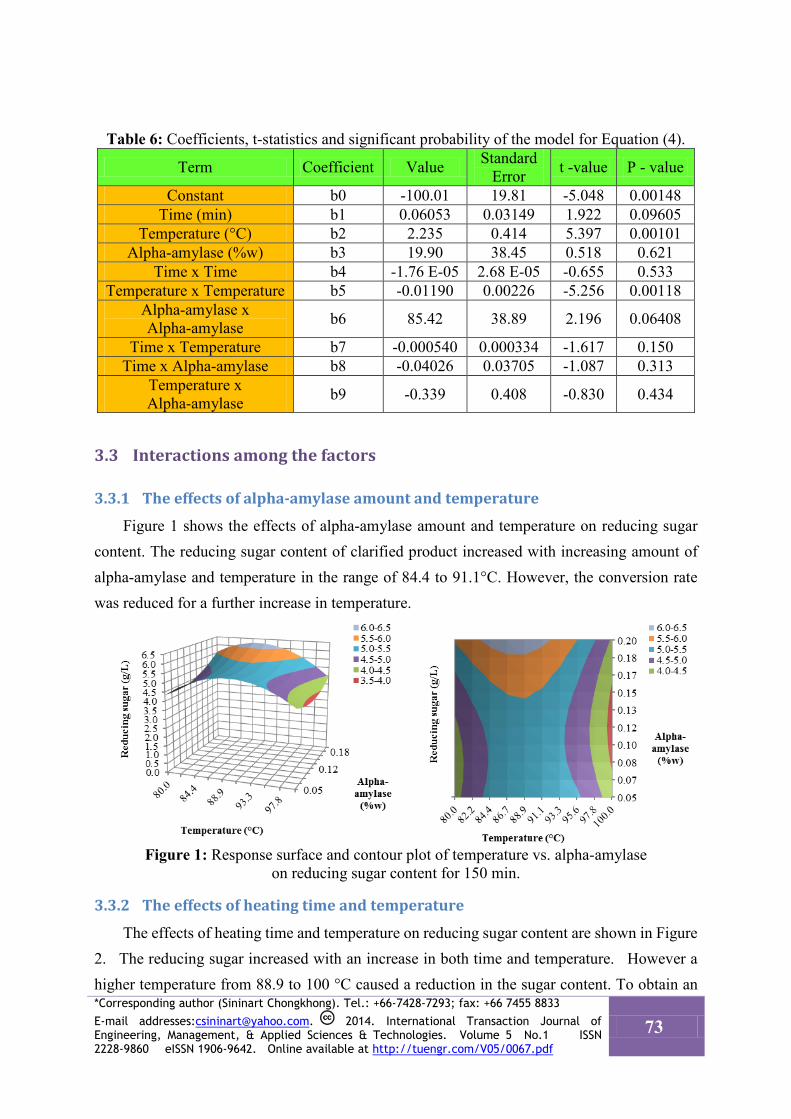
Table 6: Coefficients, t-statistics and significant probability of the model for Equation (4).
Term Coefficient Value Standard Error t -value P - value
Constant b0 -100.01 19.81 -5.048 0.00148 Time (min) b1 0.06053 0.03149 1.922 0.09605
Temperature (°C) b2 2.235 0.414 5.397 0.00101 Alpha-amylase (%w) b3 19.90 38.45 0.518 0.621
Time x Time b4 -1.76 E-05 2.68 E-05 -0.655 0.533 Temperature x Temperature b5 -0.01190 0.00226 -5.256 0.00118
Alpha-amylase x Alpha-amylase b6 85.42 38.89 2.196 0.06408
Time x Temperature b7 -0.000540 0.000334 -1.617 0.150 Time x Alpha-amylase b8 -0.04026 0.03705 -1.087 0.313
Temperature x Alpha-amylase b9 -0.339 0.408 -0.830 0.434
3.3 Interactions among the factors
3.3.1 The effects of alpha-amylase amount and temperature
Figure 1 shows the effects of alpha-amylase amount and temperature on reducing sugar content. The reducing sugar content of clarified product increased with increasing amount of alpha-amylase and temperature in the range of 84.4 to 91.1°C. However, the conversion rate was reduced for a further increase in temperature.
Figure 1: Response surface and contour plot of temperature vs. alpha-amylase
on reducing sugar content for 150 min.
3.3.2 The effects of heating time and temperature
The effects of heating time and temperature on reducing sugar content are shown in Figure 2. The reducing sugar increased with an increase in both time and temperature. However a higher temperature from 88.9 to 100 °C caused a reduction in the sugar content. To obtain an *Corresponding author (Sininart Chongkhong). Tel.: +66-7428-7293; fax: +66 7455 8833
E-mail addresses:[email protected]. 2014. International Transaction Journal of Engineering, Management, & Applied Sciences & Technologies. Volume 5 No.1 ISSN 2228-9860 eISSN 1906-9642. Online available at http://tuengr.com/V05/0067.pdf
73
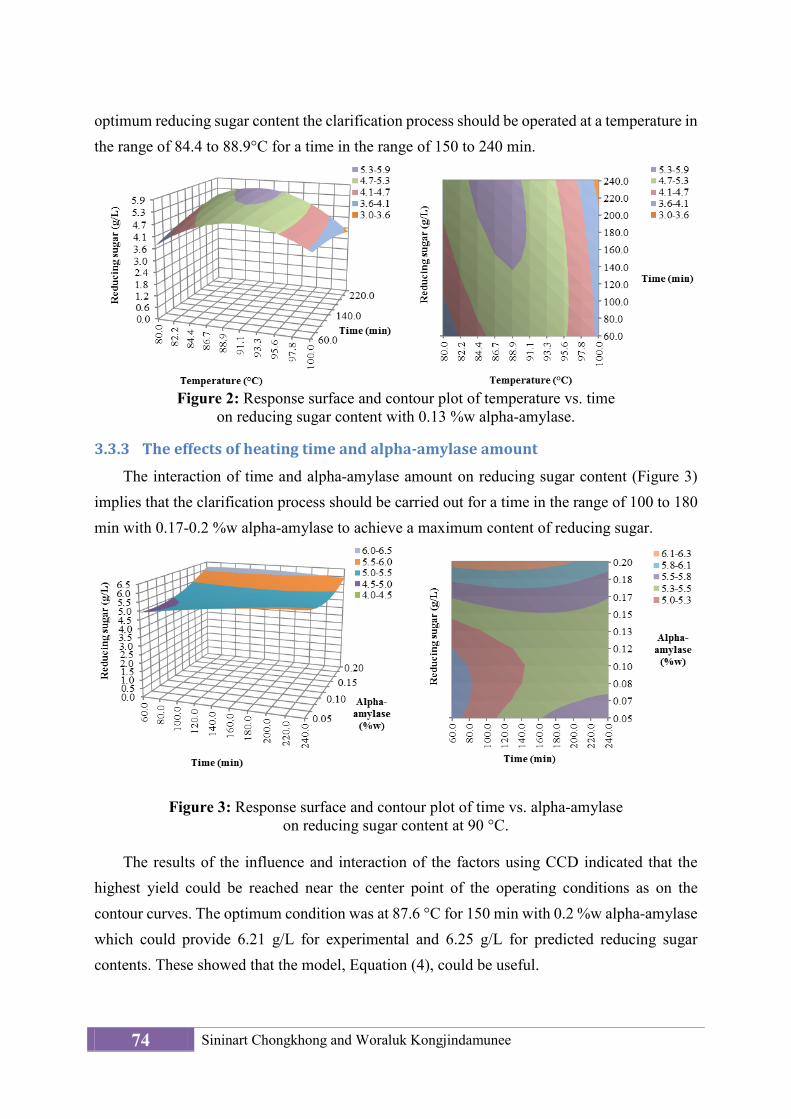
optimum reducing sugar content the clarification process should be operated at a temperature in the range of 84.4 to 88.9°C for a time in the range of 150 to 240 min.
Figure 2: Response surface and contour plot of temperature vs. time
on reducing sugar content with 0.13 %w alpha-amylase.
3.3.3 The effects of heating time and alpha-amylase amount
The interaction of time and alpha-amylase amount on reducing sugar content (Figure 3) implies that the clarification process should be carried out for a time in the range of 100 to 180 min with 0.17-0.2 %w alpha-amylase to achieve a maximum content of reducing sugar.
Figure 3: Response surface and contour plot of time vs. alpha-amylase on reducing sugar content at 90 °C.
The results of the influence and interaction of the factors using CCD indicated that the
highest yield could be reached near the center point of the operating conditions as on the contour curves. The optimum condition was at 87.6 °C for 150 min with 0.2 %w alpha-amylase which could provide 6.21 g/L for experimental and 6.25 g/L for predicted reducing sugar contents. These showed that the model, Equation (4), could be useful.
74 Sininart Chongkhong and Woraluk Kongjindamunee
4. Conclusion A clarification step before liquefaction and fermentation steps of the ethanol production
from the corncob has been evaluated. The ranges of time, temperature and alpha-amylase amount were established to optimize the operation condition by RSM which could save experimental time and cost. The optimum condition were an alpha-amylase amount of 0.2 %w, a temperature of 87.6 °C and a time of 150 min. that gave the highest amount of 6.21 g/L reducing sugar content.
5. Acknowledgement The authors gratefully acknowledge the financial support from the Graduate school and
Faculty of engineering, Prince of Songkla University.
6. References Agro-Industry department center for export: ADCET. The faculty of Agro-Industry, Prince of
Songkla University HatyaiSongkhla 90112.
Aiyer, P.V. (1995). Amylases and their applications. African Journal of Biotechnology, 4(13), 1525-1529.
Balata, M., Balat, H. and Oz, C. (2008) Progress in bioethanol processing. Progress in Energy and Combustion Science, 34(5), 551-573.
Bandaru, V.V.R., Somalanka, S.R., Mendu, DR., Madicherla, N.R. and Chityala, A. (2006). Optimization of fermentation conditions for the production of ethanol from sago starch by co-immobilized amyloglucosidase and cells of Zymomonasmobilis using response surface methodology. Enzyme and Microbial Technology, 38(1-2), 209-214.
Bezerra, M.A., Santelli, R.E., Oliveira, E.P., Villar, L.S. and Escaleira, L.A. (2008). Response surface methodology (RSM) as a tool for optimization in analytical chemistry. Talanta. 76(5), 965-977.
Chena, M., Xia, L. and Xue, P. (2007). Enzymatic hydrolysis of corncob and ethanol production from cellulosic hydrolysate. International Biodeterioration& Biodegradation, 59(2), 85–89.
Chongkhong, S., Lolharat, B. and Chetpattananondh, P. (2012). Optimization of Ethanol Production from Fresh Jackfruit Seeds Using Response Surface Methodology. Journal of Sustainable Energy & Environment, 3, 97-101.
Das, S., Singh, S., Sharma, V. and Lalsoni, M. (2011). Biotechnological applications of industrially important amylase enzyme. International Journal of Pharma and Bio Sciences, 2(1), 486-496.
Khuri, A. and Mukhopadhyay, S. (2010). Response surface methodology. Wiley
*Corresponding author (Sininart Chongkhong). Tel.: +66-7428-7293; fax: +66 7455 8833
E-mail addresses:[email protected]. 2014. International Transaction Journal of Engineering, Management, & Applied Sciences & Technologies. Volume 5 No.1 ISSN 2228-9860 eISSN 1906-9642. Online available at http://tuengr.com/V05/0067.pdf
75
Interdisciplinary Reviews-Computational Statistics, 2, 128-149.
Kreuger, E., Sipos, B., Zacchi, G., Svensson, S. and Björnsson, L. (2011). Bioconversion of industrial hemp to ethanol and methane: The benefits of steam pretreatment and co-production. Bioresource Technology, 102(3), 3457-3465.
Liu, K., Lin, X., Yue, J., Li, X., Fang, X., Zhu, M., Lin, J., Qu, Y. and Xiao, L. (2010). High concentration ethanol production from corncob residues by fed-batch strategy. Bioresource Technology, 101(13), 4952-4958.
Lolharat, B., Chongkhong, S. and Chetpattananondh, P. (2011). Optimizing conditions for enzymatic clarification of prebiotic extracted jackfruit seeds using response surface methodology. Proceeding of the 5th International Conference on Engineering and Technology (ICET-2011), May 2-3, 2011, Phuket, Thailand.
Miller, G.L. (1959). Use of dinitrosalicyclic acid reagent for determination of reducing sugar. Analytical Chemistry, 31(3), 426-428.
Reed, G. and Nagodawithana, T.W.(1995). Enzyme, Biomass, Food and feed. Biotechnology, 9(2),676.
Wang, Q., Ma, H., Xu, W., Gong, L., Zhang, W. and Zou, D.(2008).Ethanol production from kitchen garbage using response surface methodology. Biochemical Engineering Journal, 39(3), 604-610.
Wang, L., Luo, Z. and Shahbazi,(2013). A. Optimization of simultaneous saccharification and fermentation for the production of ethanol from sweet sorghum (Sorghum bicolor) bagasse using response surface methodology. Industrial Crops and Products, 42, 280- 291.
Yu, J., Zhang, Xu. and Tan, T. (2009). Optimization of media conditions for the production of ethanol from sweet sorghum juice by immobilized Saccharomyces cerevisiae. Biomass and Bioenergy, 33(3), 521-526.
Zhu, S., Wu, Y., Yu, Z., Chen, Q., Wu, G., Yu, F., Wang, C. and Jin, S. (2006). Microwave-assisted Alkali Pre-treatment of Wheat Straw and its Enzymatic Hydrolysis. Biosystems Engineering, 94(3), 437-442.
Peer Review: This article has been submitted, peer-reviewed, and awarded best paper from the Third International-Thai Chemical Engineering and Applied Chemistry (TIChE) Conference, jointly organized by Department of Chemical Engineering, Faculty of Engineering, Khon Kaen University and Thai Institute of Chemical Engineering and Applied Chemistry, at Pullman Khon Kaen Raja Orchid Hotel, Khon Kaen, THAILAND, October 17-18, 2013.
Dr.Sininart Chongkhong is an Assistant Professor of Department of Chemical Engineering at Prince of Songkla University. She received her B.Eng. from Prince of Songkla University with Honors in 2002. She continued her Ph.D. study at Prince of Songkla University, where she obtained her Ph.D. in Chemical Engineering. Dr. Sininart Chongkhong currently works on ethanol/biodiesel technologies.
Woraluk Kongjindamunee holds a degree in Chemical Engineering from Prince of Songkla University, Thailand. She is interested in applications of a green chemical technology.
76 Sininart Chongkhong and Woraluk Kongjindamunee
International Transaction Journal of Engineering, Management, & Applied Sciences & Technologies
http://TuEngr.com
Synthesis of Alkali Metal/CaO Sorbent for CO2 Capture at Low Temperature Nusavadee Pojananukij a, Nannaphas Runruksa a, Sutasinee Neramittagapong a, and Arthit Neramittagapong a*
a Department of Chemical Engineering, Faculty of Engineering, Khon Kaen University, Khon Kaen, 40002, Thailand A R T I C L E I N F O
A B S T R A C T
Article history: Received 23 August 2010 Received in revised form 23 September 2010 Accepted 26 September 2010 Available online 26 September 2010 Keywords: potassium carbonate; decarbonation process; Thermogravimetric Analyser;
In order to improve their CO2 absorption capacity at low temperature, alkali-based sorbents were prepared by impregnation method. It was found that supported CaO modified with a K/Ca molar ratio of 3 kept the most favorable stability and CO2 uptake capacity among the proposed K2CO3-stabilized samples. The result showed that the total CO2 capture capacity of 3K/CaO was 3.84 mg CO2/g sorbent at 50°C. The X-ray diffraction (XRD) result revealed the new structure was formed during CO2 adsorption such as CaCO3 and K2Ca(CO3)2.
2014 INT TRANS J ENG MANAG SCI TECH.
1. Introduction Carbon dioxide (CO2) in the atmosphere is approximately 300 ppm while humans can
live in an atmosphere of CO2 up to 5,000 ppm. After the air is taken into the lung, oxygen will be absorbed and CO2 will be desorbed. It can cause toxicity to the body when one gets it in large quantity. The accumulation of CO2 occurs in confined and poorly ventilated spaces, such as in the vault or in diving activities. As a result, the body gets the excess CO2. This will cause rapid breathing, rapid heartbeat, dizziness, and can be fatal. CO2 can be removed by various methods such as membrane separation, absorption with a solvent, and adsorption using molecular sieves (Lee, et al., 2009). However, these methods are costly and consume high energy.
2014 International Transaction Journal of Engineering, Management, & Applied Sciences & Technologies.
*Corresponding author (A. Neramittagapong). Tel/Fax: +66-43-362240 E-mail address: [email protected] 2014. International Transaction Journal of Engineering, Management, & Applied Sciences & Technologies. Volume 5 No.1 ISSN 2228-9860 eISSN 1906-9642. Online available at http://tuengr.com/V05/0077.pdf
77
One of the improved techniques for CO2 removal is the chemical absorption of CO2 with solid sorbents. The use of solid sorbents containing alkali and alkali-earth metals for CO2 absorption has been reported in many literatures (Gupta and Fan, 2002; Lee, et al., 2008). Among the materials studied, calcium oxide (CaO) has attracted most attention because of its low cost, high capture capacity, and suitable reaction kinetics. However, the lack of long-term stability, mainly due to the unstable structures upon high-temperature decarbonation is still an important drawback in industrial applications. Currently, many researches focus on the performance improvement of CaO-based sorbents by increasing the porosity and improving the stability. In the past, several studies regarding the efficient chemical absorption over K2CO3 supported on carbon (Lee, et al., 2006) employed alkali metal carbonate in CO2 absorption at low temperatures (50-60°C) with thermal regeneration easily occurring at a low temperature.
One objective of this work was to develop a new solid sorbent for being used to absorb
CO2 at low temperatures below 60°C. The CO2 capture capacities of several potassium-based sorbents were studied in TGA reactor using multiple tests. The role of support in CO2 absorption at low temperatures was also investigated. In addition, the changes in the physical properties of the sorbents before/after CO2 absorption and its mechanism were investigated with the aid of power X-ray diffraction (XRD) and Temperature Program Desorption (TPD).
2. Methodology
2.1 Catalyst preparation The alkali metal-based sorbent used in this study was prepared by the impregnation
method. A typical preparation procedure for the sorbent supported on the calcium oxide (99% CaO, Aldrich) is as follows: 5.0 g of supports were added to an aqueous solution containing 2.5 g of potassium carbonate (K2CO3, Aldrich) in 25 ml of deionized water and the percentage weight ratio of K:CaO was studied at 3, 5, 10, 20, and 30, respectively. Then, the content was mixed by using a magnetic stirrer for 24 h at room temperature. The dried samples were calcined in a furnace with N2 flow for 2 h at 450°C and 750°C. The ramping rate of the temperature was maintained at 3°C/min.
2.2 Characterization of the catalyst The specific surface area and total pore volume were determined by nitrogen adsorption
method at 77 K on the ASAP 2010 analyzer (Micromerition, USA) using a Burnauer-Emmrtt-Teller (BET) theory. X-ray diffraction (XRD, Bruker D8 advance, USA) was used to find the
78 Nusavadee Pojananukij, Nannaphas Runruksa, Sutasinee Neramittagapong and Arthit Neramittagapong
chemical composition and the crystallographic structure with Cu α K radiation in an angular
range (2θ) and the scanning range from 5° to 80° with 40 mA and 40 kV. The functional groups of components in a mixture and interfacial bonding mechanism of Ca and C were characterized by using Fourier transform infrared spectroscopy (FTIR, Bruker Tensor 27), with the sample mixed in KBr pellet at room temperature, Spectra were got over the range of 400-4,000 cm-1
2.3 Reaction study Carbon dioxide adsorption on the prepared powders was studied using a TGA. The
weight losses of the substance were calcined to analyze in a furnace under a N2 flow (100 mL/min) at 450°C and 750°C. The ramping rate of the temperature was maintained at 3°C/min. Decarbonation/carbonation experiments were conducted with thermogravimetric analyzer (TGA). All the steps of carbonation and decarbonation experiments, sample heating, sample cooling, and gases shifting between CO2 and nitrogen were programmable. A small amount of sorbent was placed in an alumina crucible and heated to the decarbonation temperatures (50, 70 and 100°C) at a ramp rate of 20°C/min under nitrogen with 2-hour temperature maintaining. During the entire process, the sorbent weight and the temperature were continuously recorded.
3. Results and discussion The calcium oxide sorbents in the present study were subjected to thermogravimetric
(TGA) analysis. The thermograms obtained between 30 and 750°C are shown in Figure 1. In general, the TG profiles of calcium oxide exhibit a three-step weight-loss system. Firstly, the weight loss with the temperature range of 30-340°C occurred on account of dehydration. Secondly, the weight loss of adsorbent was changed to about 21% within the temperature range of 380-440°C, at which Ca(OH)2 was complete changed to CaO (Lu, et al., 2006; Karami and Mahinpey, 2012) as expressed in Equation (1).
Ca(OH)2 → CaO + H2O (1)
A little weight of adsorbent was changed within the temperature range of 450-750°C due
to the stable structure. This is because the reaction (1) is completed at low temperature.
*Corresponding author (A. Neramittagapong). Tel/Fax: +66-43-362240 E-mail address: [email protected] 2014. International Transaction Journal of Engineering, Management, & Applied Sciences & Technologies. Volume 5 No.1 ISSN 2228-9860 eISSN 1906-9642. Online available at http://tuengr.com/V05/0077.pdf
79
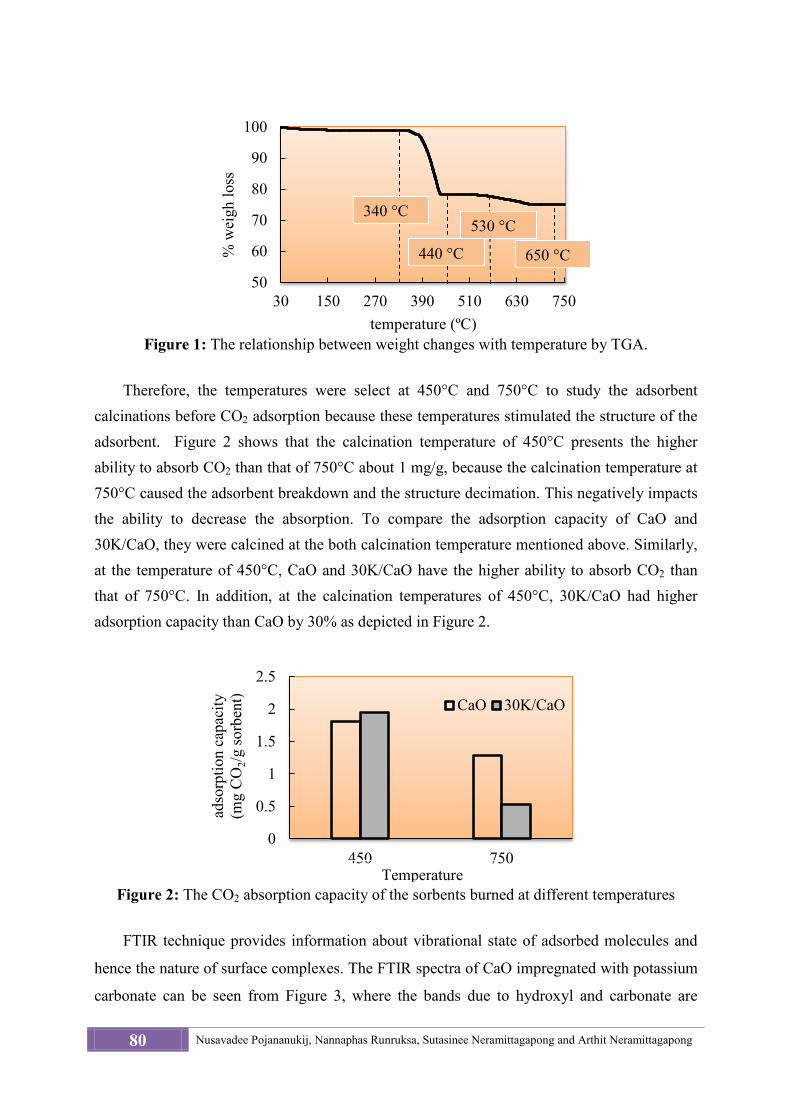
Figure 1: The relationship between weight changes with temperature by TGA.
Therefore, the temperatures were select at 450°C and 750°C to study the adsorbent calcinations before CO2 adsorption because these temperatures stimulated the structure of the adsorbent. Figure 2 shows that the calcination temperature of 450°C presents the higher ability to absorb CO2 than that of 750°C about 1 mg/g, because the calcination temperature at 750°C caused the adsorbent breakdown and the structure decimation. This negatively impacts the ability to decrease the absorption. To compare the adsorption capacity of CaO and 30K/CaO, they were calcined at the both calcination temperature mentioned above. Similarly, at the temperature of 450°C, CaO and 30K/CaO have the higher ability to absorb CO2 than that of 750°C. In addition, at the calcination temperatures of 450°C, 30K/CaO had higher adsorption capacity than CaO by 30% as depicted in Figure 2.
Figure 2: The CO2 absorption capacity of the sorbents burned at different temperatures
FTIR technique provides information about vibrational state of adsorbed molecules and
hence the nature of surface complexes. The FTIR spectra of CaO impregnated with potassium
carbonate can be seen from Figure 3, where the bands due to hydroxyl and carbonate are
50
60
70
80
90
100
30 150 270 390 510 630 750
% w
eigh
loss
temperature (ºC)
0
0.5
1
1.5
2
2.5
450 750
adso
rptio
n ca
paci
ty
(mg
CO
2/g so
rben
t) CaO 30K/CaO
Temperature
340 °C
440 °C
530 °C
650 °C
80 Nusavadee Pojananukij, Nannaphas Runruksa, Sutasinee Neramittagapong and Arthit Neramittagapong
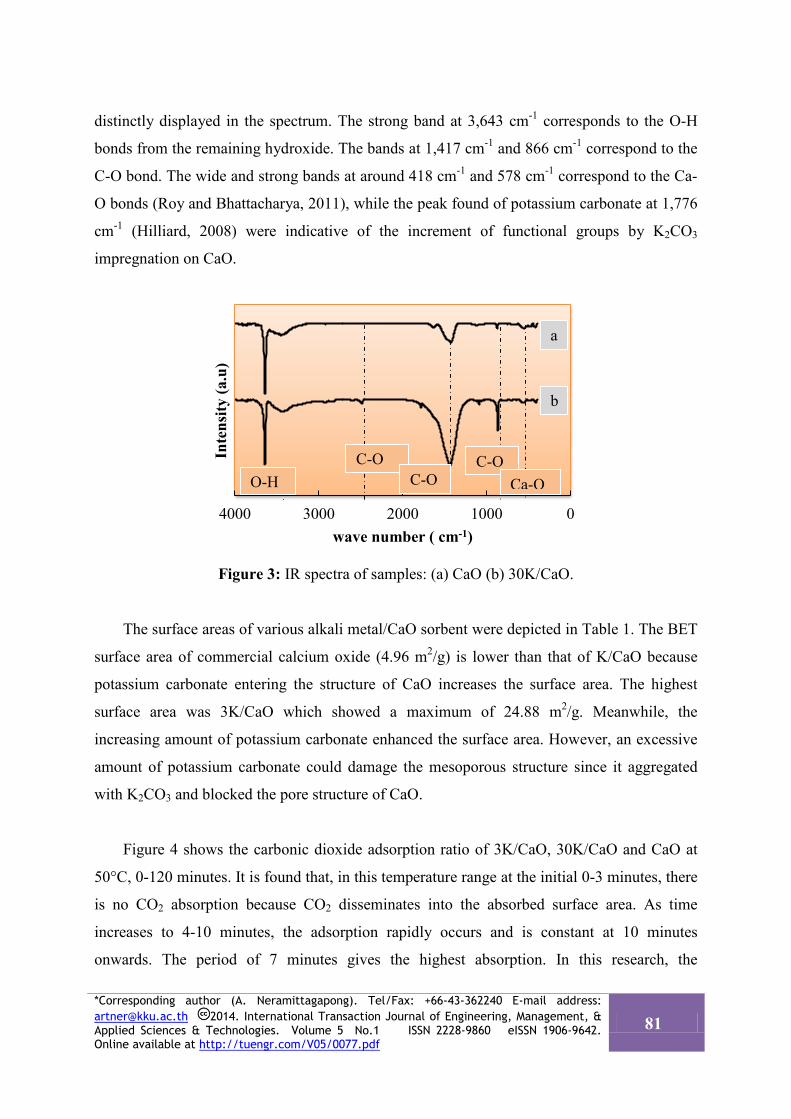
distinctly displayed in the spectrum. The strong band at 3,643 cm-1 corresponds to the O-H
bonds from the remaining hydroxide. The bands at 1,417 cm-1 and 866 cm-1 correspond to the
C-O bond. The wide and strong bands at around 418 cm-1 and 578 cm-1 correspond to the Ca-
O bonds (Roy and Bhattacharya, 2011), while the peak found of potassium carbonate at 1,776
cm-1 (Hilliard, 2008) were indicative of the increment of functional groups by K2CO3
impregnation on CaO.
Figure 3: IR spectra of samples: (a) CaO (b) 30K/CaO.
The surface areas of various alkali metal/CaO sorbent were depicted in Table 1. The BET
surface area of commercial calcium oxide (4.96 m2/g) is lower than that of K/CaO because
potassium carbonate entering the structure of CaO increases the surface area. The highest
surface area was 3K/CaO which showed a maximum of 24.88 m2/g. Meanwhile, the
increasing amount of potassium carbonate enhanced the surface area. However, an excessive
amount of potassium carbonate could damage the mesoporous structure since it aggregated
with K2CO3 and blocked the pore structure of CaO.
Figure 4 shows the carbonic dioxide adsorption ratio of 3K/CaO, 30K/CaO and CaO at
50°C, 0-120 minutes. It is found that, in this temperature range at the initial 0-3 minutes, there
is no CO2 absorption because CO2 disseminates into the absorbed surface area. As time
increases to 4-10 minutes, the adsorption rapidly occurs and is constant at 10 minutes
onwards. The period of 7 minutes gives the highest absorption. In this research, the
01000200030004000
Inte
nsity
(a.u
)
wave number ( cm-1)
b
a
O-H C-O
C-O C-O
Ca-O
*Corresponding author (A. Neramittagapong). Tel/Fax: +66-43-362240 E-mail address: [email protected] 2014. International Transaction Journal of Engineering, Management, & Applied Sciences & Technologies. Volume 5 No.1 ISSN 2228-9860 eISSN 1906-9642. Online available at http://tuengr.com/V05/0077.pdf
81
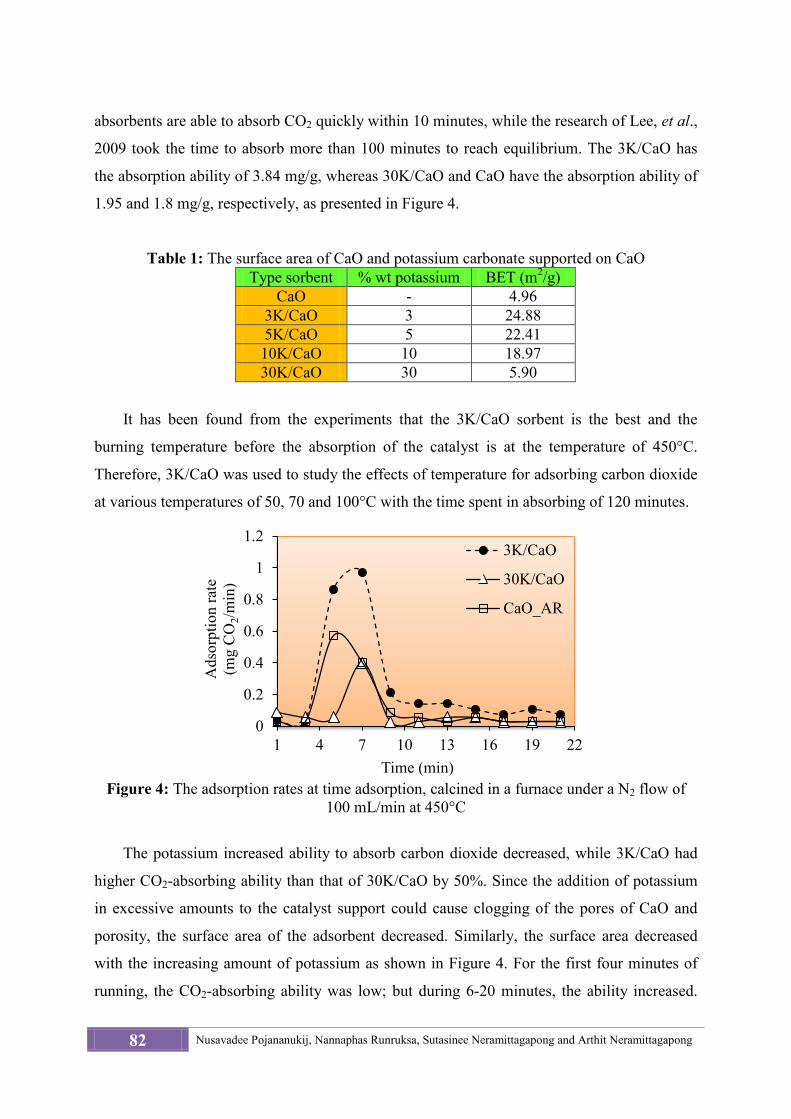
absorbents are able to absorb CO2 quickly within 10 minutes, while the research of Lee, et al.,
2009 took the time to absorb more than 100 minutes to reach equilibrium. The 3K/CaO has
the absorption ability of 3.84 mg/g, whereas 30K/CaO and CaO have the absorption ability of
1.95 and 1.8 mg/g, respectively, as presented in Figure 4.
Table 1: The surface area of CaO and potassium carbonate supported on CaO Type sorbent % wt potassium BET (m2/g)
CaO - 4.96 3K/CaO 3 24.88 5K/CaO 5 22.41 10K/CaO 10 18.97 30K/CaO 30 5.90
It has been found from the experiments that the 3K/CaO sorbent is the best and the
burning temperature before the absorption of the catalyst is at the temperature of 450°C.
Therefore, 3K/CaO was used to study the effects of temperature for adsorbing carbon dioxide
at various temperatures of 50, 70 and 100°C with the time spent in absorbing of 120 minutes.
Figure 4: The adsorption rates at time adsorption, calcined in a furnace under a N2 flow of
100 mL/min at 450°C
The potassium increased ability to absorb carbon dioxide decreased, while 3K/CaO had
higher CO2-absorbing ability than that of 30K/CaO by 50%. Since the addition of potassium
in excessive amounts to the catalyst support could cause clogging of the pores of CaO and
porosity, the surface area of the adsorbent decreased. Similarly, the surface area decreased
with the increasing amount of potassium as shown in Figure 4. For the first four minutes of
running, the CO2-absorbing ability was low; but during 6-20 minutes, the ability increased.
0
0.2
0.4
0.6
0.8
1
1.2
1 4 7 10 13 16 19 22
Ads
orpt
ion
rate
(m
g C
O2/m
in)
Time (min)
3K/CaO
30K/CaO
CaO_AR
82 Nusavadee Pojananukij, Nannaphas Runruksa, Sutasinee Neramittagapong and Arthit Neramittagapong
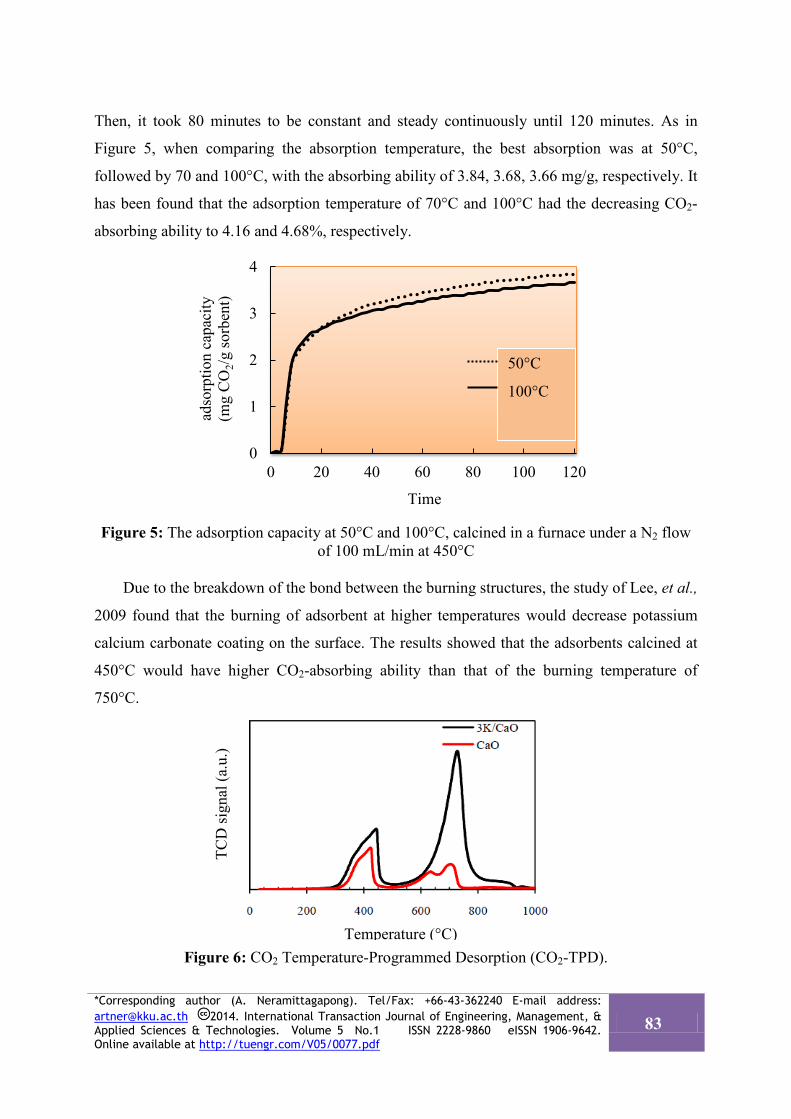
Then, it took 80 minutes to be constant and steady continuously until 120 minutes. As in
Figure 5, when comparing the absorption temperature, the best absorption was at 50°C,
followed by 70 and 100°C, with the absorbing ability of 3.84, 3.68, 3.66 mg/g, respectively. It
has been found that the adsorption temperature of 70°C and 100°C had the decreasing CO2-
absorbing ability to 4.16 and 4.68%, respectively.
Figure 5: The adsorption capacity at 50°C and 100°C, calcined in a furnace under a N2 flow of 100 mL/min at 450°C
Due to the breakdown of the bond between the burning structures, the study of Lee, et al.,
2009 found that the burning of adsorbent at higher temperatures would decrease potassium
calcium carbonate coating on the surface. The results showed that the adsorbents calcined at
450°C would have higher CO2-absorbing ability than that of the burning temperature of
750°C.
Figure 6: CO2 Temperature-Programmed Desorption (CO2-TPD).
0
1
2
3
4
0 20 40 60 80 100 120
adso
rptio
n ca
paci
ty
(mg
CO
2/g so
rben
t)
Time
50°C
100°C
Temperature (°C)
TCD
sign
al (a
.u.)
*Corresponding author (A. Neramittagapong). Tel/Fax: +66-43-362240 E-mail address: [email protected] 2014. International Transaction Journal of Engineering, Management, & Applied Sciences & Technologies. Volume 5 No.1 ISSN 2228-9860 eISSN 1906-9642. Online available at http://tuengr.com/V05/0077.pdf
83
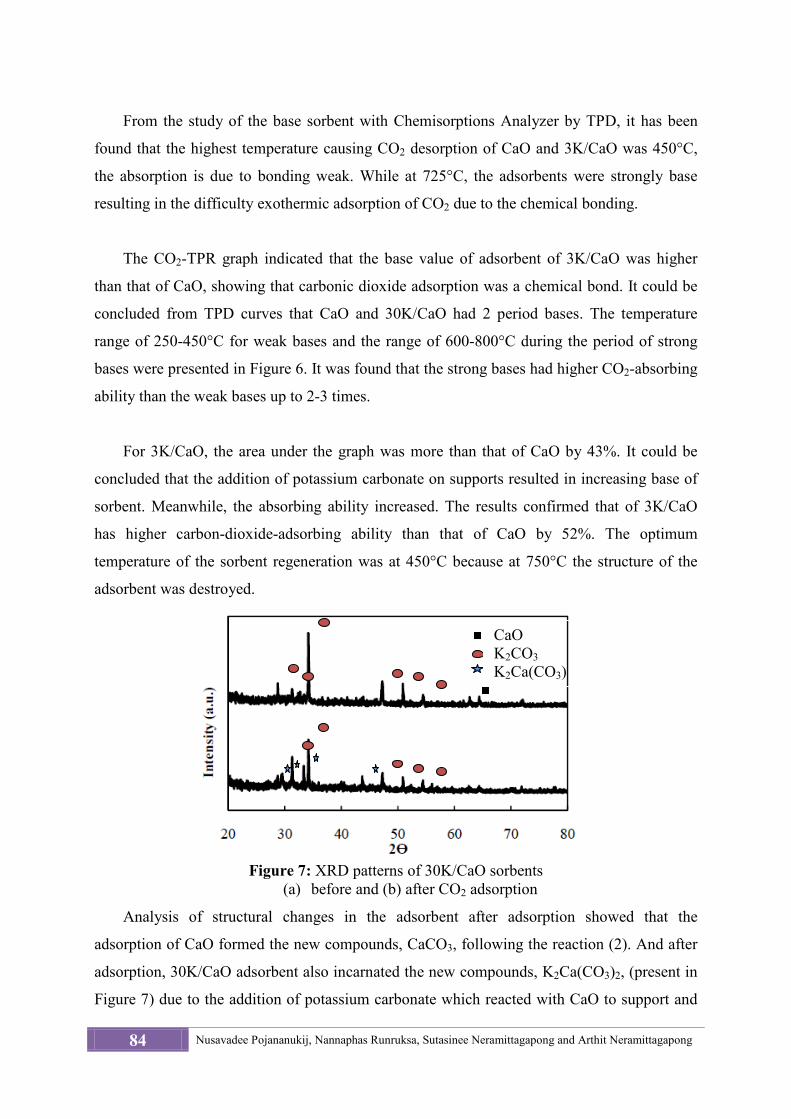
From the study of the base sorbent with Chemisorptions Analyzer by TPD, it has been
found that the highest temperature causing CO2 desorption of CaO and 3K/CaO was 450°C,
the absorption is due to bonding weak. While at 725°C, the adsorbents were strongly base
resulting in the difficulty exothermic adsorption of CO2 due to the chemical bonding.
The CO2-TPR graph indicated that the base value of adsorbent of 3K/CaO was higher
than that of CaO, showing that carbonic dioxide adsorption was a chemical bond. It could be
concluded from TPD curves that CaO and 30K/CaO had 2 period bases. The temperature
range of 250-450°C for weak bases and the range of 600-800°C during the period of strong
bases were presented in Figure 6. It was found that the strong bases had higher CO2-absorbing
ability than the weak bases up to 2-3 times.
For 3K/CaO, the area under the graph was more than that of CaO by 43%. It could be
concluded that the addition of potassium carbonate on supports resulted in increasing base of
sorbent. Meanwhile, the absorbing ability increased. The results confirmed that of 3K/CaO
has higher carbon-dioxide-adsorbing ability than that of CaO by 52%. The optimum
temperature of the sorbent regeneration was at 450°C because at 750°C the structure of the
adsorbent was destroyed.
Figure 7: XRD patterns of 30K/CaO sorbents
(a) before and (b) after CO2 adsorption
Analysis of structural changes in the adsorbent after adsorption showed that the
adsorption of CaO formed the new compounds, CaCO3, following the reaction (2). And after
adsorption, 30K/CaO adsorbent also incarnated the new compounds, K2Ca(CO3)2, (present in
Figure 7) due to the addition of potassium carbonate which reacted with CaO to support and
CaO K2CO3 K2Ca(CO3)
84 Nusavadee Pojananukij, Nannaphas Runruksa, Sutasinee Neramittagapong and Arthit Neramittagapong
absorb carbon dioxide during the process of equation (3).
CaO + CO2→ CaCO3 (2)
K2CO3 + CaO + CO2→ K2Ca(CO3)2 (3)
4. Conclusion It has been found that K2CO3 supported on CaO results in the most promising sorbents
for CO2. Total carbon dioxide capture capacity of 3K/CaO was 3.84 mgCO2/g sorbent mostly
abundant in all conditions. The enhanced performance could be attributed to the high surface
area and large pore volume of the sorbent with the appropriate amounts of K2CO3. For higher
K2CO3 loadings, the performance did not improve further due to the formation of
paracrystalline K2CO3 on the CaO support surface. The CO2-TPD indicated that there was a
chemical reaction between the sorbent and the adsorbate. Considering the regeneration
capacity as an important factor in addition to the CO2-capture capacity, 3K/CaO could be used
as a sorbent that had the potential for CO2 absorption.
5. Acknowledgements The authors express their thanks to Department of Chemical Engineering, Faculty of
Engineering, and Graduate School of Khon Kaen University for the financial supports.
6. References Gupta, Himanshu, and Liang-S. Fan. (2002). Carbonation−Calcination Cycle Using High
Reactivity Calcium Oxide for Carbon Dioxide Separation from Flue Gas. Industrial & Engineering Chemistry Research, 41 (16), 4035–4042.
Hilliard, Marcus Douglas. (2008). A Predictive Thermodynamic Model for an Aqueous Blend of Potassium Carbonate, Piperazine, and Monoethanolamine for Carbon Dioxide Capture from Flue Gas. http://repositories2.lib.utexas.edu/handle/2152/3900.
Karami, Davood, and Nader Mahinpey. (2012). Highly Active CaO-Based Sorbents for CO2 Capture Using the Precipitation Method: Preparation and Characterization of the Sorbent Powder. Industrial & Engineering Chemistry Research, 51(12), 4567–4572.
Lee, Soo Chool, Ho Jin Chae, Soo Jae Lee, Bo Yun Choi, Chang Keun Yi, Joong Beom Lee, Chong Kul Ryu, and Jae Chang Kim. (2008). Development of Regenerable MgO-Based Sorbent Promoted with K2CO3 for CO2 Capture at Low Temperatures.” Environmental Science & Technology ,42 (8), 2736–2741.
*Corresponding author (A. Neramittagapong). Tel/Fax: +66-43-362240 E-mail address: [email protected] 2014. International Transaction Journal of Engineering, Management, & Applied Sciences & Technologies. Volume 5 No.1 ISSN 2228-9860 eISSN 1906-9642. Online available at http://tuengr.com/V05/0077.pdf
85
Lee, Soo Chool, Ho Jin Chae, Soo Jae Lee, Yong Hee Park, Chong Kul Ryu, Chang Keun Yi, and Jae Chang Kim. (2009). Novel Regenerable Potassium-based Dry Sorbents for CO2 Capture at Low Temperatures. Journal of Molecular Catalysis B: Enzymatic , 56 (2–3), 179–184.
Lee, Soo Chool, Bo Yun Choi, Chong Kul Ryu, Young Soo Ahn, Tae Jin Lee, and Jae Chang Kim. (2006). The Effect of Water on the Activation and the CO2 Capture Capacities of Alkali Metal-based Sorbents.” Korean Journal of Chemical Engineering, 23 (3), 374–379.
Lu, Hong, Ettireddy P. Reddy, and Panagiotis G. Smirniotis. (2006). Calcium Oxide Based Sorbents for Capture of Carbon Dioxide at High Temperatures. Industrial & Engineering Chemistry Research, 45 (11)
Roy, Arup, and Jayanta Bhattacharya. (2011). Microwave-Assisted Synthesis and Characterization of Cao Nanoparticles. International Journal of Nanoscience, 10 (03), 413–418.
Nusavadee Pojanaukij is a Ph.D. student in Chemical Engineering program of Khon Kaen University. She received M.Eng in Chemical Engineering from Faculty of Engineering, Khon Kaen University and B.Sc. in Environmental Science from Faculty of Science, Khon Kaen University. She interests in the adsorption and application of catalysis or adsorbent.
Nannaphas Runruksa earned her B.Eng and M.Eng in Chemical Engineering from Khon Kaen University. She is interested in the application of catalysis. She is a licensed engineer in Chemical Engineering.
Dr.Arthit Neramittagapong is an Assistant Professor in the Chemical Engineering Department at Khon Kaen University. He holds a B.Eng. in Chemical Engineering from Khon Kean University, M. Eng. in Chemical Engineering from Chulalongkorn University and D.Eng. in Environmental Chemistry and Engineering from Tokyo Institute of Technology. He has been working on the environmental catalysis, design of industrial catalysts, chemical reaction engineering, and hazardous waste treatment and pollution control.
Dr.Sutasinee Neramittagapong is an Assistant Professor in the Chemical Engineering Department at Khon Kaen University. She holds a B.Eng. in Chemical Engineering from Khon Kean University, M. Eng. in Chemical Engineering from Chulalongkorn University and D.Eng. in Environmental Chemistry and Engineering from Tokyo Institute of Technology. Her research works have been focused on the environmental catalysis, renewable energy, green productivity, synthesis of high value-added compounds from industrial or agriculture wastes, and hazardous waste treatment and pollution control.
Peer Review: This article has been internationally peer-reviewed and accepted for publication according to the guidelines in the journal’s website. Note: Original version of this article was accepted and presented at the Third International-Thai Chemical Engineering and Applied Chemistry (TIChE) Conference, jointly organized by Department of Chemical Engineering, Faculty of Engineering, Khon Kaen University and Thai Institute of Chemical Engineering and Applied Chemistry, at Pullman Khon Kaen Raja Orchid Hotel, Khon Kaen, THAILAND, October 17-18, 2013.
86 Nusavadee Pojananukij, Nannaphas Runruksa, Sutasinee Neramittagapong and Arthit Neramittagapong

:: International Transaction Journal of Engineering, Management, & Applied Sciences & Technologies
http://TuEngr.com
Call-for-Papers:
ITJEMAST invites you to submit high quality papers for full peer-review and possible publication in areas pertaining to our scope including engineering, science, management and technology, especially interdisciplinary/cross-disciplinary/multidisciplinary subjects.
Next article continue on next page

More Research Publication Available at
http://TUENGR.COM
Submit your science research today.
:: International Transaction Journal of Engineering, Management, & Applied Sciences & Technologies