itis ocil ttits politics - british social attitudes survey · coalition’s time in office, though...
TRANSCRIPT
PoliticsDisengaged and disconnected Trends in attitudes towards politicsConcerns about the levels of political engagement amongst voters in Britain have often been expressed in the wake of much lower turnouts at recent general elections Soon after coming to power the Coalition said it wanted to restore our faith in politics Has it succeeded
Political spectators not activistsWhile most are not normally active in politics many do follow what is happening
bull Less than half have engaged in a political action other than voting or signing a petition bull But nearly two-thirds (65) follow political news on a daily basisbull And half say they sometimes talk about politics to family and friends
Growth in disconnection not reversedLong-term trends towards greater voter disconnection have not been reversed during the Coalitionrsquos time in office though our interest in politics is undiminished
bull Only 17 trust governments most of the time just as only 16 did in 2009 but far less than the 38 who did in 1986
bull Fifty-seven per cent believe they have a duty to vote in line with the 58 who did so in 2009 but down from 76 in 1987
bull Thirty-two per cent say they have ldquoquite a lotrdquo or ldquoa great dealrdquo of interest in politics similar levels to 1986 when 29 expressed this view
Principle of coalition government has become unpopularSupport for the principle of coalition government has fallen heavily since 2010 but this has not generated greater concern about the health of Britainrsquos democracy
bull Only 29 now prefer coalition to single party government down from 45 before the Coalition was formed
bull But 57 appear to think that democracy works at least reasonably well in Britain little changed from a decade ago
NatCen Social Research
British Social Attitudes 32 | Politics 1
Authors
Miranda Phillips and Ian Simpson NatCen Social Research
IntroductionWe have become accustomed in recent years to the expression of concerns about low turnout voter apathy and peoplersquos lack of trust in or respect for politicians (see for example Dunleavy et al (2010) House of Commons Political and Constitutional Reform Committee (2014) Whittam Smith 2014)) The reason for this worry is not hard to find Turnout in UK general elections declined during the second half of the 20th century and has been lower still since the turn of the millennium Previous British Social Attitudes surveys have shown that this apparent voter apathy appears to be part of a broader disconnection with politics with for example fewer people accepting that they have a duty to vote and fewer feeling any sense of attachment to a political party (Curtice and Butt 2010 Lee and Young 2013) These trends have been particularly apparent among younger people
Not that all the evidence has pointed towards inexorable decline In our 30th British Social Attitudes report for example we found signs of a possible reversal of the decline in civic duty and a small increase in levels of political interest (Lee and Young 2013) A 65 turnout at the 2010 election represented a marked improvement on the 59 recorded in 2001 More recently the Scottish Independence Referendum suggested a more enthusiastic level of participation in the democratic process is possible when voters are presented with a straight choice on a subject about which many feel passionately and nearly all believe is important Turnout in that ballot reached 85 higher than in any previous nationwide ballot in Scotland held since the advent of the mass franchise (Electoral Commission 2014)
Nevertheless political disengagement was one of the issues that David Cameron and Nick Clegg promised to address when they joined forces in May 2010 not least through a seemingly ambitious programme of constitutional reform The Coalitionrsquos Programme for Government which outlined the agreement between the two parties stated ldquoThe Government believes that our political system is broken We urgently need fundamental political reformrdquo (Cabinet Office 2010 26) Meanwhile in a speech he gave shortly after becoming Deputy Prime Minister Nick Clegg described the Coalitionrsquos programme as ldquothe most significant programme of empowerment by a British government since the great reforms of the 19th Centuryrdquo and claimed that it would ldquopersuade you to put your faith in politics once againrdquo (Clegg 2010)
Some of that programme eventually saw the light of day includingbull introducing fixed term parliaments (removing the Prime Ministerrsquos
power to call a general election at the time of his or her choosing)bull introducing a bill to give voters the right to lsquorecallrsquo their MP if he
or she has been found to have broken parliamentary rules or has committed an imprisonable offence
bull and de-centralising power through measures such as locally elected mayors and extending the powers of local councils
NatCen Social Research
British Social Attitudes 32 | Politics 2
A referendum on changing the electoral system in general elections to the Alternative Vote was also held in 2011 although this resulted in a vote for no change Meanwhile others of the Coalitionrsquos proposed political reforms have not been implemented most notably introducing an elected House of Lords Nevertheless it is still worthwhile assessing whether there is any evidence that the government has met its broader aspirations to restore our lsquofaith in politicsrsquo
We address two main questions First we ask how politically lsquoengaged or disengagedrsquo people are in Britain We examine membership of different parties and groups participation in political and social action and lsquoeverydayrsquo informal engagement in politics via for example discussions with friends and neighbours all of them behaviours that indicate some kind of involvement with politics in Britain today Second we ask whether the public is lsquoconnected or disconnectedrsquo with politics by examining attitudes towards politics in Britain nowadays Do people think democracy works well in Britain Are the government and MPs trusted by those they represent And do the electorate feel they have a say in how the government operates
Most of our data come from a set of questions included on the most recent British Social Attitudes survey (2014) as part of an International Social Survey Programme (ISSP) (see httpwwwissporg) module on lsquoCitizenshiprsquo In addition we report on a few questions that are asked as part of the extensive lsquobackgroundrsquo information that we routinely collect about our respondents Our main focus is on the data for 2014 but where appropriate we also compare these results with those obtained the last time the ISSP questions were asked in 2004 As most of these questions were not asked in the intervening years we are not always able to pinpoint precisely when any changes have occurred or to relate them to a particular event or development within that ten-year period However we can still consider the broader question of whether the levels of engagement and connection with politics in 2014 are different from those found a decade ago and thus whether there is any reason to suspect that the Coalition might have presided over a switch to a more engaged and connected Britain
Are we engaged or disengagedWe start by assessing the extent to which British people are engaged in politics We define lsquoengagementrsquo as any behaviour that involves people either in the political process or in wider political activity This engagement could comprise formal activities such as voting in elections or less formal actions such as signing a petition or attending a demonstration We also consider the extent to which politics features in peoplersquos everyday lives through conversations with others and watching or reading political news While day-to-day conversation or following the news might be regarded as a relatively low level form of lsquoengagementrsquo it nonetheless provides an indication of how far removed (or otherwise) the public is from politics in Britain today Even if people are not engaged in political activity if they are
NatCen Social Research
British Social Attitudes 32 | Politics 3
still interested enough to talk about politics with their friends and family then it is difficult to argue that they are wholly disengaged from the political process and might in the right circumstances perhaps be tempted or persuaded to do something more active
Voting and political activity
Post-war Britain flocked to the polls In 1950 no less than 84 voted in that yearrsquos general election But that is now a distant memory In the three general elections that so far have been held in this century turnout has been lower than at any time since 1922 falling well below the 70 mark It remains to be seen how the 2015 election will fit into this trend
However voting is far from being the only possible way of getting involved in politics Some have suggested that younger generations in particular have become more involved in other forms of political activity and engagement even when they might prove disinclined to take a trip to the polling station (Norris 2002 Sloam 2014) For example people may be members of particular groups such as trade unions or voluntary associations that campaign on particular issues about which they care Or they might take action more directly on such issues ndash by for example signing petitions or joining demonstrations
For a variety of different kinds of groups the ISSP module asked respondents whether they were currently members and ldquoactively participaterdquo were members but ldquodonrsquot participaterdquo or whether they ldquoused to belongrdquo or ldquonever belongedrdquo As Table 1 shows in most cases membership is low and ldquoactiverdquo membership even lower Membership of political parties is particularly low ndash just 9 of our sample claim to belong to a political party though in truth even this figure is an exaggeration The partiesrsquo own membership figures suggest that no more than 1 now belong even though there have recently been increases in the membership of the Scottish National Party (SNP) the Green Party and the United Kingdom Independence Party (UKIP) (Keen 2015) Some of our respondents were probably claiming psychological rather than paid membership In any event only 1 say they are active members Active membership of trade unions and voluntary associations is higher but this is still very clearly something in which only a minority of the public are engaged 5 actively belong to a trade union while 12 say the same about a voluntary association Participation is much higher (26) in sports or leisure groups than in any organisation that might be thought to have a political purpose None of this however is new except that fewer now claim to be a member of a religious organisation than did ten years ago ndash an unsurprising finding given the decline in attendance at religious services in recent years (Lee 2012)
NatCen Social Research
British Social Attitudes 32 | Politics 4
Table 1 Belonging to groups and associations 2004 and 2014
2004 2014
Political party
Belong actively participate 1 1
Belong donrsquot participate 9 7
A trade union business or professional association
Belong actively participate 5 5
Belong donrsquot participate 17 16
Another voluntary association
Belong actively participate 12 12
Belong donrsquot participate 5 4
A church or other religious organisation
Belong actively participate 16 12
Belong donrsquot participate 18 12
A sports leisure or cultural group
Belong actively participate 23 26
Belong donrsquot participate 6 6
Unweighted base 853 1580
The full question text is shown in the appendix proportions that do not belong are not shown in the table but are included in the base
However group membership is arguably a relatively formal way of getting involved in politics compared with undertaking particular actions such as signing a petition demonstrating or boycotting goods actions that can be undertaken without signing up for a formal membership We therefore also asked respondents to tell us how frequently they had done various ldquodifferent forms of political and social actionrdquo As Table 2 shows the most commonly reported form of action in our list is ldquosigned a petitionrdquo no less than 67 say they have done this either ldquoin the past yearrdquo or ldquoin the more distant pastrdquo Signing a petition however demands little in terms of time and commitment Other kinds of political activity are much less common albeit more common than getting involved in party politics For example 26 have contacted a politician or civil servant at some point in their lives and at least 15 report having attended a political meeting or rally Meanwhile although the rise of social media and new technologies open up new and perhaps more easily accessible ways of getting involved just 14 of us say we have expressed political views online
Although signing a petition is the most common form of political activity in fact rather fewer people say they have signed one in our most recent survey than did so in 2004 the 67 figure for 2014 compares with 73 in 2004 This is perhaps surprising given the recent expansion in online epetitions (although it is possible that for some respondents the reference to ldquosignedrdquo in the question encouraged them to think of physically signing a paper petition
26 have contacted a politician or civil servant at some point in their lives
NatCen Social Research
British Social Attitudes 32 | Politics 5
rather than adding their name to a virtual one) Otherwise there has been relatively little change in reported levels of participation So while there is nothing here to indicate that there has been a decline in political activity equally there is no indication that amongst the public as a whole at least the decline in turnout is being accompanied by greater involvement in other forms of political action
+ A question about joining internet forums was included in the 2004 survey eliciting a response of 3 The difference in question wording is such that we canrsquot compare this result with the 2014 figure
na = not asked
Everyday engagement
We have seen then that levels of election turnout have declined since the mid-20th century (albeit it does not yet appear to be in a terminal spiral) party membership is low and that there is scant evidence that these ways of getting involved in party politics have been replaced by other forms of political activity particularly where this involves anything more taxing than signing a petition But do these relatively low levels of engagement mean that politics does not feature in most peoplersquos day to day lives
Seemingly not As many as 50 of the British public say they ldquooftenrdquo or ldquosometimesrdquo discuss politics with friends relatives or fellow workers (see Table 3) This suggests that there is perhaps a substantial body of people who engage on a regular basis in political debate even though they may rarely get involved in political activity if indeed they do so at all Moreover the proportion saying that they ldquooftenrdquo or ldquosometimesrdquo discuss politics is five percentage points higher now than a decade earlier In short while only a minority of us appear to be willing to become political activists quite a few of us are lsquopolitical spectatorsrsquo
Table 2 Forms of political and social action 2004 and 2014
2004 2014
Have done in the past year or in the more distant past
have signed a petition 73 67
have boycotted or deliberately bought certain products for political ethical or environmental reasons 38 36
have donated money or raised funds for a social or political activity 30 31
have contacted or attempted to contact a politician or a civil servant to express your views 23 26
have taken part in a demonstration 14 17
have attended a political meeting or rally 14 15
have expressed political views on the internet+ na 14
have contacted or appeared in the media to express your views 10 12
Unweighted base 853 1580
50 of the British public ldquooftenrdquo or ldquosometimesrdquo discuss politics with friends relatives or fellow workers
NatCen Social Research
British Social Attitudes 32 | Politics 6
Table 3 When you get together with your friends relatives or fellow workers how often do you discuss politics 2004 and 2014
2004 2014
Often 8 9
Sometimes 36 41
Rarely 36 30
Never 19 18
Unweighted base 853 1580
Moreover over eight in ten (83) of us keep up with political news at least once a week either through newspapers TV radio or online (Table 4) Sixty-five per cent of us use at least one of these methods to access political news on a daily basis while a further 18 do so at least once a week Only 7 say that they ldquoneverrdquo access political news via any of these routes Again this indicates that low-level everyday engagement with what is going on in politics apparently exceeds the level of involvement in any more substantial political activity
Questions regarding the use of specific media types (newspaper television radio and internet) were asked as separate questions The question about accessing political news via any of these means was asked separately with all of the specific types of media listed within one question Full questions are listed in the appendix
The most popular medium for accessing political news is TV with nearly two-thirds (64) watching political news on that medium on a ldquodailyrdquo or ldquoweeklyrdquo basis Given TVrsquos continued predominance it is perhaps no surprise that there has been so much controversy about who should participate in any televised leader debates that are held in advance of the 2015 general election Meanwhile although 40 of us now use the internet to get political news or information on at least a weekly basis this remains lower than the 46 that continue to read the political content of a newspaper at least once a week So although much has been made of sharp falls in newspaper circulation (Greenslade 2014) it appears that many people are still likely to use
Table 4 Frequency of accessing political news and information 2014
Newspaper Television Radio Internet
Access political
news via any of these
means
Frequency
Daily 21 29 18 20 65
Weekly 26 34 20 21 18
Less than 1 day a week 22 18 17 16 7
Never 28 16 41 40 7
Unweighted base 1580 1580 1580 1580 1580
The most popular medium for accessing political news is TV
NatCen Social Research
British Social Attitudes 32 | Politics 7
newspapers as one of the ways in which they follow the 2015 general election
We appear then to have a tale of two halves When it comes to formal party political activities such as voting and joining a party engagement has either been in decline over the longer term or is at relatively low levels However a higher proportion are involved in everyday things like talking about politics with friends and following the news and we seem to be at least as involved in these activities now as we were a decade ago Few of us may be lsquoactivistsrsquo but it seems that many of us are lsquospectatorsrsquo
Are we connected or disconnectedAttempts to explain the apparent decline in engagement with politics in Britain at least so far as voting is concerned commonly draw on the idea that we are becoming increasingly politically lsquodisconnectedrsquo ndash that we have lost faith in the political system we feel that politics has nothing to do with or offer lsquopeople like usrsquo we do not trust our politicians and that as a result we have lost the interest and sense of duty required to motivate us to show up and vote (Curtice 2011) In other words underpinning these changes in behaviour are believed to be major shifts in attitudes towards politics in Britain But how much of this is actually supported by evidence In this half of the paper we examine various attitudinal measures of political lsquoconnectednessrsquo from political interest through to duty to vote
Political interest
Declining voter turnout in UK general elections may be taken to imply that we are losing interest in politics But is this actually the case British Social Attitudes has asked people how much interest they have in politics on a regular basis since 1986 asking
How much interest do you generally have in what is going on in politics a great deal quite a lot some not very much or none at all
Table 5 shows that the figures for 2013 the last year in which the question was asked were remarkably similar to the figures for 1986 In 1986 60 had at least ldquosomerdquo interest while in 2013 the figure was 63 The figures for most years in between have also been much the same General election turnouts may have declined over the last three decades but the explanation does not appear to be that people are simply less interested in politics
In this respect British Social Attitudesrsquo findings appear to run counter to the Hansard Societyrsquos Audit of Political Engagement series which until its most recent survey had appeared to show that political interest had declined (Hansard Society 2012 2014) However the drop in political interest they recorded in 2011 (which was replicated in 2012) coincided with a change in polling company while a reversal
NatCen Social Research
British Social Attitudes 32 | Politics 8
of that drop in 2013 followed a switch back to the original company1 The difference between the fluctuation in the Hansard series and the relatively stable level of political interest recorded by British Social Attitudes since 1986 highlights the value of maintaining a consistent approach when attempting to track changes in attitudes over time
Evidence from a slightly different question asked in 2014 as part of the ISSP lsquoCitizenshiprsquo module which asked people ldquoHow interested would you say you personally are in politicsrdquo also indicates that a relatively large section of the British population has at least some level of interest in politics In response to this question as many as 55 say they are ldquoveryrdquo or ldquofairlyrdquo interested while just 14 state they are ldquonot at all interestedrdquo2 Again there is no evidence of a decline in political interest in comparison to a decade earlier ndash if anything slightly more say they are at least ldquofairlyrdquo interested in 2014 (55) than did in 2004 (49)
Neither is there any evidence that peoplersquos confidence in their understanding of politics has waned over the last decade Over half (55) agree that they have ldquoa pretty good understanding of the important political issues facing Britainrdquo (an increase of five percentage points on a decade earlier) Only 15 of people actively disagree that they have ldquoa pretty good understandingrdquo down five percentage points since 2004 (See Appendix Table A1)
Perceived influence over politics
Whether or not people are interested in or understand politics may be irrelevant if they feel that they cannot influence it Perhaps people are less likely to vote now compared with two decades ago because they feel that voting does not make any difference to the issues that matter to them Indeed a version of this argument has been put forward recently by the comedian Russell Brand who has gained considerable attention by arguing that voting is a waste of time because all political parties are in league with international corporate interests (Brand 2014)
Our data suggest that there is indeed quite a high level of scepticism among the British public about their ability to influence political decision-making (Table 6) Forty-four per cent agree that ldquopeople like
Table 5 Interest in politics selected years 1986-2013
1986 1991 1996 2001 2006 2011 2012 2013
Great dealquite a lot 29 32 31 31 34 35 35 32
Some 31 31 33 35 34 31 32 32
Not muchnone at all 39 36 37 34 32 34 33 37
Unweighted base 1548 1445 3620 3287 1077 2215 1103 1063
1 The 2010 survey was conducted by IPSOS MORI the 2011-2012 surveys by TNS and the 2013 survey by IPSOS MORI again2 Full figures are ldquoVery interestedrdquo 11 ldquoFairly interestedrdquo 44 ldquoNot very interestedrdquo 29 ldquoNot at all interestedrdquo 14 ldquoCanrsquot chooserdquo or not answered 2
55 are ldquoveryrdquo or ldquofairlyrdquo interested in politics
NatCen Social Research
British Social Attitudes 32 | Politics 9
me donrsquot have any say about what the government doesrdquo while just over half (53) agree that ldquoI donrsquot think the government cares much what people like me thinkrdquo However we do not seem to be any more likely to be disillusioned in this respect than we were a decade ago ndash in fact the proportion who agree that people like them do not have any say about what government does has actually declined by eight percentage points since 2004 while the proportion who feel the government does not much care what ldquopeople like me thinkrdquo remains largely unchanged3
Much the same picture emerged when we asked people whether they felt they might attempt to influence a political decision such as a proposed unjust or harmful law more directly and if so whether they thought their efforts would gain much traction with parliament The questions were as follows
Suppose a law were being considered by parliament that you considered to be unjust or harmfulhellip
If such a case arose how likely is it that you acting alone or together with others would be able to try to do something about it
If you made such an effort how likely is it that parliament would give serious attention to your demands
Although most (52) say they would be unlikely to try and take action two in five (40) claim they would be ldquoveryrdquo or ldquofairlyrdquo likely to do so (Table 7) However only 16 believe that it is likely that if they did make such an effort parliament would give serious attention to their demands These findings are also broadly similar to those recorded in 2004 Again the British public appears rather doubtful of its ability to influence important political decisions albeit no more so than it was ten years ago
Table 6 Views about perceived influence on politics 2004 and 2014
2004 2014
People like me donrsquot have any say about what the government does
Agree 52 44
Neither agree nor disagree 19 24
Disagree 25 28
I donrsquot think the government cares much what people like me think
Agree 57 53
Neither agree nor disagree 17 20
Disagree 22 23
Unweighted base 853 1580
44 agree that ldquopeople like me donrsquot have any say about what government does
3 The apparent decline of 4 percentage points is not a statistically significant changeNatCen Social Research
British Social Attitudes 32 | Politics 10
Table 7 Suppose a law were being considered by parliament that you considered to be unjust or harmfulhellip 2004 and 2014
2004 2014
If such a case arose how likely is it that you acting alone or together with others would be able to try to do something about it
hellipVeryfairly likely 37 40
hellipVeryfairly unlikely 57 52
hellipDonrsquot know 5 7
If you made such an effort how likely is it that parliament would give serious attention to your demands
hellipVeryfairly likely 17 16
hellipVeryfairly unlikely 77 75
hellipDonrsquot know 5 7
Unweighted base 853 1580
Democracy
Does peoplersquos scepticism about their ability to influence political decisions reflect a general cynicism about the functioning of British democracy Do we agree with Russell Brandrsquos assessment that our current system of parliamentary democracy is flawed To assess this we can look at the responses to the following three questions
How well does democracy work in Britain today
And what about 10 years ago How well did democracy work in Britain then
And how about 10 years from now How well do you think democracy will work in Britain then
In each case respondents were asked to reply by choosing a number between 0 and 10 where 0 indicates ldquovery poorlyrdquo and 10 ldquovery wellrdquo So far as democracy ldquotodayrdquo is concerned a majority 57 make a positive response that is they give an answer (between 6 and 10) above the midpoint (5) of the scale (see the top section of Table 8) However there is no great strength of feeling about this matter almost no-one uses the extreme values on the scale (ie 0 or 10) while sizeable minorities choose the mid-point (18) or say they cannot choose (10)
Meanwhile although people do not appear to think that the state of our democracy is worse now than it was a decade ago ndash assessments of how well it worked ten years ago are very similar to those for ldquotodayrdquo ndash they do appear to be more doubtful about democracyrsquos future prospects Just 47 give a positive response to that question (that is they give the likely future functioning of our democracy a score of 6 or more out of 10) ndash ten points lower than the reading for ldquotodayrdquo However we cannot infer from this that most people are now particularly pessimistic about the future of democracy ndash the 47 whose responses indicate that they expect it
People do not appear to think that the state of our democracy is worse now than it was a decade ago
NatCen Social Research
British Social Attitudes 32 | Politics 11
to function reasonably well a decade from now still far outweigh the 22 who give a definitely negative response to this question (a score of between 0 and 4 out of 10) Moreover the pattern of responses to this question are much the same now as they were in 2004 ndash as indeed is also true of the other two questions While we may not be wildly enthusiastic about how well our democracy works most of us do not yet appear to think it is broken and we are certainly no more negative about it now than we were ten years ago
However there is one feature of our current democracy about which we are apparently rather less enthusiastic about now than we were before 2010 coalition government Since 1983 British Social Attitudes has asked people on a number of occasions whether they prefer single party government or two or more parties in coalition The question reads as follows
Which do you think would generally be better for Britain nowadays to have a government at Westminster formed by one political party on its ownor to have a government at Westminster formed by two political parties together - in coalition
As Figure 1 shows for most of the time between the first British Social Attitudes survey in 1983 and the formation of the Coalition in 2010 support for single party government and for coalition was typically finely balanced only in the late eighties and early nineties did support for single party government temporarily pull ahead However it seems that it did not take much experience of seeing the current Coalition in action to undermine support for the idea
Table 8 Views about democracy in Britain 2004 and 2014
How well democracy works in Britainhellip 2004 2014
helliptoday
0-4 (Below mid-point incl ldquoVery poorlyrdquo) 17 15
5 (mid-point) 18 18
6-10 (Above mid-point incl ldquoVery wellrdquo) 55 57
Canrsquot Choose 10 10
hellip 10 years ago
0-4 (Below mid-point incl ldquoVery poorlyrdquo) 16 14
5 (mid-point) 15 15
6-10 (Above mid-point incl ldquoVery wellrdquo) 53 55
Canrsquot Choose 16 16
hellip 10 years from now
0-4 (Below mid-point incl ldquoVery poorlyrdquo) 23 22
5 (mid-point) 14 14
6-10 (Above mid-point incl ldquoVery wellrdquo) 43 47
Canrsquot Choose 20 18
Unweighted base 853 1580
NatCen Social Research
British Social Attitudes 32 | Politics 12
Table 9 Support for coalition government by party identification 2007 2010 and 2014
favouring coalition government 2007 2010 2014Change
07-14Change
10-14
Conservative 38 41 25 -13 -16
Labour 43 27 28 -16 0
Liberal Democrat 53 59 50 -3 -9
None 47 42 33 -14 -9
in principle At 40 support was already a little lower in 2010 (immediately after the Coalition was formed) than it had been three years earlier (45) But between 2010 and 2011 the proportion who preferred coalition plummeted to just 28 an all-time low and in our most recent survey it still stands at just 29 In contrast as many as 62 now say they favour single party government
Figure 1 Preference for single party or coalition government 1983-2014
The data on which Figure 1 is based can be found in Table A2 in the appendix to this paper
Apparently any hopes that the Liberal Democrats might have had that voters would come to accept coalitions once they saw one in action have been dashed by the experience of the last five years However we need to be aware that votersrsquo reactions to this question are to some degree affected by which party they support As Table 9 shows even before the Coalition was formed Conservative and Labour supporters were less keen on the idea of coalition than the Liberal Democrats ndash after all experience gave both sets of supporters reason to believe that their party had every prospect of being able to form a single party government Nevertheless in both cases around two in five still backed the idea of coalition However as soon as the Coalition between the Conservatives and the Liberal Democrats had been formed Labour supporters in particular became much less keen on the idea with just 27 backing coalition For many of them it seems the idea had become tainted because of its association with their political opponents
29 prefer coalition to single party government
The unweighted bases for Table 9 can be found in Table A3 in the appendix to this paper
NatCen Social Research
British Social Attitudes 32 | Politics 13
Liberal Democrat supporters have largely retained their faith in the idea of coalition
Four years on Liberal Democrat supporters have largely retained their faith in the idea4 but Conservative supporters are now much cooler about it Only a quarter (25) now think it is a good idea Perhaps for them the constraints and tensions of being in coalition have come to seem greater than the immediate benefit it delivered in terms of enabling their party to regain power But if so they are not alone in having formed that view for those with no particular partisan axe to grind are now less keen on coalition too It is perhaps above all the decline in the support (from 42 in 2010 to 33 now) amongst those who do not support any particular party that suggests that partisan considerations aside the experience is not widely thought to have been a great success
Trust
Declining trust in government and politicians is another recurrent theme among those seeking to explain declining turn out in general elections Here there has indeed been a big shift in attitudes during the last three decades On numerous occasions since 1986 British Social Attitudes has asked
How much do you trust British governments of any party to place the needs of the nation above the interests of their own political party
In 2013 the last year for which data are available just one in six (17) said that they trusted governments either ldquojust about alwaysrdquo or ldquomost of the timerdquo (see Figure 2) The figure is typical of that obtained in most non-election years since the turn of the century - but is less than half that recorded in 1986 (38) Conversely nearly one third (32) of people said in 2013 that they ldquoalmost neverrdquo trust the government While that figure is down on the 40 who expressed that view in 2009 at the height of the MPs expenses scandal it is nonetheless higher than it had been at any time before 2003 In short while we have always been somewhat reluctant to invest our faith in politicians we have been markedly less willing to do so during the last decade or so However it is important to note that the most popular answer to this question in 2013 was that people trusted government ldquoonly some of the timerdquo a view held by 51 of people Figure 2 does not include data for those answering ldquoonly some of the timerdquo but these data can be found in Table A4 in the appendix to this paper
4 Although some caution is needed in interpreting figures for Liberal Democrats given the relatively small numbers of their supporters in our sampleNatCen Social Research
British Social Attitudes 32 | Politics 14
Figure 2 Trust in government 1986-2013
+Source the second readings for 1987 and 1997 are from the British Election Study These readings along with those in 2001 2005 and 2010 were taken shortly after an election had been held
The data on which Figure 2 is based can be found in Table A4 in the appendix to this paper
Meanwhile a substantial section of the public questions the personal motivations of their politicians Nearly half (46) agree that ldquomost politicians are in politics only for what they can get out of it personallyrdquo while only 20 disagree Moreover on this issue the publicrsquos view of politicians has deteriorated since this question was last asked a decade ago Then the proportion agreeing with the proposition was five percentage points lower at 41 (See Appendix Table A5)
So when it comes to the question of trust it seems that we are more politically disconnected than we were three decades ago True the decline in trust predated the advent of the Coalition but there is also little evidence that the political reforms enacted by the Conservative-Liberal Democrat Coalition have done anything to reverse the long-term trend The best that can be said is that levels of trust have not fallen yet further
Strength of party political support
Political parties have long been regarded by democratic theorists as an important conduit that helps connect the governed and the government Voters with a strong sense of party identification are more likely both to turn out and vote and to accept the rules and mores of the nationrsquos electoral process (Crewe et al 1977) However much like levels of trust the proportion of voters who strongly identified with a political party (if indeed they identified with a political party at all) was in decline long before the Coalition came to power As Table 10 shows the proportion that said they identified ldquoveryrdquo or ldquofairlyrdquo strongly with a party fell from 46 in 1987 to 36 by 2010 while conversely the proportion that said they did not support a party at all more or less doubled from 8 to 175 Four years later those figures are much the same 37 claim they ldquoveryrdquo or ldquofairlyrdquo strongly identify with a party while nearly one in five (19) say they
5 See the Appendix for full details of the questions asked about peoplersquos party identificationNatCen Social Research
British Social Attitudes 32 | Politics 15
Table 10 Trends in strength of party identification election years between 1987 and 2010 and 2014
1987 1997 2001 2005 2010 2014Change
87ndash 14
Strength of party identification
Very strong 11 9 7 7 7 8 -3
Fairly strong 35 28 29 28 29 29 -6
Not very strong 40 47 49 46 41 44 +4
None 8 10 12 13 17 19 +12
Unweighted base 2766 3620 3287 2766 3294 2636
Most people still accept that they have a duty to vote
do not have an affinity with any party Once again the Coalitionrsquos tenure has not been marked by any evidence of a reversal of the long-term trend
Duty to vote
There is no more important influence on peoplersquos likelihood of voting than whether or not they feel they have a duty to do so (Curtice and Butt 2010) It is thus significant that this too appears to have eroded over the long-term As part of British Social Attitudes we ask our respondents
Which of these statements comes closest to your view about general elections In a general electionhellipItrsquos not really worth votingPeople should only vote if they care who winsItrsquos everyonersquos duty to vote
Most people still accept that they have a duty to vote In 2013 (the last time this question was asked) 57 did so But as Figure 3 shows this is well down on the 76 who felt that way in 1987 or even the 68 who did in 1994 Signs in 2010 and 2011 that perhaps the trend was beginning to be reversed were not confirmed by the more recent 2013 results Once again it appears that the Coalition has been unable to reverse an apparent longer-term trend towards a growing disconnect between voters and the political process
NatCen Social Research
British Social Attitudes 32 | Politics 16
Figure 3 Duty to vote 1987 - 2013
+ Source British Election Study
The data on which Figure 3 is based can be found in Table A6 in the appendix to this paper
So in some respects namely trusting politicians supporting political parties strongly and accepting a duty to vote we do now appear to be less connected than we once were However neither trend started during the Coalitionrsquos tenure and none has continued further since 2010 Nevertheless the Deputy Prime Ministerrsquos hopes that the Coalition would persuade us to put lsquoour faith in politics once againrsquo - do not appear to have been realised Meanwhile the government has certainly not persuaded us of the merits of coalition government itself Still so far at least the experience does not seem to have undermined our faith in Britainrsquos democracy more broadly or our willingness to take an interest in what politicians do
ConclusionsIt is hardly surprising that politicians should have seemingly been preoccupied in recent years with the lsquohealthrsquo of our democracy After all their right to govern depends on the verdict of the ballot box so they inevitably become concerned if we think that none of them is worth our vote Equally their hopes of being able to govern effectively depend in part on our willingness to follow their lead and that seems less likely to happen if we do not trust what they say and do So if as is the case voters have become less likely to vote and less likely to put their trust in them politicians are almost bound to become concerned
But arguably a healthy democracy is also one where citizens keep an eye on what their politicians are doing And in that respect at least Britainrsquos democracy still appears to be reasonably healthy Most of us follow political developments by one means or another while around half us share our views about what has been happening on at least an occasional basis True only a minority have a strong interest in politics but that minority is no smaller than it was nearly 30 years ago We may not be heavily involved but that does not mean we are apathetic about what is done in our name
NatCen Social Research
British Social Attitudes 32 | Politics 17
Where perhaps there is real reason for concern is that many of us are not convinced that politicians would take any notice even if we were turn our interest in politics into action There appears to be a widespread perception that government is uncaring and unresponsive and that politicians themselves are on the make This is not a new mood but it is perhaps one that will have to be addressed if the next government is going to be any more successful than the Coalition has been at persuading us to put our lsquofaith in politicsrsquo ndash and to get involved
NatCen Social Research
British Social Attitudes 32 | Politics 18
References
Brand R (2014) Revolution Century
Butler D and Stokes D (1974) Political Change in Britain 2nd edition London Macmillan
Cabinet Office (2010) The Coalition our programme for government Policy Paper available at httpswwwgovukgovernmentuploadssystemuploadsattachment_datafile78977coalition_programme_for_governmentpdf
Clegg N (2010) Speech on political reform available at httpnewsbbccouk1hiuk_politics8691753stm
Crewe I Saumlrlvik B and Alt J (1977) lsquoPartisan Dealignment 1964-74rsquo British Journal of Political Science 7 129-90
Curtice J (2011) lsquoBridging the gulf Britainrsquos democracy after the 2011 electionrsquo in Park A Clery E Curtice J Phillips M and Utting D (eds) British Social Attitudes the 28th report London Sage
Curtice J and Butt S (2010) ldquoDuty in decline Trends in attitudes to votingrdquo in Park A Curtice J Thomson K Phillips M Clery E and Butt S (eds) British Social Attitudes the 26th Report London Sage
Dunleavy P Gilson C and Sanders D (2010) Is the UK Electorate Disengaged blog entry available at httpblogslseacukpoliticsandpolicyis-the-uk-electorate-disengaged
Electoral Commission (2014) Scottish Independence Referendum report on the referendum held on 18 September 2014 available at httpwwwelectoralcommissionorguk__dataassetspdf_file0010179812Scottish-independence-referendum-reportpdf
Greenslade R (2014) lsquoABC figures show papersrsquo efforts to stem circulation declinersquo The Guardian 10 October Available at httpwwwtheguardiancommediagreenslade2014oct10abc-figures-show-papers-efforts-to-stem-circulation-decline
Hansard Society (2012) Audit of Political Engagement 9 The 2012 Report Part One London Hansard Society for Parliamentary Government available at httpwwwhansardsocietyorgukresearchpublic-attitudesaudit-of-political-engagement
Hansard Society (2014) Audit of Political Engagement 11 The 2014 Report London Hansard Society for Parliamentary Government available at httpwwwhansardsocietyorgukresearchpublic-attitudesaudit-of-political-engagement
House of Commons Political and Constitutional Reform Committee (2014) Voter Engagement in the UK Fourth Report of the 2014-2015 Session HC232 London Stationery Office Ltd available at httpwwwparliamentukvoter-engagement-in-the-uk
NatCen Social Research
British Social Attitudes 32 | Politics 19
Keen R (2015) Membership of UK Political Parties London House of Commons Library Standard Note SNSG5125 available at httpwwwparliamentukbusinesspublicationsresearchbriefing-papersSN05125membership-of-uk-political-parties
Lee L (2012) ldquoReligion ndash Losing faithrdquo in Park A Clery E Curtice J Phillips M and Utting D (eds) British Social Attitudes - The 28th Report London NatCen Social Research available at httpir2flifededatanatcen-social-researchigb_htmlindexphpbericht_id=1000001ampindex=amplang=ENG
Lee L and Young P (2013) ldquoPolitics A disengaged Britain Political interest and participation over 30 yearsrdquo in Park A Bryson C Clery E Curtice J and Phillips M (eds) British Social Attitudes - The 30th Report London NatCen Social Research available at httpbsa-30natcenacuk
Norris P (2002) Democratic Phoenix Reinventing Political Activism Cambridge Cambridge University Press
Sloam P (2014) lsquoNew Voice Less Equal The Civic and Political Engagement of Young people in the United States and Europersquo Comparative Political Studies 43 663-88
Whittam Smith A (2014) ldquoHerersquos what we should do about political disengagementrdquo in The Independent 28 May 2014 available at httpwwwindependentcoukvoicescommentheres-what-we-should-do-about-political-disengagement-9447296html
NatCen Social Research
British Social Attitudes 32 | Politics 20
Appendix
Question wording for Table 1
The full question text for the questions reported in Table 1 is as follows
People sometimes belong to different kinds of groups or associations For each type of group please indicate whether you belong and actively participate belong but donrsquot actively participate used to belong but do not any more or have never belonged to it
A political party
A trade union business or professional association
A church or other religious organisation
A sports leisure or cultural group
Another voluntary association
Question wording for Table 4
The full texts for the questions reported in Table 4 are as follows
Questions relating to use of specific types of media to access political news
On average how often do youhellip
hellipread the political content of a newspaper
hellipwatch political news on television
helliplisten to political news on the radio
hellipuse the Internet to get political news or information
Question relating to use of media in general to access political news
How often do you use the media including television newspapers radio and the internet to get political news or information
Party political identification questions
The British Social Attitudes questions to ascertain party identification are as follows First all respondents are asked
Generally speaking do you think of yourself as a supporter of any one political party
NatCen Social Research
British Social Attitudes 32 | Politics 21
Table A1 Self-assessed understanding of political issues 2004 and 2014
2004 2014
I feel I have a pretty good understanding of the important political issues facing Britain
Agree 50 55
Neither agree nor disagree 25 24
Disagree 20 15
Unweighted base 853 1580
Those who do not name a party in response are then asked
Do you think of yourself as a little closer to one political party than to the others
Those who still do not name a party are then asked
If there were a general election tomorrow which political party do you think you would be most likely to support
Finally all those who named a party at any of these questions are asked about the strength of their support or allegiance
Would you call yourself very strong (party) fairly strong or not very strong
Tables
Table A2 Preference for single party or coalition government 1983-2014
83 86 87 91 94 95 96 03 05
Single party 47 52 58 56 45 45 47 43 48
Coalition 49 43 37 40 49 50 48 50 44
Dont know 4 4 3 3 6 4 5 6 8
Unweighted base 1761 1548 1410 1445 1137 1227 1180 1160 1075
07 10 11 14
Single party 48 48 63 62
Coalition 45 40 28 29
Dont know 7 11 9 8
Unweighted base 992 1081 2215 971
The data for Figure 1 are as follows
NatCen Social Research
British Social Attitudes 32 | Politics 22
Table A3 Unweighted bases for Table 9 Support for coalition by party identification 2007 2010 and 2014
2007 2010 2014
Conservative 268 299 271
Labour 340 315 260
Liberal Democrat 96 138 48
None 157 185 158
Table A5 Attitudes to politiciansrsquo motivations 2004 and 2014
2004 2014
Most politicians are in politics only for what they can get out of it personally
Agree 41 46
Neither agree nor disagree 31 29
Disagree 24 20
Unweighted base 853 1580
+Source the second readings for 1987 and 1997 are from the British Election Study These readings along with those in 2001 2005 and 2010 were taken shortly after an election had been held
The data for Figure 2 are as follows
Table A4 Trust in government 1986-2013
86 87 87+ 91 94 96 97 97+ 98
Just about always most of
the time 38 37 47 33 24 22 26 32 28
Only some of the time 46 49 43 50 53 53 48 53 52
Almost never 11 11 9 14 21 23 23 12 17
Unweighted base 1548 1410 3413 1445 1137 1180 1355 3615 2071
00 01 02 03 05 06 07 09 10
Just about always most of
the time 16 28 26 18 26 19 29 16 20
Only some of the time 58 50 47 49 47 46 45 42 45
Almost never 24 20 24 31 26 34 23 40 33
Unweighted base 2293 1099 2287 3299 3167 1077 992 1143 1081
11 12 13
Just about always most of
the time 22 18 17
Only some of the time 45 49 51
Almost never 31 32 32
Unweighted base 2215 1103 1063
NatCen Social Research
British Social Attitudes 32 | Politics 23
The data for Figure 3 are as follows
Table A6 Duty to vote 1987-2013
87+ 91 94 96 98 00 01 04 05
It is not really worth voting 3 8 9 8 8 11 11 12 12People should only vote if they
care who wins 21 24 21 26 26 24 23 27 23
It is every-onersquos duty to vote 76 68 68 64 65 64 65 60 64
Unweighted base 3413 1224 970 989 1654 2008 2795 2609 1732
08 09 10 11 13
It is not really worth voting 18 17 18 16 16People should only vote if they
care who wins 23 23 20 21 24
It is every-onersquos duty to vote 56 58 61 62 57
Unweighted base 990 1017 921 1909 904
+ Source British Election Study
Acknowledgements
Questions on Citizenship were carried as part of the International Social Survey Programme Britainrsquos participation in ISSP is funded by the Economic and Social Research Council (grant reference ESL0027951)
35 Northampton Square London EC1V 0AX Tel 020 7250 1866 wwwnatcenacuk Company limited by guarantee Reg No 4392418 A Charity registered in England and Wales (1091768) and in Scotland (SC038454)NatCen Social Research
British Social Attitudes 32 | Politics 24
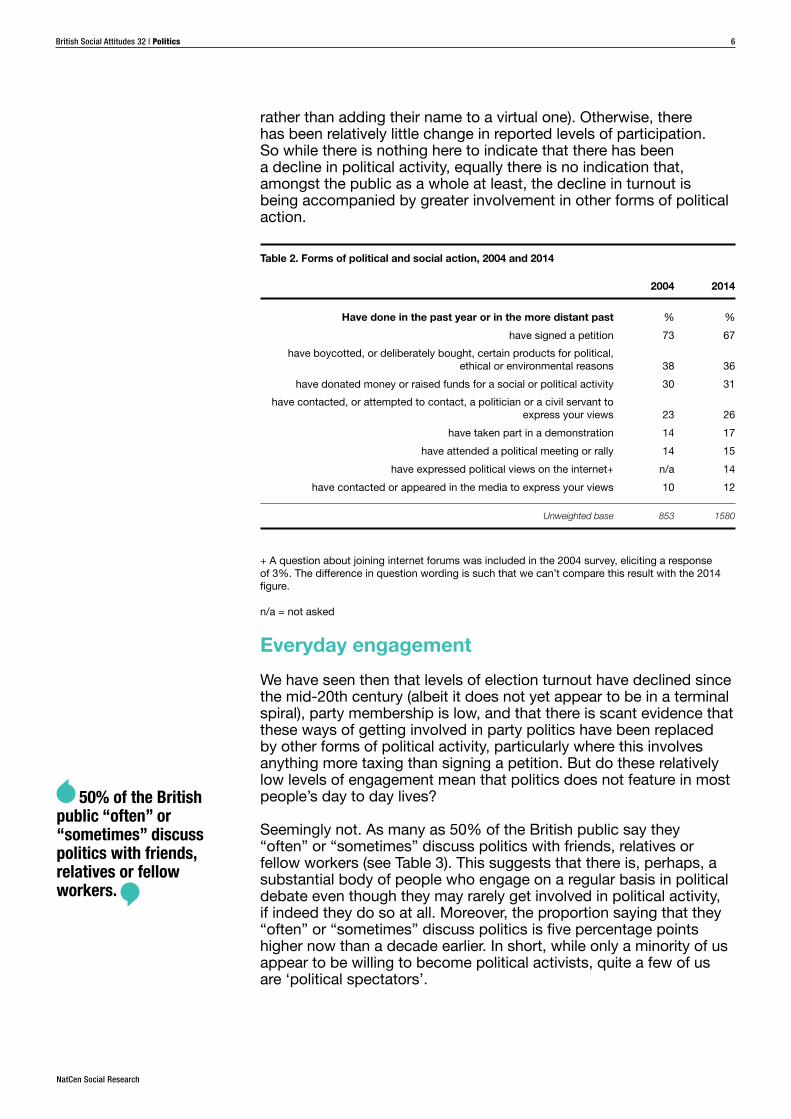
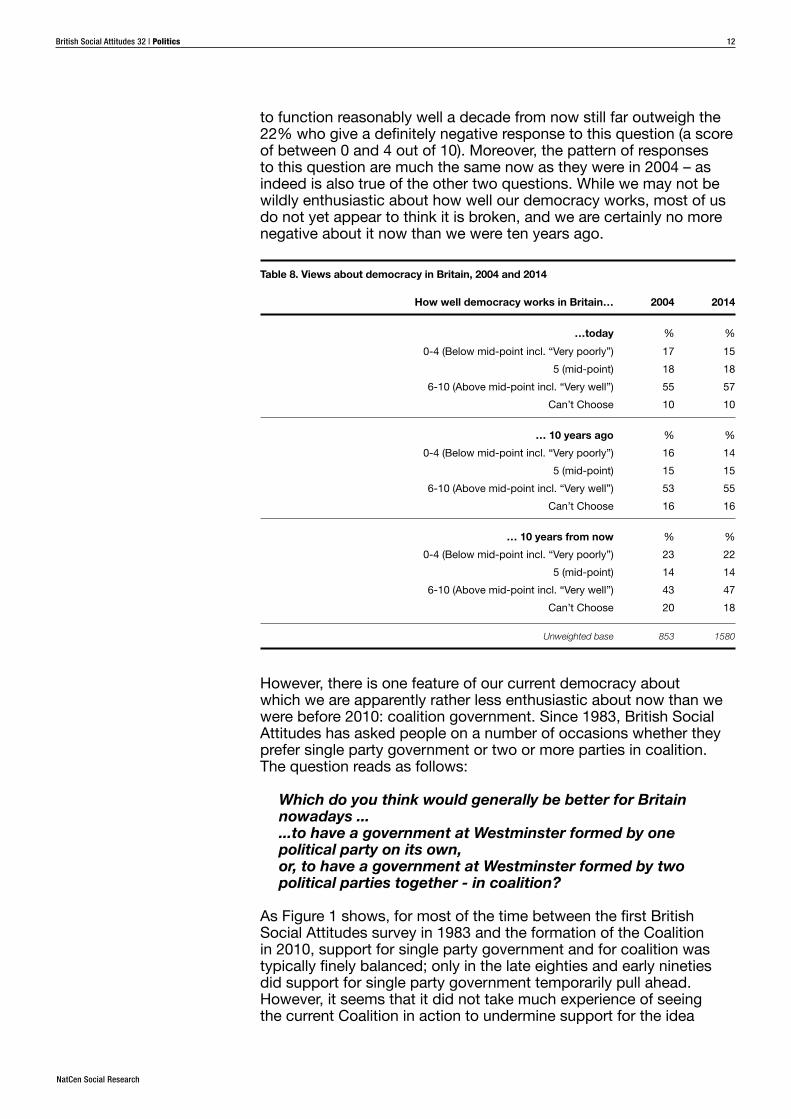