item parameter estimation for dichotomous items based on
TRANSCRIPT

* This study was presented as oral presentation at 6th International Congress on Measurement and Evaluation in Education
and Psychology in KOSOVO.
** Dr, Mehmet Akif Ersoy University Faculty of Education, Burdur-Turkey, [email protected], ORCID ID: 0000-
0002-8315-2637
*** Dr, Mehmet Akif Ersoy University Faculty of Education, Burdur-Turkey, [email protected], ORCID ID: 0000-
0003-0179- 1986
___________________________________________________________________________________________________________________
To cite this article: Uyar, Ş. & Öztürk-Gübeş, N. (2020). The Importance of Sample Weights and Plausible Values in Large-Scale Assessments.
Journal of Measurement and Evaluation in Education and Psychology, 11(1), 27-42. doi: 10.21031/epod.591415 Received: 12.07.2019
Accepted: 06.01.2020
ISSN: 1309 – 6575
Eğitimde ve Psikolojide Ölçme ve Değerlendirme Dergisi
Journal of Measurement and Evaluation in Education and Psychology
2020; 11(1); 27-42
Item Parameter Estimation for Dichotomous Items Based on Item
Response Theory: Comparison of BILOG-MG, Mplus and R (ltm)*
Şeyma UYAR ** Neşe ÖZTÜRK GÜBEŞ ***
Abstract
The aim of this study is twofold. The first one is to investigate the effect of sample size and test length on the
estimation of item parameters and their standard errors for the two parameter item response theory (IRT). Another
is to provide information about the performance of Mplus, BILOG-MG and R (ltm) programs in terms of parameter
estimation under the conditions which were mentioned above. The simulated data were used in this study. The
examinee responses were generated by using the open-source program R. After obtaining the data sets, the
parameters were estimated in BILOG-MG, Mplus and R (ltm). The accuracy of the item parameters and ability
estimates were evaluated under six conditions that differed in the numbers of items and examinees. After looking
at the resulting bias and root mean square error (RMSE) values, it can be concluded that Mplus is an unbiased
program when compared to BILOG-MG and R (ltm). BILOG-MG can estimate parameters and standard errors
close to the true values, when compared to Mplus and R (ltm).
Key Words: IRT, parameter estimation, Mplus, BILOG-MG, ltm
INTRODUCTION
In recent years, especially in the fields of education and psychology, item response theory (IRT) has
been popular (Foley, 2010). Provision of the opportunity of modelling the relationship between
examinees’ ability and their response to an item, makes IRT models more preferable than classical test
theory models (CTT) (de Ayala, 2009; Hambleton, Swaminathan, & Rogers, 1991; Yen & Fitzpatrick,
2006). CTT focuses on the number of correct answers given by the examinee in the test. In other words,
two examinees with the same number of correct answers get the same score in terms of the measured
property, regardless of whether the item is difficult or easy (Proctor, Teo, Hou & Hsieh, 2005).
Moreover, the major advantage of CTT is that it is easy to meet the assumptions in real test data (Fan,
1998; Hambleton & Jones, 1993). On the other hand, IRT requires stronger assumptions than CTT
(Crocker & Algina, 1986). IRT is based on the probability of an examinee’s ability to perform on any
item according to his or her ability. IRT models are functions of items, characterized by item parameters,
and the ability of the examinees. As its name implies, IRT models test the behavior at the item level.
IRT models can be unidimensional or multidimensional. In this study, we considered only
unidimensional IRT models. There are three item parameters used in unidimensional IRT models. These
are difficulty, b; discrimination, a; and pseudo-guessing, c parameters (Hambleton, Swaminathan &
Rogers, 1991; Van Der Linden & Hambleton, 1997).
Unidimensional IRT models vary in the number of item parameters that are used. The one parameter
logistic (1PL) model assumed that all items have an equal discrimination index and the probability of
guessing an item correctly is zero. In the three parameter logistic (3PL) model all three item parameters
vary across items. And in the two parameter logistic (2PL) model only the item difficulty and
discrimination indices vary across items (Lord, 1980). The item response function for the two parameter
logistic (2PL) model is defined as follows:

Journal of Measurement and Evaluation in Education and Psychology
___________________________________________________________________________________
___________________________________________________________________________________________________________________
ISSN: 1309 – 6575 Eğitimde ve Psikolojide Ölçme ve Değerlendirme Dergisi Journal of Measurement and Evaluation in Education and Psychology 28
𝑃𝑖(𝜃) =𝑒𝐷𝑎𝑖(𝜃−𝑏𝑖)
1+𝑒𝐷𝑎𝑖(𝜃−𝑏𝑖) (i=1, 2, …, n) (1)
where 𝑃𝑖(𝜃) is the probability that a randomly selected examinee with ability 𝜃 answers item i correctly.
The parameter 𝑏𝑖 is referred to as index to item difficulty or threshold parameter and describes the point
on the ability scale at which an examinee has a 50 percent probability of answering item i correctly. The
discrimination parameter 𝑎𝑖 is propotional to the slope of 𝑃𝑖(𝜃) at point 𝜃 = 𝑏𝑖. The constant D is a
scaling factor that places the scale of the latent ability approximately on the standard normal metric
when set to 1.7 (Hambleton & Swaminathan, 1985).
One of the advantages of IRT is that item parameters can be estimated independent of the group and
ability parameters can be estimated independent of the item (Hambleton, Swaminathan & Rogers, 1991).
For this reason, IRT provides an appealing conceptual framework for test development (Hambleton,
1989) and IRT-based item and ability estimations are frequently mentioned in test development studies.
The aim of test development studies is to present the models which can estimate the most accurate and
stable item and ability parameters. The estimation of parameters is important because the examinees’
reported score based on these parameters can affect any decision about examinees. For this reason,
researchers aim to reveal the most accurate model to estimate the parameters in various conditions
(Rahman & Chajewski, 2014).
In the literature, the effect of sample size and test length on parameter estimation is frequently
investigated in IRT based test development studies. In these studies (Lim & Drasgow, 1990; Lord, 1968;
Öztürk-Gübeş, Paek & Yao, 2018; Patsula & Gessroli, 1995; Şahin & Anıl, 2017; Yen, 1987; Yoes,
1995) although the minimum number of sample size and the exact length of the test cannot be certainly
specified (Foley, 2010), the optimal number of sample size and test length which should be reached
under various conditions can be revealed. The common point of these studies is that the number of
sample size and test length should be particularly large in complex models and IRT models require large
sample size to make accurate parameter estimations (Hambleton, 1989; Hulin, Lissak & Drasgow,
1982).
Lord (1968) stated that, at least 50 items and 1000 sample sizes were required to estimate the
discriminant parameter (a parameter) accurately for the 3PL model. Swaminathan and Gifford (1983)
investigated the effect of sample size, test length, and the ability distribution on the estimation of item
and ability parameters using the 3-PL model. Their results showed that the condition in which sample
size was 1000 and test length was 20 produced more accurate estimates of the difficulty and guessing
parameters, and fairly good estimates of the item discrimination parameters than the conditions in which
sample size was 50 and test lengths were 10 or 15 and sample size was 200 and test lengths were 10 and
15. Hulin et al. (1982) suggested that at least 500 samples and 30 items were needed for the 2PL model.
They also suggested that the number of sample size should be 1000 and the number of items should be
60 for the 3PL model or when sample size was 2000, test length should be 30. Also, for the 2PL model,
Lim & Drasgow (1990) suggested 750 as the sample size for 20 items; Şahin and Anıl (2017) suggested
500 as the sample size for 20 items and Gübeş, Paek and Yao (2018) pointed out that when the sample
size was 500 or greater, estimation methods produced same and appropriate results with the test lengths
of 11 (small) , 22 (medium) or 44 (large).
In many test applications, it is not always possible to increase the sample size or test length. Therefore,
in recent times researchers focus on the use of the most accurate model and computer program according
to the sample size or test length. Baker (1987) stated that the parameter estimation and the computer
program that is used constitute an inseparable whole. And the characteristics of the obtained parameters
will be affected by the underlying mathematics of the program. For this reason, many computer
programs are available at various times depending on the possibilities offered by technology. BILOG-
MG (Zimowski et al., 2003) has been widely used for parameter estimation in dichotomous items and
has a long history (Baker, 1990; Lim & Drasgow, 1990; Swaminathan & Gifford, 1983). Recently, IRT
analyses have been conducted using the libraries (e.g. package ltm, irtoys) in the open source program
R (Rizopoulos, 2006, 2013; Bulut & Zopluoğlu, 2013; Pan, 2012). Mplus (Muthén & Muthén, 1998-
2012) is another program that is preferred in analyzing latent models. Although there are a lot of
programs for parameter estimation, they are questionable in terms of making accurate estimates.

Uyar, Ş., Öztürk-Gübeş, N. / Item Parameter Estimation for Dichotomous Items Based on Item Response Theory:
Comparison of BILOG-MG, Mplus and R (ltm)
__________________________________________________________________________________
___________________________________________________________________________________________________________________
ISSN: 1309 – 6575 Eğitimde ve Psikolojide Ölçme ve Değerlendirme Dergisi Journal of Measurement and Evaluation in Education and Psychology
29
Therefore, simulation studies can be effective to evaluate the accuracy of estimations. Such studies
allow researchers to compare the estimation results with the true values in various test conditions (Şahin
& Colvin, 2015).
Yen (1987), compared the performance of BILOG and LOGIST in terms of parameter estimates and
item characteristic functions for the three-parameter logistic model. They used 1000 sample size with
10, 20 and 40 test lengths. They indicated that BILOG always produced more accurate estimates of item
parameters especially in short tests. But they pointed out that two programs performed equally for the
20 and 40 item tests. Mislevy & Stocking (1989) recommended using BILOG in short tests and/or small
examinee samples, while LOGIST might be preferred in longer tests.
Şahin and Colvin (2015) investigated the accuracy of the item and ability parameters which were
obtained from “ltm” R package. They compared item and ability estimates with the true parameters
when test lengths were 20 and 40 and sample sizes were 250, 1000 and 2000. They considered bias,
mean absolute deviation (MAD), and root mean square error (RMSE) for the evaluation of accuracy of
“ltm package” in terms of parameter estimation. According to their findings, it can be concluded that
accurate estimates with the 1PL, 2PL, and 3PL can be provided by using ltm. Especially to estimate b
parameters, ltm produced more accurate results. Their findings showed that while ltm estimated
difficulty and ability parameters accurately there were some problems in guessing parameter (c)
estimates. Results obtained from all the conditions showed that the accuracy of parameter estimation
with ltm increased in all the three models as the number of examinees increased.
Rahman and Chahewski (2014) investigated the calibration results of 2PL and 3PL IRT models with
100 items and 1000 examinees in BILOG-MG, PARSCALE, IRTPPRO, flexMIRT, and R (ltm). They
mentioned that ltm is the only software with a negative bias for the discrimination and guessing
parameters while estimating the 3PL model. Their findings indicated that BILOG and PARSCALE
underestimate item difficulties and latent traits, whereas IRTPRO and flexMIRT mostly overestimate
them for 2PL models. And, R package ltm also showed negligible bias for item difficulty in 2 PL
models. The package ltm is unable to perform with the other software programs in 3 PL models, but its
recovery is precise for the latent trait using the 2PL model. Although there is some research about
comparing performance of computer programs in IRT model parameter estimates, it is still necessary to
conduct more research to compare the performance of different programs in parameter estimating.
The aim of this study is to investigate the effect of sample size and test length on the estimation of item
parameters and their standard errors in 2PL models. Another aim of this study is to compare the
performance of Mplus, BILOG-MG and R (ltm) in terms of parameter estimation in different sample
sizes and test lengths. This study will contribute to the discussions about sufficient sample size or test
length when studies are conducted based on IRT. On the other hand, the researchers will be able to get
information about which of the programs they need to access in accordance with the available data or
the parameters to be estimated. This research is original as it includes standart error comparison of
parameters. The data which was simulated based on the parameters of a real test was used in the current
study.
The basic problem investigated in the current study was “How do the parameters and their standard error
estimates change in the BILOG-MG, Mplus and R (ltm) programs when the test length and sample size
change?
METHOD
This research is a simulation based study examined the performance of different programs in terms of
parameter estimation under specific conditions.

Journal of Measurement and Evaluation in Education and Psychology
___________________________________________________________________________________
___________________________________________________________________________________________________________________
ISSN: 1309 – 6575 Eğitimde ve Psikolojide Ölçme ve Değerlendirme Dergisi Journal of Measurement and Evaluation in Education and Psychology 30
Data Generation
The simulated data were used in this study. To mimic a real test situation, examinee responses were
generated based on TIMSS 2015 mathematic test item parameters. The mean and standard deviation of
item parameters which were used in data generation were given in Table 1.
Table 1. Item Parameters Means and Standard Deviations Obtained from TIMSS 2015 Application Test length = 30 Test length = 60
a se (a) b se (b) a se (a) b se (b)
Mean 1.22 0.09 0.70 0.05 1.24 0.09 0.66 0.05
Std. dv. 0.35 0.04 0.54 0.04 0.37 0.05 0.54 0.03
Std. dv: Standart deviation
Furthermore, the ability parameters are drawn from a standard normal distribution which has mean zero
and standard deviation one, N~(0,1). For the response of the ith item and nth examinee; firstly, item
response function was calculated based on 2PL model (see equation 1) then uniform random numbers
were sampled from (0, 1). If the uniform random number was equal or less than the probability of
correctly answering item, item was scored as 1 (correct). Otherwise, item i was scored as 0 (incorrect).
In data simulation, test length and sample size were varied: sample sizes were 500, 1000 and 2000; test
lengths were 30 and 60. In the current study, 3 sample sizes and 2 test lengths conditions yielded to
generate six different data conditions. For each condition, 50 data sets were generated, which resulted
in 300 generated response sets. Six simulation conditions are given in Table 2.
Table 2. Simulation Conditions Condition Sample Size Number of Items
1 500 30
2 1000 30
3 2000 30
4 500 60
5 1000 60
6 2000 60
Data Analysis
In the first step of the data analysis, item parameters were estimated by using the Maximum Likelihood
Estimation (MLE) method according to 2PL model for each condition of test length and sample size.
Parameters were estimated in BILOG-MG, Mplus and R (ltm). In all the programs, default settings were
used.
Mplus is a statistical modeling program which has a flexible modeling capacity. Mplus allows
researchers to do factor analysis, mixture modeling and structural equation modeling. In Mplus,
categorical and continuous data that have single-level or multi-level structure can be analyzed. In
addition, Mplus has extensive facilities for Monte Carlo simulation studies. Normally, non-normally
distributed, missing or clustering data can be generated by using Mplus (Muthén & Muthén, 1998, 2002,
2012).
BILOG-MG is a software program that is designed for analysis, scoring and maintenance of
measurement instruments within the framework of IRT. The program is appropriate for the binary items
scored right, wrong, omitted- or non-presented. The program is concerned with estimating the
parameters of an item and the position of examinees on the underlying latent trait (Zimowski et al.,
2003).
Uyar, Ş., Öztürk-Gübeş, N. / Item Parameter Estimation for Dichotomous Items Based on Item Response Theory:
Comparison of BILOG-MG, Mplus and R (ltm)
__________________________________________________________________________________
___________________________________________________________________________________________________________________
ISSN: 1309 – 6575 Eğitimde ve Psikolojide Ölçme ve Değerlendirme Dergisi Journal of Measurement and Evaluation in Education and Psychology
31
Latent trait models which is shortly abbreviated as “ltm” is an open-source R software package. ltm can
do analysis of univariate and multivariate dichotomous and polytomous data using latent trait models
under the IRT. The package includes IRT models of Rasch, 2PL, 3PL, graded response and generalized
partial credit (Rizopoulos, 2006). In the current study, analyses based on latent trait models were run
under another R package, irtoys . The irtoys is a package which combined some useful IRT programs.
These programs are ICL, BILOG-MG and ltm. In the installing process of irtoys the ltm package is also
automatically loaded (Partchev, 2017).
In the second step of the data analysis, the accuracy of item parameters was investigated by computing
discrepancy between the estimate and true value of the parameter. In order to evaluate the recovery of
item parameters and their standard errors, bias and root mean square error (RMSE) were calculated.
Bias is defined as the average difference between true and estimated parameters. It is a measure of any
systematic error in estimation. To obtain the average bias value, bias was calculated for each replication
of each condition, and then an average bias for each condition was calculated. Bias can take both positive
and negative values. When the bias value is zero and close to zero, it can be decided that the parameter
estimation is unbiased. RMSE is a measure of precision that, like standard deviation, provides
information about the average magnitude of parameter variation around the true parameter. RMSE
always yields positive values and the minimum value of RMSE is zero. If the RMSE value obtained in
the relevant condition is close to zero, it is decided that the estimation stability is high. As the RMSE
value moves away from zero it is interpreted as low estimation stability. For a given parameter, bias and
RMSE indexes were calculated as in equations 2 and 3:
𝐵𝑖𝑎𝑠 = (1
𝑅) ∑ �̂�𝑟 − 𝜑𝑅
𝑟=1 (2)
𝑅𝑀𝑆𝐸 = √∑ (�̂�𝑟 − 𝜑)2/𝑅𝑅𝑟=1 (3)
where 𝜑 is the parameter of interest and r is the replication number index (r = 1, 2, ... , R). In the item
parameter recovery investigation, each of the data generating parameters is 𝜑. These indices were
averaged across all items to compute summary indices for a given condition.
RESULTS
The averages of RMSE and bias value for the estimated parameters in Mplus, BILOG-MG and R (with
ltm) programs across the 50 runs are given in Table 3.
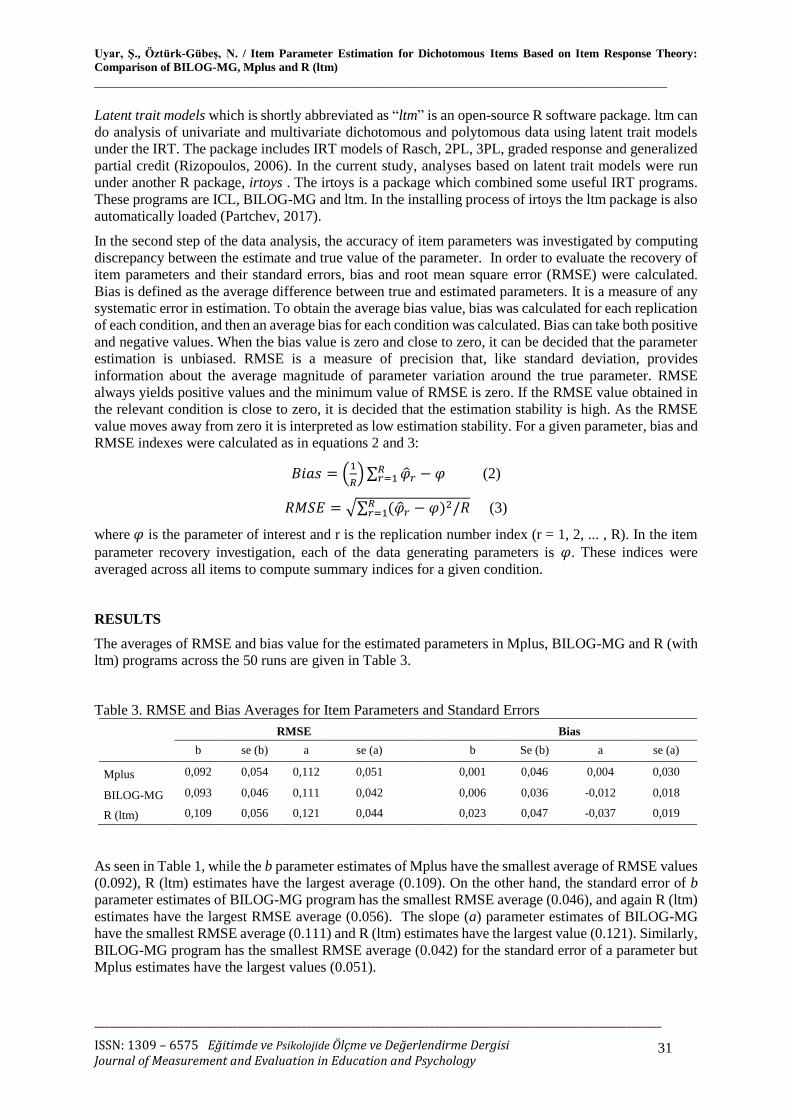
Table 3. RMSE and Bias Averages for Item Parameters and Standard Errors
RMSE Bias
b se (b) a se (a) b Se (b) a se (a)
Mplus 0,092 0,054 0,112 0,051 0,001 0,046 0,004 0,030
BILOG-MG 0,093 0,046 0,111 0,042 0,006 0,036 -0,012 0,018
R (ltm) 0,109 0,056 0,121 0,044 0,023 0,047 -0,037 0,019
As seen in Table 1, while the b parameter estimates of Mplus have the smallest average of RMSE values
(0.092), R (ltm) estimates have the largest average (0.109). On the other hand, the standard error of b
parameter estimates of BILOG-MG program has the smallest RMSE average (0.046), and again R (ltm)
estimates have the largest RMSE average (0.056). The slope (a) parameter estimates of BILOG-MG
have the smallest RMSE average (0.111) and R (ltm) estimates have the largest value (0.121). Similarly,
BILOG-MG program has the smallest RMSE average (0.042) for the standard error of a parameter but
Mplus estimates have the largest values (0.051).
Journal of Measurement and Evaluation in Education and Psychology
___________________________________________________________________________________
___________________________________________________________________________________________________________________
ISSN: 1309 – 6575 Eğitimde ve Psikolojide Ölçme ve Değerlendirme Dergisi Journal of Measurement and Evaluation in Education and Psychology 32
Considering the bias values in Table 3, it can be said that the Mplus program has the smallest bias values
for a (0.004) and b parameters (0.001); BILOG-MG has the smallest bias values for the se(b) (0.036)
and se(a) (0.018) parameters. While, the R (ltm) has the largest mean of bias values for the b (0.023),
se(b) (0.047) and a (-0.037) parameters; Mplus program has the largest bias values for the se(a) (0.030)
parameter.
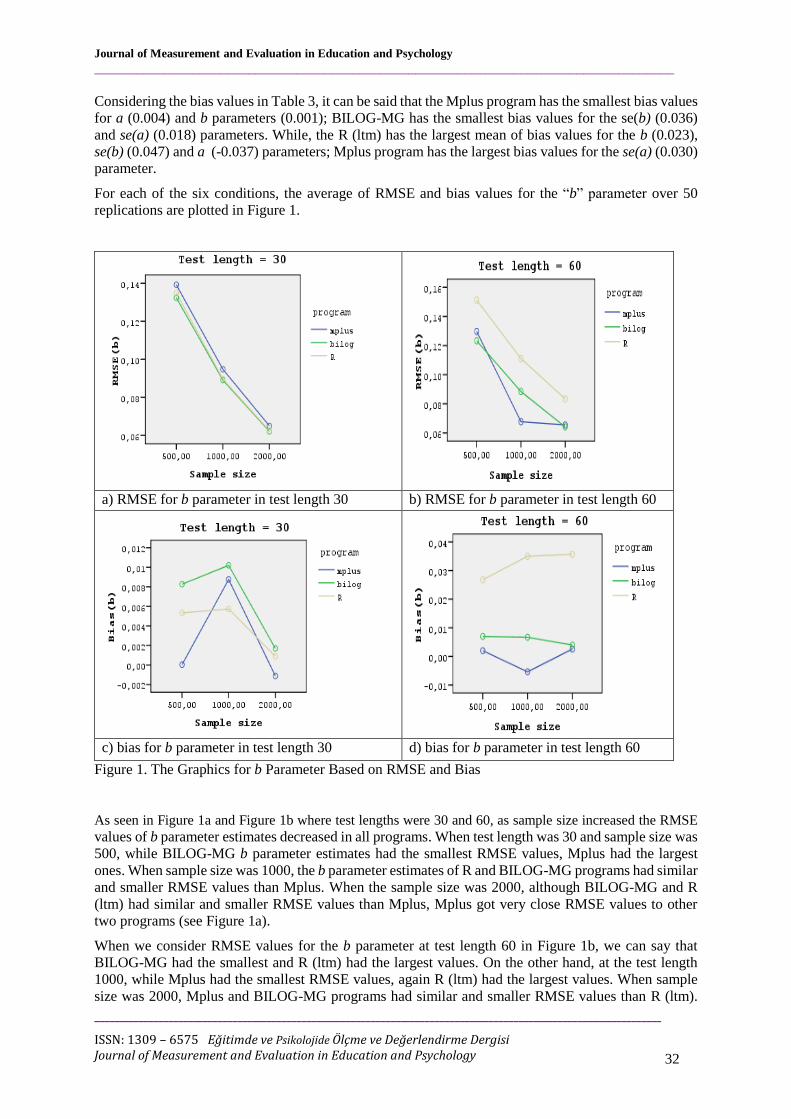
For each of the six conditions, the average of RMSE and bias values for the “b” parameter over 50
replications are plotted in Figure 1.
a) RMSE for b parameter in test length 30 b) RMSE for b parameter in test length 60
c) bias for b parameter in test length 30 d) bias for b parameter in test length 60
Figure 1. The Graphics for b Parameter Based on RMSE and Bias
As seen in Figure 1a and Figure 1b where test lengths were 30 and 60, as sample size increased the RMSE
values of b parameter estimates decreased in all programs. When test length was 30 and sample size was
500, while BILOG-MG b parameter estimates had the smallest RMSE values, Mplus had the largest
ones. When sample size was 1000, the b parameter estimates of R and BILOG-MG programs had similar
and smaller RMSE values than Mplus. When the sample size was 2000, although BILOG-MG and R
(ltm) had similar and smaller RMSE values than Mplus, Mplus got very close RMSE values to other
two programs (see Figure 1a).
When we consider RMSE values for the b parameter at test length 60 in Figure 1b, we can say that
BILOG-MG had the smallest and R (ltm) had the largest values. On the other hand, at the test length
1000, while Mplus had the smallest RMSE values, again R (ltm) had the largest values. When sample
size was 2000, Mplus and BILOG-MG programs had similar and smaller RMSE values than R (ltm).

Uyar, Ş., Öztürk-Gübeş, N. / Item Parameter Estimation for Dichotomous Items Based on Item Response Theory:
Comparison of BILOG-MG, Mplus and R (ltm)
__________________________________________________________________________________
___________________________________________________________________________________________________________________
ISSN: 1309 – 6575 Eğitimde ve Psikolojide Ölçme ve Değerlendirme Dergisi Journal of Measurement and Evaluation in Education and Psychology
33
We can say that in all sample sizes at the test length 60, based on RMSE index, R (ltm) performed
worse than other programs in terms of estimating b parameter.
The graphic in Figure 1c showed that at the test length 30, the smallest bias values for the b parameter
were obtained by Mplus and the largest ones were obtained by BILOG-MG program. However, at the
sample size 1000, R (ltm) had the smallest bias values and again BILOG-MG had the largest RMSE
values. At the sample size 2000, while Mplus had the smallest bias values, again BILOG-MG had very
close but larger bias than R (ltm). Also, when sample size increased from 500 to 1000, bias values of b
parameter estimates from all programs increased but as sample size increased from 1000 to 2000, bias
values decreased (see Figure 1c).
If we consider bias values for the b parameter at the test length of 60 and sample sizes of 500 and 1000,
while the smallest bias values were obtained by Mplus, the largest ones got from R program. At the
sample size of” 2000, bias values for b parameter estimates of R program were larger than other
programs but BILOG-MG estimates had very close bias values to Mplus program (see Figure 1d).
For each of six conditions, the average of RMSE and bias values for the “se(b)” parameter over 50
replications were plotted in Figure 2.
a) RMSE for se(b) parameter in test length 30 b) RMSE for se(b) parameter in test length 60
c) bias for se(b) parameter in test length 30 d) bias for se(b) parameter in test length 60
Figure 2. RMSE and Bias Values for se(b) Parameter
As seen in Figure 2, at the two test lengths as sample size increased, bias and RMSE values decreased
for the se(b) estimates from all the programs. Considering the test length of 30 in Figure 2a and 2d, the

Journal of Measurement and Evaluation in Education and Psychology
___________________________________________________________________________________
___________________________________________________________________________________________________________________
ISSN: 1309 – 6575 Eğitimde ve Psikolojide Ölçme ve Değerlendirme Dergisi Journal of Measurement and Evaluation in Education and Psychology 34
smallest RMSE and bias values for the se(b) parameter were obtained from BILOG-MG estimates at all
the sample sizes. And Mplus and R (ltm) had similar but larger RMSE and bias values than BILOG-
MG. According to results, we can say that at all sample sizes, BILOG-MG program performed best in
estimating se(b) parameter. Similarly, at the test length of 60 and sample size of 500, again BILOG-MG
had the smallest and R (ltm) had the largest RMSE and bias values for the se(b) parameter (see Figure
2b). At the sample size of 1000 and 2000, Mplus and R (ltm) had similar but larger RMSE and bias
values than BILOG-MG program. However, at the sample size of 2000, the performance of three
programs got very close to each other, BILOG-MG still estimated smaller RMSE and bias values for
the se(b) parameter. In other words, we can say that BILOG-MG performed best in terms of estimating
se(b) parameter at all the test lengths and sample sizes.
For each of six conditions, the average of RMSE and bias values for the “a” parameter over 50
replications are plotted in Figure 3.
a) RMSE for a parameter in test length 30 b) RMSE for a parameter in test length 60
c) bias for a parameter in test length 30 d) bias for a parameter in test length 60
Figure 3. RMSE and Bias Values for a Parameter
As shown in Figure 3a and 3b, when test lengths were 30 and 60, RMSE values of a parameter decreased
as the sample size increased. This drop was sharper for Mplus and BILOG-MG programs when the
number of item was 60. When test length was 30 and sample sizes were 500 and 1000, although BILOG-
MG program had smaller RMSE values than other programs, at the test length of 2000, all of the three
programs had similar RMSE values (see Figure 3a). We can say that while BILOG-MG had the best

Uyar, Ş., Öztürk-Gübeş, N. / Item Parameter Estimation for Dichotomous Items Based on Item Response Theory:
Comparison of BILOG-MG, Mplus and R (ltm)
__________________________________________________________________________________
___________________________________________________________________________________________________________________
ISSN: 1309 – 6575 Eğitimde ve Psikolojide Ölçme ve Değerlendirme Dergisi Journal of Measurement and Evaluation in Education and Psychology
35
performance at the sample size of 500 and 1000, at the sample size of 2000, all the programs performed
similar in terms of estimating a parameter.
When test length increased to 60, programs performance changed due to sample size. For example, at
the sample size of 500, Mplus and R (ltm) performed similar but they had larger RMSE values than
BILOG-MG estimates. Under the condition where the sample size was 1000, the Mplus program had
smallest and the R (ltm) had the largest RMSE values. At the sample size of 2000, while Mplus and
BILOG-MG performed best, R (ltm) performed worst (see Figure 3b).
As shown in Figure 3c, for the test length 30, as sample sizes increased, bias values decreased in all
programs except for Mplus. Also, Mplus had the smallest bias values and BILOG-MG was the largest
bias values at all sample sizes. At the test length of 60, although BILOG-MG performed as well as
Mplus program, generally Mplus had the smallest and R (ltm) had the largest bias values at all the
sample sizes.
In Figure 4, the average of RMSE and bias values for the “se(a)” parameter over 50 replications are
plotted.
a) RMSE for se(a) parameter in test length 30 b) RMSE for se(a) parameter in test length 60
c) bias for se(a) parameter in test length 30 d) bias for se(a) parameter in test length 60
Figure 4. RMSE and Bias Values for se(a) Parameter
As seen in Figure 4a, in all the programs, as sample size increased, RMSE values of se(a) parameter
decreased in test length 30 conditions. At the sample size of 500, while BILOG-MG had the smallest
RMSE values and it had the best performance, Mplus and R (ltm) had similar but larger RMSE values.
When the sample size increased from 500 to 1000, RMSE values for se(a) were sharply decreased in all

Journal of Measurement and Evaluation in Education and Psychology
___________________________________________________________________________________
___________________________________________________________________________________________________________________
ISSN: 1309 – 6575 Eğitimde ve Psikolojide Ölçme ve Değerlendirme Dergisi Journal of Measurement and Evaluation in Education and Psychology 36
the programs and although BILOG-MG estimates of se(a) had the smallest RMSE values, we can say
that all of the three programs showed similar performance. And especially at the sample size of 2000,
the performance of three programs is the same (see Figure 4a).
In conditions where test length was 60 and samples sizes were 500 and 1000, R (ltm) and BILOG-MG
had smillar and smaller RMSE values than Mplus, but at the sample size of 2000, all the programs had
similar RMSE values (see Figure 4b). Also we can say that as sample size increased from 500 to 1000,
the RMSE values decreased in all programs. When sample size increased from1000 to 2000, RMSE
values decreased for Mplus, but for BILOG-MG and R (ltm), RMSE values increased (see Figure 4b).
When we looked at the bias values in Figures 4c and 4d, we can see that at the test lengths of 30 and 60,
as sample size increased, bias values for se(a) decreased in all the programs. At the test length of 30
and sample sizes of 500 and 1000, Mplus and R (ltm) programs had similar but larger bias values than
BILOG-MG program but at the test length of 60 still Mplus had the largest bias values, BILOG-MG
and R (ltm) had similar and smaller values than Mplus. On the other hand, at the sample size of 2000,
for both of test lengths, we can say that all the programs had similar bias values for se(a) estimates.
According to Table 3 and Figure 4, when the number of items was 30, the RMSE values of se (a)
decreased as the sample size increased in all the programs. When the sample size was 500, the smallest
RMSE values were obtained by BILOG. All the programs showed similar performance when the sample
size was 2000. When the number of item was 60, RMSE values of se (a) tended to decrease as the
sample size increased. But when the sample size was 2000, the RMSE value of se (a) increased in
BILOG and R (ltm) programs. The smallest RMSE values for se (a) were obtained in BILOG-MG and
R (ltm). In all the three programs, while the number of items were 30 and 60, the bias values of se (a)
decreased as the sample size increased. When test length was 30, the smallest bias values were obtained
by BILOG-MG. When the number of items was 60, BILOG-MG and R (ltm) showed better and similar
performance compared to Mplus.
DISCUSSION and CONCLUSION
The aim of this study was to investigate the effects of sample size and test length on parameter estimates
and to compare the performance of Mplus, BILOG-MG and R (ltm) in terms of parameter estimation
accuracy. The conclusions based on results can be listed as follows:
According overall results based on RMSE index, we can say that while Mplus was the best program in
estimating b parameter, it was the worst program in estimating se (a) parameter. BILOG-MG was the
best and R (ltm) was the less effective in estimating se(b), a and se(a) parameters. This result is
consistent with the findings of Rahman and Chajewski (2014). The researchers compared the RMSE
values for the parameter estimates obtained by BILOG, PARSCALE, IRTPRO, flexMIRT and ltm
package in R software. They found that although the estimation results were within acceptable ranges,
the R (ltm) showed the most erroneous estimation. With regard to bias index, Mplus was the best in
estimating b and a parameters but it was the worst program in estimating se(a) parameter. On the other
hand BILOG-MG was the best in estimating se(a) and se(b) parameters. Lastly, R (ltm) was the worst
in estimating, b, se(b) and a parameters. Besides, Muthén (1999) noted that small differences between
BILOG-MG and Mplus estimates can be ignored, because both programs use the ML estimation but
BILOG uses the logit function (D=1.7) instead of the probit function.
In all test the lengths, as sample sizes increased, RMSE values decreased for all the parameter estimates.
This finding supports the conclusion that the increasing sample size minimizes RMSE values for
parameter estimation in the literature (Şahin & Anıl, 2017; Şahin & Colvin, 2015; Lord,1968; Ree &
Jensen,1980). The consistency of the estimator increases as the sample size increases, and estimated
parameters tend to approach to the true values (Thissen & Wainer, 1982). In addition, as the sample
size increases, the standard errors of the sample decrease, therefore, RMSE values for parameter
estimations can be reduced (Stone, 1992). As stated by Edelen and Reeve (2007), the standard errors of
parameter estimations are also reduced as the sample size increases.
Uyar, Ş., Öztürk-Gübeş, N. / Item Parameter Estimation for Dichotomous Items Based on Item Response Theory:
Comparison of BILOG-MG, Mplus and R (ltm)
__________________________________________________________________________________
___________________________________________________________________________________________________________________
ISSN: 1309 – 6575 Eğitimde ve Psikolojide Ölçme ve Değerlendirme Dergisi Journal of Measurement and Evaluation in Education and Psychology
37
Based on RMSE index, at the test length of 30 and sample size of 500, BILOG-MG was the best
performing program in estimating b parameter but as sample size increased to 1000 or to 2000, R (ltm)
performed as well as BILOG-MG. According to Şahin & Colvin (2015), especially b parameters can be
estimated most accurately by ltm for 1 PL, 2 PL and 3PL models. In our study, although the performance
of Mplus was found to be closer to the other programs at sample size of 2000, generally it was the worst
performing program in estimating b parameter. When test length increased to 60, at all of the sample
sizes, R (ltm) was the less effective program in estimating b parameter and the performance of BILOG-
MG and Mplus program was affected by the sample sizes. For example, while BILOG-MG performed
better than Mplus at the sample size 500, Mplus performed better at sample size 1000 and both programs
performed similar at the sample size of 2000.
In terms of bias index at the test length of 30, while Mplus was the best performing at sample sizes of
500 and 2000, R (ltm) was the best at sample size of 1000 and BILOG-MG was the low performing
program in estimating b parameter. When test length was increased to 60, although the performance of
BILOG-MG got very close to that of Mplus program at the sample size of 2000, Mplus was the best and
R (ltm) was the worst performing program in estimating b parameter.
Another conclusion that can be drawn from this study according to RMSE and bias index for se (b) is
that, BILOG-MG was the best performing program at all the test lengths and sample sizes. Although at
the test length of 60, Mplus performed better than R (ltm) in some cases (i.e.at sample size 500),
generally Mplus and R (ltm) showed similar performance. And another result is that as sample size
increased, bias in estimating se(b) parameter decreased in all the programs. According to Toland (2008),
the accuracy of the estimated se(b) in BILOG- MG is related to sample size for 2 PL model. He found
that for sample size of 4000, consistent estimation of se(b) can be found throughout the range of
difficulty parameters. But when sample size was 500, accuracy of se(b) decreased for larger b parameters
in BILOG-MG. So he suggests that researchers can use BILOG-MG confidently for se (b) estimations
in other applications with large sample sizes.
If we consider RMSE values for the a parameter, especially at the smallest sample sizes and for both
test lengths, BILOG-MG was the best performing program. For the test length 30, at the sample sizes of
1000 and 2000, the performance of three the programs was very similar. At the test length of 60, although
Mplus was the best performing program at sample size of 1000, BILOG-MG caught Mplus at sample
size of 2000. Lastly, we can say that R (ltm) was the low performing program for test length 60.
In terms of bias values for a parameter, results showed that at the test length 30, Mplus was the best and
BILOG-MG was the worst performed. At the test length 60, although BILOG-MG performed as well as
Mplus program, generally Mplus performed best and R (ltm) performed the worst.
For se(a) parameter, based on RMSE index, at the test length 30, although R (ltm) and Mplus programs
caught BILOG-MG’s performance at sample sizes 1000 and 2000, generally BILOG-MG was the best.
On the other hand, for the test length 60, although the three programs performed similar at the biggest
sample size, BILOG-MG and R (ltm) performed similar and better than Mplus. According to Toland
(2008), users of BILOG-MG can get reasonably accurate estimates of se(a) under the 2PL model for
smaller values of a parameters (i.e., a < 1.4). These findings concur with the findings of the current
study. This may be due to the fact that the true values of a parameter are less than 1.4 for only 4 items
within 30 items and less than 1.4 for 13 items within 60 items.
In the previous studies, it is seen that RMSE values obtained for a parameter were between 0.11 and
0.15 and between 0.10 to 0.14 for b parameter. In this study, the RMSE values obtained from Mplus,
BILOG-MG and R (ltm) were consistent with the previous studies, because they are in the same range
as those obtained in previous studies (Gao & Chen, 2005; Kim, 2006; Yen, 1987). Therefore, it can be
said that all the three programs can be used to estimate a and b parameters, because they predict a and
b parameters close to their true values.

Journal of Measurement and Evaluation in Education and Psychology
___________________________________________________________________________________
___________________________________________________________________________________________________________________
ISSN: 1309 – 6575 Eğitimde ve Psikolojide Ölçme ve Değerlendirme Dergisi Journal of Measurement and Evaluation in Education and Psychology 38
REFERENCES Baker, F. B. (1987). Methodology review: Item parameter estimation under the one, two and three parameter
logistic models. Applied Psychological Measurement, 11(2), 111- 141.
Baker, F. B. (1990). Some observations on the metric of BILOG results. Applied Psychological Measurement,
14(2), 139–150. DOI: https://doi.org/10.1177/014662169001400203
Baker, F. B. (1998). An investigation of the item parameter recovery of a Gibbs sampling procedure. Applied
Psychological Measurement, 22(2), 153–169. DOI: https://doi.org/10.1177/01466216980222005 Bulut, O. & Zopluoğlu, C. (2013). Item parameter recovery of the graded response model using the R package
ltm: A Monte Carlo simulation study. Paper presented at the annual meeting of the American Educational
Research Association, San Francisco, CA.
Crocker, L. & Algina, J. (1986). Introduction to classical and modern test theory. N.Y: CBS College Publishing
Company.
de Ayala, R. J. (2009). The theory and practice of item response theory. New York: The Guilford Press.
Edelen, M. O., & Reeve, B. B. (2007). Applying item response theory (IRT) modeling to questionnaire
development, evaluation, and refinement. Quality of Life Research, 16(1), 5–18. DOI:
http://dx.doi.org/10.1007/s11136-007-9198-0
Fan, X. (1998). Item response theory and classical test theory: An empirical comparison of their item/person
statistics. Educational and Psychological Measurement, 58(3), 357-381. DOI:
https://doi.org/10.1177/0013164498058003001
Foley, B. (2010). Improving IRT parameter estimates with small sample sizes: Evaluating the efficacy of a new
data augmentation technique. Open Access Theses and Dissertations from the College of Education and
Human Sciences. Paper 75
Gao, F. & Chen, L. (2005). Bayesian or non-Bayesian: A comparison study of item parameter estimation in the
three-parameter logistic model. Applied Measurement in Education, 18(4), 351-380.
Gübeş, N. Ö., Paek, I., & Cui, M. (2018). Örneklem büyüklüğünün ve test uzunluğunun MTK parametre
kestirimine etkisi. Pegem Atıf İndeksi, 135-148.
Hambleton, R. K. (1989). Principles and selected applications of item response theory. In R. Linn (Ed.),
Educational Measurment (3rd.ed., pp. 147-200). New York: Macmillan.
Hambleton, R. K., & Jones, R. W. (1993). Comparison of classical test theory and item response theory and their
applications to test development. Educational Measurement: Issues and Practice, 12(3), 38–47.
DOI: https://doi.org/10.1111/j.1745-3992.1993.tb00543.x
Hambleton, R. K. & Swaminathan, H. (1985). Item response theory principles and applications. Boston: Kluwer-
Nijhoff Publishing
Hambleton, R. K., Swaminathan, H. & Rogers, H. J. (1991). Fundamentals of item response theory. Newbury
Park, Calif.: Sage Publications.
Hulin, C. L., Lissak, R. I., & Drasgow, F. (1982). Recovery of two and three-parameter logistic item characteristic
curves: A Monte Carlo study. Applied Psychological Measurement, 6(3), 249–260. http://dx.doi.org/
10.1177/014662168200600301
Kim, S. (2006). A comparative study of IRT fixed parameter calibration methods. Journal of Educational
Measurement, 43(4), 355-381. DOI: https://doi.org/10.1111/j.1745-3984.2006.00021.x
Lim, R. G. & Drasgow, F. (1990). Evaluation of two methods for estimating item response theory parameters when
assessing differential item function. Journal of Applied Psychology, 75(2), 164–174.
Lord, F. M. (1968). An Analysis of the Verbal Scholastic Aptitude Test using Birnbaum's three-parameter logistic
model. Educational and Psychological Measurement, 28(2), 989-1020. DOI: https://doi.org/10.1002/j.2333-8504.1967.tb00987.x
Lord, F. M. (1980). Applications of item response theory to practical testing problems. Hillsdale, NJ: Lawrence
Erlbaum.
Mislevy, R. J. & Stocking, M. L. (1989). A consumer’s guide to LOGIST and BILOG. Applied Psychological
Measurement, 13(1), 57-75.
Muthén, B. O. (1999). IRT models in Mplus. Retrieved from
http://www.statmodel.com/discussion/messages/23/25.html
Muthén, L. K., & Muthén, B. O. (1998-2012). Mplus user’s guide (8th ed.). Los Angeles, CA: Muthén & Muthén
Muthén, L. K., & Muthén, B. O. (2002). How To Use A Monte Carlo Study To Decide On Sample Size and
Determine Power. Structural Equation Modeling: A Multidisciplinary Journal, 9(4), 599-620.
Pan, T. (2012). Comparison of four maximum likelihood methods in estimating the Rasch model. Paper presented
at the annual meeting of the American Educational Research Association, Vancouver, Canada.
Partchev, I. (2017). Package ‘irtoys’. A collection of functions related to item response theory (IRT).

Uyar, Ş., Öztürk-Gübeş, N. / Item Parameter Estimation for Dichotomous Items Based on Item Response Theory:
Comparison of BILOG-MG, Mplus and R (ltm)
__________________________________________________________________________________
___________________________________________________________________________________________________________________
ISSN: 1309 – 6575 Eğitimde ve Psikolojide Ölçme ve Değerlendirme Dergisi Journal of Measurement and Evaluation in Education and Psychology
39
Patsula, L. N., & Gessaroli, M. E. (1995). A comparison of item parameter estimates and ICCs produced with
TESTGRAF and BILOG under different test lengths and sample sizes. Paper presented at the annual
meeting of the National Council on Measurement in Education, San Francisco, CA.
Proctor, T., Teo, K.-S., Hou & J., Hsieh (2005). Comparison of Parameter Recovery in a 2 Parameter Logistic
Item Response Model using MLE and Bayesian MCMC Methods. Class project for 07P:148/22S:138
Bayesian Statistics,University of Iowa.
Rahman, N. & Chajewski, M. (2014). A Comparison and Validation of 2- and 3-PL IRT Calibrations in BILOG,
PARSCALE, IRTPPRO, flexMIRT, and LTM (R). National Council of Measurement in Education at
Philadephia.
Ree, M. J., & Jensen, H. E. (1980). Effects of sample size on linear equating of item characteristic curve
parameters. In D. J. Weiss (Ed.), Proceedings of the 1979 Computerized Adaptive Testing Conference.
Minneapolis, MN: University of Minnesota.
Rizopoulos, D. (2006). ltm: An R package for latent variable modelling and item response theory analyses. Journal
of Statistical Software, 17(5), 1–25.
Swaminathan, H. & Gifford, J. (1983). Estimation of parameters in the three-parameter latent trait model. In D. J.
Weiss & R. D. Bock (Eds.), New horizons in testing: latent trait test theory and computerized adaptive
testing (pp. 13–30). New York: Academic Press.
Stone, C. A. (1992). Recovery of marginal maximum likelihood estimates in the two-parameter logistic response
model: An evaluation of MULTILOG. Applied Psychological Measurement, 16(1), 1–16. DOI:
http://dx.doi.org/10.1177/014662169201600101
Şahin, A., & Anıl, D. (2017). The effects of test length and sample size on item parameters in item response
theory. Educational Sciences: Theory and Practice, 17(1), 321-335. DOI: 10.12738/estp.2017.1.0270
Şahin, F. & Colvin, K. (2015). Evaluation of R package ltm with IRT dichotomous models. NERA Conference
Proceedings, 6.
Thissen, D. & Wainer, H. (1982). Some standard errors in item response theory. Psychometrika, 47(4), 397–412.
DOI: 10.1007/BF02293705
Toland, M. D. (2008). Determining the accuracy of item parameter standart error of estimates in BILOG-MG3.
Doctoral dissertation. Available from ProQuest LLC (UMI Number 3317288)
Van der Linden, W. & Hambleton, R. K. (1997). Handbook of modern item response theory. Newyork: Springer-
Verlag.
Yen, W. M. (1987). A comparison of the efficiency and accuracy of BILOG and LOGIST. Psychometrika, 52(2),
275–291. DOI: http://dx.doi.org/10.1007/BF02294241
Yen, W., & Fitzpatrick, A. R. (2006). Item response theory. In R. L. Brennan (Ed.), Educational measurement
(4th ed., pp. 111-153). Westport, CT: Praeger Publishers.
Yoes, M. (1995). An updated comparison of micro-computer based item parameter estimation procedures used
with the 3-parameter IRT model. Saint Paul, MN: Assessment Systems Corporation.
Zimowski, M., Muraki, E., Mislevy, R. J., & Bock, R. D. (2003). BILOG-MG 3: Item analysis and test scoring
with binary logistic models. Chicago, IL: Scientific Software.
İki Kategorili Puanlanan Maddelerde Madde Tepki Kuramına
Dayalı Parametre Kestirimi: BILOG-MG, Mplus and R (ltm)
Karşılaştırması
Giriş
Son yıllarda özellikle eğitim ve psikoloji alanlarında madde tepki kuramı (MTK) modellerinin kullanımı
popülarite kazanmıştır (Foley, 2010). MTK’nın bireyin yeteneği ile maddeye verdiği yanıt arasındaki
ilişkiyi modelleyebilme avantajı sunması klasik test kuramı (KTK) modellerine göre daha çok tercih
edilmesini sağlamıştır (de Ayala, 2009; Hambleton, Swaminathan & Rogers, 1991; Yen & Fitzpatrick,
2006). KTK, bireyin testte verdiği doğru cevap sayısına odaklanmaktadır. Yani doğru cevap sayısı aynı
olan iki birey sorunun zor ya da kolay olması dikkate alınmadan ölçülen özellik bakımından aynı puana
sahip olmaktadır (Proctor, Teo, Hou & Hsieh, 2005 ). Oysa MTK, bireyin yeteneğine göre herhangi bir
madde üzerinde göstereceği performansın olasılığı üzerine temellenmektedir ve madde parametrelerini
gruptan bağımsız, yetenek parametrelerini ise maddeden bağımsız olarak kestirmektedir (Hambleton,
Journal of Measurement and Evaluation in Education and Psychology
___________________________________________________________________________________
___________________________________________________________________________________________________________________
ISSN: 1309 – 6575 Eğitimde ve Psikolojide Ölçme ve Değerlendirme Dergisi Journal of Measurement and Evaluation in Education and Psychology 40
Swaminathan & Rogers, 1991). Bu nedenle MTK’ ya dayalı madde ya da yetenek kestirimleri özellikle
test geliştirme çalışmalarında adından sıklıkla söz ettirmektedir.
Test geliştirme çalışmalarında madde ve yetenek parametrelerini en doğru ve stabil şekilde kestirebilen
modellerin ortaya konulması amaçlanmaktadır. Çünkü bireyin rapor edilen puanı, hakkında alınabilecek
herhangi bir kararı etkileyebilmektedir. Bu nedenle araştırmacılar çeşitli koşullarda en doğru kestirim
yapan modeli ortaya koymayı amaçlamaktadır (Rahman & Chajewski, 2014). Alan yazında MTK’ ya
dayalı test geliştirme çalışmalarında örneklem büyüklüğü ve test uzunluğunun parametre kestirimlerine
olan etkisi sıklıkla araştırılan konu olarak ele alınmaktadır. MTK modelleri doğru parametre kestirimleri
yapabilmek için büyük örneklemlere ihtiyaç duymaktadır (Hambleton, 1989; Hulin, Lissak & Drasgow,
1982). Her ne kadar minimum örneklem sayısı ve test uzunluğunun ne olması gerektiği konusunda kesin
kurallar koyulamasa da (Foley, 2010) yapılan çalışmalar çeşitli koşullarda ulaşılması gereken örneklem
sayısını ortaya koymaya yöneliktir (Lord, 1980; Patsula & Gessaroli, 1995; Yen, 1987; Yoes, 1995).
Çalışmaların ortak noktası aslında örneklem sayısı ve test uzunluğunun özellikle karmaşık modellerde
büyük olması gerektiği yönündedir.
Lord (1968) güçlük, ayırt edicilik ve şans parametrelerinin kestirildiği 3 parametreli lojistik modelde
ayırt edicilik parametresini doğru kestirebilmek için en az 50 madde ve 1000 örneklem büyüklüğü
gerektiğini belirtmiştir. Hulin ve diğerleri (1982) 200, 500, 1000 ve 2000 örneklem sayıları ile 15, 30
ve 60 sayıda maddeden oluşan test uzunluklarını dikkate alarak 2PL ve 3PL modele göre kestirimler
yapmıştır. İki parametreli lojistik model için en az 500 örneklem ve 30 madde ayısına ihtiyaç
duyulacağını belirtmiştir. Ayrıca 3PL model için örneklem sayısının 1000, madde sayısının ise 60
olmasını önermiştir. Ancak örneklem sayısı 2000, madde sayısı 30 olduğunda da çok benzer kestirim
sonuçları elde etmiştir. Bu nedenle örneklem sayısının arttırılamadığı durumda madde sayısını artırmak
bir yol olarak tercih edilebilmektedir.
Ancak, birçok test uygulamasında örneklem büyüklüğünü ya da test uzunluğunu arttırmak çok mümkün
değildir. Bu nedenle çalışmalar artık örneklem büyüklüğü ya da test uzunluğuna göre en doğru modelin
ve bilgisayar programının kullanımına yoğunlaşmaktadır. Baker (1987), parametre kestirimi ve
kullanılan bilgisayar programının ayrılmaz bir bütün oluşturduğunu ve elde edilen madde parametre
karakteristiklerinin programın altında yatan matematikten etkileneceğini belirtmiştir. Bu nedenle çeşitli
zamanlarda teknolojinin sunduğu imkânlara bağlı olarak birçok bilgisayar programı kullanıma
sunulmuştur. BILOG-MG (Zimowski, Muraki, Mislevy & Bock, 2003) iki kategorili maddelerde
parametre kestirimi için yaygın bir şekilde kullanılan ve uzun geçmişe sahip olan programdır (Baker,
1990; Lim & Drasgow, 1990; Swaminathan & Gifford, 1983). Son zamanlarda MTK analizlerinin, açık
kaynaklı program olan R programı (Rizopoulos, 2006, 2013) içerisindeki paketler (e.g. package ltm,
irtoys) kullanılarak yürütüldüğüne rastlanmaktadır (Bulut & Zopluoğlu, 2013; Pan, 2012). R programı
ücretsiz olduğu için yaygın şekilde kullanılmaktadır. Yine birçok analizi yapma imkânı sunan ve ücretli
bir program olan Mplus (Muthén & Muthén, 1998-2012) son zamanlarda adından sıklıkla söz
ettirmektedir ve örtük modelleri ortaya koymada tercih edilmektedir.
Bu bilgiler dikkate alındığında test uzunluğu ve örneklem büyüklüğüne ilişkin araştırmalara yer
verilmesi gerektiği ve program türlerine göre elde edilen sonuçlarının karşılaştırılmasına ihtiyaç olduğu
düşünülmektedir. Bu çalışma sözü geçen örneklem büyüklüğü ve test uzunluğu faktörlerinin MTK’nın
2PL modellerinde madde parametreleri ve madde kestirimlerine ait standart hata değerleri üzerine
etkisinin araştırılması amacını taşımaktadır. Araştırmanın bir diğer amacı ise bu koşullar altında,
alanyazında bu üçünün karşılaştırılmasına rastlanmadığı için, Mplus, BILOG ve R (ltm) programlarının
parametre kestirimindeki performanslarını karşılaştırmaktır. Bu yönüyle ilgili araştırma MTK temel
alınarak yapılan çalışmalarda yeterli örneklem büyüklüğünün ya da madde sayısının ne olması gerektiği
konusundaki tartışmalara önemli katkıları olacağı düşünülmektedir. Öte yandan araştırmacılara eldeki
verilere ya da kestirilecek parametrelere uygun olarak programlardan hangilerine ulaşmaları gerektiği
konusunda fikir verebilecektir. Araştırma, parametrelere ilişkin standart hataları da karşılaştırmaya dâhil
etmesi bakımından orijinallik özelliğini sağlamaktadır. Araştırmada simülasyon verileri kullanılmış
ancak, veriler gerçek bir sınavdan kestirilen parametrelere uygun olarak üretilmiştir. Bu nedenle
simülasyon sonuçları önceki çalışmalarla kıyaslanabilecek niteliktedir (Hulin ve diğerleri, 1982; Yen,
1987; Baker, 1998; Gao & Chen, 2005; Thissen & Wainer, 1982).

Uyar, Ş., Öztürk-Gübeş, N. / Item Parameter Estimation for Dichotomous Items Based on Item Response Theory:
Comparison of BILOG-MG, Mplus and R (ltm)
__________________________________________________________________________________
___________________________________________________________________________________________________________________
ISSN: 1309 – 6575 Eğitimde ve Psikolojide Ölçme ve Değerlendirme Dergisi Journal of Measurement and Evaluation in Education and Psychology
41
Tüm bunlar dikkate alındığında araştırmada ele alınan temel problem test uzunluğu ve örneklem
büyüklüğü değiştiğinde parametre ve bunlara ait standart hata kestirimleri BILOG, Mplus ve R (ltm)
programlarında nasıl değişmektedir? şeklinde belirlenmiştir.
Yöntem
Bu çalışmada kullanılan veriler R programında yetenek parametreleri aritmetik ortalaması 0, standart
sapması 1 olan standart normal dağılım gösterecek şekilde üretilmiştir. TIMSS 2015 matematik
uygulamasından hesaplanan madde parametreleri bu çalışmada verileri üretmek amacıyla kullanılmıştır.
Çalışmada örneklem büyüklüğü ve test uzunluğu simülasyon koşulları olarak ele alınmıştır. Örneklem
büyüklüğü 500, 1000 ve 2000 test uzunluğu ise 30 ve 60 olacak şekilde 6 farklı koşul 50 tekrar yapılarak
karşılaştırılmıştır. Bu çalışmada madde parametreleri 2 PL modele göre En Çok Olabilirlik Yöntemi
(Maximum Likelihood Estimation-MLE ) kestirim yöntemi kullanılarak elde edilmiştir. Veriler BILOG-
MG, Mplus programlarında ve R programında irtoys paketinde ltm ile kestirilmiştir. Güçlük ve eğim
(ayırt edicilik) parametreleri ve bunlara ait standart hataları (sh) karşılaştırmak amacıyla RMSE ve
yanlılık indeksleri hesaplanmıştır.
Sonuç ve Tartışma
Bu araştırmanın amacı örneklem büyüklüğü ve test uzunluğunun parametre kestirimi üzerindeki etkisini
incelemek ve Mplus, BILOG-MG ve R (ltm) programlarının parametre kestirimindeki performanslarını
karşılaştırmaktır.
Araştırmadan elde edilen RMSE indeksleri dikkate alındığında Mplus programının b parametresini
kestirmede en iyi, sh (a) parametresini kestirmede en düşük performansı sergilediği görülmüştür.
BILOG-MG sh(b), a ve sh(a) parametrelerini en iyi kestiren program iken R (ltm) bu parametreleri
kestirmede en düşük performansı sergilemiştir. Bu sonuç Rahman & Chajewski (2014)’ün bulgularıyla
tutarlılık göstermektedir. Araştırmacılar BILOG, PARSCALE, IRTPRO, flexMIRT ve ltm (R) ile
kestirdikleri parametrelere ilişkin RMSE değerlerini karşılaştırdıklarında kabul edilebilir derecede olsa
da en hatalı kestirimin ltm programında olduğunu göstermişlerdir. Yanlılık indekslerine bakıldığında b
ve a parametrelerini en yansız kestiren programın Mplus olduğu görülmüştür. Ancak bu program sh (a)
parametresini en yanlı kestiren programdır. BILOG-MG programı sh(a) ve sh(b) parametresini en yansız
kestiren program olmuştur. R (ltm) ise b, sh(b) ve a parametresini en yanlı kestiren programdır.
Muthén’e (1999) göre, BILOG ve Mplus kestirimleri arasındaki küçük farklar göz ardı edilebilmektedir,
çünkü her iki program da ML kestirim yöntemini, ancak BILOG programı probit fonksiyon yerine logit
fonksiyonu (D=1.7) kullanmaktadır.
Araştırma bulguları tüm programlarda örneklem büyüklüğü arttıkça a ve b parametreleri ile bu
parametrelerin standart hatalarına ilişkin kestirilen RMSE değerlerinin genel olarak düştüğünü
göstermiştir. Bu bulgu alan yazında örneklem büyüklüğünün parametre kestirimine ilişkin RMSE
değerlerini küçülttüğü sonucunu destekler niteliktedir (Şahin & Anıl, 2017; Şahin & Colvin, 2015;
Lord,1968; Ree & Jensen,1980). Örneklem büyüklüğü arttıkça, kestiricinin tutarlılığı artmakta ve gerçek
parametre değerine daha yakın kestirimler elde edilmektedir (Thissen & Wainer, 1982). Ayrıca,
örneklem büyüklüğü arttıkça örneklem dağılımına ilişkin standart hatalar azalmakta dolayısıyla
parametre kestirimlerine ilişkin RMSE değerleri azalmaktadır (Stone, 1992). Edelen & Reeve
(2007)’nin de belirttiği gibi örneklem büyüklüğü arttıkça parametre kestirimlerine ait standart hatalar da
küçülmektedir.
RMSE indekslerine göre test uzunluğu 30 ve örneklem büyüklüğü 500 olduğunda BILOG-MG
programının b parametresini en iyi kestirdiği, ancak örneklem büyüklüğü 1000 ve 2000 olduğunda R
(ltm) ile BILOG-MG’den daha iyi kestirimler elde edildiği görülmüştür. Şahin & Colvin (2015) de 1
PL, 2PL ve 3PL modellerde ltm paketinin b parametresini en doğru kestirdiğini belirtmiştir.

Journal of Measurement and Evaluation in Education and Psychology
___________________________________________________________________________________
___________________________________________________________________________________________________________________
ISSN: 1309 – 6575 Eğitimde ve Psikolojide Ölçme ve Değerlendirme Dergisi Journal of Measurement and Evaluation in Education and Psychology 42
Bu çalışmada Mplus programının 2000 örneklem büyüklüğünde b parametresi için diğer programlara
yakın kestirim sonuçları elde ettiği görülse de genel olarak b parametresini 30 madde sayısı ve 2000
örneklem büyüklüğünde en kötü kestirdiği sonucuna varılmıştır. Test uzunluğu 60 olduğunda tüm
örneklem büyüklüklerinde R(ltm) b parametresini kestirmede en düşük performası sergilemiştir.
BILOG-MG programı 500 örneklem büyüklüğünde Mplus’a göre b parametresini kestirmede daha iyi
iken, 1000 örneklem büyüklüğünde Mplus programı BILOG-MG’ye göre daha iyidir. Örneklem
büyüklüğü 2000 iken BILOG-MG ve Mplus benzer performans sergilemiştir.
Araştırmadan çıkan bir diğer sonuç sh(b) parametresini en iyi kestiren programın tüm örneklem
büyüklüğü ve test uzunluklarında BILOG-MG olduğu yönündedir. Öte yandan örneklem büyüklüğü
arttıkça sh(b) parametresine yönelik yanlılık indekslerinin tüm programlarda düştüğü görülmüştür.
Toland (2008), sh (b) parametresinin BILOG-MG programında kestirim doğruluğunun 2 PL model için
örneklem büyüklüğüne bağlı olduğunu belirtmiştir. Örneklem büyüklüğü 4000 olduğunda sh(b) için
tutarlı sonuçlar elde ettiğini, ancak örneklem büyüklüğü 500 iken büyük b değerlerinde sh(b)
parametresinin kestirim doğruluğunun azaldığını ifade etmiştir.
RMSE değerleri dikkate alınarak a parametresi incelendiğinde özellikle, küçük örneklemlerde 30 ve 60
madde sayısı koşullarında BILOG-MG programının en iyi performans sergilediği görülmüştür. Madde
sayısı 30, örneklem büyüklükleri 1000 ve 2000 iken tüm programların perfromansı benzerdir. Madde
sayısı 60 iken, örneklem büyüklüğü 1000 olduğunda Mplus en iyi kestirimi yaparken, 2000 örneklem
büyüklüğünde BILOG-MG ve Mplus benzer performans göstermiştir. R (ltm) ise test uzunluğu 60
olduğunda en düşük performansı sergilemiştir.
a parametresi için yanlılık değerlerine bakıldığında test uzunluğu 30 olduğunda Mplus programının en
iyi, BILOG-MG programının kestirim doğruluğunun en kötü olduğu görülmüştür. Ancak madde sayısı
60’a çıkarıldığında BILOG-MG, Mplus kadar iyi yansız kestirim yapabilmektedir. R (ltm) ise en yanlı
kestirim sonuçlarına sahiptir. sh (a) parametresi için RMSE değerlerine bakıldığında test uzunluğu 30,
örneklem büyüklükleri 1000 ve 2000 iken BILOG-MG en iyi performansı gösterirken, Mplus ve
R(ltm)’nin performansları BILOG-MG’ye yakındır. Öte yandan test uzunluğu 60 ve örneklem sayısı
büyük olduğunda BILOG-MG ve R (ltm) hem benzer hem de Mplus’tan daha doğru kestirim
yapmaktadır. Toland (2008), BILOG-MG kullanıcılarının 2 PL modelde a parametresinin küçük
değerleri (a<1.4) için sh(a)’nın kestirimine güvenebileceklerini belirtmiştir. Bu çalışmada elde ettiğimiz
sonucun ilgili çalışma ile tutarlı olması, çalışmamızda a parametresinin gerçek değerlerinin genel olarak
30 madde içerisinde yalnızca 4 tanesinde ve 60 madde içerisinde 13 tanesinde 1.4 değerinden küçük
olmasından kaynaklanıyor olabileceğini akla getirmektedir.
Daha önce yapılmış çalışmalarda (Gao & Chen, 2005; Kim, 2006; Yen, 1987), a parametresi için elde
edilen RMSE değerlerinin 0.11 ile 0.15 arasında, b parametresi için 0.10 ile 0.14 arasında değiştiği
belirtilmiştir. Bu çalışmada Mplus, BILOG-MG ve R (ltm) ile elde edilen RMSE değerleri yapılan
çalışmalarla benzer aralıktadır. Dolayısıyla her üç programın da a ve b parametrelerini gerçek değere
yakın kestirebilmesi nedeni ile kullanılabileceği önerilebilir.