item 2.02 results of operations and financial condition
TRANSCRIPT

UNITED STATESSECURITIES AND EXCHANGE COMMISSION
Washington, D.C. 20549
FORM 8-K
CURRENT REPORT
PURSUANT TO SECTION 13 OR 15(d) OF THESECURITIES EXCHANGE ACT OF 1934
Date of Report (Date of earliest event reported): July 15, 2020
U.S. BANCORP(Exact name of registrant as specified in its charter)
1-6880(Commission File Number)
DELAWARE 41-0255900(State or other jurisdiction (I.R.S. Employer Identification
of incorporation) Number)
800 Nicollet MallMinneapolis, Minnesota 55402
(Address of principal executive offices and zip code)
(651) 466-3000(Registrant’s telephone number, including area code)
(not applicable)(Former name or former address, if changed since last report)
Check the appropriate box below if the Form 8-K filing is intended to simultaneously satisfy the filing obligation of the registrant under any of thefollowing provisions:
☐ Written communications pursuant to Rule 425 Under the Securities Act (17 CFR 230.425)
☐ Soliciting material pursuant to Rule 14a-12 under the Exchange Act (17 CFR 240.14a-12)
☐ Pre-commencement communications pursuant to Rule 14d-2(b) under the Exchange Act (17 CFR 240.14d-2(b))
☐ Pre-commencement communications pursuant to Rule 13e-4(c) under the Exchange Act (17 CFR 240.13e-4(c))
Securities registered pursuant to Section 12(b) of the Act:
Title of each class Tradingsymbol
Name of each exchangeon which registered
Common Stock, $.01 par value per share USB New York Stock ExchangeDepositary Shares (each representing 1/100th interest in a share of Series A Non-Cumulative Perpetual Preferred Stock, par value $1.00) USB PrA New York Stock ExchangeDepositary Shares (each representing 1/1,000th interest in a share of Series B Non-Cumulative Perpetual Preferred Stock, par value $1.00) USB PrH New York Stock ExchangeDepositary Shares (each representing 1/1,000th interest in a share of Series F Non-Cumulative Perpetual Preferred Stock, par value $1.00) USB PrM New York Stock ExchangeDepositary Shares (each representing 1/1,000th interest in a share of Series H Non-Cumulative Perpetual Preferred Stock, par value $1.00) USB PrO New York Stock ExchangeDepositary Shares (each representing 1/1,000th interest in a share of Series K Non-Cumulative Perpetual Preferred Stock, par value $1.00) USB PrP New York Stock Exchange0.850% Medium-Term Notes, Series X (Senior), due June 7, 2024 USB/24B New York Stock Exchange
Indicate by check mark whether the registrant is an emerging growth company as defined in Rule 405 of the Securities Act of 1933 (§230.405 of thischapter) or Rule l2b-2 of the Securities Exchange Act of 1934 (§240.12b-2 of this chapter).
Emerging growth company ☐
If an emerging growth company, indicate by check mark if the registrant has elected not to use the extended transition period for complying with anynew or revised financial accounting standards provided pursuant to Section l3(a) of the Exchange Act. ☐
ITEM 2.02 RESULTS OF OPERATIONS AND FINANCIAL CONDITION.
On July 15, 2020, U.S. Bancorp (the “Company”) issued a press release reporting quarter-ended June 30, 2020 results, and posted on its website its2Q20 Earnings Conference Call Presentation, which contains certain additional historical and forward-looking information relating to the Company. Thepress release is included as Exhibit 99.1 hereto and is incorporated herein by reference. The information included in the press release is considered to be“filed” under the Securities Exchange Act of 1934. The 2Q20 Earnings Conference Call Presentation is included as Exhibit 99.2 hereto and is incorporatedherein by reference. The information included in the 2Q20 Earnings Conference Call Presentation is considered to be “furnished” under the SecuritiesExchange Act of 1934 and shall not be deemed incorporated by reference in any filings under the Securities Act of 1933. The press release and 2Q20Earnings Conference Call Presentation contain forward-looking statements regarding the Company and each includes a cautionary statement identifyingimportant factors that could cause actual results to differ materially from those anticipated.
ITEM 9.01 FINANCIAL STATEMENTS AND EXHIBITS.
(d) Exhibits.
99.1 Press Release issued by U.S. Bancorp on July 15, 2020, deemed “filed” under the Securities Exchange Act of 1934.
99.2 2Q20 Earnings Conference Call Presentation, deemed “furnished” under the Securities Exchange Act of 1934.
104 Cover Page Interactive Data File (embedded within the Inline XBRL document)
SIGNATURES
Pursuant to the requirements of the Securities Exchange Act of 1934, the registrant has duly caused this report to be signed on its behalf by theundersigned hereunto duly authorized.
U.S. BANCORP
By /s/ Lisa R. StarkLisa R. StarkExecutive Vice President andController
DATE: July 15, 2020
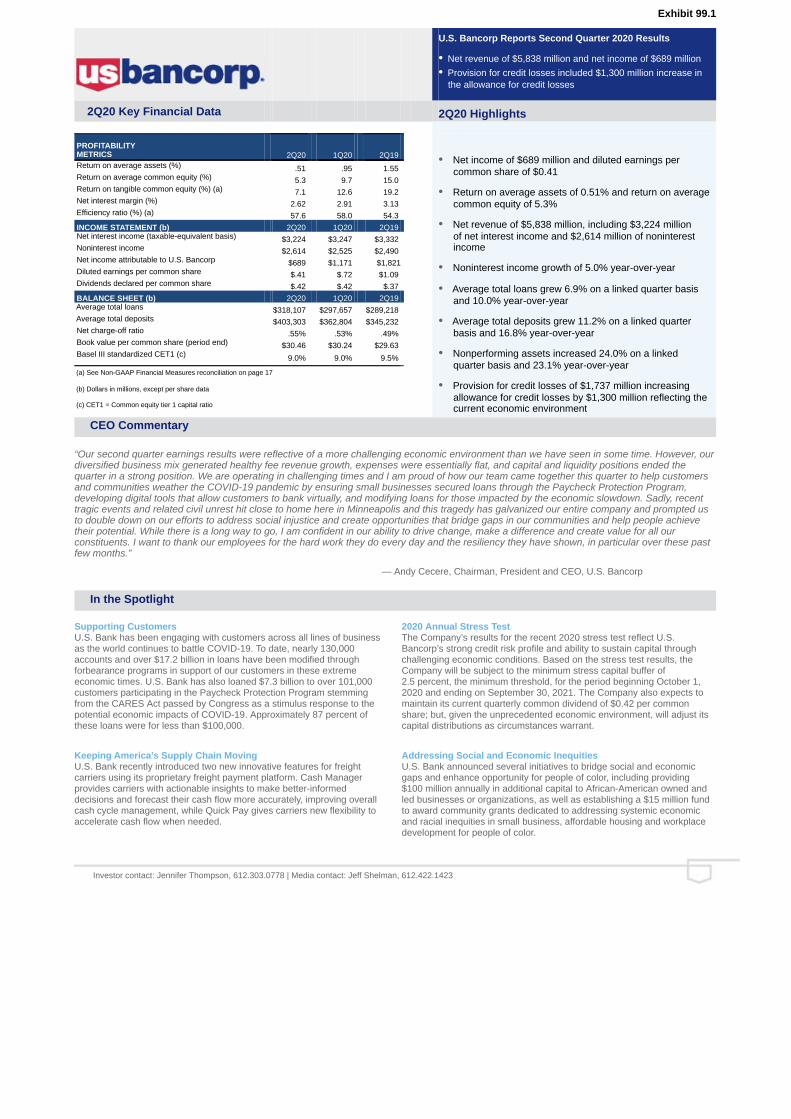
Exhibit 99.1
U.S. Bancorp Reports Second Quarter 2020 Results
• Net revenue of $5,838 million and net income of $689 million• Provision for credit losses included $1,300 million increase in
the allowance for credit losses
2Q20 Key Financial Data
2Q20 Highlights
PROFITABILITY METRICS 2Q20 1Q20 2Q19
• Net income of $689 million and diluted earnings per common share of $0.41
• Return on average assets of 0.51% and return on average common equity of 5.3%
• Net revenue of $5,838 million, including $3,224 million of net interest income and $2,614 million of noninterest income
• Noninterest income growth of 5.0% year-over-year
• Average total loans grew 6.9% on a linked quarter basis and 10.0% year-over-year
• Average total deposits grew 11.2% on a linked quarter basis and 16.8% year-over-year
• Nonperforming assets increased 24.0% on a linked quarter basis and 23.1% year-over-year
• Provision for credit losses of $1,737 million increasing allowance for credit losses by $1,300 million reflecting the current economic environment
Return on average assets (%) .51 .95 1.55 Return on average common equity (%) 5.3 9.7 15.0 Return on tangible common equity (%) (a) 7.1 12.6 19.2 Net interest margin (%) 2.62 2.91 3.13 Efficiency ratio (%) (a) 57.6 58.0 54.3 INCOME STATEMENT (b) 2Q20 1Q20 2Q19 Net interest income (taxable-equivalent basis) $3,224 $3,247 $3,332 Noninterest income $2,614 $2,525 $2,490 Net income attributable to U.S. Bancorp $689 $1,171 $1,821 Diluted earnings per common share $.41 $.72 $1.09 Dividends declared per common share $.42 $.42 $.37 BALANCE SHEET (b) 2Q20 1Q20 2Q19 Average total loans $318,107 $297,657 $289,218 Average total deposits $403,303 $362,804 $345,232 Net charge-off ratio .55% .53% .49% Book value per common share (period end) $30.46 $30.24 $29.63 Basel III standardized CET1 (c)
9.0%
9.0%
9.5%
(a) See Non-GAAP Financial Measures reconciliation on page 17
(b) Dollars in millions, except per share data
(c) CET1 = Common equity tier 1 capital ratio
CEO Commentary
“Our second quarter earnings results were reflective of a more challenging economic environment than we have seen in some time. However, ourdiversified business mix generated healthy fee revenue growth, expenses were essentially flat, and capital and liquidity positions ended thequarter in a strong position. We are operating in challenging times and I am proud of how our team came together this quarter to help customersand communities weather the COVID-19 pandemic by ensuring small businesses secured loans through the Paycheck Protection Program,developing digital tools that allow customers to bank virtually, and modifying loans for those impacted by the economic slowdown. Sadly, recenttragic events and related civil unrest hit close to home here in Minneapolis and this tragedy has galvanized our entire company and prompted usto double down on our efforts to address social injustice and create opportunities that bridge gaps in our communities and help people achievetheir potential. While there is a long way to go, I am confident in our ability to drive change, make a difference and create value for all ourconstituents. I want to thank our employees for the hard work they do every day and the resiliency they have shown, in particular over these pastfew months.”
— Andy Cecere, Chairman, President and CEO, U.S. Bancorp
In the Spotlight
Investor contact: Jennifer Thompson, 612.303.0778 | Media contact: Jeff Shelman, 612.422.1423
Supporting CustomersU.S. Bank has been engaging with customers across all lines of businessas the world continues to battle COVID-19. To date, nearly 130,000accounts and over $17.2 billion in loans have been modified throughforbearance programs in support of our customers in these extremeeconomic times. U.S. Bank has also loaned $7.3 billion to over 101,000customers participating in the Paycheck Protection Program stemmingfrom the CARES Act passed by Congress as a stimulus response to thepotential economic impacts of COVID-19. Approximately 87 percent ofthese loans were for less than $100,000.
Keeping America’s Supply Chain MovingU.S. Bank recently introduced two new innovative features for freightcarriers using its proprietary freight payment platform. Cash Managerprovides carriers with actionable insights to make better-informeddecisions and forecast their cash flow more accurately, improving overallcash cycle management, while Quick Pay gives carriers new flexibility toaccelerate cash flow when needed.
2020 Annual Stress TestThe Company’s results for the recent 2020 stress test reflect U.S.Bancorp’s strong credit risk profile and ability to sustain capital throughchallenging economic conditions. Based on the stress test results, theCompany will be subject to the minimum stress capital buffer of2.5 percent, the minimum threshold, for the period beginning October 1,2020 and ending on September 30, 2021. The Company also expects tomaintain its current quarterly common dividend of $0.42 per commonshare; but, given the unprecedented economic environment, will adjust itscapital distributions as circumstances warrant.
Addressing Social and Economic InequitiesU.S. Bank announced several initiatives to bridge social and economicgaps and enhance opportunity for people of color, including providing$100 million annually in additional capital to African-American owned andled businesses or organizations, as well as establishing a $15 million fundto award community grants dedicated to addressing systemic economicand racial inequities in small business, affordable housing and workplacedevelopment for people of color.
U.S. Bancorp Second Quarter 2020 Results
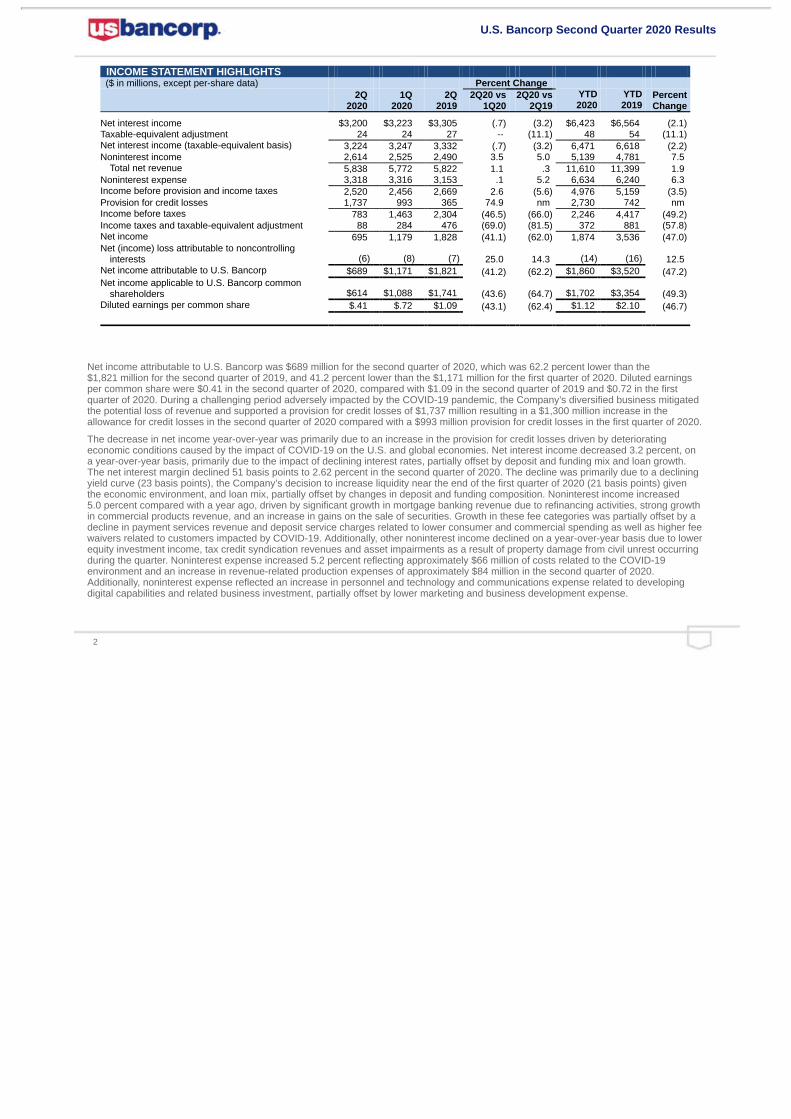
INCOME STATEMENT HIGHLIGHTS ($ in millions, except per-share data) Percent Change
2Q
2020 1Q
2020 2Q
2019 2Q20 vs
1Q20 2Q20 vs
2Q19 YTD2020
YTD2019
PercentChange
Net interest income $3,200 $3,223 $3,305 (.7) (3.2) $6,423 $6,564 (2.1) Taxable-equivalent adjustment 24 24 27 -- (11.1) 48 54 (11.1) Net interest income (taxable-equivalent basis) 3,224 3,247 3,332 (.7) (3.2) 6,471 6,618 (2.2) Noninterest income 2,614 2,525 2,490 3.5 5.0 5,139 4,781 7.5
Total net revenue 5,838 5,772 5,822 1.1 .3 11,610 11,399 1.9 Noninterest expense 3,318 3,316 3,153 .1 5.2 6,634 6,240 6.3 Income before provision and income taxes 2,520 2,456 2,669 2.6 (5.6) 4,976 5,159 (3.5) Provision for credit losses 1,737 993 365 74.9 nm 2,730 742 nm Income before taxes 783 1,463 2,304 (46.5) (66.0) 2,246 4,417 (49.2) Income taxes and taxable-equivalent adjustment 88 284 476 (69.0) (81.5) 372 881 (57.8) Net income 695 1,179 1,828 (41.1) (62.0) 1,874 3,536 (47.0) Net (income) loss attributable to noncontrolling
interests (6) (8) (7) 25.0 14.3 (14) (16) 12.5 Net income attributable to U.S. Bancorp $689 $1,171 $1,821 (41.2) (62.2) $1,860 $3,520 (47.2) Net income applicable to U.S. Bancorp common
shareholders $614 $1,088 $1,741 (43.6) (64.7) $1,702 $3,354 (49.3) Diluted earnings per common share $.41 $.72 $1.09 (43.1) (62.4) $1.12 $2.10 (46.7)
Net income attributable to U.S. Bancorp was $689 million for the second quarter of 2020, which was 62.2 percent lower than the$1,821 million for the second quarter of 2019, and 41.2 percent lower than the $1,171 million for the first quarter of 2020. Diluted earningsper common share were $0.41 in the second quarter of 2020, compared with $1.09 in the second quarter of 2019 and $0.72 in the firstquarter of 2020. During a challenging period adversely impacted by the COVID-19 pandemic, the Company’s diversified business mitigatedthe potential loss of revenue and supported a provision for credit losses of $1,737 million resulting in a $1,300 million increase in theallowance for credit losses in the second quarter of 2020 compared with a $993 million provision for credit losses in the first quarter of 2020.
The decrease in net income year-over-year was primarily due to an increase in the provision for credit losses driven by deterioratingeconomic conditions caused by the impact of COVID-19 on the U.S. and global economies. Net interest income decreased 3.2 percent, ona year-over-year basis, primarily due to the impact of declining interest rates, partially offset by deposit and funding mix and loan growth.The net interest margin declined 51 basis points to 2.62 percent in the second quarter of 2020. The decline was primarily due to a decliningyield curve (23 basis points), the Company’s decision to increase liquidity near the end of the first quarter of 2020 (21 basis points) giventhe economic environment, and loan mix, partially offset by changes in deposit and funding composition. Noninterest income increased5.0 percent compared with a year ago, driven by significant growth in mortgage banking revenue due to refinancing activities, strong growthin commercial products revenue, and an increase in gains on the sale of securities. Growth in these fee categories was partially offset by adecline in payment services revenue and deposit service charges related to lower consumer and commercial spending as well as higher feewaivers related to customers impacted by COVID-19. Additionally, other noninterest income declined on a year-over-year basis due to lowerequity investment income, tax credit syndication revenues and asset impairments as a result of property damage from civil unrest occurringduring the quarter. Noninterest expense increased 5.2 percent reflecting approximately $66 million of costs related to the COVID-19environment and an increase in revenue-related production expenses of approximately $84 million in the second quarter of 2020.Additionally, noninterest expense reflected an increase in personnel and technology and communications expense related to developingdigital capabilities and related business investment, partially offset by lower marketing and business development expense.
2

U.S. Bancorp Second Quarter 2020 Results
Net income decreased on a linked quarter basis primarily due to an increase in the provision for credit losses as a result of the currenteconomic environment. The Company’s pre-provision income increased 2.6 percent, on a linked quarter basis, driven by higher total netrevenue of 1.1 percent, partially offset by a slight increase in noninterest expense of 0.1 percent on a linked quarter basis. Net interestincome decreased 0.7 percent primarily due to the adverse impact of lower interest rates, partially offset by loan growth and the benefit ofdeposit pricing changes and funding mix. The net interest margin declined by 29 basis points, on a linked quarter basis, primarily reflectingthe lower yield curve and approximately 16 basis points of decline related to maintaining a higher liquidity position. Noninterest incomeincreased 3.5 percent compared with the first quarter of 2020 driven by higher commercial products revenue, mortgage banking revenue,and an increase in gains on the sale of securities, partially offset by lower payment services revenue, deposit service charges, and othernoninterest income. Noninterest expense was relatively flat, on a linked quarter basis, reflecting higher personnel costs and technology andcommunications expense related to developing digital capabilities and related business investment, partially offset by lower othernoninterest expense and marketing and business development expense.
3
U.S. Bancorp Second Quarter 2020 Results
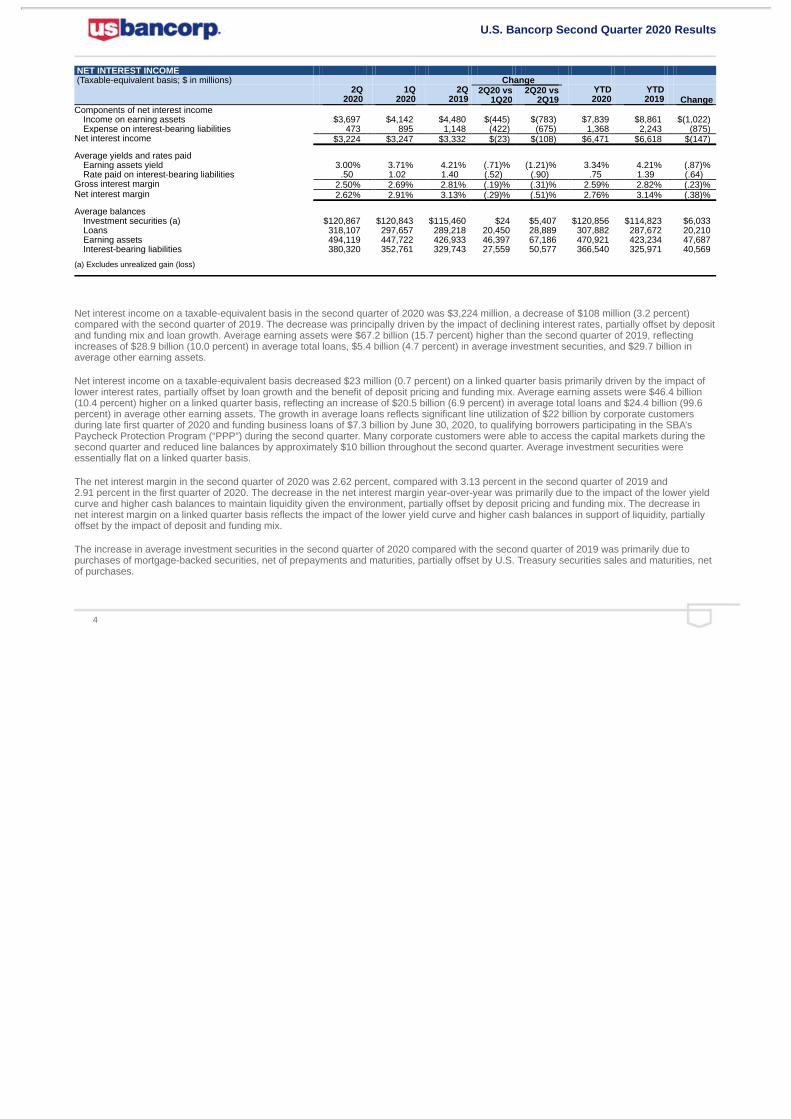
NET INTEREST INCOME (Taxable-equivalent basis; $ in millions) Change
2Q
2020 1Q
2020 2Q
2019 2Q20 vs
1Q20 2Q20 vs
2Q19 YTD2020
YTD2019 Change
Components of net interest income Income on earning assets $3,697 $4,142 $4,480 $(445) $(783) $7,839 $8,861 $(1,022) Expense on interest-bearing liabilities 473 895 1,148 (422) (675) 1,368 2,243 (875)
Net interest income $3,224 $3,247 $3,332 $(23) $(108) $6,471 $6,618 $(147)
Average yields and rates paid Earning assets yield 3.00% 3.71% 4.21% (.71)% (1.21)% 3.34% 4.21% (.87)% Rate paid on interest-bearing liabilities .50 1.02 1.40 (.52) (.90) .75 1.39 (.64)
Gross interest margin 2.50% 2.69% 2.81% (.19)% (.31)% 2.59% 2.82% (.23)% Net interest margin 2.62% 2.91% 3.13% (.29)% (.51)% 2.76% 3.14% (.38)%
Average balances Investment securities (a) $120,867 $120,843 $115,460 $24 $5,407 $120,856 $114,823 $6,033 Loans 318,107 297,657 289,218 20,450 28,889 307,882 287,672 20,210 Earning assets 494,119 447,722 426,933 46,397 67,186 470,921 423,234 47,687 Interest-bearing liabilities 380,320 352,761 329,743 27,559 50,577 366,540 325,971 40,569
(a) Excludes unrealized gain (loss)
Net interest income on a taxable-equivalent basis in the second quarter of 2020 was $3,224 million, a decrease of $108 million (3.2 percent)compared with the second quarter of 2019. The decrease was principally driven by the impact of declining interest rates, partially offset by depositand funding mix and loan growth. Average earning assets were $67.2 billion (15.7 percent) higher than the second quarter of 2019, reflectingincreases of $28.9 billion (10.0 percent) in average total loans, $5.4 billion (4.7 percent) in average investment securities, and $29.7 billion inaverage other earning assets.
Net interest income on a taxable-equivalent basis decreased $23 million (0.7 percent) on a linked quarter basis primarily driven by the impact oflower interest rates, partially offset by loan growth and the benefit of deposit pricing and funding mix. Average earning assets were $46.4 billion(10.4 percent) higher on a linked quarter basis, reflecting an increase of $20.5 billion (6.9 percent) in average total loans and $24.4 billion (99.6percent) in average other earning assets. The growth in average loans reflects significant line utilization of $22 billion by corporate customersduring late first quarter of 2020 and funding business loans of $7.3 billion by June 30, 2020, to qualifying borrowers participating in the SBA’sPaycheck Protection Program (“PPP”) during the second quarter. Many corporate customers were able to access the capital markets during thesecond quarter and reduced line balances by approximately $10 billion throughout the second quarter. Average investment securities wereessentially flat on a linked quarter basis.
The net interest margin in the second quarter of 2020 was 2.62 percent, compared with 3.13 percent in the second quarter of 2019 and2.91 percent in the first quarter of 2020. The decrease in the net interest margin year-over-year was primarily due to the impact of the lower yieldcurve and higher cash balances to maintain liquidity given the environment, partially offset by deposit pricing and funding mix. The decrease innet interest margin on a linked quarter basis reflects the impact of the lower yield curve and higher cash balances in support of liquidity, partiallyoffset by the impact of deposit and funding mix.
The increase in average investment securities in the second quarter of 2020 compared with the second quarter of 2019 was primarily due topurchases of mortgage-backed securities, net of prepayments and maturities, partially offset by U.S. Treasury securities sales and maturities, netof purchases.
4
U.S. Bancorp Second Quarter 2020 Results
AVERAGE LOANS ($ in millions) Percent Change
2Q
2020 1Q
2020 2Q
2019 2Q20 vs
1Q20 2Q20 vs
2Q19 YTD2020
YTD2019
PercentChange
Commercial $122,442 $100,329 $ 97,776 22.0 25.2 $111,385 $ 97,115 14.7 Lease financing 5,597 5,658 5,457 (1.1) 2.6 5,628 5,485 2.6
Total commercial 128,039 105,987 103,233 20.8 24.0 117,013 102,600 14.0
Commercial mortgages 30,194 29,523 28,465 2.3 6.1 29,858 28,462 4.9 Construction and development 10,894 10,555 10,900 3.2 (.1) 10,725 10,955 (2.1)
Total commercial real estate 41,088 40,078 39,365 2.5 4.4 40,583 39,417 3.0
Residential mortgages 71,122 70,892 66,834 .3 6.4 71,007 66,212 7.2
Credit card 21,510 23,836 22,830 (9.8) (5.8) 22,673 22,714 (.2)
Retail leasing 8,412 8,474 8,547 (.7) (1.6) 8,443 8,566 (1.4) Home equity and second mortgages 14,386 14,838 15,831 (3.0) (9.1) 14,612 15,912 (8.2) Other 33,550 33,552 32,578 -- 3.0 33,551 32,251 4.0
Total other retail 56,348 56,864 56,956 (.9) (1.1) 56,606 56,729 (.2)
Total loans $318,107 $297,657 $289,218 6.9 10.0 $307,882 $287,672 7.0
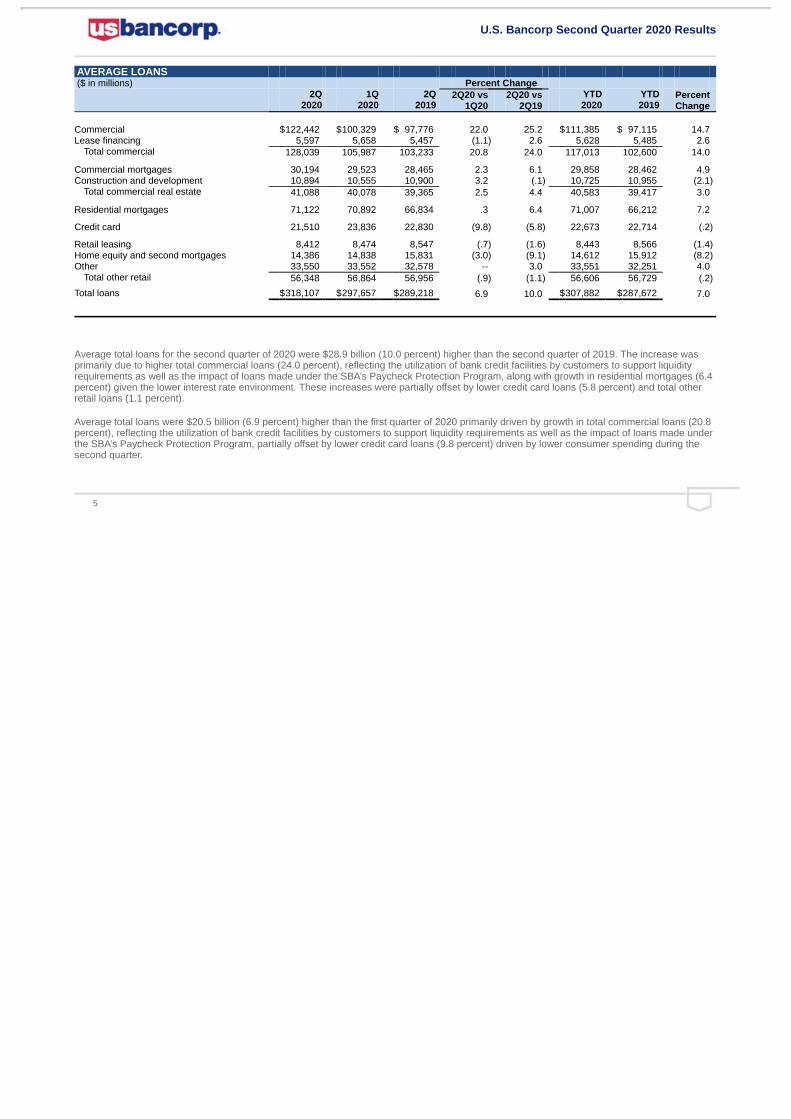
Average total loans for the second quarter of 2020 were $28.9 billion (10.0 percent) higher than the second quarter of 2019. The increase wasprimarily due to higher total commercial loans (24.0 percent), reflecting the utilization of bank credit facilities by customers to support liquidityrequirements as well as the impact of loans made under the SBA’s Paycheck Protection Program, along with growth in residential mortgages (6.4percent) given the lower interest rate environment. These increases were partially offset by lower credit card loans (5.8 percent) and total otherretail loans (1.1 percent).
Average total loans were $20.5 billion (6.9 percent) higher than the first quarter of 2020 primarily driven by growth in total commercial loans (20.8percent), reflecting the utilization of bank credit facilities by customers to support liquidity requirements as well as the impact of loans made underthe SBA’s Paycheck Protection Program, partially offset by lower credit card loans (9.8 percent) driven by lower consumer spending during thesecond quarter.
5

U.S. Bancorp Second Quarter 2020 Results
AVERAGE DEPOSITS ($ in millions) Percent Change
2Q
2020 1Q
2020 2Q
2019 2Q20 vs
1Q20 2Q20 vs
2Q19 YTD2020
YTD2019
PercentChange
Noninterest-bearing deposits $95,106 $74,142 $73,096 28.3 30.1 $84,624 $73,263 15.5 Interest-bearing savings deposits
Interest checking 83,789 77,359 70,433 8.3 19.0 80,573 71,301 13.0 Money market savings 129,692 121,946 108,633 6.4 19.4 125,819 104,058 20.9 Savings accounts 51,237 48,048 45,988 6.6 11.4 49,643 45,604 8.9
Total savings deposits 264,718 247,353 225,054 7.0 17.6 256,035 220,963 15.9 Time deposits 43,479 41,309 47,082 5.3 (7.7) 42,394 46,100 (8.0)
Total interest-bearing deposits 308,197 288,662 272,136 6.8 13.3 298,429 267,063 11.7
Total deposits $403,303 $362,804 $345,232 11.2 16.8 $383,053 $340,326 12.6
Average total deposits for the second quarter of 2020 were $58.1 billion (16.8 percent) higher than the second quarter of 2019. Averagenoninterest-bearing deposits increased $22.0 billion (30.1 percent) driven by Corporate and Commercial Banking, Consumer and BusinessBanking, and Wealth Management and Investment Services. Average total savings deposits were $39.7 billion (17.6 percent) higher year-over-year driven by Corporate and Commercial Banking, Consumer and Business Banking, and Wealth Management and Investment Services.Average time deposits were $3.6 billion (7.7 percent) lower than the prior year quarter. Changes in time deposits are largely related to thosedeposits managed as an alternative to other funding sources, based largely on relative pricing and liquidity characteristics.
Average total deposits increased $40.5 billion (11.2 percent) from the first quarter of 2020. On a linked quarter basis, average noninterest-bearingdeposits increased $20.9 billion (28.3 percent) driven by Corporate and Commercial Banking, Consumer and Business Banking, and WealthManagement and Investment Services. Average total savings deposits increased $17.4 billion (7.0 percent) over the first quarter of 2020 primarilydue to increases in Corporate and Commercial Banking, Consumer and Business Banking, and Wealth Management and Investment Services.Average time deposits, which are managed based on funding needs, relative pricing and liquidity characteristics, increased $2.2 billion (5.3percent) on a linked quarter basis primarily driven by Corporate and Commercial Banking.
The growth in average noninterest-bearing deposits and total average savings deposits is primarily a result of the economic impact of theCOVID-19 pandemic on the world economy resulting in actions by the federal government to increase liquidity in the financial system, customersmaintaining balance sheet liquidity by utilizing existing credit facilities and government stimulus programs.
6
U.S. Bancorp Second Quarter 2020 Results
NONINTEREST INCOME ($ in millions) Percent Change
2Q
2020 1Q
2020 2Q
2019 2Q20 vs
1Q20 2Q20 vs
2Q19 YTD2020
YTD2019
PercentChange
Credit and debit card revenue $284 $304 $365 (6.6) (22.2) $588 $669 (12.1) Corporate payment products revenue 101 145 167 (30.3) (39.5) 246 329 (25.2) Merchant processing services 266 337 404 (21.1) (34.2) 603 782 (22.9) Trust and investment management fees 434 427 415 1.6 4.6 861 814 5.8 Deposit service charges 133 209 227 (36.4) (41.4) 342 444 (23.0) Treasury management fees 137 143 153 (4.2) (10.5) 280 299 (6.4) Commercial products revenue 355 246 249 44.3 42.6 601 468 28.4 Mortgage banking revenue 648 395 189 64.1 nm 1,043 358 nm Investment products fees 45 49 47 (8.2) (4.3) 94 92 2.2 Securities gains (losses), net 81 50 17 62.0 nm 131 22 nm Other 130 220 257 (40.9) (49.4) 350 504 (30.6)
Total noninterest income $2,614 $2,525 $2,490 3.5 5.0 $5,139 $4,781 7.5
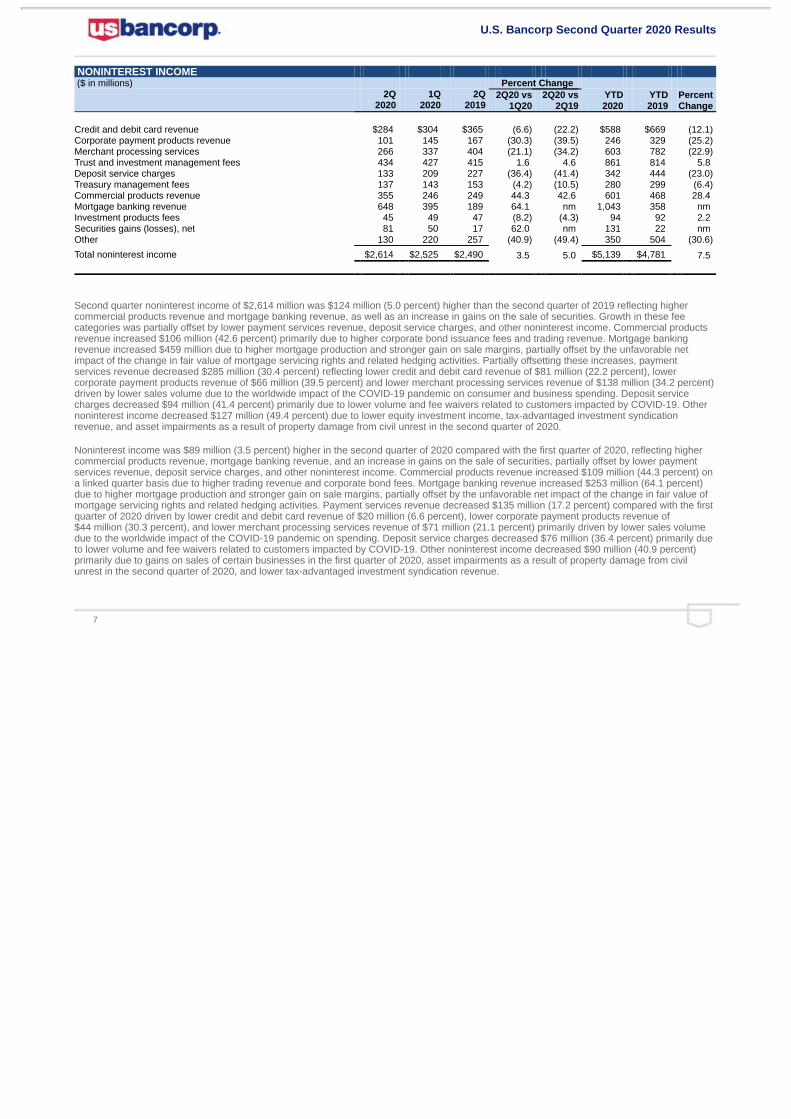
Second quarter noninterest income of $2,614 million was $124 million (5.0 percent) higher than the second quarter of 2019 reflecting highercommercial products revenue and mortgage banking revenue, as well as an increase in gains on the sale of securities. Growth in these feecategories was partially offset by lower payment services revenue, deposit service charges, and other noninterest income. Commercial productsrevenue increased $106 million (42.6 percent) primarily due to higher corporate bond issuance fees and trading revenue. Mortgage bankingrevenue increased $459 million due to higher mortgage production and stronger gain on sale margins, partially offset by the unfavorable netimpact of the change in fair value of mortgage servicing rights and related hedging activities. Partially offsetting these increases, paymentservices revenue decreased $285 million (30.4 percent) reflecting lower credit and debit card revenue of $81 million (22.2 percent), lowercorporate payment products revenue of $66 million (39.5 percent) and lower merchant processing services revenue of $138 million (34.2 percent)driven by lower sales volume due to the worldwide impact of the COVID-19 pandemic on consumer and business spending. Deposit servicecharges decreased $94 million (41.4 percent) primarily due to lower volume and fee waivers related to customers impacted by COVID-19. Othernoninterest income decreased $127 million (49.4 percent) due to lower equity investment income, tax-advantaged investment syndicationrevenue, and asset impairments as a result of property damage from civil unrest in the second quarter of 2020.
Noninterest income was $89 million (3.5 percent) higher in the second quarter of 2020 compared with the first quarter of 2020, reflecting highercommercial products revenue, mortgage banking revenue, and an increase in gains on the sale of securities, partially offset by lower paymentservices revenue, deposit service charges, and other noninterest income. Commercial products revenue increased $109 million (44.3 percent) ona linked quarter basis due to higher trading revenue and corporate bond fees. Mortgage banking revenue increased $253 million (64.1 percent)due to higher mortgage production and stronger gain on sale margins, partially offset by the unfavorable net impact of the change in fair value ofmortgage servicing rights and related hedging activities. Payment services revenue decreased $135 million (17.2 percent) compared with the firstquarter of 2020 driven by lower credit and debit card revenue of $20 million (6.6 percent), lower corporate payment products revenue of$44 million (30.3 percent), and lower merchant processing services revenue of $71 million (21.1 percent) primarily driven by lower sales volumedue to the worldwide impact of the COVID-19 pandemic on spending. Deposit service charges decreased $76 million (36.4 percent) primarily dueto lower volume and fee waivers related to customers impacted by COVID-19. Other noninterest income decreased $90 million (40.9 percent)primarily due to gains on sales of certain businesses in the first quarter of 2020, asset impairments as a result of property damage from civilunrest in the second quarter of 2020, and lower tax-advantaged investment syndication revenue.
7
U.S. Bancorp Second Quarter 2020 Results
NONINTEREST EXPENSE ($ in millions) Percent Change
2Q
2020 1Q
2020 2Q
2019 2Q20 vs
1Q20 2Q20 vs
2Q19 YTD2020
YTD2019
PercentChange
Compensation $1,685 $1,620 $1,574 4.0 7.1 $3,305 $3,133 5.5 Employee benefits 314 352 314 (10.8) -- 666 647 2.9 Net occupancy and equipment 271 276 281 (1.8) (3.6) 547 558 (2.0) Professional services 106 99 106 7.1 -- 205 201 2.0 Marketing and business development 67 74 111 (9.5) (39.6) 141 200 (29.5) Technology and communications 309 289 270 6.9 14.4 598 527 13.5 Postage, printing and supplies 72 72 73 -- (1.4) 144 145 (.7) Other intangibles 43 42 42 2.4 2.4 85 82 3.7 Other 451 492 382 (8.3) 18.1 943 747 26.2
Total noninterest expense $3,318 $3,316 $3,153 .1 5.2 $6,634 $6,240 6.3
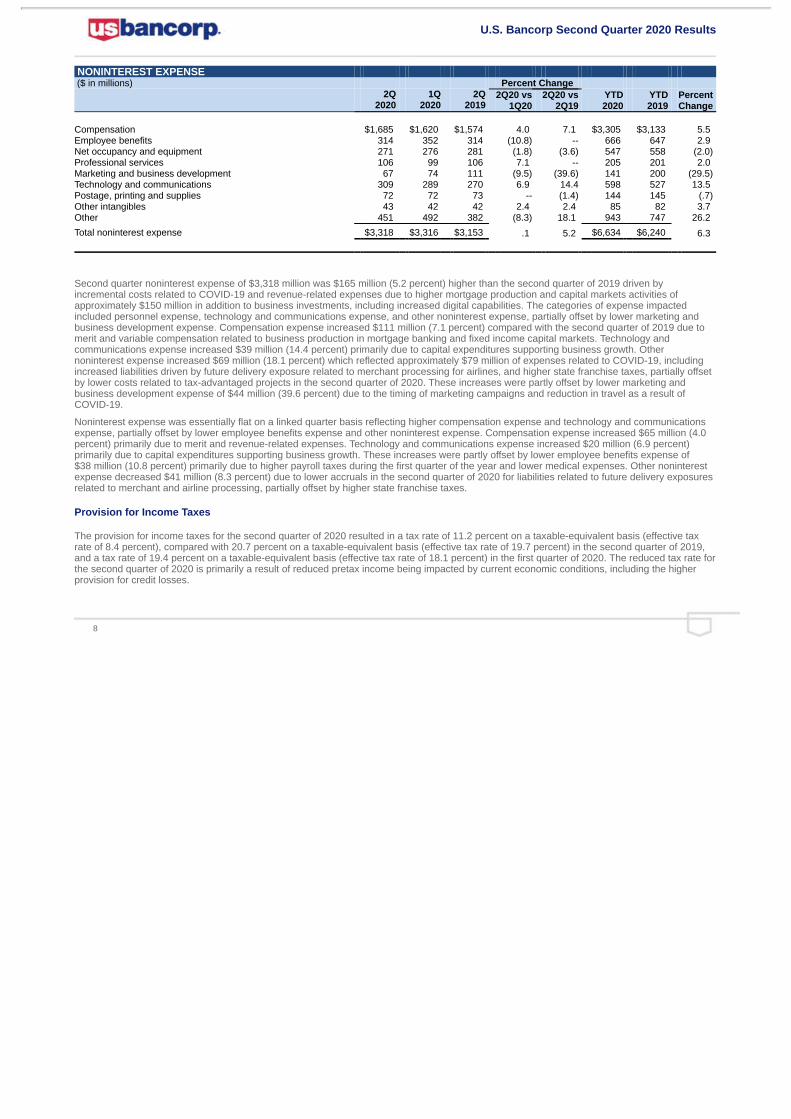
Second quarter noninterest expense of $3,318 million was $165 million (5.2 percent) higher than the second quarter of 2019 driven byincremental costs related to COVID-19 and revenue-related expenses due to higher mortgage production and capital markets activities ofapproximately $150 million in addition to business investments, including increased digital capabilities. The categories of expense impactedincluded personnel expense, technology and communications expense, and other noninterest expense, partially offset by lower marketing andbusiness development expense. Compensation expense increased $111 million (7.1 percent) compared with the second quarter of 2019 due tomerit and variable compensation related to business production in mortgage banking and fixed income capital markets. Technology andcommunications expense increased $39 million (14.4 percent) primarily due to capital expenditures supporting business growth. Othernoninterest expense increased $69 million (18.1 percent) which reflected approximately $79 million of expenses related to COVID-19, includingincreased liabilities driven by future delivery exposure related to merchant processing for airlines, and higher state franchise taxes, partially offsetby lower costs related to tax-advantaged projects in the second quarter of 2020. These increases were partly offset by lower marketing andbusiness development expense of $44 million (39.6 percent) due to the timing of marketing campaigns and reduction in travel as a result ofCOVID-19.
Noninterest expense was essentially flat on a linked quarter basis reflecting higher compensation expense and technology and communicationsexpense, partially offset by lower employee benefits expense and other noninterest expense. Compensation expense increased $65 million (4.0percent) primarily due to merit and revenue-related expenses. Technology and communications expense increased $20 million (6.9 percent)primarily due to capital expenditures supporting business growth. These increases were partly offset by lower employee benefits expense of$38 million (10.8 percent) primarily due to higher payroll taxes during the first quarter of the year and lower medical expenses. Other noninterestexpense decreased $41 million (8.3 percent) due to lower accruals in the second quarter of 2020 for liabilities related to future delivery exposuresrelated to merchant and airline processing, partially offset by higher state franchise taxes.
Provision for Income Taxes
The provision for income taxes for the second quarter of 2020 resulted in a tax rate of 11.2 percent on a taxable-equivalent basis (effective taxrate of 8.4 percent), compared with 20.7 percent on a taxable-equivalent basis (effective tax rate of 19.7 percent) in the second quarter of 2019,and a tax rate of 19.4 percent on a taxable-equivalent basis (effective tax rate of 18.1 percent) in the first quarter of 2020. The reduced tax rate forthe second quarter of 2020 is primarily a result of reduced pretax income being impacted by current economic conditions, including the higherprovision for credit losses.
8

U.S. Bancorp Second Quarter 2020 Results
ALLOWANCE FOR CREDIT LOSSES ($ in millions) 2Q 1Q 4Q 3Q 2Q 2020 % (a) 2020 % (a) 2019 % (a) 2019 % (a) 2019 % (a)
Balance, beginning of period $6,590 $4,491 $4,481 $4,466 $4,451 Change in accounting principle (b) -- 1,499 -- -- -- Net charge-offs
Commercial 105 .34 69 .28 74 .30 72 .29 56 .23 Lease financing 6 .43 5 .36 4 .29 3 .22 3 .22
Total commercial 111 .35 74 .28 78 .30 75 .29 59 .23 Commercial mortgages 19 .25 (1) (.01) 7 .10 3 .04 2 .03 Construction and development 3 .11 (1) (.04) -- -- 3 .11 (1) (.04)
Total commercial real estate 22 .22 (2) (.02) 7 .07 6 .06 1 .01
Residential mortgages (3) (.02) 1 .01 (1) (.01) (3) (.02) 4 .02
Credit card 229 4.28 234 3.95 230 3.79 211 3.53 227 3.99
Retail leasing (c) 33 1.58 19 .90 4 .19 3 .14 2 .09 Home equity and second mortgages -- -- 1 .03 -- -- (1) (.03) (1) (.03) Other 45 .54 66 .79 67 .79 61 .72 58 .71
Total other retail 78 .56 86 .61 71 .49 63 .43 59 .42
Total net charge-offs 437 .55 393 .53 385 .52 352 .48 350 .49 Provision for credit losses 1,737 993 395 367 365
Balance, end of period $7,890 $6,590 $4,491 $4,481 $4,466
Components Allowance for loan losses $7,383 $6,216 $4,020 $4,007 $4,019 Liability for unfunded credit commitments 507 374 471 474 447
Total allowance for credit losses $7,890 $6,590 $4,491 $4,481 $4,466
Gross charge-offs $ 522 $ 491 $ 479 $ 451 $ 464 Gross recoveries $ 85 $ 98 $ 94 $ 99 $ 114
Allowance for credit losses as a percentage of Period-end loans 2.54 2.07 1.52 1.52 1.53 Nonperforming loans 737 809 649 541 556 Nonperforming assets 673 697 542 458 469
(a) Annualized and calculated on average loan balances
(b) Effective January 1, 2020, the Company adopted accounting guidance which changed impairment recognition of financial instruments to a model that isbased on expected losses rather than incurred losses.
(c) Includes end of term losses on residual lease values as of January 1, 2020
9
U.S. Bancorp Second Quarter 2020 Results
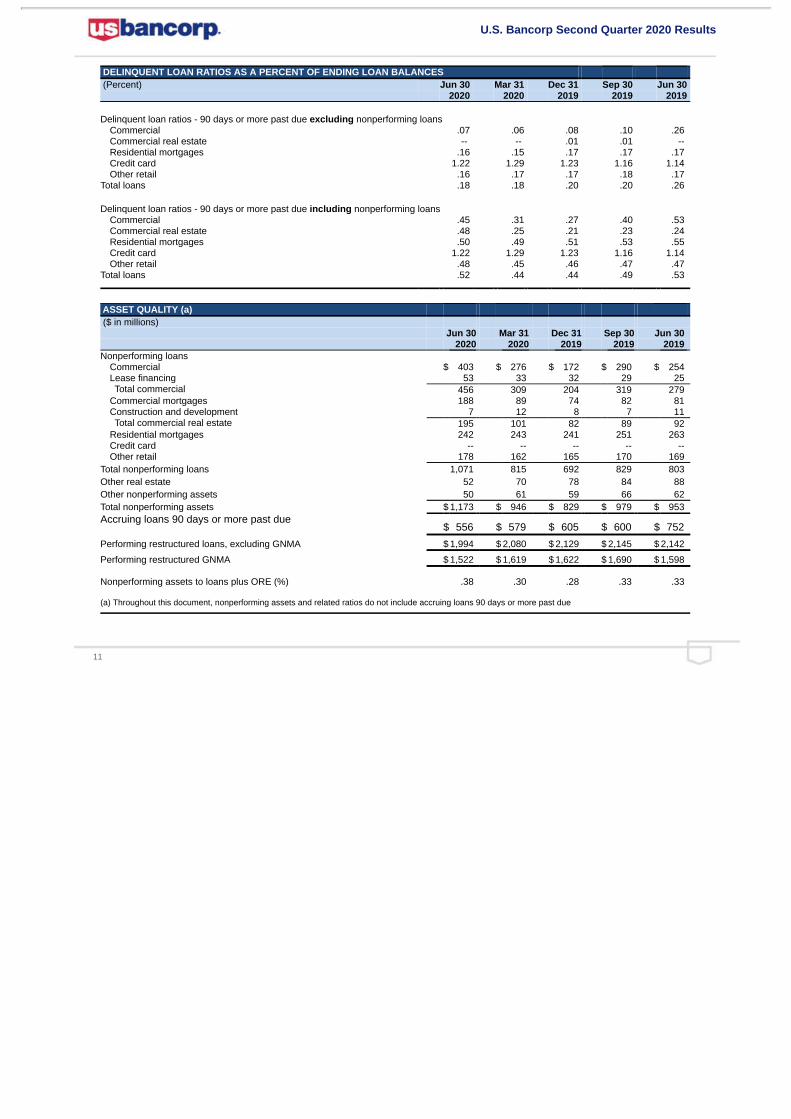
During the second quarter of 2020, economic conditions continued to deteriorate due to the impact of the COVID-19 health crisis. As aresult, economic projections for the gross domestic product declined dramatically and unemployment levels increased significantly withinformation related to the evolving impacts of the COVID-19 health crisis. As a result, the Company’s expectations related to delinquencies,credit risk rating, nonperforming assets and related future credit losses continue to reflect deteriorating credit quality. As a result, theCompany’s provision for credit losses for the second quarter of 2020 was $1,737 million, which was $744 million higher than the priorquarter and $1,372 million higher than the second quarter of 2019. The Company’s provision for the second quarter of 2020 reflects a$1,300 million increase in the allowance for credit losses to recognize the expected losses from these deteriorating economicconditions. Changes in expected loss estimates consider various factors including the changing economic activity, potential mitigatingeffects of government stimulus, estimated duration of the health crisis, customer specific information impacting changes in risk ratings,projected delinquencies and the impact of industrywide loan modification efforts designed to limit long term effects of the pandemic event,among other factors.
Total net charge-offs in the second quarter of 2020 were $437 million, compared with $393 million in the first quarter of 2020, and$350 million in the second quarter of 2019. The net charge-off ratio was 0.55 percent in the second quarter of 2020, compared with0.53 percent in the first quarter of 2020 and 0.49 percent in the second quarter of 2019. Net charge-offs increased $44 million (11.2 percent)compared with the first quarter of 2020 mainly due to higher total commercial, total commercial real estate and retail leasing net charge-offs,partially offset by lower other retail net charge-offs. Net charge-offs increased $87 million (24.9 percent) compared with the second quarterof 2019 primarily due to higher total commercial, total commercial real estate, and retail leasing net charge-offs, partly offset by lower otherretail net charge-offs. The year-over-year increase in retail leasing net charge-offs reflects the inclusion of end of term losses on residuallease values as of January 1, 2020.
The allowance for credit losses was $7,890 million at June 30, 2020, compared with $6,590 million at March 31, 2020, and $4,466 million atJune 30, 2019. The increase year-over-year was due to the impact of the change in accounting principle on January 1, 2020, which added$1.5 billion to the allowance for credit losses and the reserve build related to the potential economic impact of COVID-19. The increase on alinked quarter basis was also primarily due to the reserve build related to the potential economic impact of COVID-19. The ratio of theallowance for credit losses to period-end loans was 2.54 percent at June 30, 2020, compared with 2.07 percent at March 31, 2020, and1.53 percent at June 30, 2019. The ratio of the allowance for credit losses to nonperforming loans was 737 percent at June 30, 2020,compared with 809 percent at March 31, 2020, and 556 percent at June 30, 2019.
Nonperforming assets were $1,173 million at June 30, 2020, compared with $946 million at March 31, 2020, and $953 million at June 30,2019. The ratio of nonperforming assets to loans and other real estate was 0.38 percent at June 30, 2020, compared with 0.30 percent atMarch 31, 2020, and 0.33 percent at June 30, 2019. The year-over-year increase in nonperforming assets was primarily due to increases intotal commercial and total commercial real estate nonperforming loans. Accruing loans 90 days or more past due were $556 million atJune 30, 2020, compared with $579 million at March 31, 2020, and $752 million at June 30, 2019. The Company expects credit losses andnonperforming assets to continue to increase given current economic conditions.
10
U.S. Bancorp Second Quarter 2020 Results
DELINQUENT LOAN RATIOS AS A PERCENT OF ENDING LOAN BALANCES (Percent) Jun 30 Mar 31 Dec 31 Sep 30 Jun 30 2020 2020 2019 2019 2019
Delinquent loan ratios - 90 days or more past due excluding nonperforming loans Commercial .07 .06 .08 .10 .26 Commercial real estate -- -- .01 .01 -- Residential mortgages .16 .15 .17 .17 .17 Credit card 1.22 1.29 1.23 1.16 1.14 Other retail .16 .17 .17 .18 .17
Total loans .18 .18 .20 .20 .26
Delinquent loan ratios - 90 days or more past due including nonperforming loans Commercial .45 .31 .27 .40 .53 Commercial real estate .48 .25 .21 .23 .24 Residential mortgages .50 .49 .51 .53 .55 Credit card 1.22 1.29 1.23 1.16 1.14 Other retail .48 .45 .46 .47 .47
Total loans .52 .44 .44 .49 .53
ASSET QUALITY (a) ($ in millions) Jun 30 Mar 31 Dec 31 Sep 30 Jun 30 2020 2020 2019 2019 2019 Nonperforming loans
Commercial $ 403 $ 276 $ 172 $ 290 $ 254 Lease financing 53 33 32 29 25 Total commercial 456 309 204 319 279
Commercial mortgages 188 89 74 82 81 Construction and development 7 12 8 7 11 Total commercial real estate 195 101 82 89 92
Residential mortgages 242 243 241 251 263 Credit card -- -- -- -- -- Other retail 178 162 165 170 169
Total nonperforming loans 1,071 815 692 829 803 Other real estate 52 70 78 84 88 Other nonperforming assets 50 61 59 66 62 Total nonperforming assets $ 1,173 $ 946 $ 829 $ 979 $ 953 Accruing loans 90 days or more past due
$
556
$
579
$
605
$
600
$
752
Performing restructured loans, excluding GNMA $ 1,994 $ 2,080 $ 2,129 $ 2,145 $ 2,142
Performing restructured GNMA $ 1,522 $ 1,619 $ 1,622 $ 1,690 $ 1,598
Nonperforming assets to loans plus ORE (%) .38 .30 .28 .33 .33
(a) Throughout this document, nonperforming assets and related ratios do not include accruing loans 90 days or more past due
11
U.S. Bancorp Second Quarter 2020 Results
COMMON SHARES (Millions)
2Q
2020 1Q
2020 4Q
2019 3Q
2019 2Q
2019
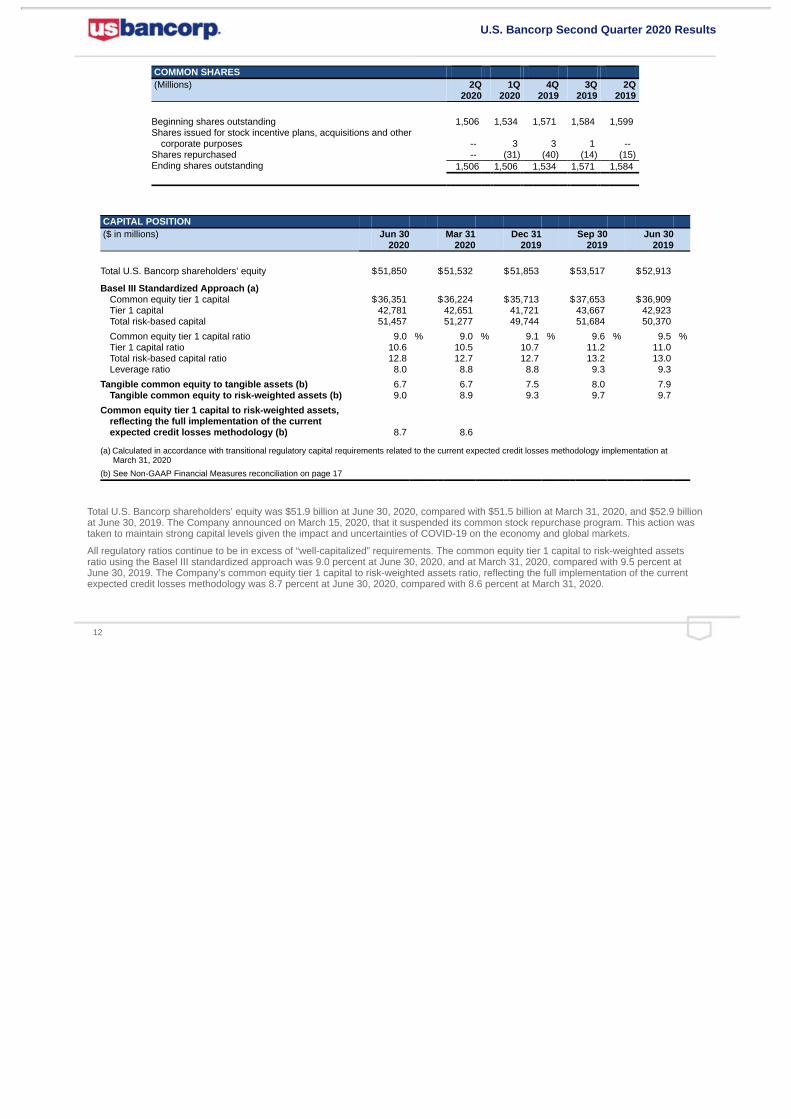
Beginning shares outstanding 1,506 1,534 1,571 1,584 1,599 Shares issued for stock incentive plans, acquisitions and other
corporate purposes -- 3 3 1 -- Shares repurchased -- (31) (40) (14) (15) Ending shares outstanding 1,506 1,506 1,534 1,571 1,584
CAPITAL POSITION ($ in millions)
Jun 30
2020 Mar 31
2020 Dec 31
2019 Sep 30
2019 Jun 30
2019
Total U.S. Bancorp shareholders’ equity $51,850 $51,532 $51,853 $53,517 $52,913
Basel III Standardized Approach (a) Common equity tier 1 capital $36,351 $36,224 $35,713 $37,653 $36,909 Tier 1 capital 42,781 42,651 41,721 43,667 42,923 Total risk-based capital 51,457 51,277 49,744 51,684 50,370
Common equity tier 1 capital ratio 9.0 % 9.0 % 9.1 % 9.6 % 9.5 % Tier 1 capital ratio 10.6 10.5 10.7 11.2 11.0 Total risk-based capital ratio 12.8 12.7 12.7 13.2 13.0 Leverage ratio 8.0 8.8 8.8 9.3 9.3
Tangible common equity to tangible assets (b) 6.7 6.7 7.5 8.0 7.9 Tangible common equity to risk-weighted assets (b) 9.0 8.9 9.3 9.7 9.7
Common equity tier 1 capital to risk-weighted assets,reflecting the full implementation of the currentexpected credit losses methodology (b) 8.7 8.6
(a) Calculated in accordance with transitional regulatory capital requirements related to the current expected credit losses methodology implementation atMarch 31, 2020
(b) See Non-GAAP Financial Measures reconciliation on page 17
Total U.S. Bancorp shareholders’ equity was $51.9 billion at June 30, 2020, compared with $51.5 billion at March 31, 2020, and $52.9 billionat June 30, 2019. The Company announced on March 15, 2020, that it suspended its common stock repurchase program. This action wastaken to maintain strong capital levels given the impact and uncertainties of COVID-19 on the economy and global markets.
All regulatory ratios continue to be in excess of “well-capitalized” requirements. The common equity tier 1 capital to risk-weighted assetsratio using the Basel III standardized approach was 9.0 percent at June 30, 2020, and at March 31, 2020, compared with 9.5 percent atJune 30, 2019. The Company’s common equity tier 1 capital to risk-weighted assets ratio, reflecting the full implementation of the currentexpected credit losses methodology was 8.7 percent at June 30, 2020, compared with 8.6 percent at March 31, 2020.
12

U.S. Bancorp Second Quarter 2020 Results
Investor Conference Call
On Wednesday, July 15, 2020, at 8 a.m. CT, Chairman, President and Chief Executive Officer Andy Cecere and Vice Chair and ChiefFinancial Officer Terry Dolan will host a conference call to review the financial results. The conference call will be available online or bytelephone. To access the webcast and presentation, visit U.S. Bancorp’s website at usbank.com and click on “About Us”, “InvestorRelations” and “Webcasts & Presentations.” To access the conference call from locations within the United States and Canada, please dial866.316.1409. Participants calling from outside the United States and Canada, please dial 706.634.9086. The conference ID number for allparticipants is 4179908. For those unable to participate during the live call, a recording will be available at approximately 11:00 a.m. CT onWednesday, July 15 and will be accessible until Wednesday, July 22 at 11:59 p.m. CT. To access the recorded message within the UnitedStates and Canada, please dial 855.859.2056. If calling from outside the United States and Canada, please dial 404.537.3406 to access therecording. The conference ID is 4179908.
About U.S. Bancorp
U.S. Bancorp, with more than 70,000 employees and $547 billion in assets as of June 30, 2020, is the parent company of U.S. BankNational Association, the fifth-largest commercial bank in the United States. The Minneapolis-based bank blends its relationship teams,branches and ATM network with mobile and online tools that allow customers to bank how, when and where they prefer. U.S. Bank iscommitted to serving its millions of retail, business, wealth management, payment, commercial and corporate, and investment servicescustomers across the country and around the world as a trusted financial partner, a commitment recognized by the Ethisphere Institutenaming the bank one of the 2020 World’s Most Ethical Companies. Visit U.S. Bank at www.usbank.com or follow on social media to stay upto date with company news.
Forward-looking Statements
“Safe Harbor” Statement under the Private Securities Litigation Reform Act of 1995:
This press release contains forward-looking statements about U.S. Bancorp. Statements that are not historical or current facts, includingstatements about beliefs and expectations, are forward-looking statements and are based on the information available to, and assumptionsand estimates made by, management as of the date hereof. These forward-looking statements cover, among other things, anticipated futurerevenue and expenses and the future plans and prospects of U.S. Bancorp. Forward-looking statements involve inherent risks anduncertainties, and important factors could cause actual results to differ materially from those anticipated. The COVID-19 pandemic isadversely affecting U.S. Bancorp, its customers, counterparties, employees, and third-party service providers, and the ultimate extent of theimpacts on its business, financial position, results of operations, liquidity, and prospects is uncertain. Continued deterioration in generalbusiness and economic conditions or turbulence in domestic or global financial markets could adversely affect U.S. Bancorp’s revenues andthe values of its assets and liabilities, reduce the availability of funding to certain financial institutions, lead to a tightening of credit, andincrease stock price volatility. In addition, changes to statutes, regulations, or regulatory policies or practices could affect U.S. Bancorp insubstantial and unpredictable ways. U.S. Bancorp’s results could also be adversely affected by changes in interest rates; further increasesin unemployment rates; deterioration in the credit quality of its loan portfolios or in the value of the collateral securing those loans;deterioration in the value of its investment securities; legal and regulatory developments; litigation; increased competition from both banksand non-banks; changes in the level of tariffs and other trade policies of the United States and its global trading partners; changes incustomer behavior and preferences; breaches in data security; failures to safeguard personal information; effects of mergers andacquisitions and related integration; effects of critical accounting policies and judgments; and management’s ability to effectively managecredit risk, market risk, operational risk, compliance risk, strategic risk, interest rate risk, liquidity risk and reputation risk.
For discussion of these and other risks that may cause actual results to differ from expectations, refer to U.S. Bancorp’s Annual Report onForm 10-K for the year ended December 31, 2019, on file with the Securities and Exchange Commission, including the sections entitled“Corporate Risk Profile” and “Risk Factors” contained in Exhibit 13, and all subsequent filings with the Securities and Exchange Commissionunder Sections 13(a), 13(c), 14 or 15(d) of the Securities Exchange Act of 1934, including the section entitled “Risk Factors” in the QuarterlyReport on Form 10-Q for the quarter ended March 31, 2020. In addition, factors other than these risks also could adversely affect U.S.Bancorp’s results, and the reader should not consider these risks to be a complete set of all potential risks or uncertainties. Forward-lookingstatements speak only as of the date hereof, and U.S. Bancorp undertakes no obligation to update them in light of new information or futureevents.
13
U.S. Bancorp Second Quarter 2020 Results
Non-GAAP Financial Measures
In addition to capital ratios defined by banking regulators, the Company considers various other measures when evaluating capitalutilization and adequacy, including:
• Tangible common equity to tangible assets • Tangible common equity to risk-weighted assets
• Common equity tier 1 capital to risk-weighted assets, reflecting the full implementation of the current expected credit lossesmethodology, and
• Return on tangible common equity.
These capital measures are viewed by management as useful additional methods of evaluating the Company’s utilization of its capital heldand the level of capital available to withstand unexpected negative market or economic conditions. Additionally, presentation of thesemeasures allows investors, analysts and banking regulators to assess the Company’s capital position relative to other financial servicescompanies. These capital measures are not defined in generally accepted accounting principles (“GAAP”), or are not currently effective ordefined in banking regulations. In addition, certain of these measures differ from currently effective capital ratios defined by bankingregulations principally in that the currently effective ratios, which are subject to certain transitional provisions, temporarily exclude the impactof the first quarter of 2020 adoption of accounting guidance related to impairment of financial instruments based on the current expectedcredit losses methodology. As a result, these capital measures disclosed by the Company may be considered non-GAAP financialmeasures. Management believes this information helps investors assess trends in the Company’s capital adequacy.
The Company also discloses net interest income and related ratios and analysis on a taxable-equivalent basis, which may also beconsidered non-GAAP financial measures. The Company believes this presentation to be the preferred industry measurement of netinterest income as it provides a relevant comparison of net interest income arising from taxable and tax-exempt sources. In addition, certainperformance measures, including the efficiency ratio and net interest margin utilize net interest income on a taxable-equivalent basis.
There may be limits in the usefulness of these measures to investors. As a result, the Company encourages readers to consider theconsolidated financial statements and other financial information contained in this press release in their entirety, and not to rely on anysingle financial measure. A table follows that shows the Company’s calculation of these non-GAAP financial measures.
14

CONSOLIDATED STATEMENT OF INCOME
(Dollars and Shares in Millions, Except Per Share Data) Three Months Ended
June 30, Six Months Ended
June 30, (Unaudited) 2020 2019 2020 2019 Interest Income Loans $2,949 $3,582 $6,260 $7,122 Loans held for sale 52 34 96 59 Investment securities 630 745 1,322 1,450 Other interest income 41 90 110 171
Total interest income 3,672 4,451 7,788 8,802 Interest Expense Deposits 194 762 719 1,457 Short-term borrowings 34 91 105 184 Long-term debt 244 293 541 597
Total interest expense 472 1,146 1,365 2,238 Net interest income 3,200 3,305 6,423 6,564 Provision for credit losses 1,737 365 2,730 742 Net interest income after provision for credit losses 1,463 2,940 3,693 5,822 Noninterest Income Credit and debit card revenue 284 365 588 669 Corporate payment products revenue 101 167 246 329 Merchant processing services 266 404 603 782 Trust and investment management fees 434 415 861 814 Deposit service charges 133 227 342 444 Treasury management fees 137 153 280 299 Commercial products revenue 355 249 601 468 Mortgage banking revenue 648 189 1,043 358 Investment products fees 45 47 94 92 Securities gains (losses), net 81 17 131 22 Other 130 257 350 504
Total noninterest income 2,614 2,490 5,139 4,781 Noninterest Expense Compensation 1,685 1,574 3,305 3,133 Employee benefits 314 314 666 647 Net occupancy and equipment 271 281 547 558 Professional services 106 106 205 201 Marketing and business development 67 111 141 200 Technology and communications 309 270 598 527 Postage, printing and supplies 72 73 144 145 Other intangibles 43 42 85 82 Other 451 382 943 747
Total noninterest expense 3,318 3,153 6,634 6,240 Income before income taxes 759 2,277 2,198 4,363 Applicable income taxes 64 449 324 827 Net income 695 1,828 1,874 3,536 Net (income) loss attributable to noncontrolling interests (6) (7) (14) (16) Net income attributable to U.S. Bancorp $689 $1,821 $1,860 $3,520 Net income applicable to U.S. Bancorp common shareholders $614 $1,741 $1,702 $3,354 Earnings per common share $.41 $1.09 $1.13 $2.10 Diluted earnings per common share $.41 $1.09 $1.12 $2.10 Dividends declared per common share $.42 $.37 $.84 $.74 Average common shares outstanding 1,506 1,590 1,512 1,596 Average diluted common shares outstanding 1,507 1,592 1,513 1,599
15
CONSOLIDATED ENDING BALANCE SHEET
(Dollars in Millions) June 30,
2020 December 31,
2019 June 30,
2019 (Unaudited) (Unaudited)
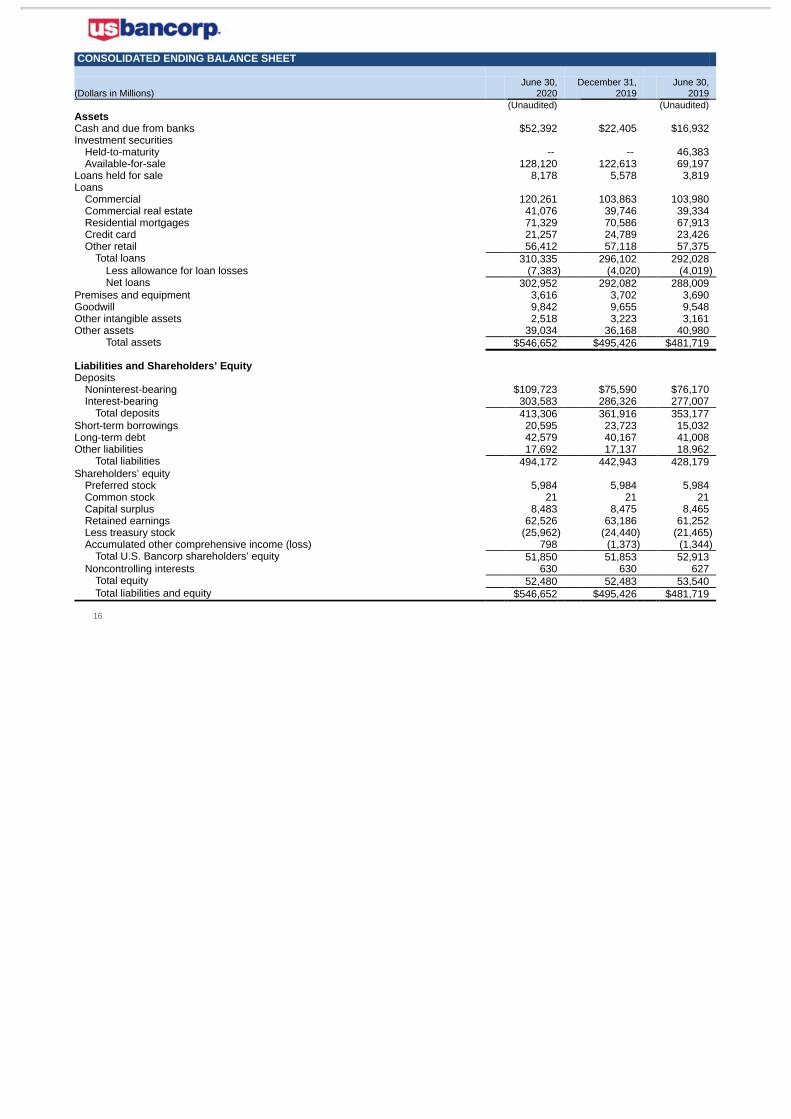
Assets Cash and due from banks $52,392 $22,405 $16,932 Investment securities
Held-to-maturity -- -- 46,383 Available-for-sale 128,120 122,613 69,197
Loans held for sale 8,178 5,578 3,819 Loans
Commercial 120,261 103,863 103,980 Commercial real estate 41,076 39,746 39,334 Residential mortgages 71,329 70,586 67,913 Credit card 21,257 24,789 23,426 Other retail 56,412 57,118 57,375
Total loans 310,335 296,102 292,028 Less allowance for loan losses (7,383) (4,020) (4,019) Net loans 302,952 292,082 288,009
Premises and equipment 3,616 3,702 3,690 Goodwill 9,842 9,655 9,548 Other intangible assets 2,518 3,223 3,161 Other assets 39,034 36,168 40,980
Total assets $546,652 $495,426 $481,719
Liabilities and Shareholders’ Equity Deposits
Noninterest-bearing $109,723 $75,590 $76,170 Interest-bearing 303,583 286,326 277,007
Total deposits 413,306 361,916 353,177 Short-term borrowings 20,595 23,723 15,032 Long-term debt 42,579 40,167 41,008 Other liabilities 17,692 17,137 18,962
Total liabilities 494,172 442,943 428,179 Shareholders’ equity
Preferred stock 5,984 5,984 5,984 Common stock 21 21 21 Capital surplus 8,483 8,475 8,465 Retained earnings 62,526 63,186 61,252 Less treasury stock (25,962) (24,440) (21,465) Accumulated other comprehensive income (loss) 798 (1,373) (1,344)
Total U.S. Bancorp shareholders’ equity 51,850 51,853 52,913 Noncontrolling interests 630 630 627
Total equity 52,480 52,483 53,540 Total liabilities and equity $546,652 $495,426 $481,719
16

NON-GAAP FINANCIAL MEASURES
(Dollars in Millions, Unaudited) June 30,
2020 March 31,
2020 December 31,
2019 September 30,
2019 June 30,
2019 Total equity $52,480 $52,162 $52,483 $54,147 $53,540 Preferred stock (5,984) (5,984) (5,984) (5,984) (5,984) Noncontrolling interests (630) (630) (630) (630) (627) Goodwill (net of deferred tax liability) (1) (8,954) (8,958) (8,788) (8,781) (8,708) Intangible assets, other than mortgage servicing rights (678) (742) (677) (687) (703)
Tangible common equity (a) 36,234 35,848 36,404 38,065 37,518
Common equity tier 1 capital, determined in accordance with transitional regulatory capital requirements related tothe current expected credit losses methodology implementation 36,351 36,224
Adjustments (2) (1,702) (1,377) Common equity tier 1 capital, reflecting the full implementation of the current expected credit losses methodology (b) 34,649 34,847 Total assets 546,652 542,909 495,426 487,671 481,719 Goodwill (net of deferred tax liability) (1) (8,954) (8,958) (8,788) (8,781) (8,708)
Intangible assets, other than mortgage servicing rights (678) (742) (677) (687) (703) Tangible assets (c) 537,020 533,209 485,961 478,203 472,308
Risk-weighted assets, determined in accordance with prescribed regulatory capital requirements effective for theCompany (d) 401,832 * 404,627 391,269 390,622 388,709
Adjustments (3) (1,394)* (958)
Risk-weighted assets, reflecting the full implementation of the current expected credit losses methodology (e) 400,438 * 403,669
Ratios* Tangible common equity to tangible assets (a)/(c) 6.7 % 6.7 % 7.5 % 8.0 % 7.9 % Tangible common equity to risk-weighted assets (a)/(d) 9.0 8.9 9.3 9.7 9.7 Common equity tier 1 capital to risk-weighted assets, reflecting the full implementation of the current expected credit
losses methodology (b)/(e) 8.7 8.6
Three Months Ended
June 30,
2020 March 31,
2020 December 31,
2019 September 30,
2019 June 30,
2019 Net income applicable to U.S. Bancorp common shareholders $614 $1,088 $1,408 $1,821 $1,741 Intangibles amortization (net-of-tax) 34 33 35 33 33
Net income applicable to U.S. Bancorp common shareholders, excluding intangibles amortization 648 1,121 1,443 1,854 1,774 Annualized net income applicable to U.S. Bancorp common shareholders, excluding intangible amortization (f) 2,606 4,509 5,725 7,356 7,115
Average total equity 52,871 51,776 53,777 53,921 53,066 Average preferred stock (5,984) (5,984) (5,984) (5,984) (5,984) Average noncontrolling interests (630) (630) (630) (629) (628) Average goodwill (net of deferred tax liability) (1) (8,960) (8,825) (8,796) (8,725) (8,715) Average intangible assets, other than mortgage servicing rights (706) (688) (683) (689) (681)
Average tangible common equity (g) 36,591 35,649 37,684 37,894 37,058
Return on tangible common equity (f)/(g) 7.1 % 12.6 % 15.2 % 19.4 % 19.2 %
Net interest income $3,200 $3,223 $3,207 $3,281 $3,305 Taxable-equivalent adjustment (4) 24 24 24 25 27
Net interest income, on a taxable-equivalent basis 3,224 3,247 3,231 3,306 3,332
Net interest income, on a taxable-equivalent basis (as calculated above) 3,224 3,247 3,231 3,306 3,332 Noninterest income 2,614 2,525 2,436 2,614 2,490 Less: Securities gains (losses), net 81 50 26 25 17
Total net revenue, excluding net securities gains (losses) (h) 5,757 5,722 5,641 5,895 5,805
Noninterest expense (i) 3,318 3,316 3,401 3,144 3,153 Less: Intangible amortization 43 42 44 42 42
Noninterest expense, excluding intangible amortization (j) 3,275 3,274 3,357 3,102 3,111
Efficiency ratio (i)/(h) 57.6 % 58.0 % 60.3 % 53.3 % 54.3 % Tangible efficiency ratio (j)/(h) 56.9 57.2 59.5 52.6 53.6
* Preliminary data. Subject to change prior to filings with applicable regulatory agencies.(1) Includes goodwill related to certain investments in unconsolidated financial institutions per prescribed regulatory requirements.(2) Includes the estimated increase in the allowance for credit losses related to the adoption of the current expected credit losses methodology net of deferred taxes.(3) Includes the impact of the estimated increase in the allowance for credit losses related to the adoption of the current expected credit losses methodology.(4) Based on a federal income tax rate of 21 percent for those assets and liabilities whose income or expense is not included for federal income tax purposes.
17

LINE OF BUSINESS FINANCIAL PERFORMANCE (a) ($ in millions)
Net Income Attributable
to U.S. Bancorp Percent Change Net Income Attributable
to U.S. Bancorp
Business Line 2Q
2020 1Q
2020 2Q
2019 2Q20 vs
1Q20 2Q20 vs
2Q19 YTD2020
YTD2019
PercentChange
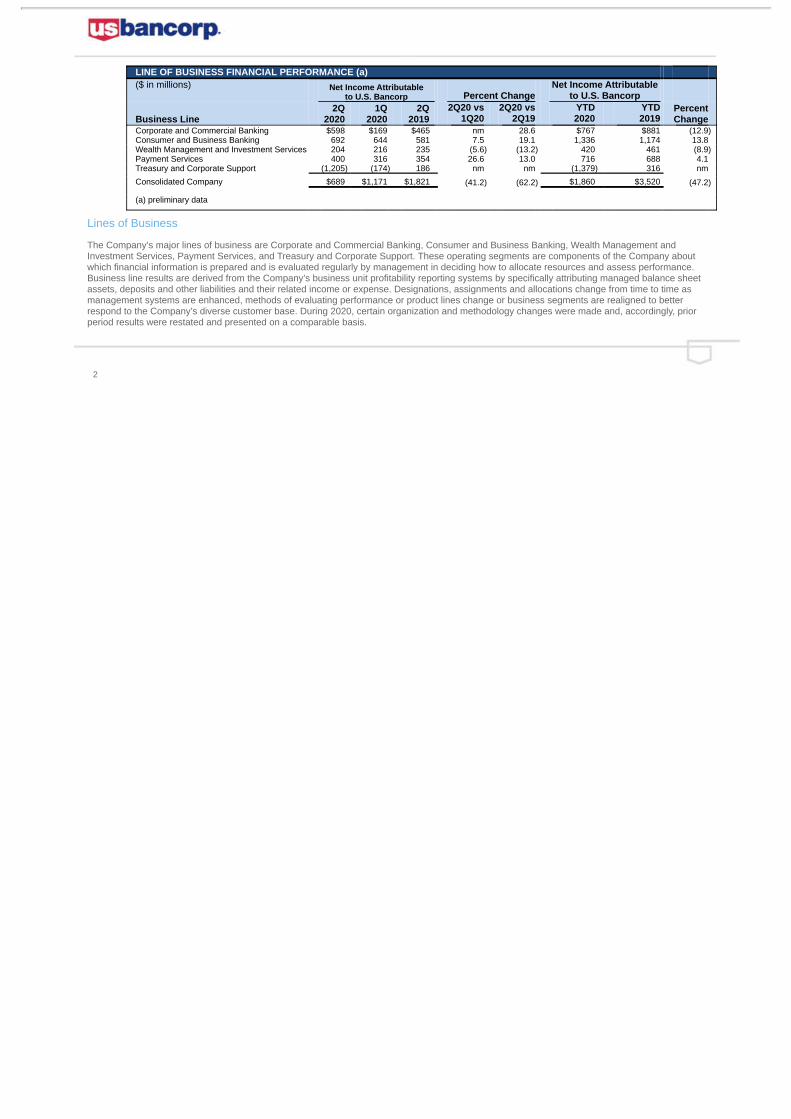
Corporate and Commercial Banking $598 $169 $465 nm 28.6 $767 $881 (12.9) Consumer and Business Banking 692 644 581 7.5 19.1 1,336 1,174 13.8 Wealth Management and Investment Services 204 216 235 (5.6) (13.2) 420 461 (8.9) Payment Services 400 316 354 26.6 13.0 716 688 4.1 Treasury and Corporate Support (1,205) (174) 186 nm nm (1,379) 316 nm
Consolidated Company $689 $1,171 $1,821 (41.2) (62.2) $1,860 $3,520 (47.2)
(a) preliminary data
Lines of Business
The Company’s major lines of business are Corporate and Commercial Banking, Consumer and Business Banking, Wealth Management andInvestment Services, Payment Services, and Treasury and Corporate Support. These operating segments are components of the Company aboutwhich financial information is prepared and is evaluated regularly by management in deciding how to allocate resources and assess performance.Business line results are derived from the Company’s business unit profitability reporting systems by specifically attributing managed balance sheetassets, deposits and other liabilities and their related income or expense. Designations, assignments and allocations change from time to time asmanagement systems are enhanced, methods of evaluating performance or product lines change or business segments are realigned to betterrespond to the Company’s diverse customer base. During 2020, certain organization and methodology changes were made and, accordingly, priorperiod results were restated and presented on a comparable basis.
2
CORPORATE AND COMMERCIAL BANKING (a) ($ in millions) Percent Change
2Q
2020 1Q
2020 2Q
2019 2Q20 vs
1Q20 2Q20 vs
2Q19 YTD 2020
YTD2019
PercentChange
Condensed Income Statement Net interest income (taxable-equivalent basis) $890 $798 $774 11.5 15.0 $1,688 $1,552 8.8 Noninterest income 340 273 244 24.5 39.3 613 452 35.6 Securities gains (losses), net -- -- -- -- -- -- -- --
Total net revenue 1,230 1,071 1,018 14.8 20.8 2,301 2,004 14.8 Noninterest expense 411 421 413 (2.4) (.5) 832 820 1.5 Other intangibles -- -- 1 -- nm -- 2 nm
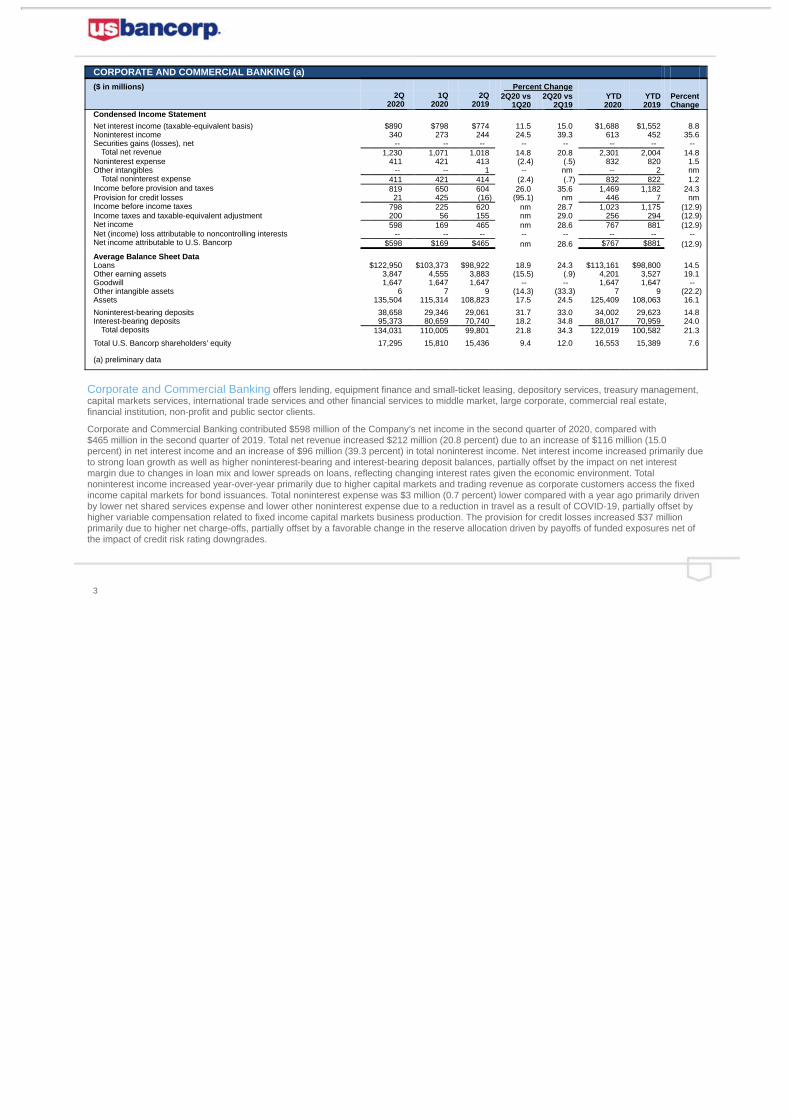
Total noninterest expense 411 421 414 (2.4) (.7) 832 822 1.2 Income before provision and taxes 819 650 604 26.0 35.6 1,469 1,182 24.3 Provision for credit losses 21 425 (16) (95.1) nm 446 7 nm Income before income taxes 798 225 620 nm 28.7 1,023 1,175 (12.9) Income taxes and taxable-equivalent adjustment 200 56 155 nm 29.0 256 294 (12.9) Net income 598 169 465 nm 28.6 767 881 (12.9) Net (income) loss attributable to noncontrolling interests -- -- -- -- -- -- -- -- Net income attributable to U.S. Bancorp $598 $169 $465 nm 28.6 $767 $881 (12.9)
Average Balance Sheet Data Loans $122,950 $103,373 $98,922 18.9 24.3 $113,161 $98,800 14.5 Other earning assets 3,847 4,555 3,883 (15.5) (.9) 4,201 3,527 19.1 Goodwill 1,647 1,647 1,647 -- -- 1,647 1,647 -- Other intangible assets 6 7 9 (14.3) (33.3) 7 9 (22.2) Assets 135,504 115,314 108,823 17.5 24.5 125,409 108,063 16.1
Noninterest-bearing deposits 38,658 29,346 29,061 31.7 33.0 34,002 29,623 14.8 Interest-bearing deposits 95,373 80,659 70,740 18.2 34.8 88,017 70,959 24.0
Total deposits 134,031 110,005 99,801 21.8 34.3 122,019 100,582 21.3
Total U.S. Bancorp shareholders’ equity 17,295 15,810 15,436 9.4 12.0 16,553 15,389 7.6
(a) preliminary data
Corporate and Commercial Banking offers lending, equipment finance and small-ticket leasing, depository services, treasury management,capital markets services, international trade services and other financial services to middle market, large corporate, commercial real estate,financial institution, non-profit and public sector clients.
Corporate and Commercial Banking contributed $598 million of the Company’s net income in the second quarter of 2020, compared with$465 million in the second quarter of 2019. Total net revenue increased $212 million (20.8 percent) due to an increase of $116 million (15.0percent) in net interest income and an increase of $96 million (39.3 percent) in total noninterest income. Net interest income increased primarily dueto strong loan growth as well as higher noninterest-bearing and interest-bearing deposit balances, partially offset by the impact on net interestmargin due to changes in loan mix and lower spreads on loans, reflecting changing interest rates given the economic environment. Totalnoninterest income increased year-over-year primarily due to higher capital markets and trading revenue as corporate customers access the fixedincome capital markets for bond issuances. Total noninterest expense was $3 million (0.7 percent) lower compared with a year ago primarily drivenby lower net shared services expense and lower other noninterest expense due to a reduction in travel as a result of COVID-19, partially offset byhigher variable compensation related to fixed income capital markets business production. The provision for credit losses increased $37 millionprimarily due to higher net charge-offs, partially offset by a favorable change in the reserve allocation driven by payoffs of funded exposures net ofthe impact of credit risk rating downgrades.
3

CONSUMER AND BUSINESS BANKING (a) ($ in millions) Percent Change
2Q
2020 1Q
2020 2Q
2019 2Q20 vs
1Q20 2Q20 vs
2Q19 YTD2020
YTD 2019
PercentChange
Condensed Income Statement Net interest income (taxable-equivalent basis) $1,486 $1,543 $1,597 (3.7) (7.0) $3,029 $3,178 (4.7) Noninterest income 921 757 567 21.7 62.4 1,678 1,102 52.3 Securities gains (losses), net -- -- -- -- -- -- -- --
Total net revenue 2,407 2,300 2,164 4.7 11.2 4,707 4,280 10.0 Noninterest expense 1,370 1,314 1,305 4.3 5.0 2,684 2,555 5.0 Other intangibles 4 4 5 -- (20.0) 8 10 (20.0)
Total noninterest expense 1,374 1,318 1,310 4.2 4.9 2,692 2,565 5.0
Income before provision and taxes 1,033 982 854 5.2 21.0 2,015 1,715 17.5 Provision for credit losses 110 123 79 (10.6) 39.2 233 149 56.4
Income before income taxes 923 859 775 7.5 19.1 1,782 1,566 13.8 Income taxes and taxable-equivalent adjustment 231 215 194 7.4 19.1 446 392 13.8
Net income 692 644 581 7.5 19.1 1,336 1,174 13.8 Net (income) loss attributable to noncontrolling interests -- -- -- -- -- -- -- --
Net income attributable to U.S. Bancorp $692 $644 $581 7.5 19.1 $1,336 $1,174 13.8
Average Balance Sheet Data Loans $150,206 $146,715 $143,777 2.4 4.5 $148,459 $142,804 4.0 Other earning assets 6,576 4,967 3,333 32.4 97.3 5,772 2,864 nm Goodwill 3,475 3,475 3,475 -- -- 3,475 3,475 -- Other intangible assets 1,935 2,405 2,717 (19.5) (28.8) 2,170 2,799 (22.5) Assets 167,501 161,760 157,445 3.5 6.4 164,630 156,103 5.5
Noninterest-bearing deposits 34,662 27,869 27,051 24.4 28.1 31,265 26,800 16.7 Interest-bearing deposits 144,319 133,766 128,932 7.9 11.9 139,041 128,135 8.5
Total deposits 178,981 161,635 155,983 10.7 14.7 170,306 154,935 9.9
Total U.S. Bancorp shareholders’ equity 14,973 14,931 15,119 .3 (1.0) 14,952 15,060 (.7)
(a) preliminary data
Consumer and Business Banking delivers products and services through banking offices, telephone servicing and sales, on-line services,direct mail, ATM processing and mobile devices. It encompasses community banking, metropolitan banking and indirect lending, as well asmortgage banking.
Consumer and Business Banking contributed $692 million of the Company’s net income in the second quarter of 2020, compared with $581 millionin the second quarter of 2019. Total net revenue increased $243 million (11.2 percent) reflecting a decrease in net interest income of $111 million(7.0 percent) that was more than offset by an increase of $354 million (62.4 percent) in total noninterest income. Net interest income decreasedprimarily due to the impact of declining interest rates on deposit spreads, partially offset by growth in noninterest-bearing and interest-bearingdeposit balances and loan growth driven in part by loans made under the SBA’s Paycheck Protection Program. Total noninterest income increasedprimarily due to higher mortgage banking revenue driven by higher mortgage production and related gain on sale margins, partially offset by theunfavorable net impact in the change in fair value of mortgage servicing rights and related hedging activities, partially offset by lower deposit servicecharges due to lower volume and fee waivers related to customers impacted by COVID-19. Total noninterest expense in the second quarter of 2020increased $64 million (4.9 percent) primarily due to higher variable compensation, related to strong mortgage banking origination activities, and netshared services expense, reflecting the impact of investment in infrastructure supporting business growth. The provision for credit losses increased$31 million (39.2 percent) due to higher net charge-offs and an unfavorable change in the reserve allocation reflecting deterioration in credit qualitygiven the economic environment.
4
WEALTH MANAGEMENT AND INVESTMENT SERVICES (a) ($ in millions) Percent Change
2Q
2020 1Q
2020 2Q
2019 2Q20 vs
1Q20 2Q20 vs
2Q19 YTD2020
YTD2019
PercentChange
Condensed Income Statement Net interest income (taxable-equivalent basis) $256 $283 $305 (9.5) (16.1) $539 $598 (9.9) Noninterest income 463 464 445 (.2) 4.0 927 875 5.9 Securities gains (losses), net -- -- -- -- -- -- -- --
Total net revenue 719 747 750 (3.7) (4.1) 1,466 1,473 (.5) Noninterest expense 446 433 432 3.0 3.2 879 853 3.0 Other intangibles 3 3 3 -- -- 6 6 --
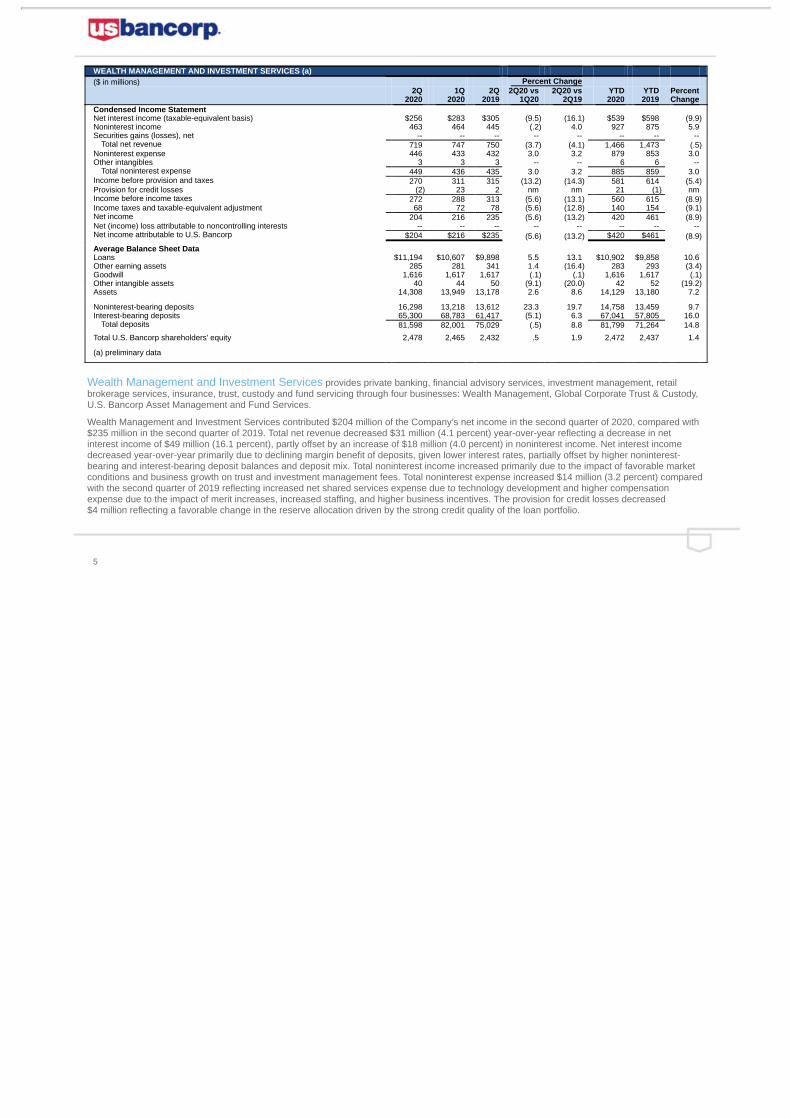
Total noninterest expense 449 436 435 3.0 3.2 885 859 3.0 Income before provision and taxes 270 311 315 (13.2) (14.3) 581 614 (5.4) Provision for credit losses (2) 23 2 nm nm 21 (1) nm Income before income taxes 272 288 313 (5.6) (13.1) 560 615 (8.9) Income taxes and taxable-equivalent adjustment 68 72 78 (5.6) (12.8) 140 154 (9.1) Net income 204 216 235 (5.6) (13.2) 420 461 (8.9) Net (income) loss attributable to noncontrolling interests -- -- -- -- -- -- -- -- Net income attributable to U.S. Bancorp $204 $216 $235 (5.6) (13.2) $420 $461 (8.9)
Average Balance Sheet Data Loans $11,194 $10,607 $9,898 5.5 13.1 $10,902 $9,858 10.6 Other earning assets 285 281 341 1.4 (16.4) 283 293 (3.4) Goodwill 1,616 1,617 1,617 (.1) (.1) 1,616 1,617 (.1) Other intangible assets 40 44 50 (9.1) (20.0) 42 52 (19.2) Assets 14,308 13,949 13,178 2.6 8.6 14,129 13,180 7.2
Noninterest-bearing deposits 16,298 13,218 13,612 23.3 19.7 14,758 13,459 9.7 Interest-bearing deposits 65,300 68,783 61,417 (5.1) 6.3 67,041 57,805 16.0
Total deposits 81,598 82,001 75,029 (.5) 8.8 81,799 71,264 14.8
Total U.S. Bancorp shareholders’ equity 2,478 2,465 2,432 .5 1.9 2,472 2,437 1.4
(a) preliminary data
Wealth Management and Investment Services provides private banking, financial advisory services, investment management, retailbrokerage services, insurance, trust, custody and fund servicing through four businesses: Wealth Management, Global Corporate Trust & Custody,U.S. Bancorp Asset Management and Fund Services.
Wealth Management and Investment Services contributed $204 million of the Company’s net income in the second quarter of 2020, compared with$235 million in the second quarter of 2019. Total net revenue decreased $31 million (4.1 percent) year-over-year reflecting a decrease in netinterest income of $49 million (16.1 percent), partly offset by an increase of $18 million (4.0 percent) in noninterest income. Net interest incomedecreased year-over-year primarily due to declining margin benefit of deposits, given lower interest rates, partially offset by higher noninterest-bearing and interest-bearing deposit balances and deposit mix. Total noninterest income increased primarily due to the impact of favorable marketconditions and business growth on trust and investment management fees. Total noninterest expense increased $14 million (3.2 percent) comparedwith the second quarter of 2019 reflecting increased net shared services expense due to technology development and higher compensationexpense due to the impact of merit increases, increased staffing, and higher business incentives. The provision for credit losses decreased$4 million reflecting a favorable change in the reserve allocation driven by the strong credit quality of the loan portfolio.
5

PAYMENT SERVICES (a) ($ in millions) Percent Change
2Q
2020 1Q
2020 2Q
2019 2Q20 vs
1Q20 2Q20 vs
2Q19 YTD2020
YTD2019
PercentChange
Condensed Income Statement Net interest income (taxable-equivalent basis) $ 602 $ 651 $ 585 (7.5) 2.9 $ 1,253 $ 1,202 4.2 Noninterest income 658 794 952 (17.1) (30.9) 1,452 1,806 (19.6) Securities gains (losses), net -- -- -- -- -- -- -- --
Total net revenue 1,260 1,445 1,537 (12.8) (18.0) 2,705 3,008 (10.1) Noninterest expense 722 726 737 (.6) (2.0) 1,448 1,445 .2 Other intangibles 36 35 33 2.9 9.1 71 64 10.9
Total noninterest expense 758 761 770 (.4) (1.6) 1,519 1,509 .7
Income before provision and taxes 502 684 767 (26.6) (34.6) 1,186 1,499 (20.9) Provision for credit losses (31) 262 295 nm nm 231 581 (60.2)
Income before income taxes 533 422 472 26.3 12.9 955 918 4.0 Income taxes and taxable-equivalent adjustment 133 106 118 25.5 12.7 239 230 3.9
Net income 400 316 354 26.6 13.0 716 688 4.1 Net (income) loss attributable to noncontrolling interests -- -- -- -- -- -- -- --
Net income attributable to U.S. Bancorp $ 400 $ 316 $ 354 26.6 13.0 $ 716 $ 688 4.1
Average Balance Sheet Data Loans $30,321 $33,688 $33,277 (10.0) (8.9) $32,005 $32,848 (2.6) Other earning assets 447 399 327 12.0 36.7 423 387 9.3 Goodwill 3,101 2,955 2,806 4.9 10.5 3,028 2,810 7.8 Other intangible assets 590 563 533 4.8 10.7 576 523 10.1 Assets 35,473 38,798 39,588 (8.6) (10.4) 37,137 39,112 (5.0)
Noninterest-bearing deposits 3,165 1,471 1,221 nm nm 2,318 1,198 93.5 Interest-bearing deposits 117 114 115 2.6 1.7 116 113 2.7
Total deposits 3,282 1,585 1,336 nm nm 2,434 1,311 85.7 Total U.S. Bancorp shareholders’ equity 5,876 6,083 6,043 (3.4) (2.8) 5,980 6,009 (.5) (a) preliminary data
Payment Services includes consumer and business credit cards, stored-value cards, debit cards, corporate, government and purchasing cardservices, consumer lines of credit and merchant processing.
Payment Services contributed $400 million of the Company’s net income in the second quarter of 2020, compared with $354 million in the secondquarter of 2019. Total net revenue decreased $277 million (18.0 percent) due to an increase of $17 million (2.9 percent) in net interest income thatwas more than offset by a decrease of $294 million (30.9 percent) in total noninterest income. Net interest income increased primarily due tofavorable loan spreads, mostly offset by lower loan volume and loan fees. Total noninterest income decreased year-over-year mainly due to theimpacts of COVID-19 on consumer and business spending volumes in all payment businesses including merchant processing services, corporatepayment products, and credit and debit card revenue. Total noninterest expense decreased $12 million (1.6 percent) compared with the secondquarter of 2019 reflecting lower marketing and business development expense due to the timing of marketing campaigns and a reduction in costsrelated to equipment sales driven by lower volumes, partially offset by higher software expense due to capital expenditures and acquisitions. Theprovision for credit losses decreased $326 million primarily due to a favorable change in the reserve allocation driven by lower outstanding loanbalances and lower delinquency rates, partially offset by higher net charge-offs.
6

TREASURY AND CORPORATE SUPPORT (a) ($ in millions) Percent Change
2Q
2020 1Q
2020 2Q
2019 2Q20 vs
1Q20 2Q20 vs
2Q19 YTD2020
YTD2019
PercentChange
Condensed Income Statement Net interest income (taxable-equivalent basis) $ (10) $ (28) $71 64.3 nm $ (38) $88 nm Noninterest income 151 187 265 (19.3) (43.0) 338 524 (35.5) Securities gains (losses), net 81 50 17 62.0 nm 131 22 nm
Total net revenue 222 209 353 6.2 (37.1) 431 634 (32.0) Noninterest expense 326 380 224 (14.2) 45.5 706 485 45.6 Other intangibles -- -- -- -- -- -- -- --
Total noninterest expense 326 380 224 (14.2) 45.5 706 485 45.6
Income before provision and taxes (104) (171) 129 39.2 nm (275) 149 nm Provision for credit losses 1,639 160 5 nm nm 1,799 6 nm
Income before income taxes (1,743) (331) 124 nm nm (2,074) 143 nm Income taxes and taxable-equivalent adjustment (544) (165) (69) nm nm (709) (189) nm
Net income (1,199) (166) 193 nm nm (1,365) 332 nm Net (income) loss attributable to noncontrolling interests (6) (8) (7) 25.0 14.3 (14) (16) 12.5
Net income (loss) attributable to U.S. Bancorp $ (1,205) $ (174) $186 nm nm $ (1,379) $316 nm
Average Balance Sheet Data Loans $ 3,436 $ 3,274 $3,344 4.9 2.8 $ 3,355 $3,362 (.2) Other earning assets 164,857 139,863 129,831 17.9 27.0 152,360 128,491 18.6 Goodwill -- -- -- -- -- -- -- -- Other intangible assets -- -- -- -- -- -- -- -- Assets 191,520 164,986 152,564 16.1 25.5 178,251 151,063 18.0
Noninterest-bearing deposits 2,323 2,238 2,151 3.8 8.0 2,281 2,183 4.5 Interest-bearing deposits 3,088 5,340 10,932 (42.2) (71.8) 4,214 10,051 (58.1)
Total deposits 5,411 7,578 13,083 (28.6) (58.6) 6,495 12,234 (46.9) Total U.S. Bancorp shareholders’ equity 11,619 11,857 13,408 (2.0) (13.3) 11,736 13,121 (10.6) (a) preliminary data
Treasury and Corporate Support includes the Company’s investment portfolios, funding, capital management, interest rate riskmanagement, income taxes not allocated to the business lines, including most investments in tax-advantaged projects, and the residual aggregateof those expenses associated with corporate activities that are managed on a consolidated basis.
Treasury and Corporate Support recorded a net loss of $1,205 million in the second quarter of 2020, compared with net income of $186 million inthe second quarter of 2019 due to a significant increase in the provision for credit losses for the Company. Total net revenue decreased$131 million (37.1 percent) year-over-year driven by decreases in net interest income of $81 million and $50 million (17.7 percent) in totalnoninterest income. Net interest income decreased primarily due to lower spreads within the investment portfolio compared with a year ago. Totalnoninterest income decreased primarily due to lower equity investment income, tax-advantaged investment syndication revenue, and assetimpairments as a result of property damage from civil unrest in the second quarter of 2020, partially offset by higher securities gains. Totalnoninterest expense increased $102 million (45.5 percent) year-over-year primarily due to COVID-related expenses, higher state franchise taxes,higher compensation expense reflecting merit increases, and higher implementation costs of capital investments to support business growth. Theseincreases were partially offset by lower net shared services expense, lower costs related to tax-advantaged projects and a reduction in travelexpenses as a result of COVID-19. The provision for credit losses increased $1,634 million reflecting an unfavorable change in the reserveallocation due to adverse changes in economic conditions and the expected impact to credit losses in the current environment. Income taxes areassessed to each line of business at a managerial tax rate of 25.0 percent with the residual tax expense or benefit to arrive at the consolidatedeffective tax rate included in Treasury and Corporate Support.
7

U.S. Bancorp 2Q20 Earnings Conference Call July 15, 2020 Exhibit 99.2
Forward-looking Statements and Additional Information The following information appears in accordance with the Private Securities Litigation Reform Act of 1995: This presentation contains forward-looking statements about U.S. Bancorp. Statements that are not historical or current facts, including statements about beliefs and expectations, are forward-looking statements and are based on the information available to, and assumptions and estimates made by, management as of the date hereof. These forward-looking statements cover, among other things, anticipated future revenue and expenses and the future plans and prospects of U.S. Bancorp. Forward-looking statements involve inherent risks and uncertainties, and important factors could cause actual results to differ materially from those anticipated. The COVID-19 pandemic is adversely affecting U.S. Bancorp, its customers, counterparties, employees, and third-party service providers, and the ultimate extent of the impacts on its business, financial position, results of operations, liquidity, and prospects is uncertain. Continued deterioration in general business and economic conditions or turbulence in domestic or global financial markets could adversely affect U.S. Bancorp’s revenues and the values of its assets and liabilities, reduce the availability of funding to certain financial institutions, lead to a tightening of credit, and increase stock price volatility. In addition, changes to statutes, regulations, or regulatory policies or practices could affect U.S. Bancorp in substantial and unpredictable ways. U.S. Bancorp’s results could also be adversely affected by changes in interest rates; further increases in unemployment rates; deterioration in the credit quality of its loan portfolios or in the value of the collateral securingthose loans; deterioration in the value of its investment securities; legal and regulatory developments; litigation; increased competition from both banks and non-banks; changes in the level of tariffs and other trade policies of the United States and its global trading partners; changes in customer behavior and preferences; breaches in data security; failures to safeguard personal information; effects of mergers and acquisitions and related integration; effects of critical accounting policies and judgments; and management’s ability to effectively manage credit risk, market risk, operational risk, compliance risk, strategic risk, interest rate risk, liquidity risk and reputation risk. For discussion of these and other risks that may cause actual results to differ from expectations, refer to U.S. Bancorp’s Annual Report on Form 10-K for the year ended December 31, 2019, on file with the Securities and Exchange Commission, including the sections entitled “Risk Factors” and “Corporate Risk Profile” contained in Exhibit 13, and all subsequent filings with the Securities and Exchange Commission under Sections 13(a), 13(c), 14 or 15(d) of the Securities Exchange Act of 1934, including the section entitled “Risk Factors” in the Quarterly Report on Form 10-Q for the quarter ended March 31, 2020. In addition, factors other than these risks also could adversely affect U.S. Bancorp’s results, and the reader should not consider these risks to be a complete set of all potential risks or uncertainties. Forward-looking statements speak only as of the date hereof, and U.S. Bancorp undertakes no obligation to update them in light of new information or future events. This presentation includes non-GAAP financial measures to describe U.S. Bancorp’s performance. The calculations of these measuresare provided in the Appendix. These disclosures should not be viewed as a substitute for operating results determined in accordance with GAAP, nor are they necessarily comparable to non-GAAP performance measures that may be presented by other companies.
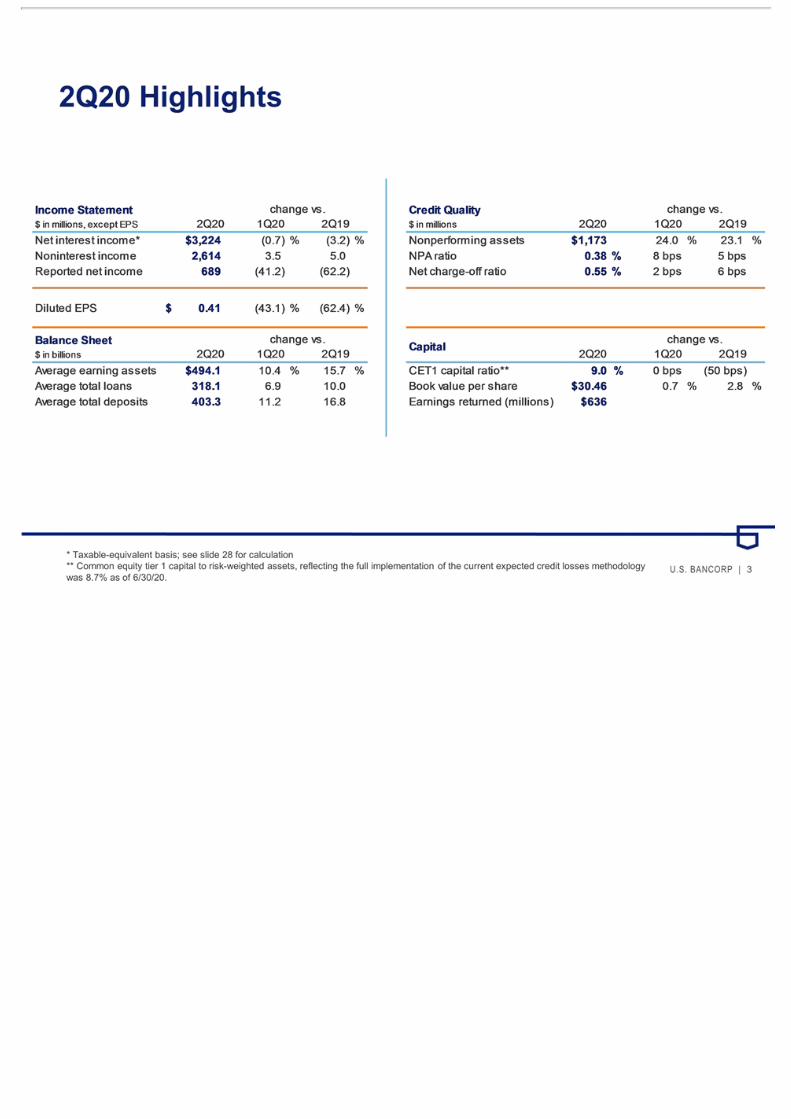
2Q20 Highlights * Taxable-equivalent basis; see slide 28 for calculation ** Common equity tier 1 capital to risk-weighted assets, reflecting the full implementation of the current expected credit losses methodology was 8.7% as of 6/30/20.

Performance Ratios Efficiency Ratio* & Net Interest Margin** * Non-GAAP; see slides 28 and 29 for calculations ** Net interest margin on a taxable-equivalent basis Return on Average Common Equity Return on Tangible Common Equity* Return on Average Assets

Digital Engagement Trends Three months ended Three months ended * Represents core Consumer Banking customers active in at least one channel in the previous 90 days Total Digital includes both online and mobile platforms
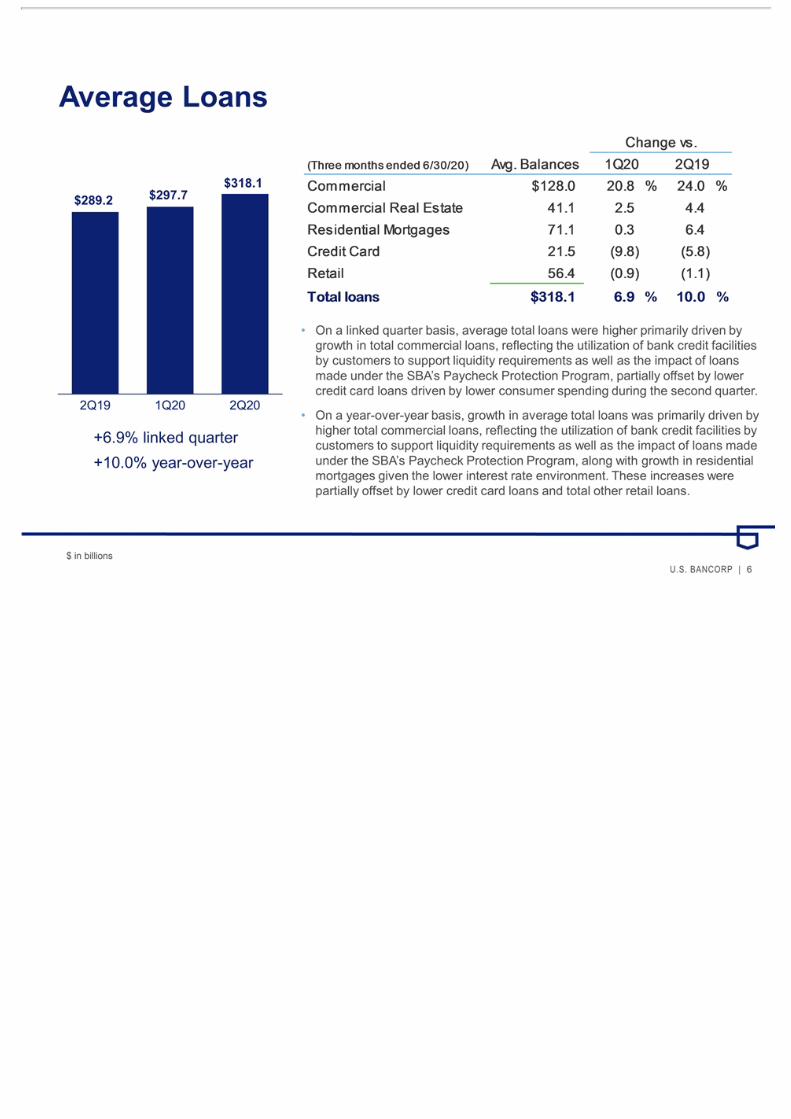
Average Loans +6.9% linked quarter +10.0% year-over-year On a linked quarter basis, average total loans were higher primarily driven by growth in total commercial loans, reflecting the utilization of bank credit facilities by customers to support liquidity requirements as well as the impact of loans made under the SBA’s Paycheck Protection Program, partially offset by lower credit card loans driven by lower consumer spending during the second quarter. On a year-over-year basis, growth in average total loans was primarily driven by higher total commercial loans, reflecting the utilization of bank credit facilities by customers to support liquidity requirements as well as the impact of loans made under the SBA’s Paycheck Protection Program, along with growth in residential mortgages given the lower interest rate environment. These increases were partially offset by lower credit card loans and total other retail loans. $ in billions
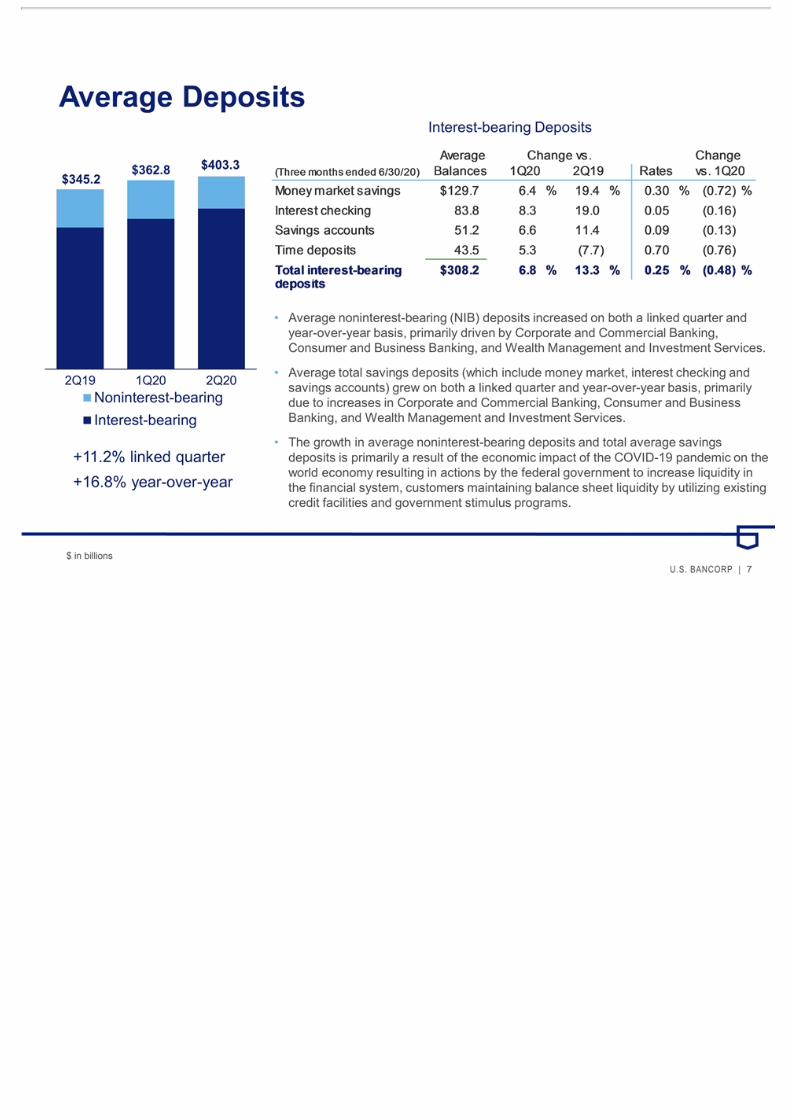
Average Deposits $ in billions +11.2% linked quarter +16.8% year-over-year Interest-bearing Deposits Average noninterest-bearing (NIB) deposits increased on both a linked quarter and year-over-year basis, primarily driven by Corporate and Commercial Banking, Consumer and Business Banking, and Wealth Management and Investment Services. Average total savings deposits (which include money market, interest checking and savings accounts) grew on both a linked quarter and year-over-year basis, primarily due to increases in Corporate and Commercial Banking, Consumer and Business Banking, and Wealth Management and Investment Services. The growth in average noninterest-bearing deposits and total average savings deposits is primarily a result of the economic impact of the COVID-19 pandemic on the world economy resulting in actions by the federal government to increase liquidity in the financial system, customers maintaining balance sheet liquidity by utilizing existing credit facilities and government stimulus programs.

Credit Quality $ in millions NCO Ratio +2 bps QoQ +6 bps YoY NPAs +24.0% QoQ +23.1% YoY
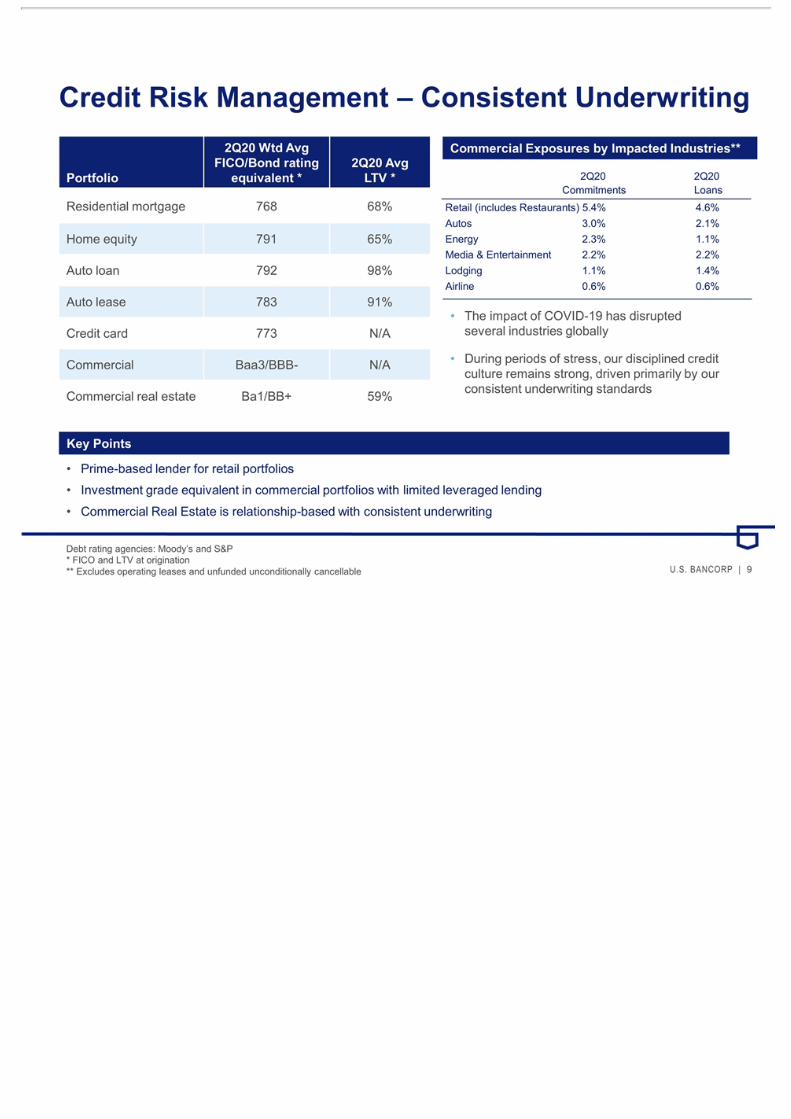
2Q202Q20 Retail (includes Restaurants) 5.4% 4.6% Autos3.0%2.1% Energy 2.3% 1.1% Media & Entertainment2.2%2.2% Lodging 1.1% 1.4% Airline 0.6% 0.6% Credit Risk Management – Consistent Underwriting Commercial Exposures by Impacted Industries** Key Points Debt rating agencies: Moody’s and S&P * FICO and LTV at origination ** Excludes operating leases and unfunded unconditionally cancellable Prime-based lender for retail portfolios Investment grade equivalent in commercial portfolios with limited leveraged lending Commercial Real Estate is relationship-based with consistent underwriting Portfolio 2Q20 Wtd Avg FICO/Bond rating equivalent * 2Q20 Avg LTV * Residential mortgage 768 68% Home equity 791 65% Auto loan 792 98% Auto lease 783 91% Credit card 773 N/A Commercial Baa3/BBB- N/A Commercial real estate Ba1/BB+ 59% The impact of COVID-19 has disrupted several industries globally During periods of stress, our disciplined credit culture remains strong, driven primarily by our consistent underwriting standards Commitments Loans
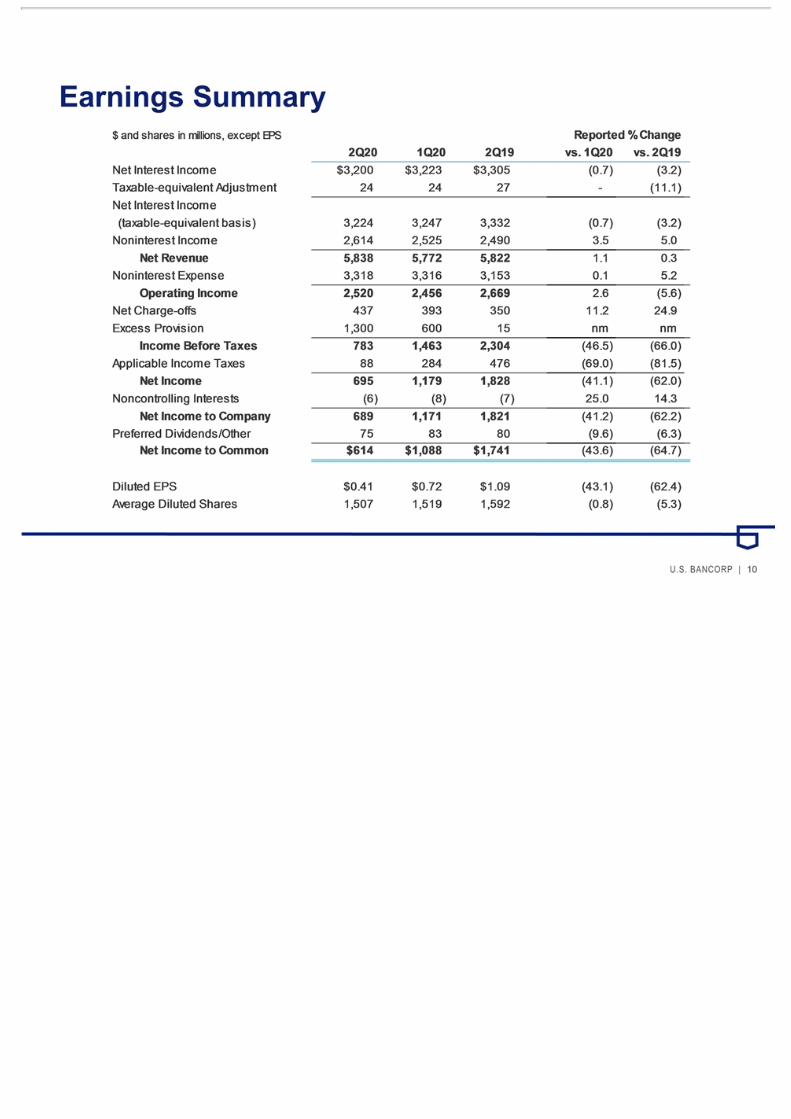
Earnings Summary
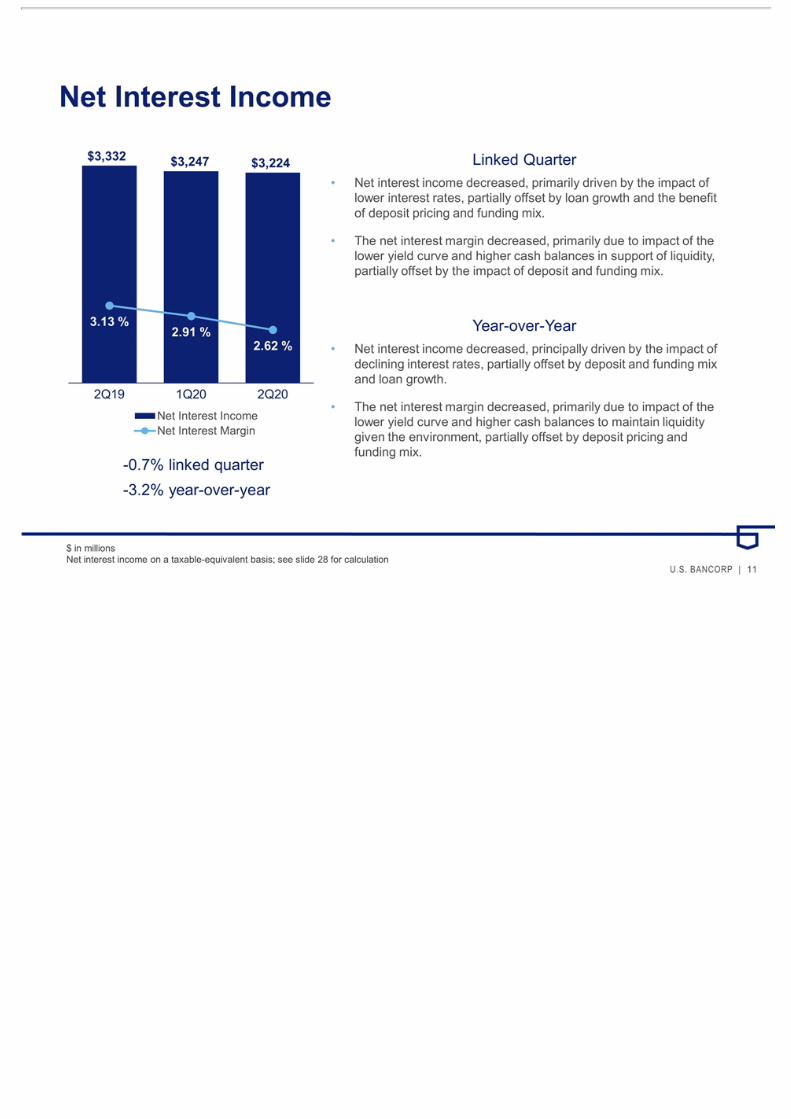
Net Interest Income Linked Quarter Net interest income decreased, primarily driven by the impact of lower interest rates, partially offset by loan growth and the benefit of deposit pricing and funding mix. The net interest margin decreased, primarily due to impact of the lower yield curve and higher cash balances in support of liquidity, partially offset by the impact of deposit and funding mix. Year-over-Year Net interest income decreased, principally driven by the impact of declining interest rates, partially offset by deposit and funding mix and loan growth. The net interest margin decreased, primarily due to impact of the lower yield curve and higher cash balances to maintain liquidity given the environment, partially offset by deposit pricing and funding mix. $ in millions Net interest income on a taxable-equivalent basis; see slide 28 for calculation -0.7% linked quarter -3.2% year-over-year
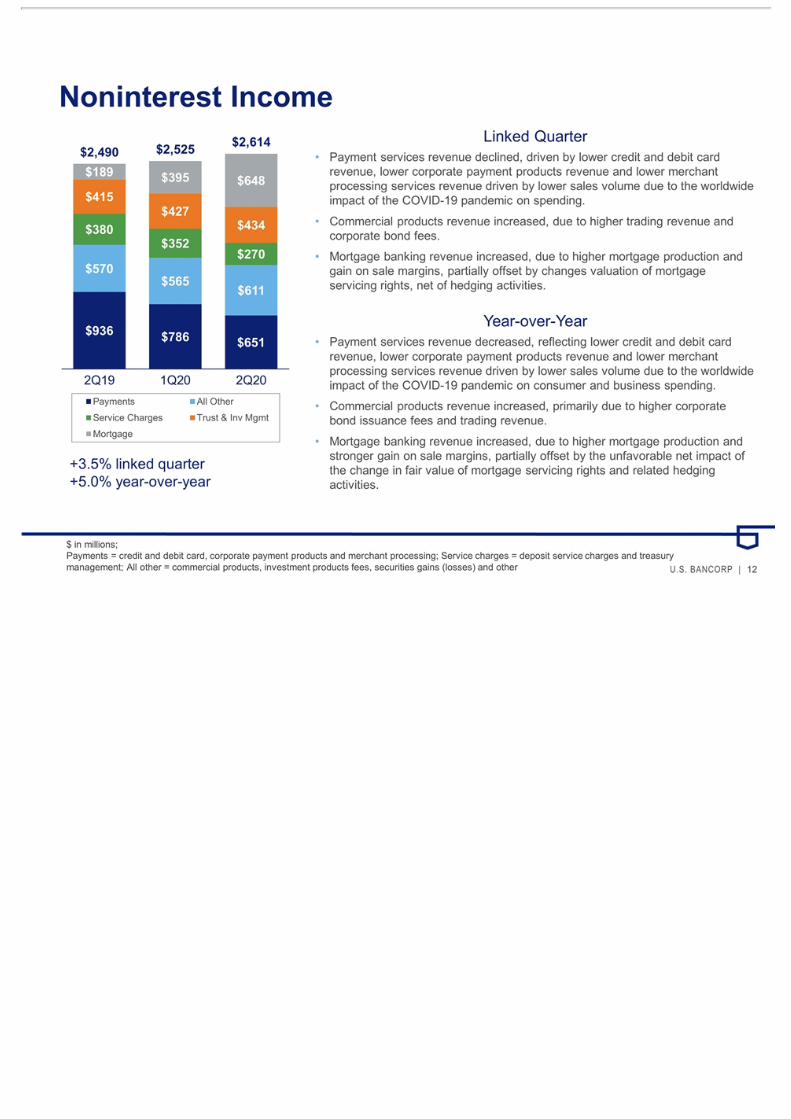
Noninterest Income $ in millions; Payments = credit and debit card, corporate payment products and merchant processing; Service charges = deposit service charges and treasury management; All other = commercial products, investment products fees, securities gains (losses) and other +3.5% linked quarter +5.0% year-over-year Linked Quarter Payment services revenue declined, driven by lower credit and debit card revenue, lower corporate payment products revenue and lower merchant processing services revenue driven by lower sales volume due to the worldwide impact of the COVID-19 pandemic on spending. Commercial products revenue increased, due to higher trading revenue and corporate bond fees. Mortgage banking revenue increased, due to higher mortgage production and gain on sale margins, partially offset by changes valuation of mortgage servicing rights, net of hedging activities. Year-over-Year Payment services revenue decreased, reflecting lower credit and debit card revenue, lower corporate payment products revenue and lower merchant processing services revenue driven by lower sales volume due to the worldwide impact of the COVID-19 pandemic on consumer and business spending. Commercial products revenue increased, primarily due to higher corporate bond issuance fees and trading revenue. Mortgage banking revenue increased, due to higher mortgage production and stronger gain on sale margins, partially offset by the unfavorable net impact of the change in fair value of mortgage servicing rights and related hedging activities.

Payment Services Fee Revenue Select Revenue Exposure, YTD 2020 Contribution to U.S. Bank’s Net Revenues Merchant Acquiring Revenue Corporate Payment Systems Revenue Retail Payment Solutions Revenue Commercial revenue breakdown: Travel and Entertainment represents 11.7% of total CPS revenue YTD

Noninterest Expense $ in millions PPS = postage, printing and supplies +0.1% linked quarter +5.2% year-over-year Linked Quarter Compensation expense increased, primarily due to merit and revenue-related expenses. Technology and communications expense increased, primarily due to capital expenditures supporting business growth. Other noninterest expense decreased due to lower accruals in the second quarter of 2020 for liabilities related to future delivery exposures related to merchant and airline processing, partially offset by higher state franchise taxes. Year-over-Year Compensation expense increased, due to merit and variable compensation related to business production in mortgage banking and fixed income capital markets. Technology and communications expense increased, primarily due to capital expenditures supporting business growth. Other noninterest expense increased, which reflected approximately $79 million of expenses related to COVID-19, including increased liabilities driven by future delivery exposure related to merchant processing for airlines, and higher state franchise taxes, partially offset by lower costs related to tax-advantaged projects in the second quarter of 2020.

Capital Position * Non-GAAP; see slide 30 for calculations
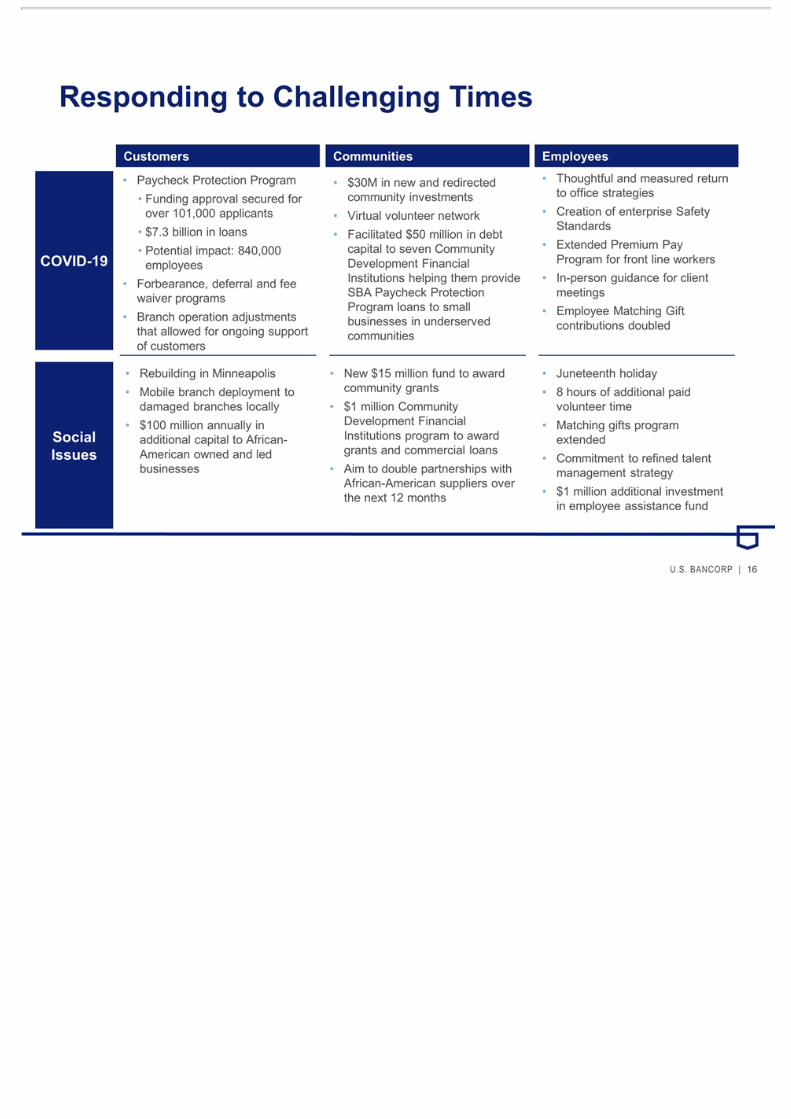
Responding to Challenging Times Customers Paycheck Protection Program Funding approval secured for over 101,000 applicants $7.3 billion in loans Potential impact: 840,000 employees Forbearance, deferral and fee waiver programs Branch operation adjustments that allowed for ongoing support of customers $30M in new and redirected community investments Virtual volunteer network Facilitated $50 million in debt capital to seven Community Development Financial Institutions helping them provide SBA Paycheck Protection Program loans to small businesses in underserved communities Thoughtful and measured return to office strategies Creation of enterprise Safety Standards Extended Premium Pay Program for front line workers In-person guidance for client meetings Employee Matching Gift contributions doubled Employees Communities COVID-19 Rebuilding in Minneapolis Mobile branch deployment to damaged branches locally $100 million annually in additional capital to African-American owned and led businesses New $15 million fund to award community grants $1 million Community Development Financial Institutions program to award grants and commercial loans Aim to double partnerships with African-American suppliers over the next 12 months Juneteenth holiday 8 hours of additional paid volunteer time Matching gifts program extended Commitment to refined talent management strategy $1 million additional investment in employee assistance fund Social Issues
Appendix

Average Loans vs. 2Q19 Average total loans increased by $28.9 billion, or 10.0% Average commercial loans increased by $24.8 billion, or 24.0% Average residential mortgage loans increased by $4.3 billion, or 6.4% Average credit card loans decreased by $1.3 billion, or 5.8% Average retail loans decreased by $0.6 billion, or 1.1% vs. 1Q20 Average total loans increased by $20.5 billion, or 6.9% Average commercial loans increased by $22.1 billion, or 20.8% Average credit card loans decreased by $2.3 billion, or 9.8% Key Points Year-over-Year Growth 3.8% 4.0% 3.9% 4.0% 10.0% Commercial CRE Res Mtg Retail Credit Card Average Loans ($bn)
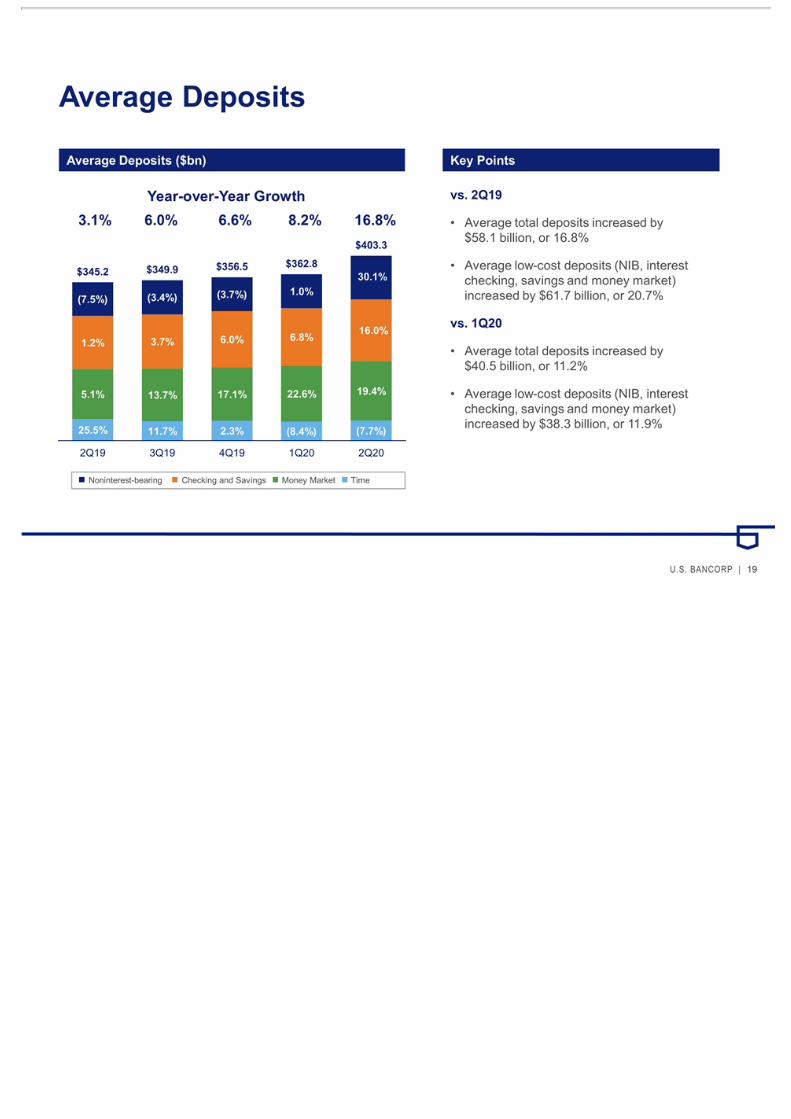
Average Deposits Key Points Average Deposits ($bn) vs. 2Q19 Average total deposits increased by $58.1 billion, or 16.8% Average low-cost deposits (NIB, interest checking, savings and money market) increased by $61.7 billion, or 20.7% vs. 1Q20 Average total deposits increased by $40.5 billion, or 11.2% Average low-cost deposits (NIB, interest checking, savings and money market) increased by $38.3 billion, or 11.9% Year-over-Year Growth 3.1% 6.0% 6.6% 8.2% 16.8% Time Money Market Checking and Savings Noninterest-bearing

Credit Quality – Commercial Average Loans ($mm) and Net Charge-offs Ratio Key Statistics Key Points $mm2Q19 1Q20 2Q20 Average Loans$103,233 $105,987 $128,039 30-89 Delinquencies0.34% 0.28%0.33% 90+ Delinquencies0.26%0.06%0.07% Nonperforming Loans0.27% 0.24% 0.38% Linked Quarter Growth 1.2% 0.4% 0.2% 2.0% 20.8% Linked quarter loan growth of 20.8% was driven by revolving line utilization and incremental liquidity facilities for existing clients early in 2Q20 – utilization rates have returned to near normal rates in June 2020 Net charge-offs increased on a linked quarter basis due to stress in certain industries impacted by COVID-19
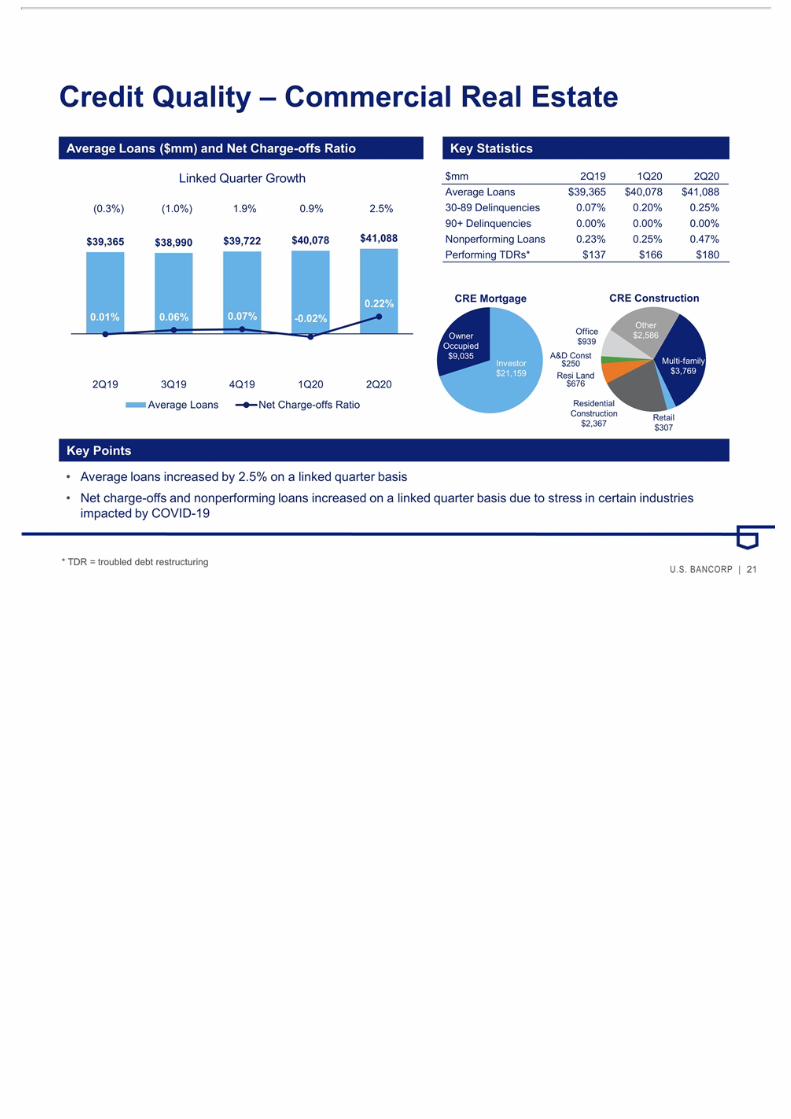
Investor $21,159 Owner Occupied $9,035 A&D Const $250 Multi-family $3,769 Retail $307 Residential Construction $2,367 Office $939 Other $2,586 Resi Land $676 $mm2Q19 1Q20 2Q20 Average Loans$39,365 $40,078$41,088 30-89 Delinquencies0.07% 0.20%0.25% 90+ Delinquencies0.00%0.00%0.00% Nonperforming Loans0.23% 0.25% 0.47% Performing TDRs*$137 $166 $180 Credit Quality – Commercial Real Estate Average Loans ($mm) and Net Charge-offs Ratio Key Statistics Key Points * TDR = troubled debt restructuring Linked Quarter Growth (0.3%) (1.0%) 1.9% 0.9% 2.5% Average loans increased by 2.5% on a linked quarter basis Net charge-offs and nonperforming loans increased on a linked quarter basis due to stress in certain industries impacted by COVID-19
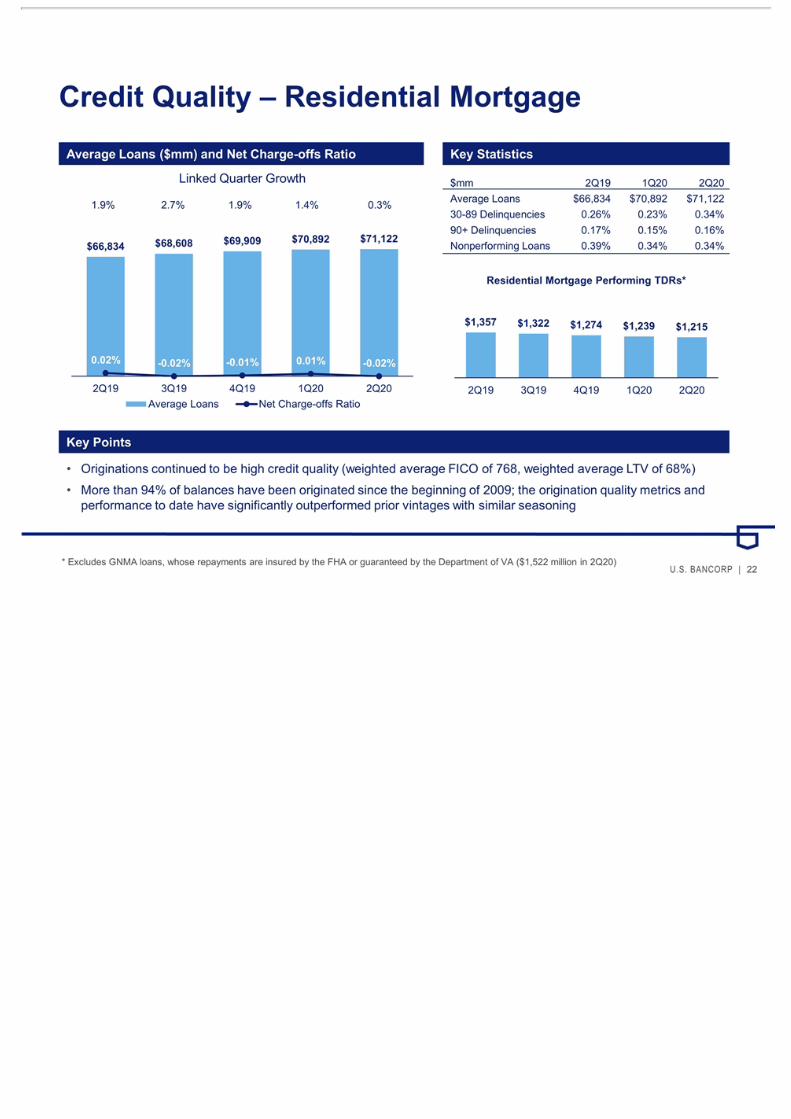
Credit Quality – Residential Mortgage Average Loans ($mm) and Net Charge-offs Ratio Key Statistics Key Points $mm2Q191Q202Q20 Average Loans$66,834 $70,892 $71,122 30-89 Delinquencies0.26%0.23%0.34% 90+ Delinquencies0.17% 0.15% 0.16% Nonperforming Loans0.39%0.34%0.34% * Excludes GNMA loans, whose repayments are insured by the FHA or guaranteed by the Department of VA ($1,522 million in 2Q20) Linked Quarter Growth 1.9% 2.7% 1.9% 1.4% 0.3% Originations continued to be high credit quality (weighted average FICO of 768, weighted average LTV of 68%) More than 94% of balances have been originated since the beginning of 2009; the origination quality metrics and performance to date have significantly outperformed prior vintages with similar seasoning
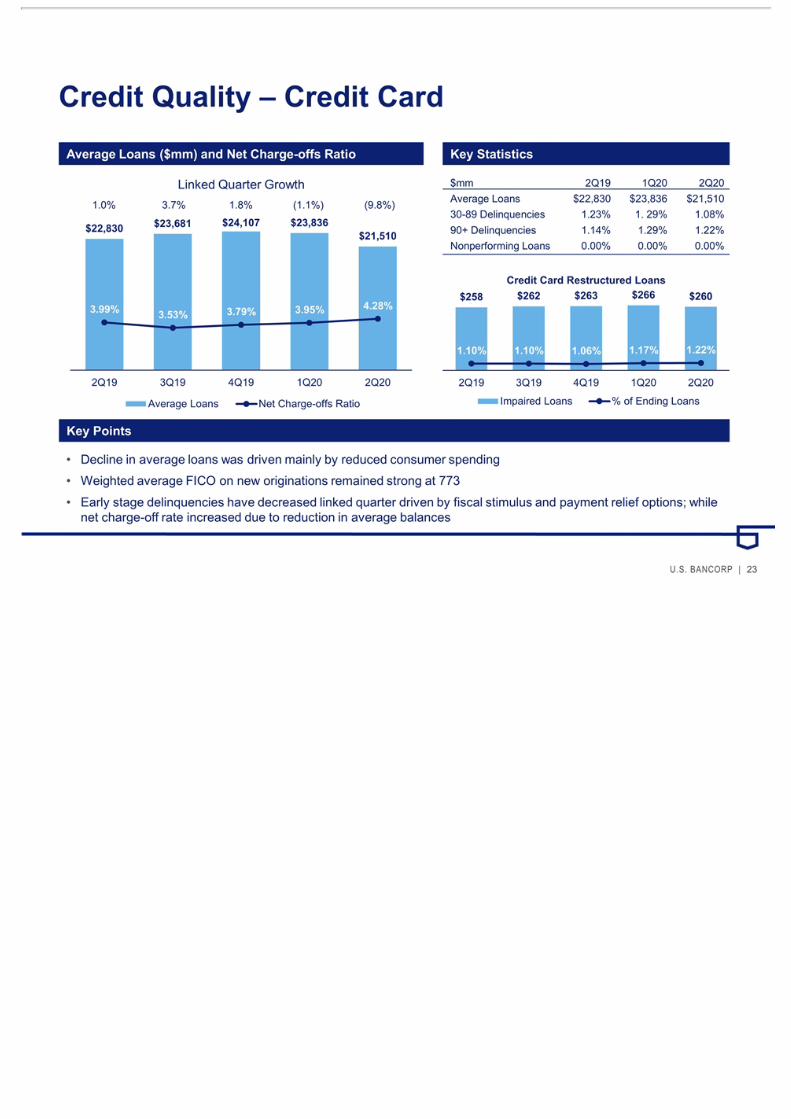
Credit Quality – Credit Card Average Loans ($mm) and Net Charge-offs Ratio Key Statistics Key Points $mm2Q191Q202Q20 Average Loans$22,830 $23,836 $21,510 30-89 Delinquencies1.23%1. 29%1.08% 90+ Delinquencies1.14%1.29%1.22% Nonperforming Loans0.00%0.00%0.00% Linked Quarter Growth 1.0% 3.7% 1.8% (1.1%) (9.8%) Decline in average loans was driven mainly by reduced consumer spending Weighted average FICO on new originations remained strong at 773 Early stage delinquencies have decreased linked quarter driven by fiscal stimulus and payment relief options; while net charge-off rate increased due to reduction in average balances

Credit Quality – Home Equity Average Loans ($mm) and Net Charge-offs Ratio Key Points Linked Quarter Growth (1.0%) (1.5%) (2.4%) (2.5%) (3.0%) Key Statistics Key Statistics $mm2Q191Q202Q20 Average Loans$15,831 $14,838 $14,386 30-89 Delinquencies0.51%0.53%0.46% 90+ Delinquencies0.34%0.30%0.37% Nonperforming Loans0.75%0.75%0.79% Loans: 10% Wtd Avg LTV*: 76% Wtd Avg FICO*: 751 Lines: 90% Wtd Avg LTV*: 70% Wtd Avg FICO*: 755 *LTV and FICO at origination High-quality originations (weighted average FICO on commitments of 791, weighted average CLTV of 65%) were originated primarily through the retail branch network to existing bank customers on their primary residences Net charge-offs remained relatively stable on a linked quarter basis
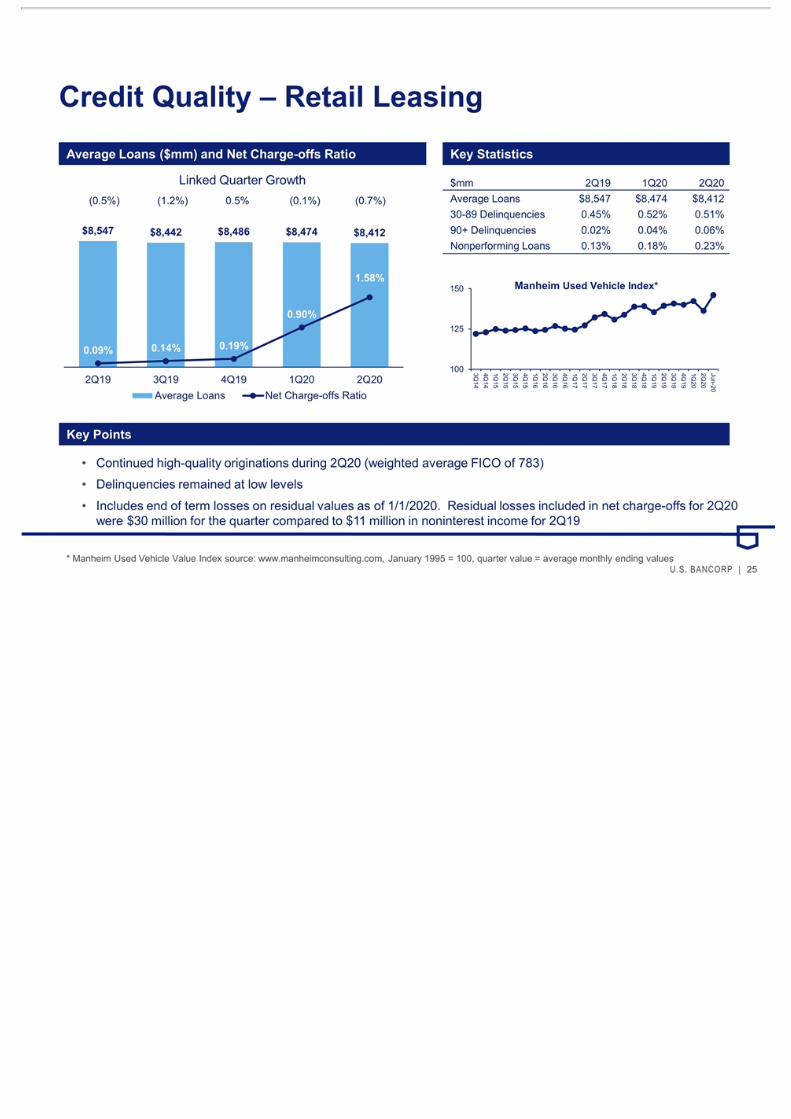
Credit Quality – Retail Leasing Average Loans ($mm) and Net Charge-offs Ratio Key Statistics Key Points $mm2Q191Q202Q20 Average Loans$8,547 $8,474 $8,412 30-89 Delinquencies0.45%0.52%0.51% 90+ Delinquencies0.02%0.04%0.06% Nonperforming Loans0.13%0.18%0.23% * Manheim Used Vehicle Value Index source: www.manheimconsulting.com, January 1995 = 100, quarter value = average monthly ending values Linked Quarter Growth (0.5%) (1.2%) 0.5% (0.1%) (0.7%) Continued high-quality originations during 2Q20 (weighted average FICO of 783) Delinquencies remained at low levels Includes end of term losses on residual values as of 1/1/2020. Residual losses included in net charge-offs for 2Q20 were $30 million for the quarter compared to $11 million in noninterest income for 2Q19
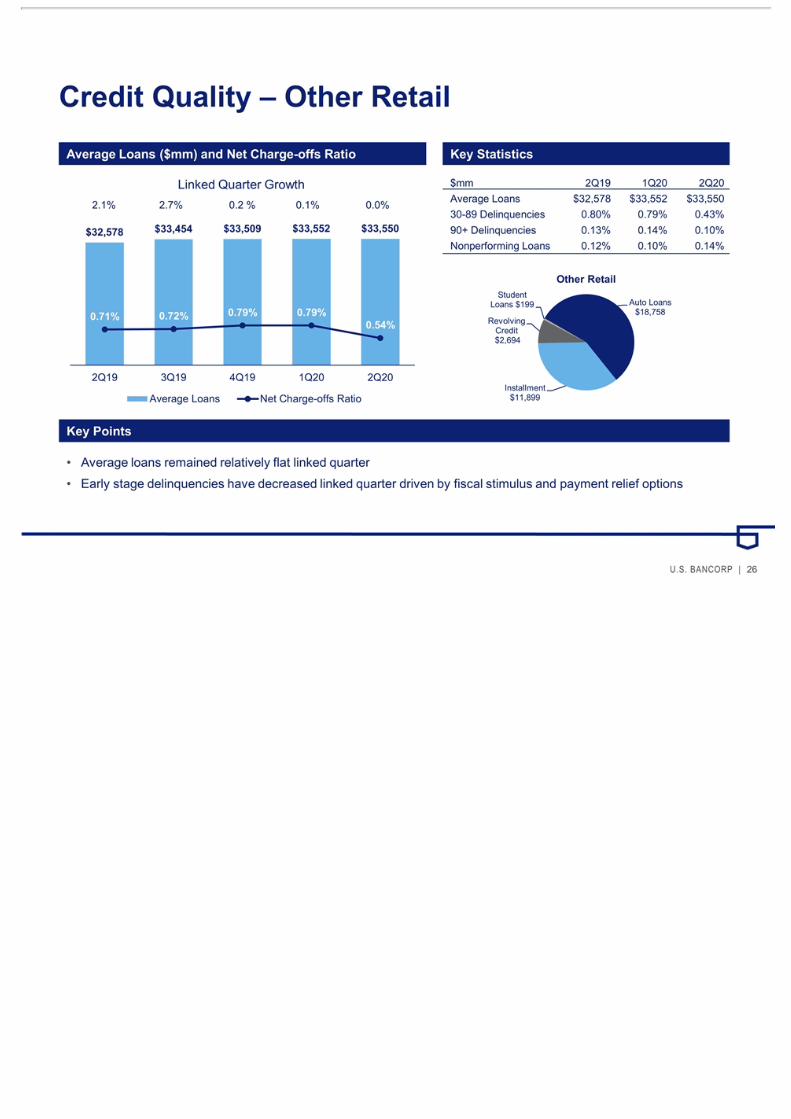
Credit Quality – Other Retail Average Loans ($mm) and Net Charge-offs Ratio Key Statistics Key Points $mm2Q191Q202Q20 Average Loans$32,578 $33,552 $33,550 30-89 Delinquencies0.80%0.79%0.43% 90+ Delinquencies0.13%0.14%0.10% Nonperforming Loans0.12%0.10%0.14% Linked Quarter Growth 2.1% 2.7% 0.2 % 0.1% 0.0% Average loans remained relatively flat linked quarter Early stage delinquencies have decreased linked quarter driven by fiscal stimulus and payment relief options
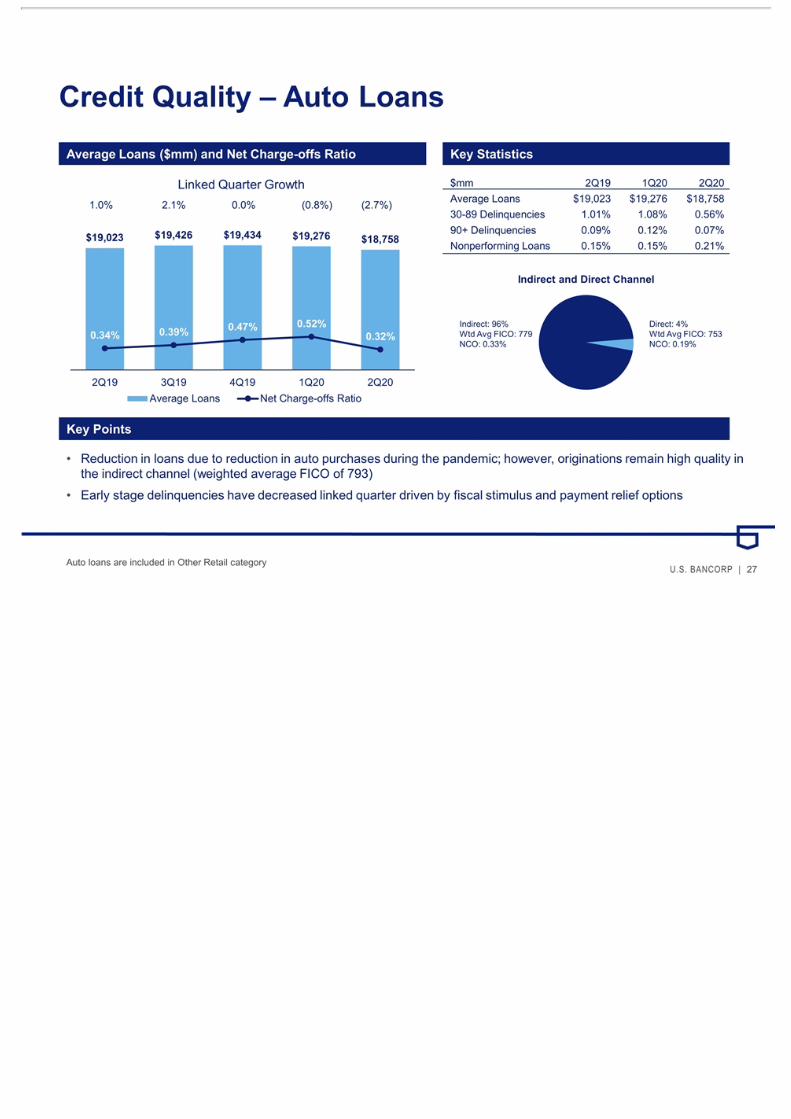
Credit Quality – Auto Loans Average Loans ($mm) and Net Charge-offs Ratio Key Statistics Key Points $mm2Q191Q202Q20 Average Loans$19,023 $19,276 $18,758 30-89 Delinquencies1.01%1.08%0.56% 90+ Delinquencies0.09%0.12%0.07% Nonperforming Loans0.15%0.15%0.21% Direct: 4% Wtd Avg FICO: 753 NCO: 0.19% Indirect: 96% Wtd Avg FICO: 779 NCO: 0.33% Auto loans are included in Other Retail category Linked Quarter Growth 1.0% 2.1% 0.0% (0.8%) (2.7%) Reduction in loans due to reduction in auto purchases during the pandemic; however, originations remain high quality in the indirect channel (weighted average FICO of 793) Early stage delinquencies have decreased linked quarter driven by fiscal stimulus and payment relief options
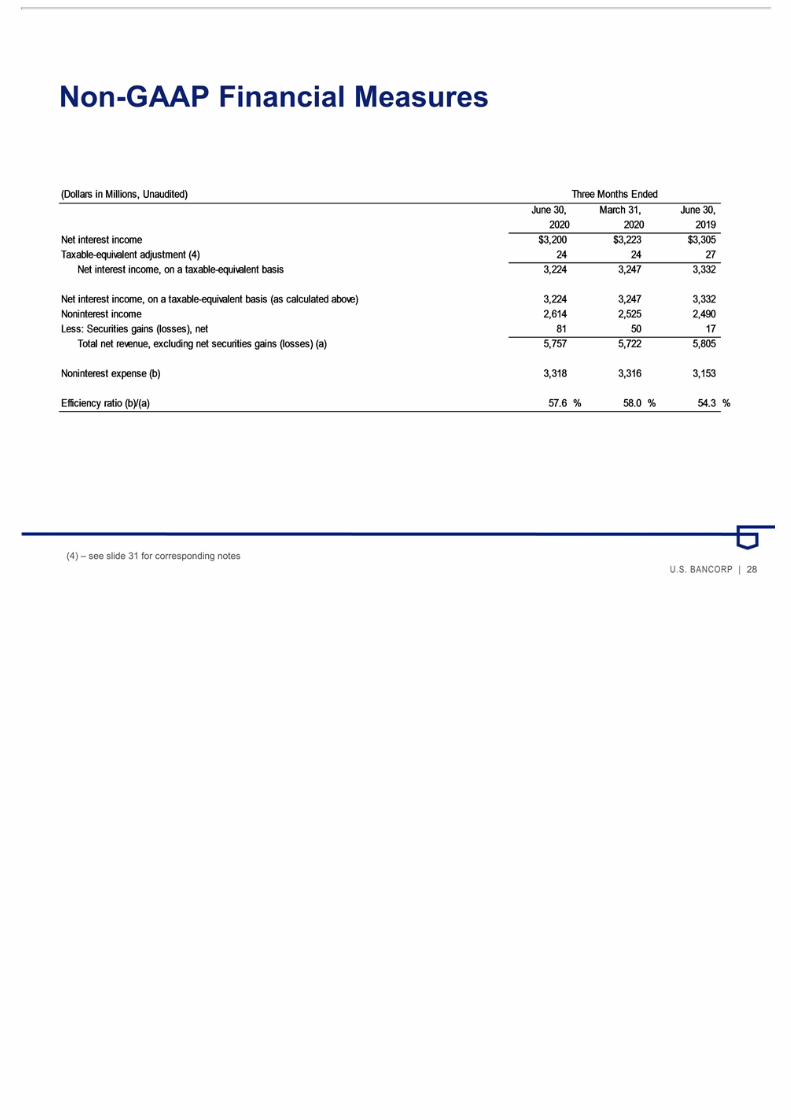
Non-GAAP Financial Measures (4) – see slide 31 for corresponding notes
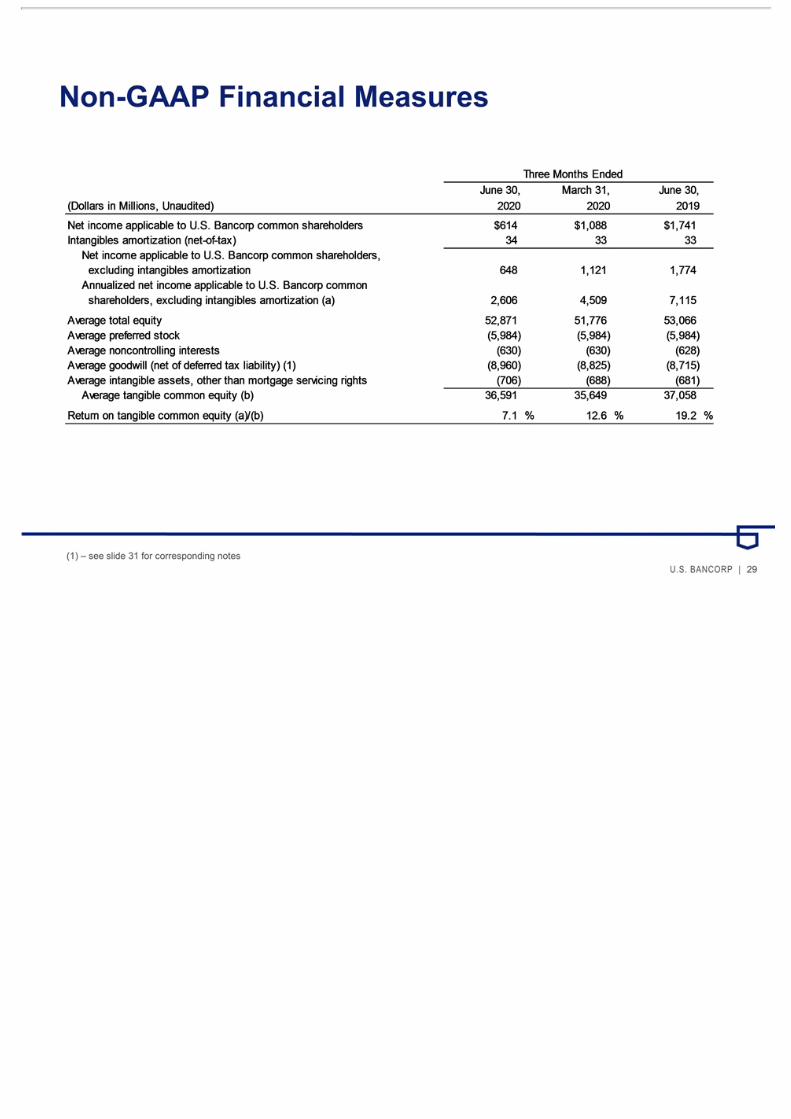
Non-GAAP Financial Measures (1) – see slide 31 for corresponding notes
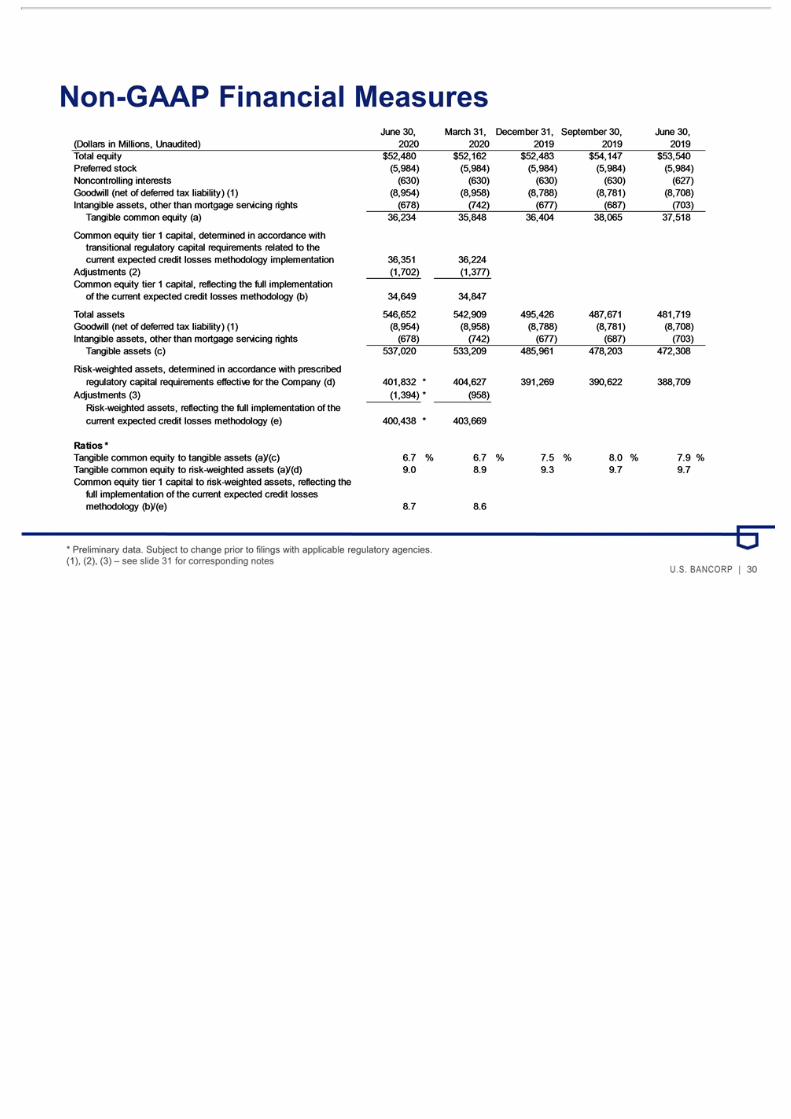
Non-GAAP Financial Measures * Preliminary data. Subject to change prior to filings with applicable regulatory agencies. (1), (2), (3) – see slide 31 for corresponding notes

Notes Includes goodwill related to certain investments in unconsolidated financial institutions per prescribed regulatory requirements. Includes the estimated increase in the allowance for credit losses related to the adoption of the current expected credit losses methodology net of deferred taxes. Includes the impact of the estimated increase in the allowance for credit losses related to the adoption of the current expected credit losses methodology. Based on a federal income tax rate of 21 percent for those assets and liabilities whose income or expense is not included for federal income tax purposes.
U.S. Bancorp 2Q20 Earnings Conference Call July 15, 2020