itc's methodologies in market analysis - world...
TRANSCRIPT

ITC's methodologies in market analysis:
How to identify a country’s strengths & weaknesses and export opportunities of sectors, products and
markets?
Thierry Paulmier ([email protected])
Market Analysis and Research Section (MAR)
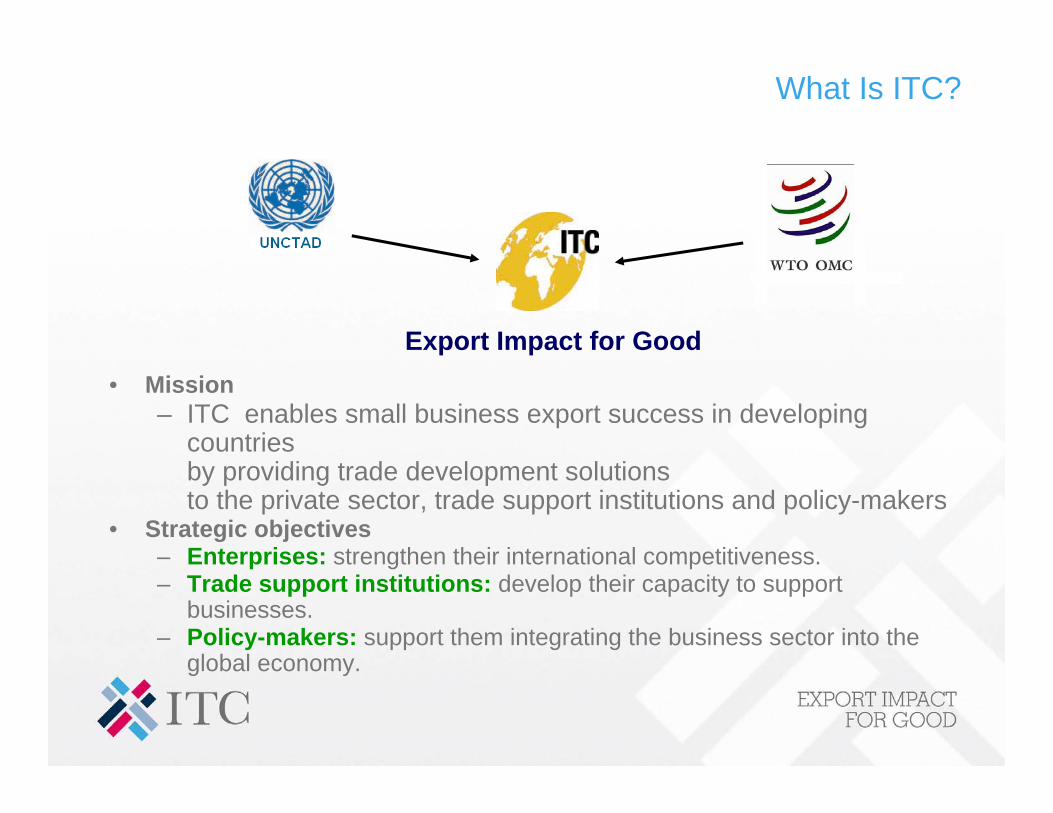
What Is ITC?
• Mission– ITC enables small business export success in developing
countriesby providing trade development solutionsto the private sector, trade support institutions and policy-makers
• Strategic objectives– Enterprises: strengthen their international competitiveness.– Trade support institutions: develop their capacity to support
businesses.– Policy-makers: support them integrating the business sector into the
global economy.
Export Impact for Good

ITC Activities
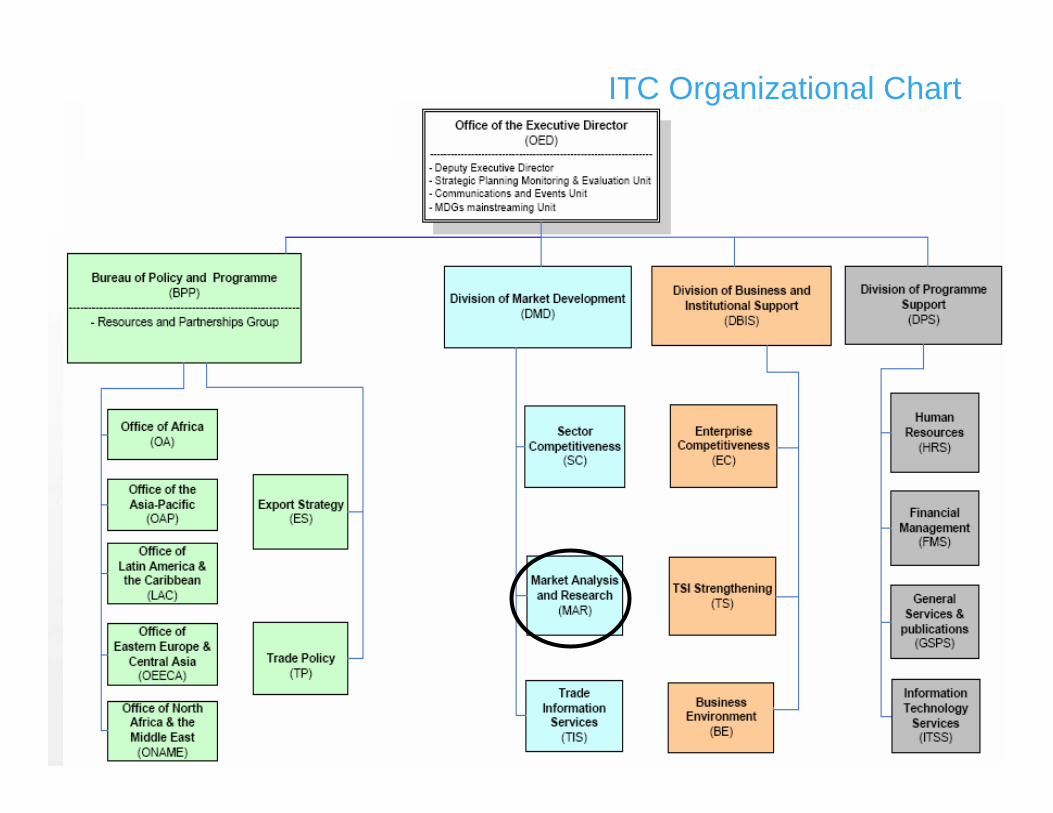
ITC Organizational Chart

TradeMap
Market Access Map
Investment Map
Trade CompetitivenessProfiles
Product Map (TIS/MAS)
Customised tools
Tools
Trade CompetitivenessAssessment
Export PotentialAssessment (EPA)
Export opportunityScan
Market News Serviceand Market Briefs
Customised studies
Studies
Introduction toMarket Analysis
Market Access CapacityBuilding
Mentoring forEPA
Preparation ofMarket Profiles
Customised training
Capacity Building
MAR Products and Services

Product and Market Concentration in Africa
Nigeria
South Africa
Angola Congo Equatorial Guinea
Côte d'Ivoire
GabonBotswana
Zambia
GhanaCameroon
Namibia
Kenya
Chad
Mozambique
Mauritius
Zimbabwe
United Republic of Tanzania
Liberia
Senegal
DR Congo Ethiopia
Guinea
Madagascar
Uganda
Swaziland
Malawi
Lesotho
Mali
Seychelles
Niger
Togo
Benin
Burkina Faso
Sierra Leone
Central African Republic
Cape Verde
Rwanda
Guinea-Bissau
Burundi
Comoros
Eritrea
Saint Helena
Gambia
Mayotte
Sao Tome and Principe
Western Sahara
0
10
20
30
40
50
60
70
80
90
100020406080100
Share of top three export markets (%), 2006
Shar
e of
top
thre
e ex
porte
d pr
oduc
ts (%
), 20
06
Source: ITC TradeMap. The size of the bubbles is proportional to total country exports in 2006.
High product concentrationLow market concentration
Low product and market concentration
High product and market concentration
Low product concentrationHigh market concentration
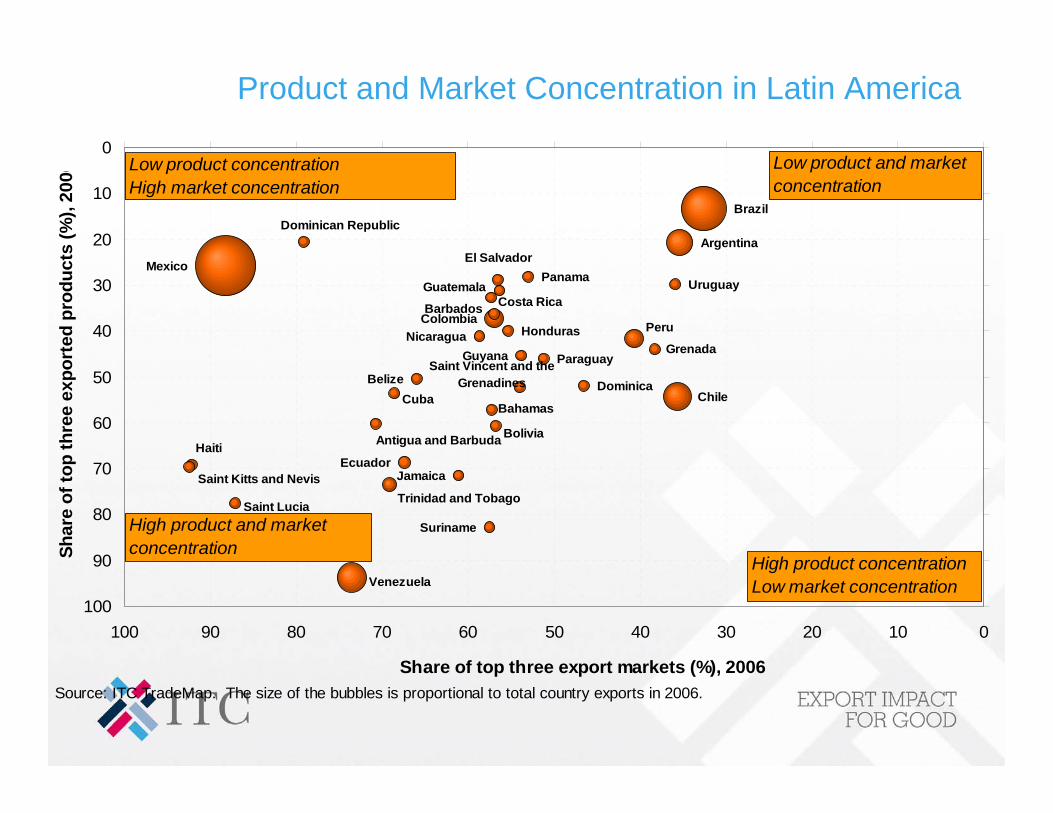
Product and Market Concentration in Latin America
GrenadaSaint Vincent and the
Grenadines
Saint Kitts and Nevis
Dominica
Antigua and Barbuda
Saint Lucia
Belize
Barbados
Guyana
Haiti
Nicaragua
Panama
Suriname
Honduras
El Salvador
Paraguay
Jamaica
BahamasCuba
Guatemala Uruguay
Bolivia
Dominican Republic
Costa Rica
Ecuador
Trinidad and Tobago
PeruColombia
Argentina
Chile
Venezuela
Brazil
Mexico
0
10
20
30
40
50
60
70
80
90
1000102030405060708090100
Share of top three export markets (%), 2006
Shar
e of
top
thre
e ex
port
ed p
rodu
cts
(%),
2006
Source: ITC TradeMap. The size of the bubbles is proportional to total country exports in 2006.
High product concentrationLow market concentration
Low product and market concentration
High product and market concentration
Low product concentrationHigh market concentration

Product and Market Concentration in Asia
Tuvalu
NauruKiribati
Tonga
Timor-Leste
Micronesia
Palau
Samoa
MaldivesBhutan
Afghanistan
Vanuatu
Solomon Islands
Nepal
Fiji
Marshall Islands
Lao PDRMongolia
DPR of KoreaMacau
Cambodia
Papua New Guinea
Myanmar
Sri Lanka
Brunei Darussalam
Bangladesh
Pakistan
Viet NamPhilippines
Iran
IndonesiaIndia
Thailand
Malaysia
Singapore
Hong Kong (SARC)
Republic of Korea
China
0
10
20
30
40
50
60
70
80
90
100020406080100
Share of top three export markets (%), 2006
Shar
e of
top
thre
e ex
port
ed p
rodu
cts
(%),
2006
Source: ITC TradeMap. The size of the bubbles is proportional to total country exports in 2006.
High product concentrationLow market concentration
Low product and market concentration
High product and market concentration
Low product concentrationHigh market concentration

?
In the area of trade or investment strategy,the business community, trade supporting institutions and
policy makers need to know…
• What are my country’s strengths and weaknesses,overall or for a particular sector?
• What are promising industries or productsfor export development?
• What are attractive markets?
• What are my competitors?
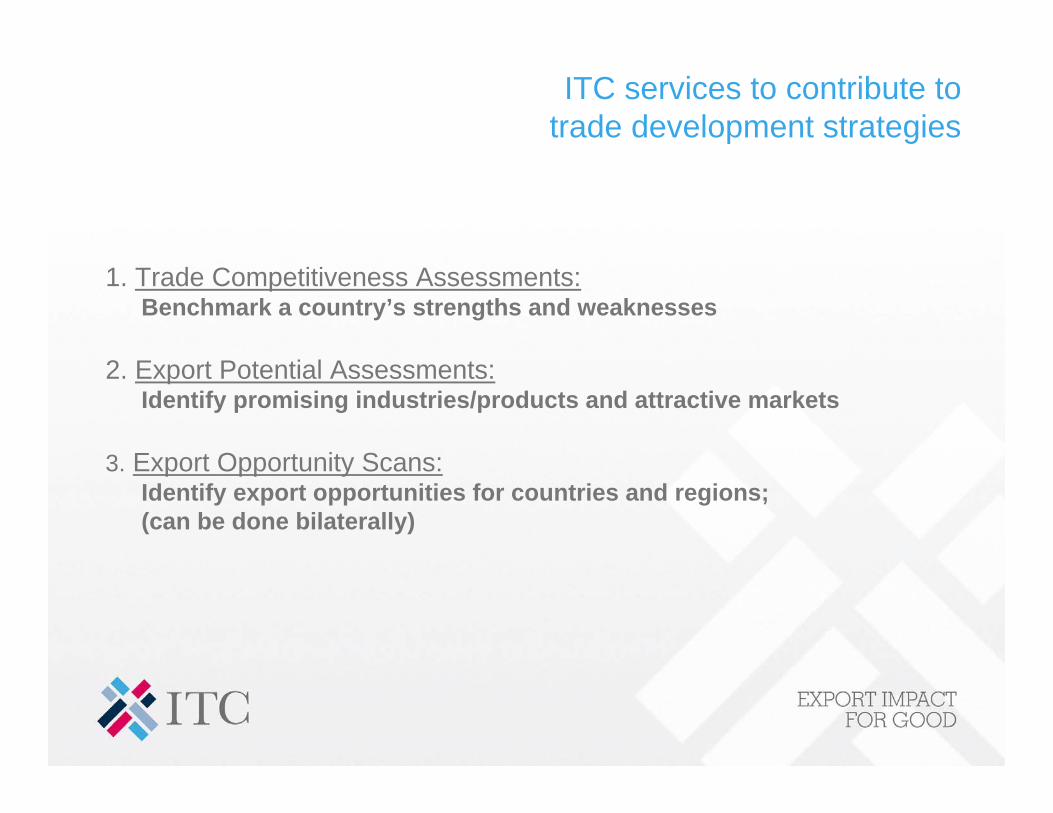
ITC services to contribute totrade development strategies
1. Trade Competitiveness Assessments:Benchmark a country’s strengths and weaknesses
2. Export Potential Assessments:Identify promising industries/products and attractive markets
3. Export Opportunity Scans:Identify export opportunities for countries and regions;(can be done bilaterally)
1.Trade Competitiveness Assessments:Benchmark a country’s strengths and weaknesses
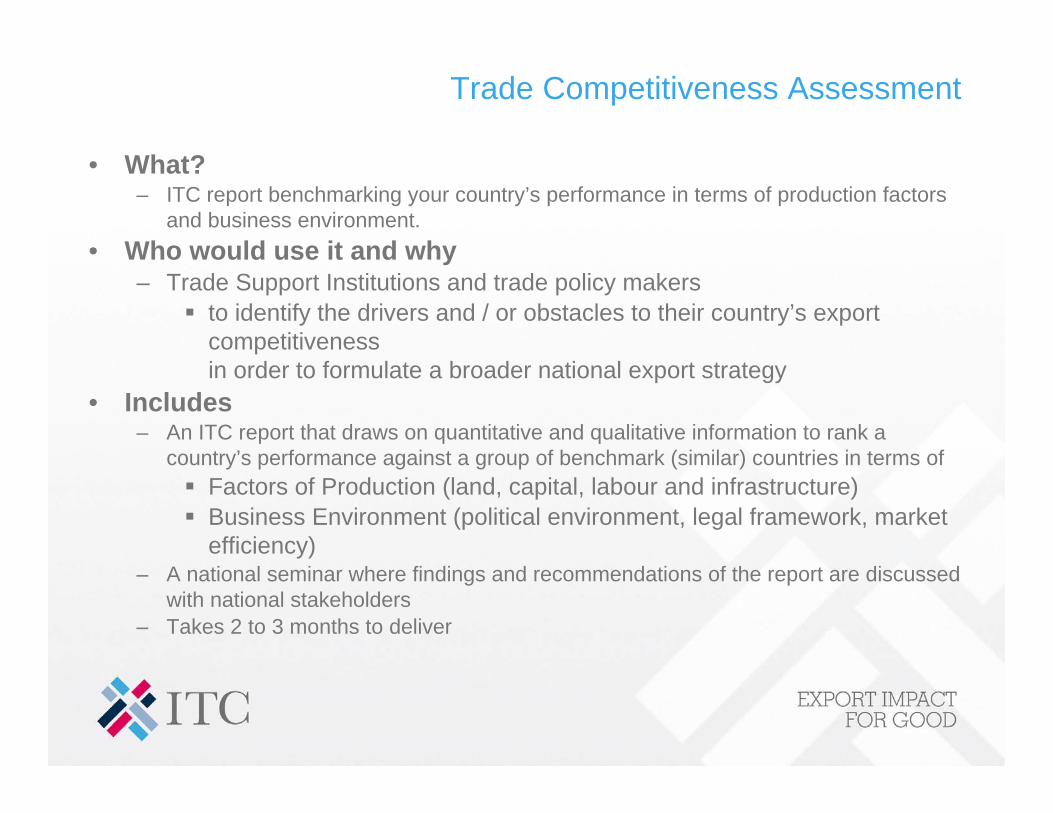
Trade Competitiveness Assessment
• What?– ITC report benchmarking your country’s performance in terms of production factors
and business environment.• Who would use it and why
– Trade Support Institutions and trade policy makers to identify the drivers and / or obstacles to their country’s export competitivenessin order to formulate a broader national export strategy
• Includes– An ITC report that draws on quantitative and qualitative information to rank a
country’s performance against a group of benchmark (similar) countries in terms of Factors of Production (land, capital, labour and infrastructure)Business Environment (political environment, legal framework, market efficiency)
– A national seminar where findings and recommendations of the report are discussed with national stakeholders
– Takes 2 to 3 months to deliver

How to identify potential benchmarking countries:Example Export structure for Pakistan (1)
Bangladesh (13.6)Viet Nam (10.7)10
United States (14.5)Indonesia (11.0)9
France (15.2)Cambodia (12.0)8
Germany (15.5)Sri Lanka (12.2)7
Thailand (16.4)Macau (12.6)6
Turkey (18.0)Turkmenistan (12.8)5
Italy (21.0)Turkey (14.4)4
Hong Kong (SARC) (22.4)Bangladesh (15.0)3
India (31.8)Egypt (15.1)2
China (41.0)India (19.8)1
Main competitorsin same products and markets
(Minimum of exports in value of each product and market as a % of
Pakistan’s total exports)
Countries withmost similar export structure
(Minimum of share in exports of each product and market as a % of
Pakistan’s total exports )
Rank
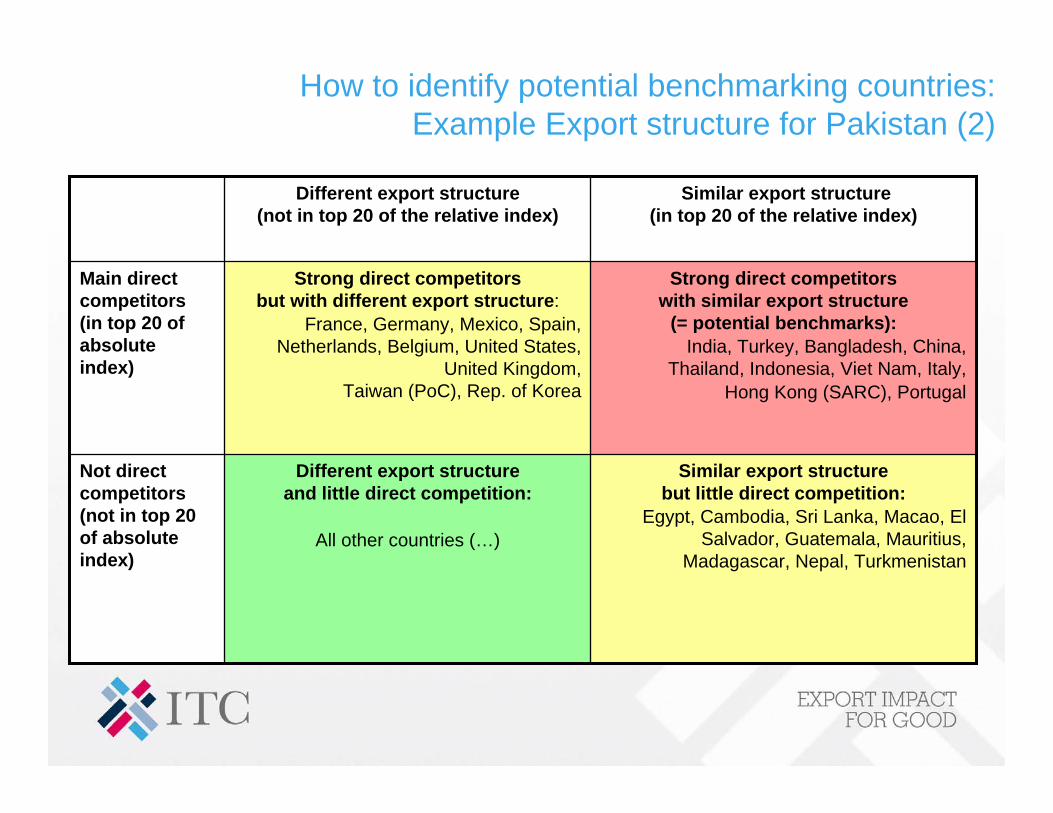
Similar export structurebut little direct competition:
Egypt, Cambodia, Sri Lanka, Macao, El Salvador, Guatemala, Mauritius,
Madagascar, Nepal, Turkmenistan
Different export structureand little direct competition:
All other countries (…)
Not direct competitors(not in top 20 of absolute index)
Strong direct competitors with similar export structure
(= potential benchmarks):India, Turkey, Bangladesh, China,
Thailand, Indonesia, Viet Nam, Italy, Hong Kong (SARC), Portugal
Strong direct competitorsbut with different export structure:
France, Germany, Mexico, Spain, Netherlands, Belgium, United States,
United Kingdom,Taiwan (PoC), Rep. of Korea
Main direct competitors(in top 20 of absolute index)
Similar export structure(in top 20 of the relative index)
Different export structure(not in top 20 of the relative index)
How to identify potential benchmarking countries:Example Export structure for Pakistan (2)

Jordan’s benchmarking countries: Export Similarity Index (ESI)
8214030Morocco
35175522Egypt
15195025Tunisia
14202939UAE
9217211Lebanon
5221255Turkey
Rank ESI (absolute)
ESI (absolute)Rank ESI (relative)
ESI (relative) Country
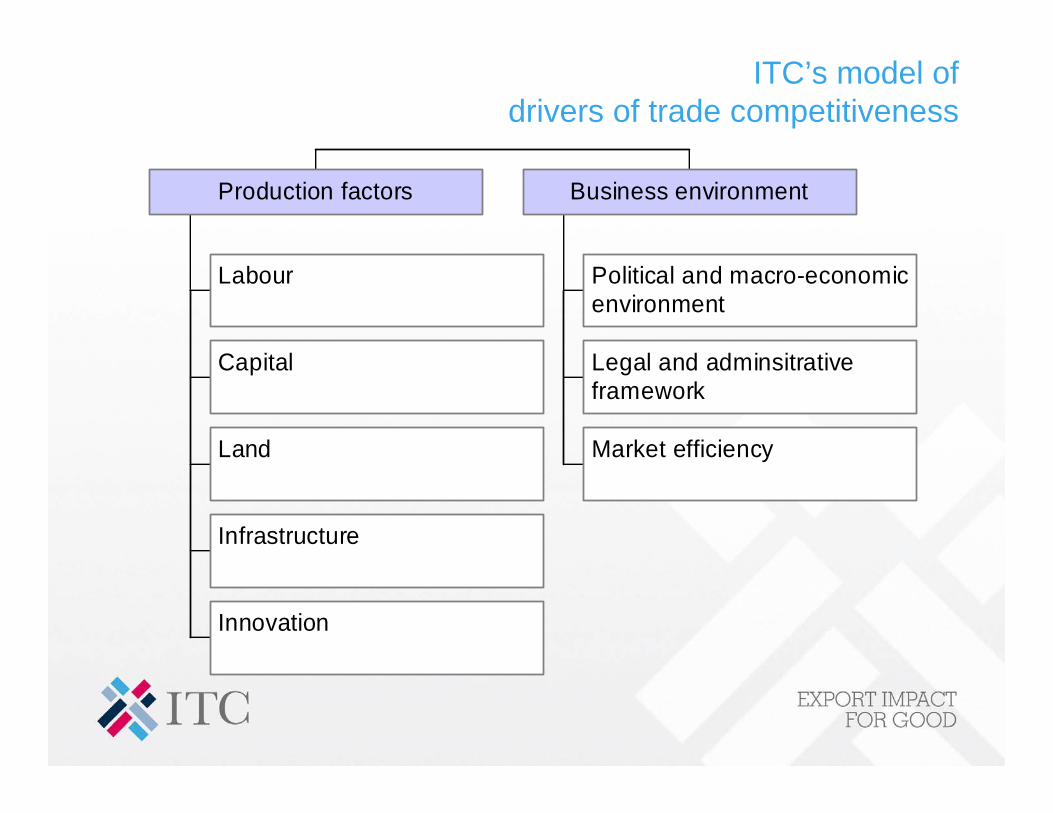
ITC’s model ofdrivers of trade competitiveness
Labour
Capital
Land
Infrastructure
Innovation
Production factors
Political and macro-economicenvironment
Legal and adminsitrativeframework
Market efficiency
Business environment

Production Factors
Labour supply
Healthinputs
Healthperformance
Educationinputs
EducationPerformance
Labour
Savings/investment
Bankingfinancing
Bondmarkets
Foreigndirectinvestment
Capital
Availability
Technology
Land
Availability
Cost
Quality
Infrastructure
R&D Expenditure
Technology Transfer
Public Sector Links
Technological Change(R&D)
Production Factors
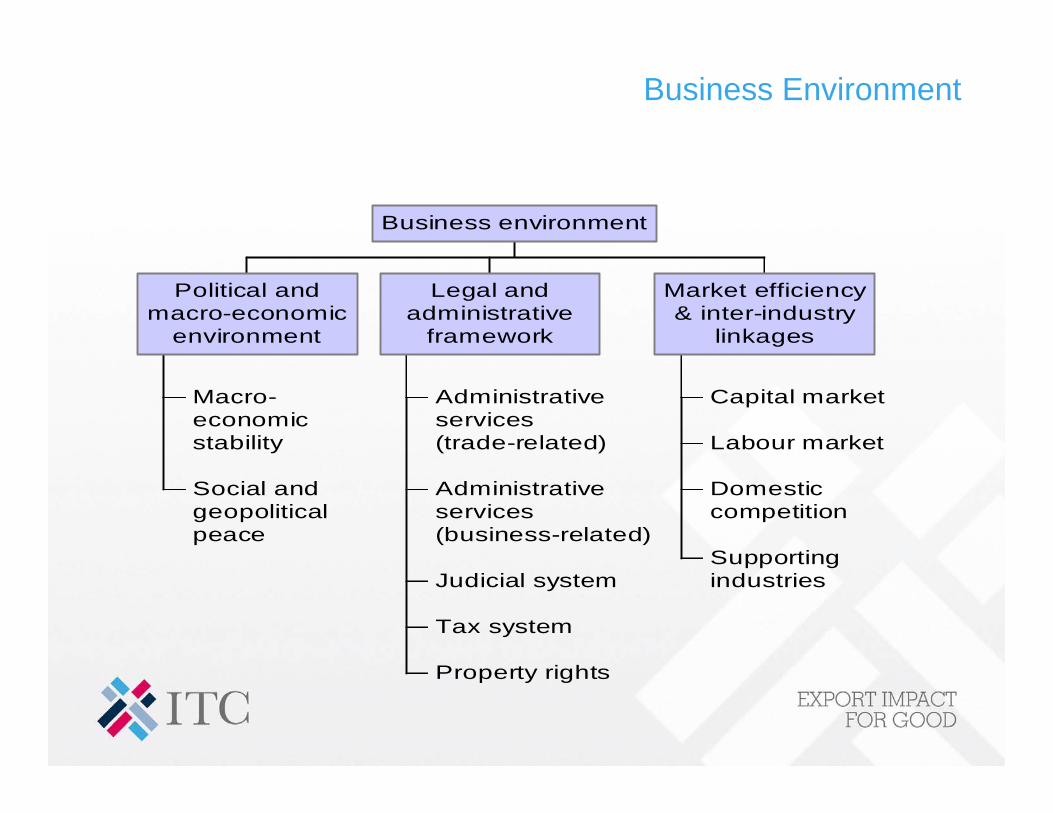
Business Environment
Macro-economicstability
Social andgeopoliticalpeace
Political andmacro-economic
environment
Administrativeservices(trade-related)
Administrativeservices(business-related)
Judicial system
Tax system
Property rights
Legal andadministrative
framework
Capital market
Labour market
Domesticcompetition
Supportingindustries
Market efficiency& inter-industry
linkages
Business environment
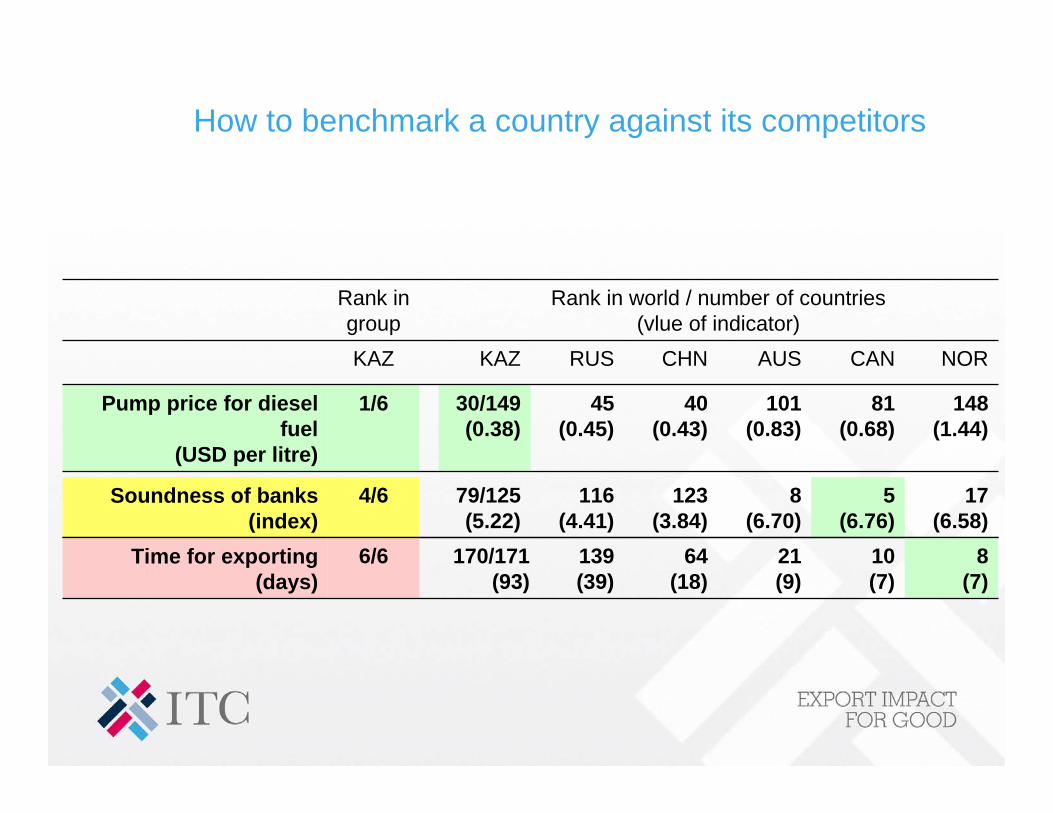
How to benchmark a country against its competitors
148(1.44)
81(0.68)
101(0.83)
40(0.43)
45(0.45)
30/149(0.38)
1/6Pump price for diesel fuel
(USD per litre)
Rank in world / number of countries(vlue of indicator)
Rank in groupKAZ KAZ RUS CHN AUS CAN NOR
17(6.58)
5(6.76)
8(6.70)
123(3.84)
116(4.41)
79/125(5.22)
4/6Soundness of banks(index)
8(7)
10(7)
21(9)
64(18)
139(39)
170/171(93)
6/6Time for exporting(days)
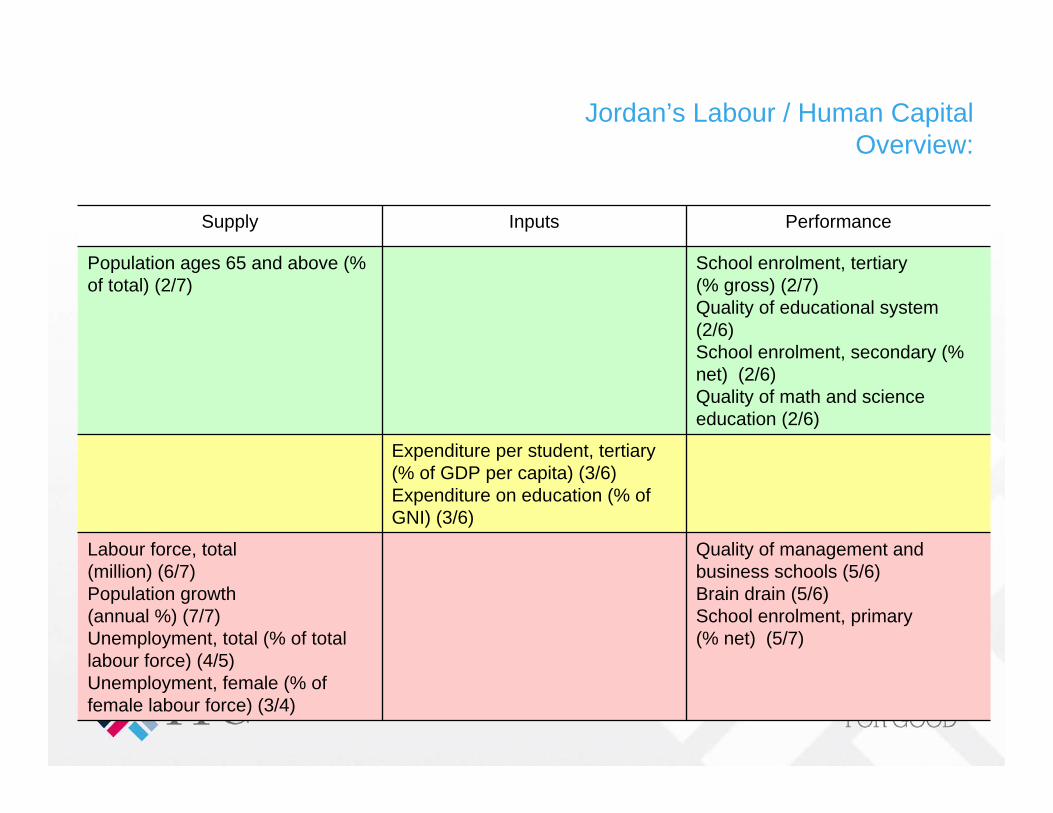
Jordan’s Labour / Human CapitalOverview:
Supply Inputs Performance
Population ages 65 and above (% of total) (2/7)
School enrolment, tertiary(% gross) (2/7)Quality of educational system (2/6)School enrolment, secondary (% net) (2/6)Quality of math and science education (2/6)
Expenditure per student, tertiary (% of GDP per capita) (3/6)Expenditure on education (% of GNI) (3/6)
Labour force, total (million) (6/7)Population growth(annual %) (7/7)Unemployment, total (% of total labour force) (4/5)Unemployment, female (% of female labour force) (3/4)
Quality of management and business schools (5/6)Brain drain (5/6)School enrolment, primary(% net) (5/7)
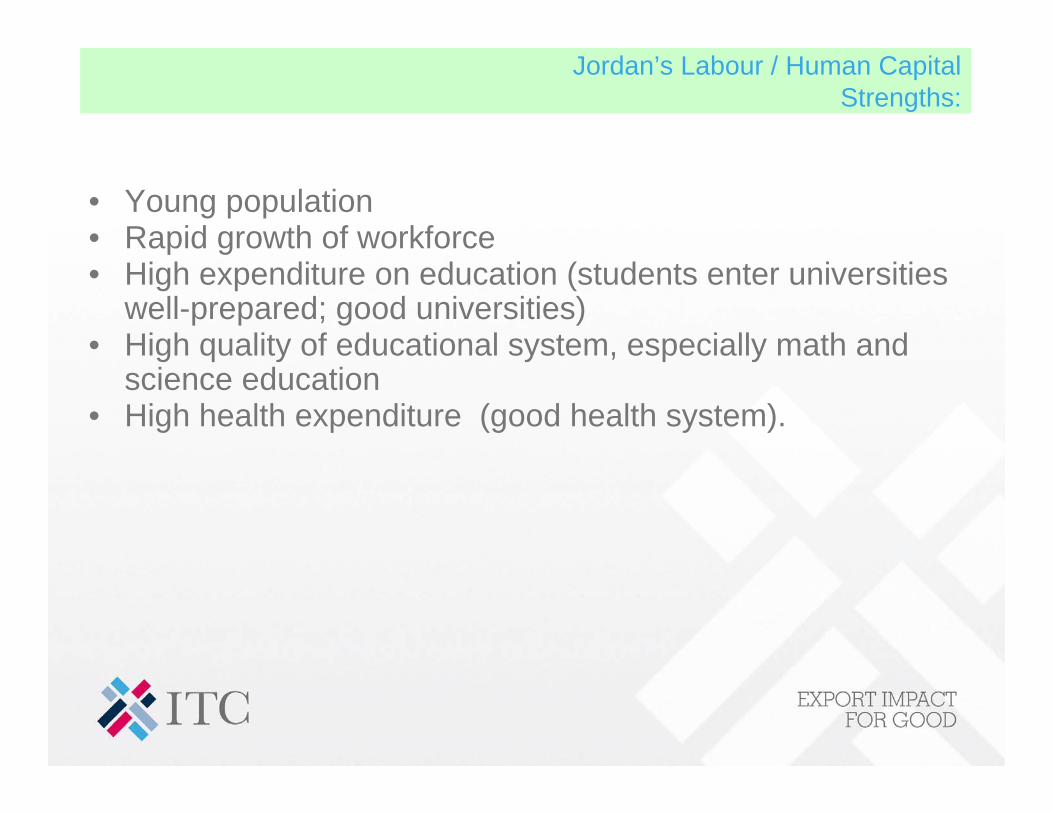
Jordan’s Labour / Human CapitalStrengths:
• Young population• Rapid growth of workforce• High expenditure on education (students enter universities
well-prepared; good universities)• High quality of educational system, especially math and
science education• High health expenditure (good health system).

Jordan’s Labour / Human CapitalWeaknesses:
• High dependency ratio
• High unemployment affecting highly-qualified people and more women than men
• Brain drain of high skilled people
• Quality of management and business schools

Jordan’s Labour / Human CapitalChallenges:
• Improve the infant mortality rate• Improve quality of management and business schools• Relatively high unit labour cost (Increasing wages –
outpacing productivity growth)
• Create jobs: an annual need of approx. 60,000 new jobs, especially high skilled jobs.
• Create female jobs, especially in the private sector• Strengthen link between university and private sector to
better meet its needs
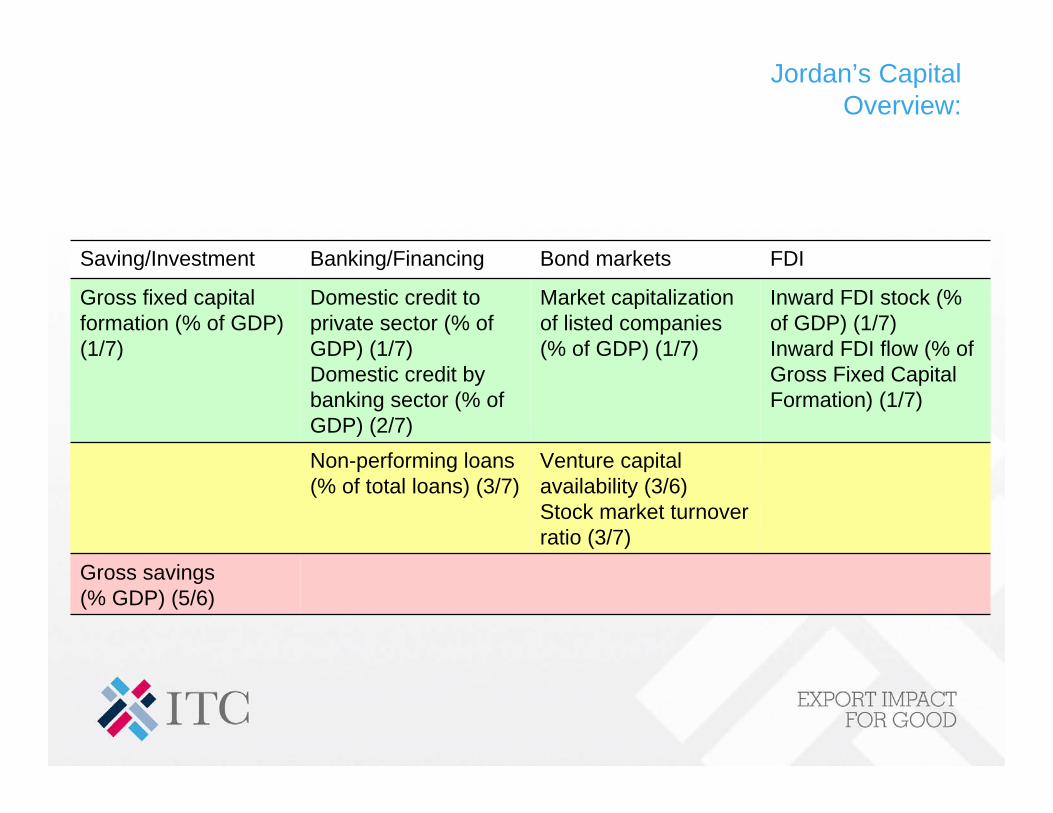
Jordan’s CapitalOverview:
Saving/Investment Banking/Financing Bond markets FDI
Gross fixed capital formation (% of GDP)(1/7)
Domestic credit to private sector (% of GDP) (1/7)Domestic credit by banking sector (% of GDP) (2/7)
Market capitalization of listed companies (% of GDP) (1/7)
Inward FDI stock (% of GDP) (1/7)Inward FDI flow (% of Gross Fixed Capital Formation) (1/7)
Non-performing loans (% of total loans) (3/7)
Venture capital availability (3/6)Stock market turnover ratio (3/7)
Gross savings(% GDP) (5/6)

Jordan’s CapitalStrengths:
• Strong investment (continued high FDI inflows)• Functioning Amman Stock Exchange (high market
capitalisation)• High foreign ownership of market capital at Amman Stock
Exchange• Healthy banking sector• Strong increases in provision of domestic credit• Low rate of non-performing loans and strongly decreasing

Jordan’s CapitalWeaknesses:
• Low gross savings
Jordan’s CapitalChallenges:
• Increase domestic saving rate
• Reduce reliance on foreign capital inflows to fund domestic investments
• Provision of venture capital for start-ups
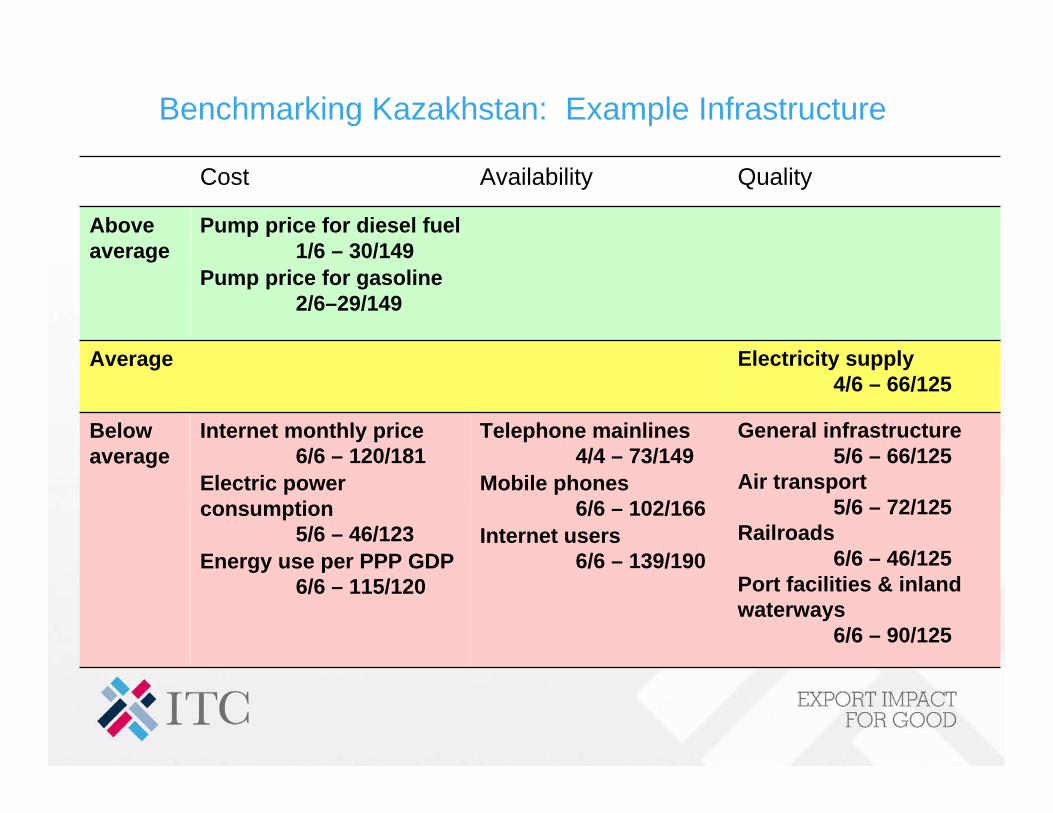
Benchmarking Kazakhstan: Example Infrastructure
General infrastructure5/6 – 66/125
Air transport5/6 – 72/125
Railroads6/6 – 46/125
Port facilities & inland waterways
6/6 – 90/125
Telephone mainlines4/4 – 73/149
Mobile phones6/6 – 102/166
Internet users6/6 – 139/190
Internet monthly price6/6 – 120/181
Electric power consumption
5/6 – 46/123Energy use per PPP GDP
6/6 – 115/120
Below average
Electricity supply4/6 – 66/125
Average
Pump price for diesel fuel1/6 – 30/149
Pump price for gasoline 2/6–29/149
Above average
QualityAvailabilityCost

Kazakhstan’s main strengths
Good shareholder protection
Low costs for contract enforcement
Flexible hiring and firing regulations
Low overall tax level
Relatively balanced population growthand age-structure
High saving rate
High investment rate(gross fixed capital formation)
Availability of land, including irrigated land
Strong performance in attracting foreign direct investment
Business environmentProduction factors

Kazakhstan’s main weaknesses
High corruptionReliability of the policeLimited independency of judiciaryRising inflation (danger of “Dutch-Disease”)Legal and administrative framework (time, cost and number of procedures) inhibits specifically cross-border tradeHigh costs for starting and closing businessesRegistering of property demandingUnsatisfactory intellectual property rights protectionLack of local competitionLimited quantity and quality of local suppliers
Small labour forceLow life expectancyLow spending on health service provisionLow public investment in educationLow quality of educational trainingBrain drainSmall and shallow stock marketLow dissemination of agricultural technologiesLimited dissemination of information and communication technologies (ICT)Very high Internet price, low useLow quality of infrastructure (general, air, railroad, inland waterways)
Business environmentProduction factors

2. Export Potential Assessments Identify promising sectors, products and markets
?
Export Potential Assessment
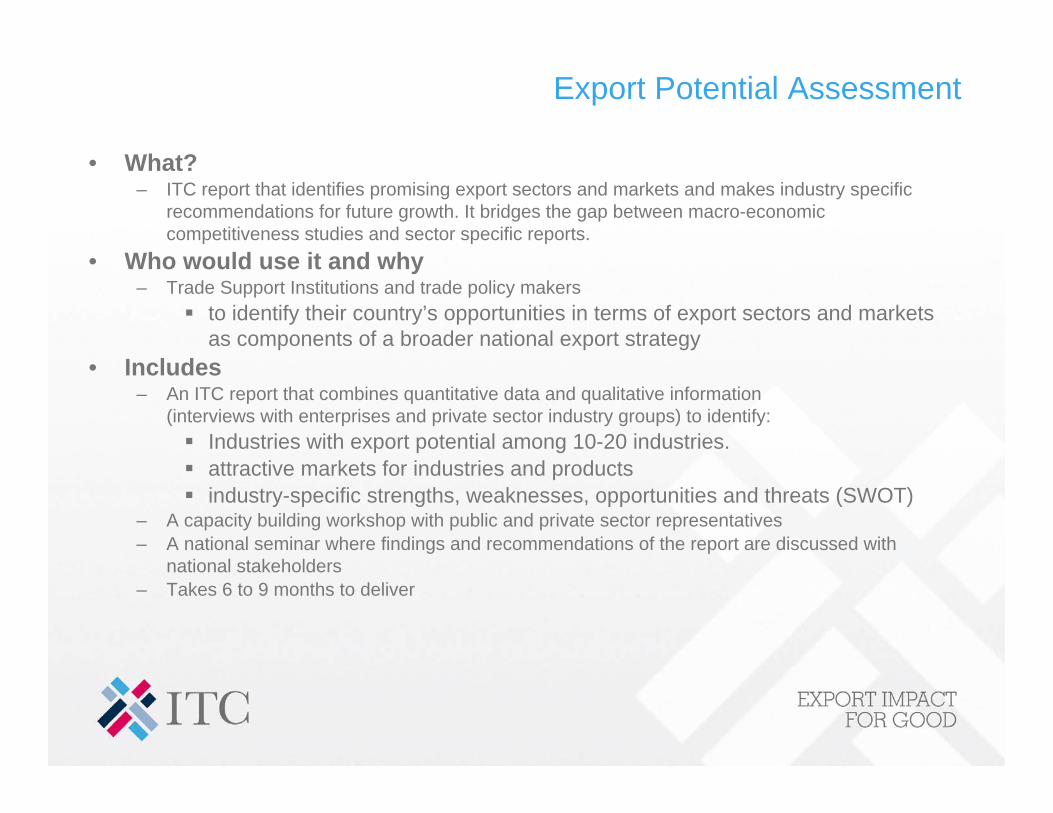
• What?– ITC report that identifies promising export sectors and markets and makes industry specific
recommendations for future growth. It bridges the gap between macro-economic competitiveness studies and sector specific reports.
• Who would use it and why– Trade Support Institutions and trade policy makers
to identify their country’s opportunities in terms of export sectors and marketsas components of a broader national export strategy
• Includes– An ITC report that combines quantitative data and qualitative information
(interviews with enterprises and private sector industry groups) to identify:Industries with export potential among 10-20 industries.attractive markets for industries and productsindustry-specific strengths, weaknesses, opportunities and threats (SWOT)
– A capacity building workshop with public and private sector representatives– A national seminar where findings and recommendations of the report are discussed with
national stakeholders– Takes 6 to 9 months to deliver
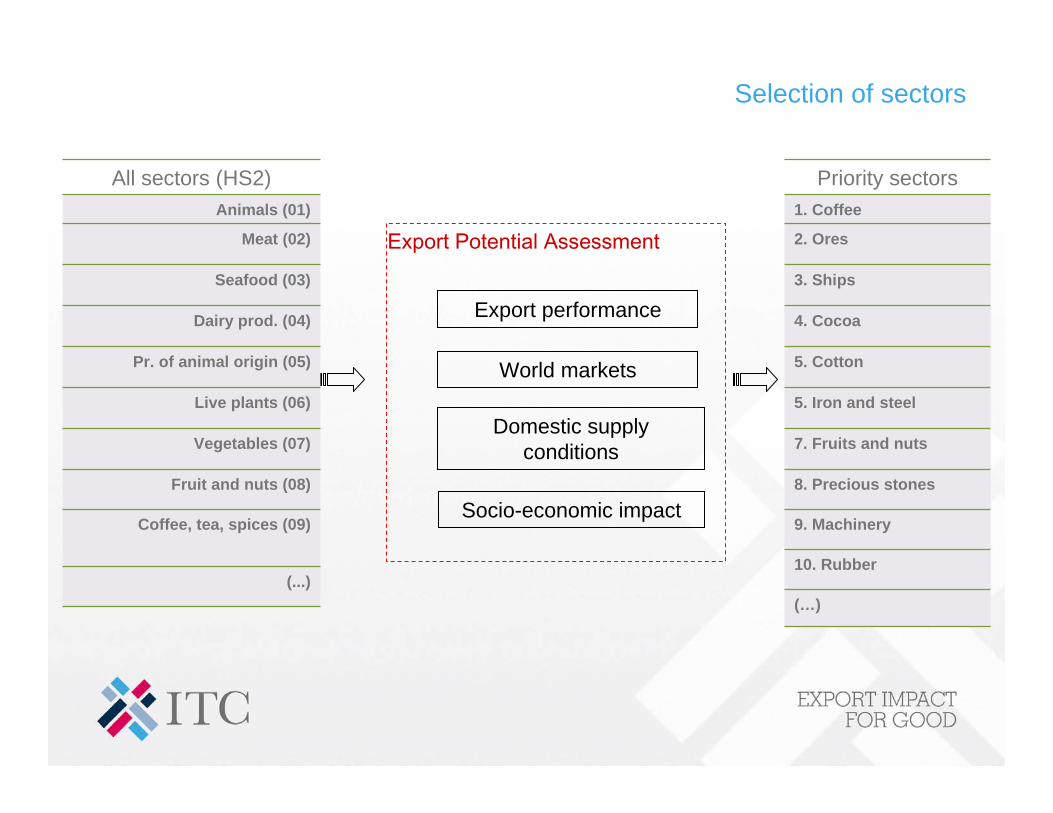
Selection of sectors
Export performance
World markets
Coffee, tea, spices (09)
All sectors (HS2)
Fruit and nuts (08)
Live plants (06)
Pr. of animal origin (05)
Dairy prod. (04)
Seafood (03)
Meat (02)
(...)
Vegetables (07)
Animals (01)
Priority sectors
8. Precious stones
5. Iron and steel
5. Cotton
4. Cocoa
3. Ships
2. Ores
(…)
10. Rubber
9. Machinery
7. Fruits and nuts
1. Coffee
Domestic supply conditions
Socio-economic impact
Export Potential Assessment

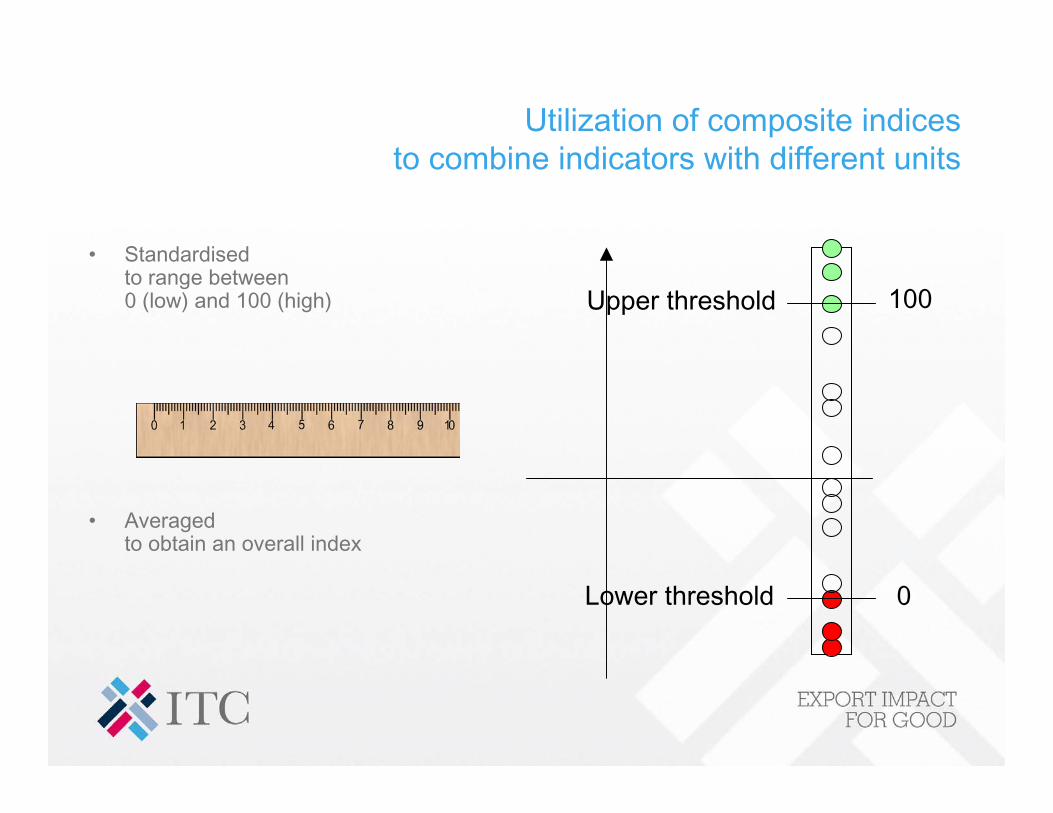
Utilization of composite indicesto combine indicators with different units
• Standardisedto range between0 (low) and 100 (high)
• Averaged to obtain an overall index
Upper threshold
Lower threshold
100
0
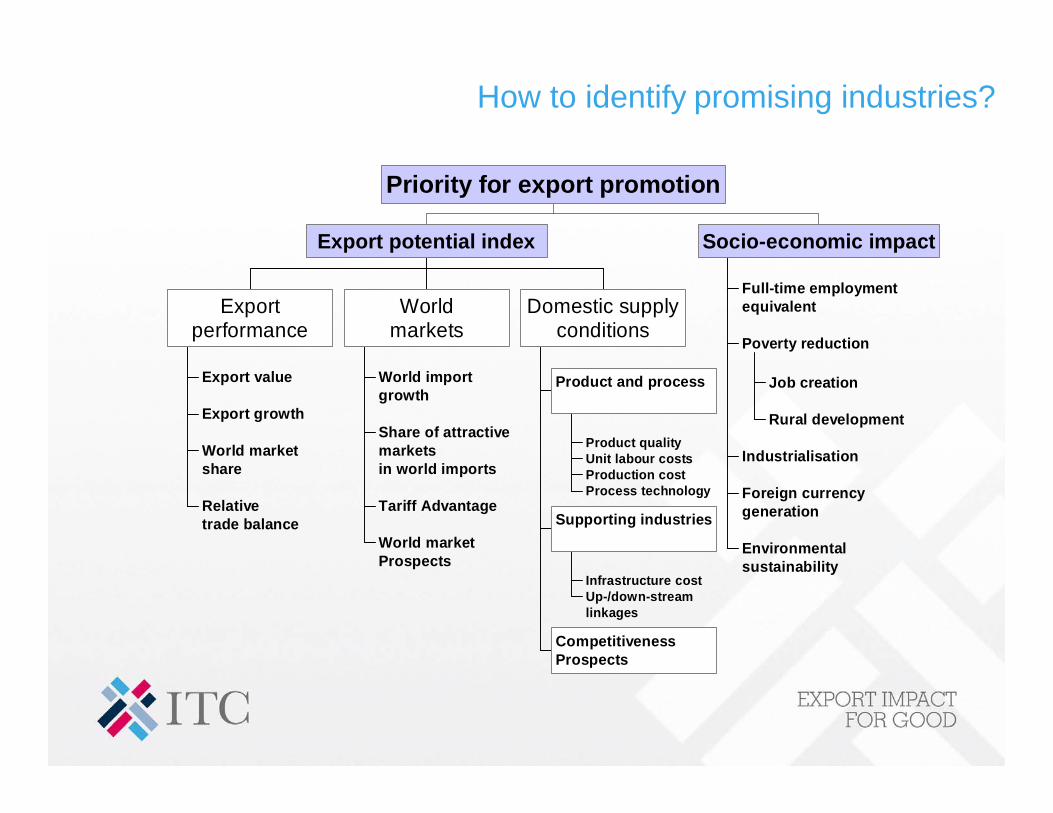
How to identify promising industries?
Export value
Export growth
World marketshare
Relativetrade balance
Exportperformance
World importgrowth
Share of attractivemarketsin world imports
Tariff Advantage
World marketProspects
Worldmarkets
Product qualityUnit labour costsProduction costProcess technology
Product and process
Infrastructure costUp-/down-streamlinkages
Supporting industries
CompetitivenessProspects
Domestic supplyconditions
Export potential index
Full-time employmentequivalent
Job creation
Rural development
Poverty reduction
Industrialisation
Foreign currencygeneration
Environmentalsustainability
Socio-economic impact
Priority for export promotion

Index 1: Nepal’s Export Performance
-10000.00 01.2 (Low)14. Mandarin oranges
4-560.0491.5 (Low)13. Honey
100-60.03502.2 (Low)10. Wooden handicrafts
5630.11,9792.3 (Low)8. Medicinal plants and essential oils
30490.01692.3 (Low)12. Coffee
1340.111,4772.8 (Medium)3. Pulses
82180.07,3932.9 (Medium)4. Gems and jewellery
812690.02112.9 (Medium)11. Cut flowers
99240.05,6972.9 (Medium)5. Leather
63-190.322,1313.1 (Medium)1. Silk and pashmina products
25351.09443.2 (High)9. Hand made paper
87190.82,5183.3 (High)7. Ginger
83830.15,1693.5 (High)6. Tea
90210.511,6944.2 (High)2. Cardamom
Relative trade balance (%)
Export growth (% p.a.)
Share in world export (%)
Exports in value
(USD'000)
Index 1:Export
Performance

Index 1: Cambodia’s Export Performance
1
4*
9
13*
19*
25*
34*
50*
100*
157
200*
2,611
Exports*
Low (1.0)
Low (1.1)
Low (1.2)
Low 1.2)
Low (1.4)
Low (1.5)
Low (1.7)
Low (2.0)
Medium (3.0)
High (4.1)
High (5.0)
High (5.0)
Assessment(Index 1)
Beer
Silk
Rubber
Cassava
Livestock
Corn
Soybeans
Cashew nuts
Fishery
Footwear
Rice
Garments
Sector
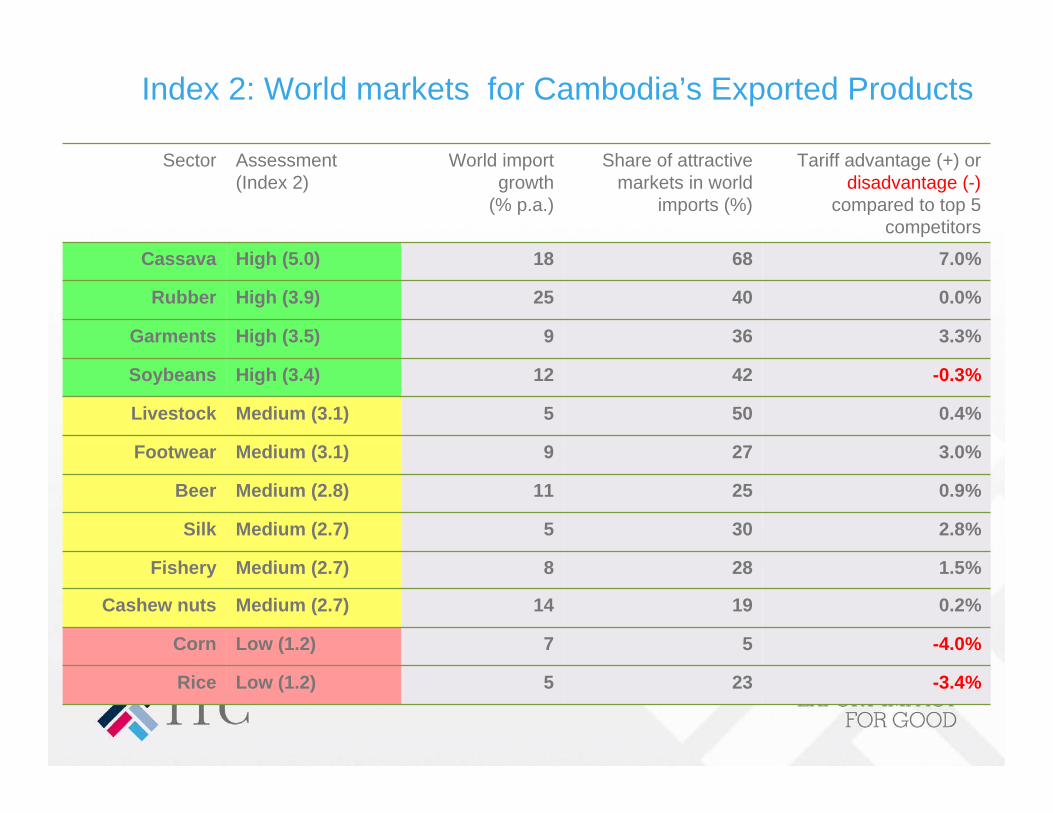
Index 2: World markets for Cambodia’s Exported Products
Low (1.2)
Low (1.2)
Medium (2.7)
Medium (2.7)
Medium (2.7)
Medium (2.8)
Medium (3.1)
Medium (3.1)
High (3.4)
High (3.5)
High (3.9)
High (5.0)
Assessment(Index 2)
-3.4%23 5 Rice
-4.0%5 7 Corn
0.2%19 14Cashew nuts
1.5%28 8Fishery
2.8%30 5Silk
0.9%25 11 Beer
3.0%27 9 Footwear
0.4%50 5 Livestock
-0.3%42 12Soybeans
3.3%36 9Garments
0.0%40 25 Rubber
7.0%68 18 Cassava
Tariff advantage (+) or disadvantage (-)
compared to top 5 competitors
Share of attractive markets in world
imports (%)
World import growth
(% p.a.)
Sector
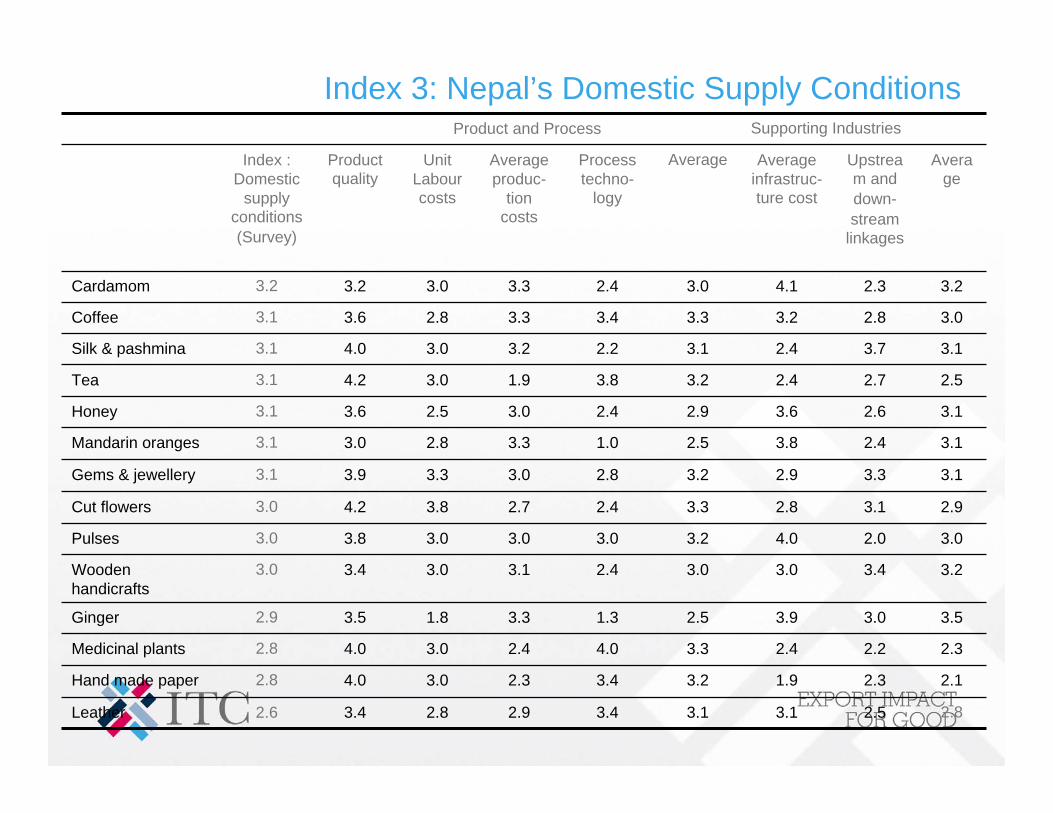
Index 3: Nepal’s Domestic Supply Conditions
2.82.53.13.13.42.92.83.42.6Leather
2.12.31.93.23.42.33.04.02.8Hand made paper
2.32.22.43.34.02.43.04.02.8Medicinal plants
3.53.03.92.51.33.31.83.52.9Ginger
3.23.43.03.02.43.13.03.43.0Wooden handicrafts
3.02.04.03.23.03.03.03.83.0Pulses
2.93.12.83.32.42.73.84.23.0Cut flowers
3.13.32.93.22.83.03.33.93.1Gems & jewellery
3.12.43.82.51.03.32.83.03.1Mandarin oranges
3.12.63.62.92.43.02.53.63.1Honey
2.52.72.43.23.81.93.04.23.1Tea
3.13.72.43.12.23.23.04.03.1Silk & pashmina
3.02.83.23.33.43.32.83.63.1Coffee
3.22.34.13.02.43.33.03.23.2Cardamom
Average
Upstream anddown-stream
linkages
Average infrastruc-ture cost
AverageProcess techno-
logy
Average produc-
tion costs
Unit Labour costs
Product quality
Index : Domestic
supply conditions(Survey)
Supporting IndustriesProduct and Process

Index 3: Nepal’s Domestic Supply Conditions
5
5
5
6
5
5
5
10
5
5
5
5
5
5
Number of interviewed firms
2.5 (Low)2.03.05. Leather
2.6 (Low)2.52.69. Hand made paper
2.9 (Med.)3.02.88. Medicinal plants & essential oils
3.0 (Med.)3.03.07. Ginger
3.0 (Med.)3.03.110. Wooden handicrafts
3.1 (Med.)3.03.13. Pulses
3.1 (Med.)3.03.111. Cut flowers
3.1 (Med.)3.03.24. Gems & jewellery
3.2 (High)3.52.814. Mandarin oranges
3.2 (High)3.53.013. Honey
3.4 (High)4.02.96. Tea
3.5 (High)4.03.11. Silk & pashmina
3.6 (High)4.03.112. Coffee
3.8 (High)4.53.12. Cardamom
Index 3: Domesticsupply conditions
Competitiveness prospect (expert
evaluation)
Index: Domestic supply
conditions (survey)
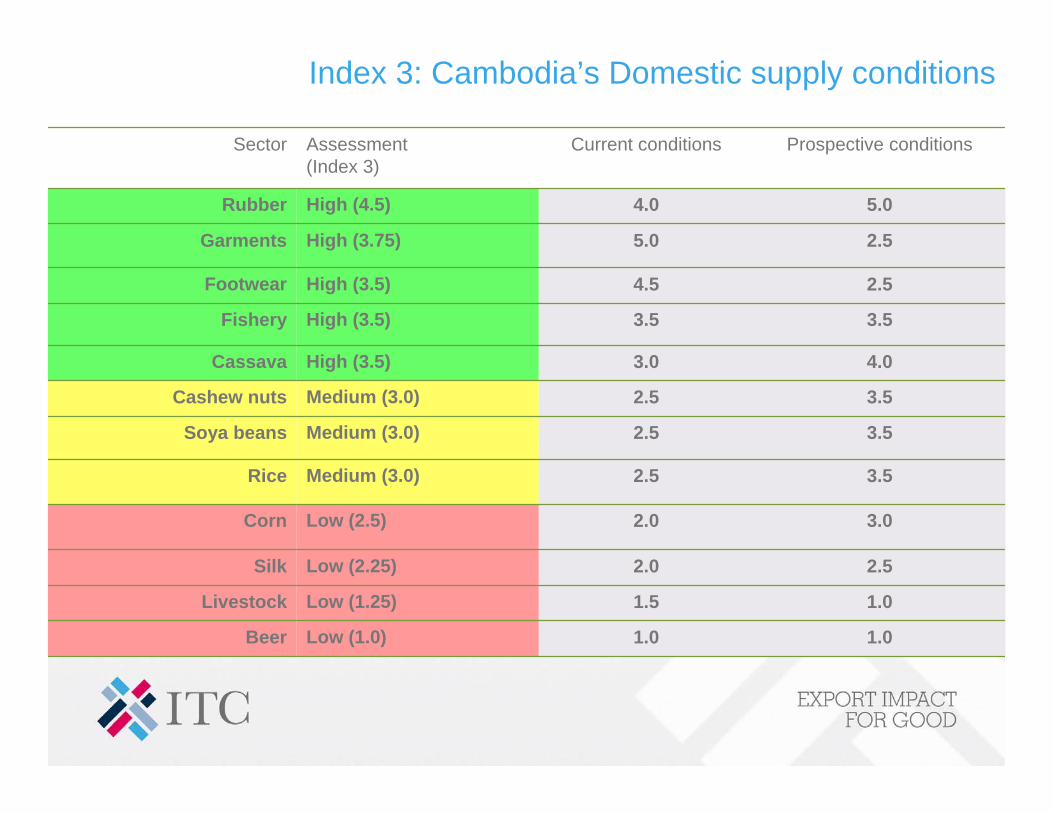
Index 3: Cambodia’s Domestic supply conditions
1.0
1.0
2.5
3.0
3.5
3.5
3.5
4.0
3.5
2.5
2.5
5.0
Prospective conditions
1.0
1.5
2.0
2.0
2.5
2.5
2.5
3.0
3.5
4.5
5.0
4.0
Current conditions
Medium (3.0)Rice
Low (2.5)Corn
Low (2.25)Silk
Low (1.25)Livestock
Medium (3.0)Soya beans
Low (1.0)Beer
Medium (3.0)Cashew nuts
High (3.5)Cassava
High (3.5)Fishery
High (3.5)Footwear
High (3.75)Garments
High (4.5)Rubber
Assessment(Index 3)
Sector

Index 4: Nepal’s Socio-Economic Impact
n.a.3.43.02.03.03.43.63.1Hand Made Paper
2.83.02.43.83.43.64.03.3Leather
3.03.23.02.84.04.04.23.5Pulses
4.03.33.03.03.33.84.03.5Tea
4.03.33.0n.a.3.33.83.53.5Medicinal Plants
3.04.24.81.24.24.44.03.7Mandarine Orange
3.23.33.51.84.84.74.53.7Ginger
2.83.24.62.45.04.83.83.8Cardamoms
3.63.85.02.64.44.23.63.9Honey
4.34.04.03.44.44.63.64.0Coffee
4.54.23.73.44.24.84.84.2Gems and Jewellery
4.64.23.64.03.84.84.84.3Wooden Handicrafts
4.35.03.83.84.65.05.04.5Silk and Pashmina
4.54.65.03.44.64.84.84.5Cut Flowers
Human capital
Gender equality
Environ-mental sustain-ability
Industrial-isation
Rural development
Poverty reduction
Job creation
Index 4: Socio-
economic impact

Index 4: Nepal’s Socio-Economic Impact
Low1.02,50011. Cut flowers
Low1.04,00010. Wooden handicrafts
Low1.15,0001. Silk and pashmina
Low1.25,5562. Cardamom
Low1.36,3005. Leather
Low1.47,77812. CoffeeLow1.710,0004. Gems and jewellery
Low1.811,1117. Ginger
Low1.912,5003. Pulses
Low2.013,33313. Honey
Low2.416,66714. Mandarin oranges
Medium3.022,3339. Hand made paper
High5.040,0008. Medicinal plants
High5.0105,0006. Tea
AssessmentIndex 4Full-time employment equivalent
Sector

Index 4: Socio-economic impact in Lao PDR
2.72.72.9
2.8
3.0
3.6
3.23.34.0
4.0
Women employ-
ment
2.72.72.9
2.8
3.0
3.6
3.23.34.0
4.0
Rural develop-
ment
2.72.72.9
2.8
3.0
3.6
3.23.34.0
4.0
Poverty reduc-tion
3.12.63.6Clothing
3.23.03.2Rattan
3.03.33.0Medicinal herbs
2.82.72.7Wood
2.82.72.7Wood products
2.93.02.9Coffee
2.93.22.8Beer
3.53.83.3Tea
3.93.74.0Rice
4.24.54.0Handicrafts
Index socio-economic
impact
Environ-mental sustain-ability
Employment creation

Index 4: Socio-economic impact in Cambodia
MediumLow (1.0)4,500MediumFootwear
Medium-HighHigh (4.6)360,000HighGarments
Medium-HighHigh (5.0)2,940,000Medium-HighRice
Medium-HighHigh (3.6)260,000Medium-HighFishery
HighMedium (1.2)20,500Medium-HighSilk
LowLow (1.0)3,000LowBeer
LowLow (1.0)4,000LowCassava
Low-MediumMedium (1.1)12,500Low-MediumCornLow-MediumMedium (1.1)16,500Low-MediumSoya beans
Medium-HighMedium (1.1)12,000MediumCashew nuts
MediumMedium (1.4)40,000MediumRubber
MediumHigh (5.0)400,000MediumLivestock
Partial assessmentbased on other criteria*
Partial assessmentbased on employment
Employment estimate
Overall assessmentIndustry
* Female employment, wages, rural development, linkages, environmental sustainability.

Domestic supply conditions:Example of SWOT for rubber in Cambodia
Many smallholdings use mediocre or poor quality trees.
Relatively low yield.
No high value-added down-stream industry (e.g. for tires).
Inefficiencies in SOEs, which still have to undergo privatization process.
Difficult to adapt production level on world demand and price level in the short-run.
Many countries such as EU, USA, Japan, Thailand, India, and China require certification by internationally accredited laboratories.
Lower labour costs than in major producing countries.
Modern processing facilities.
Capacity reserves in processing plants.
Quality of raw product is good.
High potential for growth of planted area.
Potential of future development of value-added rubber industry.
Privatization might help improving productivity.
Weaknesses and threatsStrengths and opportunities
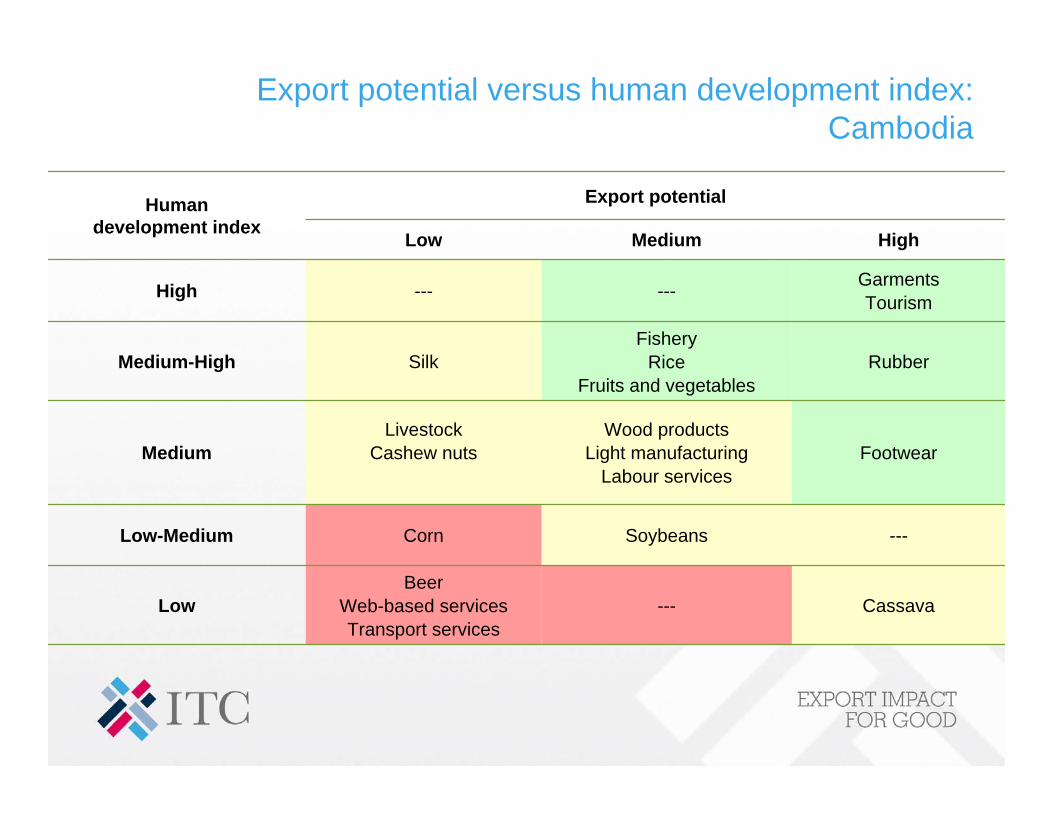
Export potential versus human development index: Cambodia
HighMediumLow
GarmentsTourism------High
---SoybeansCornLow-Medium
Cassava---Beer
Web-based servicesTransport services
Low
FootwearWood products
Light manufacturingLabour services
LivestockCashew nutsMedium
RubberFishery
RiceFruits and vegetables
SilkMedium-High
Export potentialHumandevelopment index

Coffee Wood products
Coal
Vegetables
Processed fruits and vegetables
Tea
Rice
Handicrafts
Beer
2.0
2.5
3.0
3.5
4.0
4.5
2.0 2.2 2.4 2.6 2.8 3.0 3.2 3.4 3.6
Export potential index
Socio-economic impact index
Low potentialHigh socio-economic impact
High potential andsocio-economic impact
Low potential andsocio-economic impact
High potentialLow socio-economic impact
Export potential versus socio-economic impact: Lao PDR
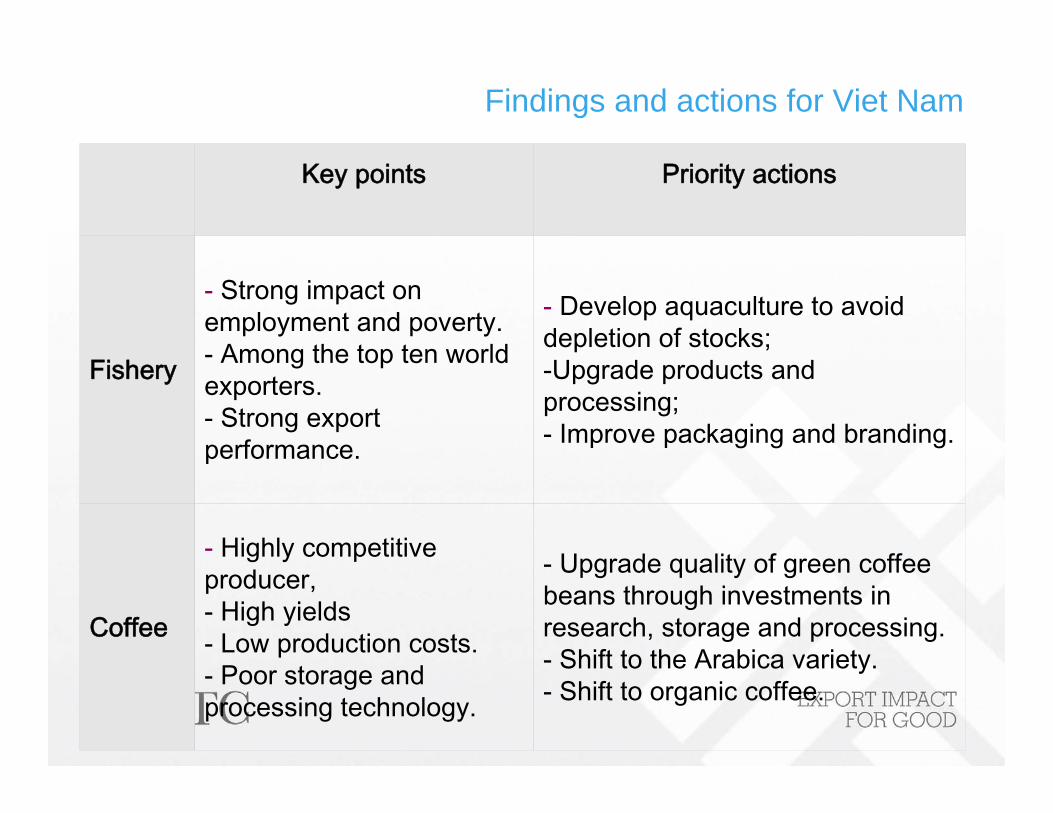
Findings and actions for Viet Nam
Key points Priority actions
Fishery
- Strong impact onemployment and poverty. - Among the top ten world exporters. - Strong export performance.
- Develop aquaculture to avoid depletion of stocks; -Upgrade products and processing; - Improve packaging and branding.
Coffee
- Highly competitive producer, - High yields - Low production costs. - Poor storage and processing technology.
- Upgrade quality of green coffee beans through investments in research, storage and processing. - Shift to the Arabica variety. - Shift to organic coffee.
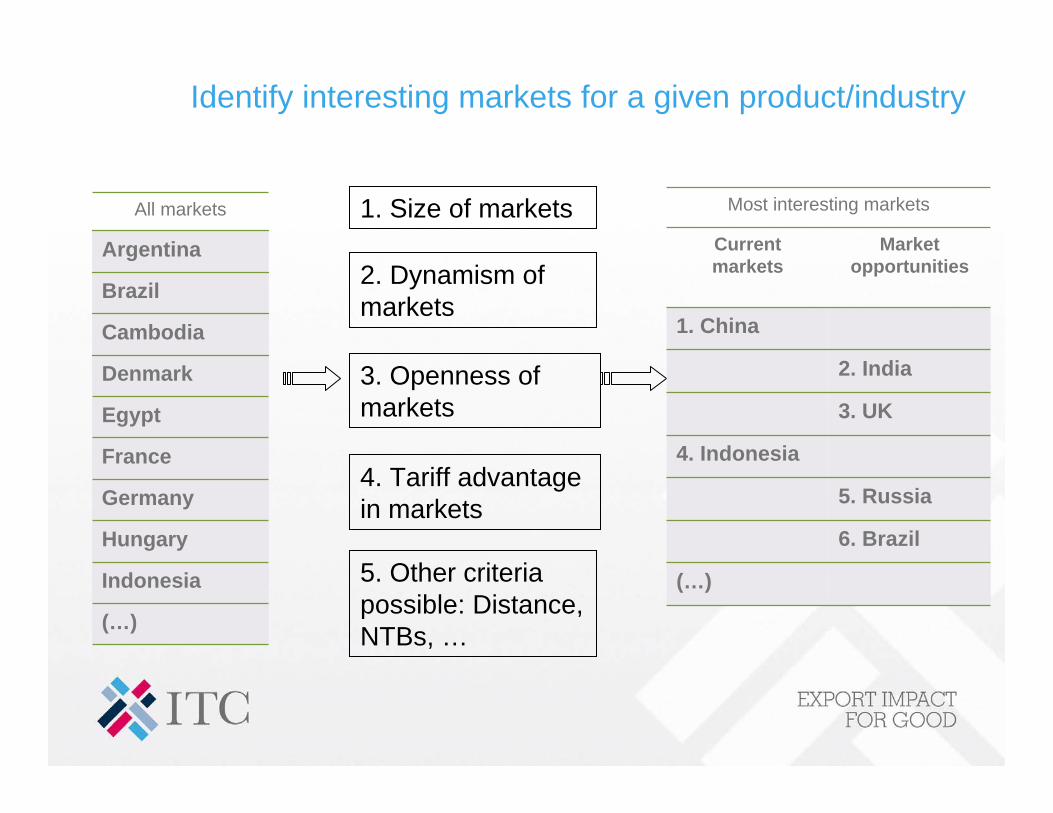
Identify interesting markets for a given product/industry
5. Russia
6. Brazil
Most interesting markets
(…)
4. Indonesia
1. China
Current markets
Market opportunities
3. UK
2. India3. Openness of markets
1. Size of markets
2. Dynamism of markets
4. Tariff advantage in markets
All markets
Hungary
France
Egypt
Denmark
Cambodia
Brazil
(…)
Indonesia
Germany
Argentina
5. Other criteria possible: Distance, NTBs, …

How to identify attractive markets?
Share of marketin world exports
Size ofimport markets
Growth differential:market growthminus world growth
Dynamismof markets
Tariff appliedto country
Opennessof markets
Average tariffapplied to 5 top competitorsin the marketminus tariff applied to country
Tariff advantagein markets
Market attractiveness index

Top 5 attractive markets in the world and the regionfor Cambodian Shrimps and prawns (HS 160520)
Cambodia’s main competitorsTariff advantage
TariffGrowth Rate
World share
(%)(%)(% p.a.)(%)
Markets(Rank in world)
Singapore, Japan, Indonesia0.05.01640.027. Philippines
Viet Nam, Netherlands, India0.40.0600.117. Malaysia
China, Japan, Thailand0.00.0260.515. Hong Kong
Singapore, China5.00.0510.013. Indonesia
China, USA, Malaysia38.610.01191.09. Viet Nam
Thailand, China, Viet Nam1.20.0731.45. United StatesThailand, Viet Nam, China3.20.0616.64. Japan
Greenland, Canada, Iceland0.50.0127.63. Denmark
Thailand, China, Viet Nam0.00.0233.62. Canada
China, Denmark, Belgium4.30.0623.21. Spain

Most attractive markets forCambodia’s most promising fishery products
1. Spain, 2. Canada, 3. Denmark, 4. Japan, 5.United States
1. Netherlands, 2. Japan, 3. UK, 4. France,5. United States
1. France, 2. Sweden, 3. UK, 4. Italy,5. Belgium
Most attractive marketsin the world
2.48
2.65
2.68
Export potential
index
12. Viet Nam, 32. Tajikistan, 34. Kazakhstan, 39. Singapore, 42. Thailand
Fish fillets, dried, salted (030420)
10. Viet Nam, 27. Malaysia,45. Georgia, 49. Maldives,
Fish fillets, fresh or chilled (030410)
Attractive markets in the region(rank in the world)
Product
9. Viet Nam, 13. Indonesia,15. Hong Kong (SARC),17. Malaysia,27. Philippines
Shrimps and prawns, prepared (160520)
*Markets in green indicate new markets for Cambodia.
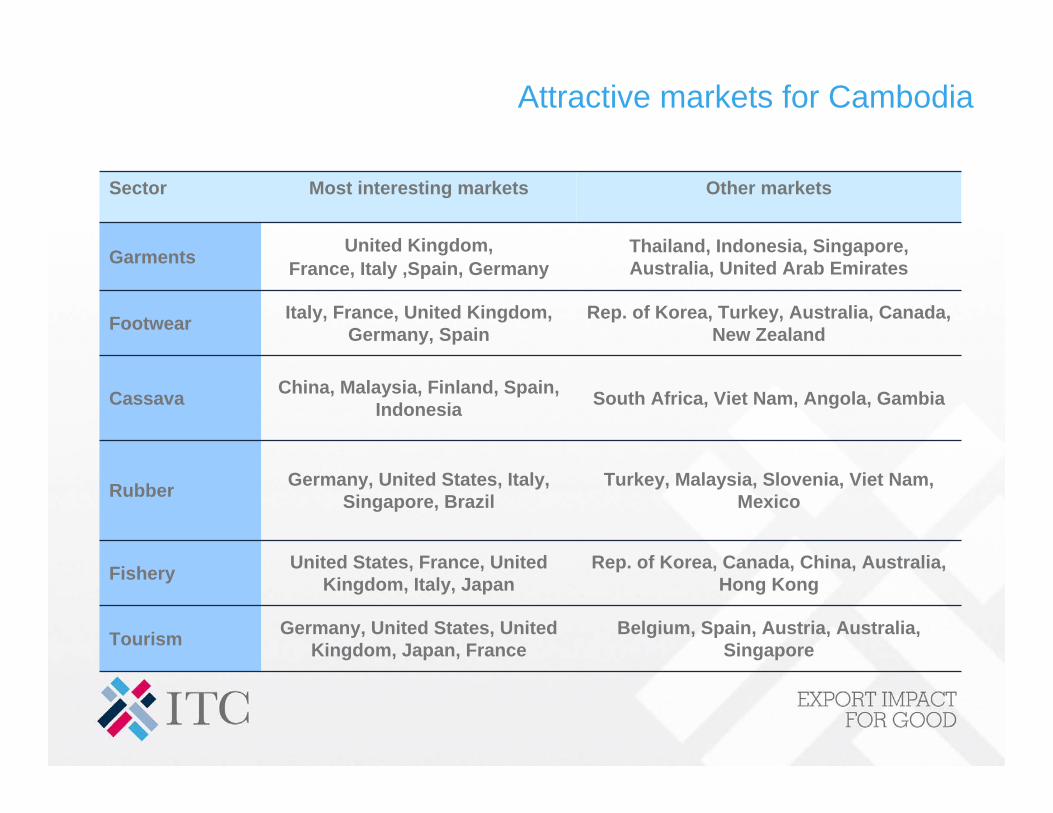
Attractive markets for Cambodia
Rep. of Korea, Canada, China, Australia, Hong Kong
United States, France, United Kingdom, Italy, Japan Fishery
Germany, United States, United Kingdom, Japan, France
Germany, United States, Italy, Singapore, Brazil
China, Malaysia, Finland, Spain, Indonesia
Italy, France, United Kingdom, Germany, Spain
United Kingdom, France, Italy ,Spain, Germany
Most interesting markets
Belgium, Spain, Austria, Australia, Singapore
Turkey, Malaysia, Slovenia, Viet Nam, Mexico
South Africa, Viet Nam, Angola, Gambia
Rep. of Korea, Turkey, Australia, Canada, New Zealand
Thailand, Indonesia, Singapore, Australia, United Arab Emirates
Other markets
Tourism
Rubber
Cassava
Footwear
Garments
Sector
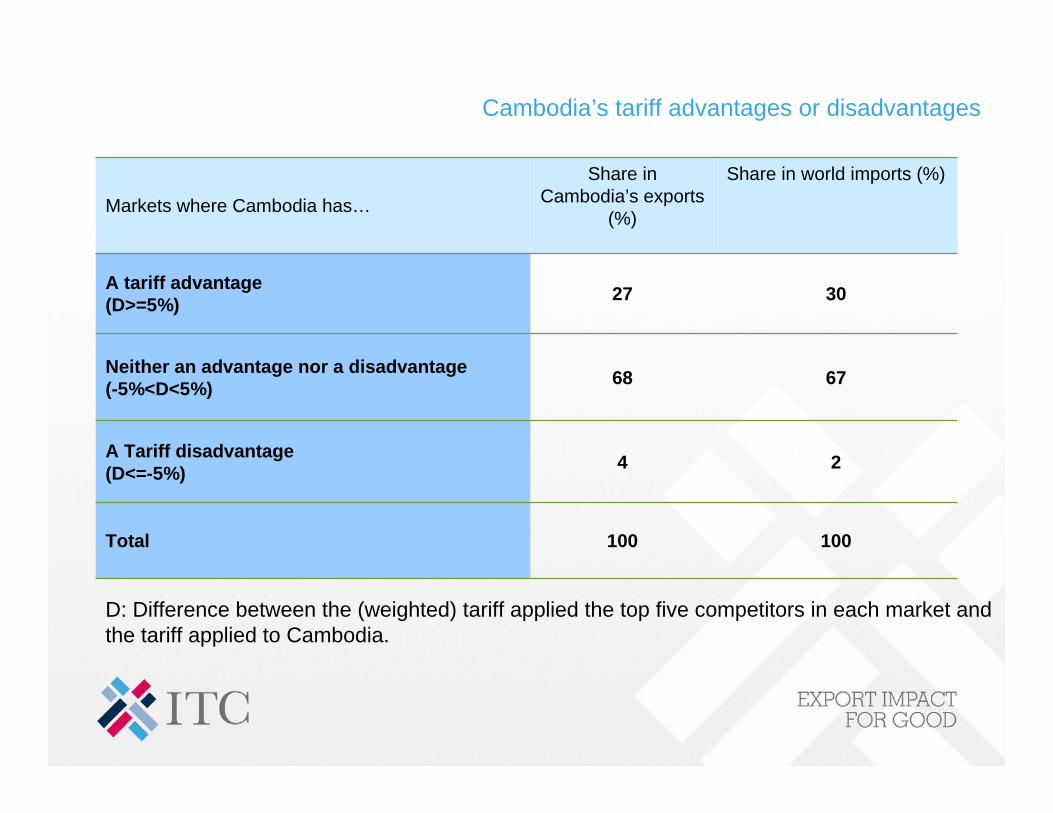
Cambodia’s tariff advantages or disadvantages
6768Neither an advantage nor a disadvantage (-5%<D<5%)
100100Total
24A Tariff disadvantage(D<=-5%)
3027A tariff advantage(D>=5%)
Share in world imports (%)Share in Cambodia’s exports
(%)Markets where Cambodia has…
D: Difference between the (weighted) tariff applied the top five competitors in each market and the tariff applied to Cambodia.

3. Export Opportunity Scan

Export Opportunity Scan
• What?– ITC report analysing quantitative data about your country’s export performance in
order to identify promising sectors for export promotion or import substitution• Who would use it and why
– Trade Support Institutions and trade policy makersAs a point of departure for a more detailed analysis of their country’spotential export sectors, products and markets
• Includes– An ITC report that draws on trade, market access and production data to analyse a
country’s current export performance and current production* compared with world demand and world production to identify sectors that have potential for:
Export development and / orImport substitution
– The report is based on statistics and therefore needs to be validated further at the country level using additional qualitative information
– Takes 1 to 2 months to deliver
* Production data covers agricultural commodities only

Selection of sectors
Export performance
World markets
Coffee, tea and spices (09)
All sectors (HS2)
Fruit and nuts (08)
Live plants (06)
Prod. of animal origin (05)
Dairy prod. (04)
Seafood (03)
Meat (02)
(...)
Vegetables (07)
Animals (01)
Priority sectors
8. Precious stones
5. Iron and steel
5. Cotton
4. Cocoa
3. Ships
2. Ores
(…)
10. Rubber
9. Machinery
7. Fruits and nuts
1. Fuel
Domestic supply conditions
Socio-economic impact
Export Opportunity Scan
Export Potential Asessment

Model for regional Trade Opportunity Scan (for agricultural commodities)
Tariff applied to the region & Tariff advantage for the regionMarket Access
Growth of world imports & Absolute change in world importsDynamism
World importsSizeWorld market index
Number of importing countries in the regionDiversification
Growth of regional imports from World & Absolute change in regional importsDynamism
Regional imports from world & Share of region in world importsSizeImport index
Net exports (excluding intra-regional trade)Relative trade balance
Trade balance
Number of exporting countries in the regionShare of top exporting country in the region
Diversification
Growth of region’s exports to worldAbsolute change in region’s exports
Dynamism
Region’s exports to worldShare of region’s exports in world exports
SizeExport index
Ratio of regional yield to world yieldYield
Number of producing countries & Share of top producing country in the regionDiversification
Growth of regional productionDynamism
Share of region in world productionSizeProduction index
IndicatorsDimensionIndices
Utilization of composite indicesto combine indicators with different units
• Standardisedto range between0 (low) and 100 (high)
• Averaged to obtain an overall index
Upper threshold
Lower threshold
100
0

Index 1 Production: Size
1007442,863,2891. Other roots and tubers
Index%MT
4325354,3007. Other vegetable products
342011,649,5798. Sorghum
3219440,5009. Cashew nuts
26155,457,92210. Groundnuts in shell
100632,455,5001. Cocoa beans
100593,576,0001. Citrus fruit nes
714211,475,2705. Millet
46
100
2856,048,9606. Cassava
853,107,1821. Cow peas, dry
Share of Western Africain world production
For information:ProductionTop 10 products

Index 1 Production: Dynamism
8846. Cassava
8846. Beans, dry
8238. Maize
8139. Dates
100171. Watermelons
100111. Broad beans, dry
10051. Eggplants
10071. Wheat
69310. Sorghum
9445. Cocoa beans
Index% p.a.
Growth of Western Africa productionTop 10 products

Index 1 Production: Diversification
64
71
93
71
100
71
79
100
100
100
Index
857054 (Nigeria )156. Groundnuts in shell
839637 (Ghana )117. Coconuts
816955 (Nigeria )148. Millet
768048 (Nigeria )119. Sesame seed
10010019 (Burkina Faso )151. Other pulses
918147 (Nigeria )152. Rice, paddy
897749 (Nigeria )153. Maize
8910025 (Mali )123. Cotton
88
100
Index
7642 (Nigeria )109. Pimento, allspice
8634 (Ghana )115. Bananas, plantains
% (top producer)0 to 16
Averageindex
Share of top producerin Western Africa’s production
Number of producing countries in Western Africa
Top 10 products

Index 1 Production: Yield
941.026. Other roots and tubers
931.017. Millet
921.008. Pimento, allspice
900.999. Cocoa beans
860.9510. Coconuts
1001.921. Nutmeg, mace, cardamons
1001.221. Cucumbers and gherkins
1001.111. Other spices
1001.071. Sesame seed
860.9510. Onions
991.075. Grapefruit and pomelos
IndexRatio
Ratio of Western Africa’s yieldto world yield
Top 10 products

Index 1 Production: Overall
21151086. Sorghum
1933177. Sesame seed
25171398. Cashew nuts
23618108. Groundnuts in shell
925511. Cocoa beans
781452. Millet
6222413. Other roots and tubers
1412664. Cassava
1
34
Rankdiversification
1922198. Other pulses
122615. Cow peas, dry
Rankrelative yield
Rankdynamism
Ranksize
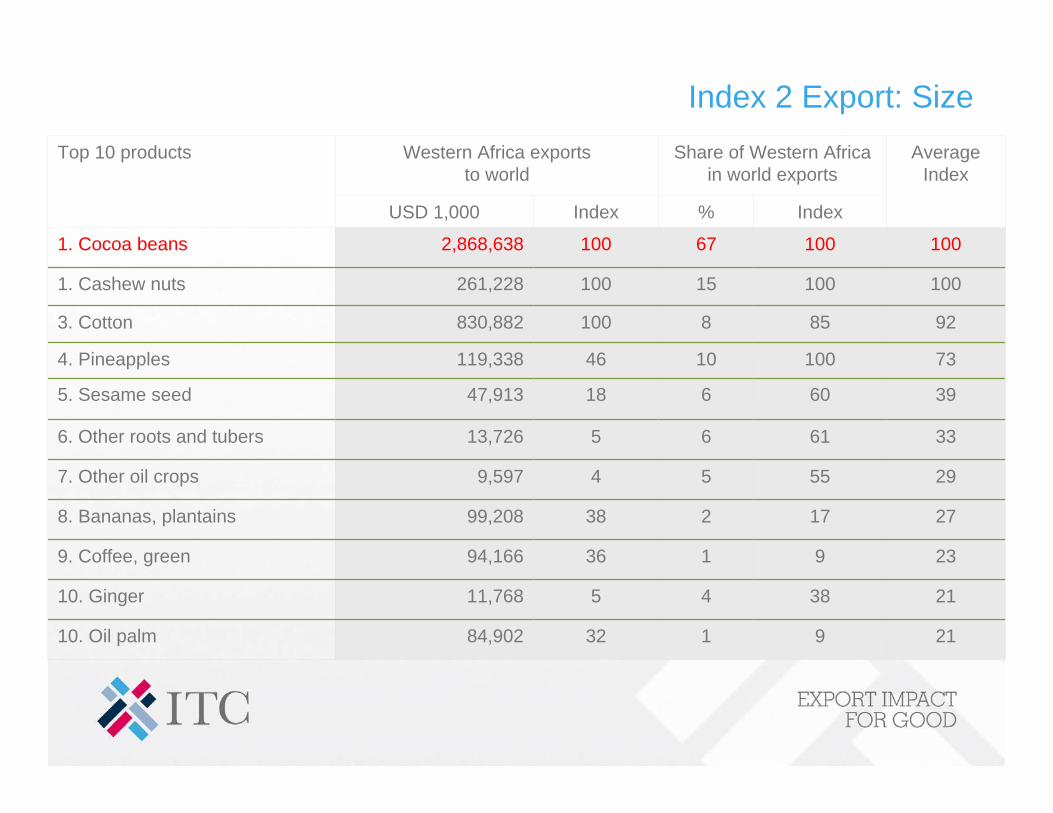
Index 2 Export: Size
21384511,76810. Ginger
84,902
94,166
99,208
9,597
13,726
47,913
119,338
830,882
261,228
2,868,638
USD 1,000
Western Africa exportsto world
3361656. Other roots and tubers
2955547. Other oil crops
27172388. Bananas, plantains
2391369. Coffee, green
100100671001. Cocoa beans
100100151001. Cashew nuts
928581003. Cotton
7310010464. Pineapples
9
60
Index
2113210. Oil palm
396185. Sesame seed
%Index
Average Index
Share of Western Africain world exports
Top 10 products
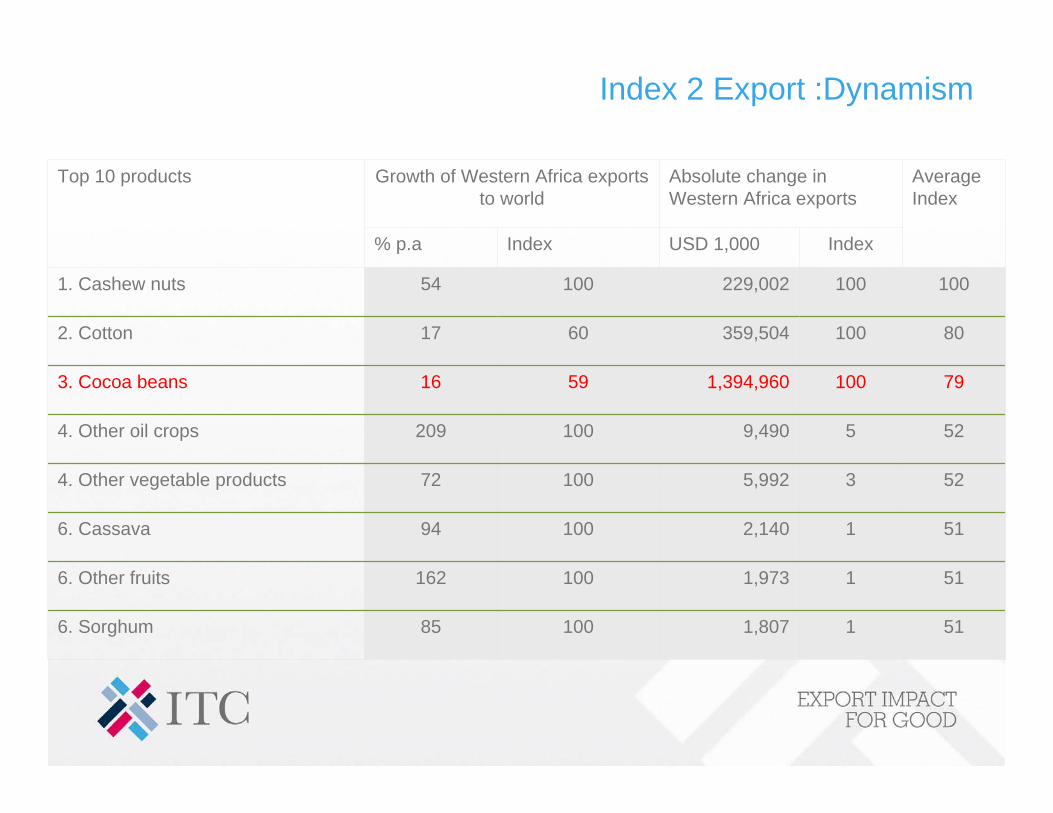
Index 2 Export :Dynamism
5111,9731001626. Other fruits
5112,140100946. Cassava
5235,992100724. Other vegetable products
5259,4901002094. Other oil crops
791001,394,96059163. Cocoa beans
80100359,50460172. Cotton
85
54
% p.a
Growth of Western Africa exports to world
100100229,0021001. Cashew nuts
5111,8071006. Sorghum
IndexUSD 1,000Index
Average Index
Absolute change in Western Africa exports
Top 10 products
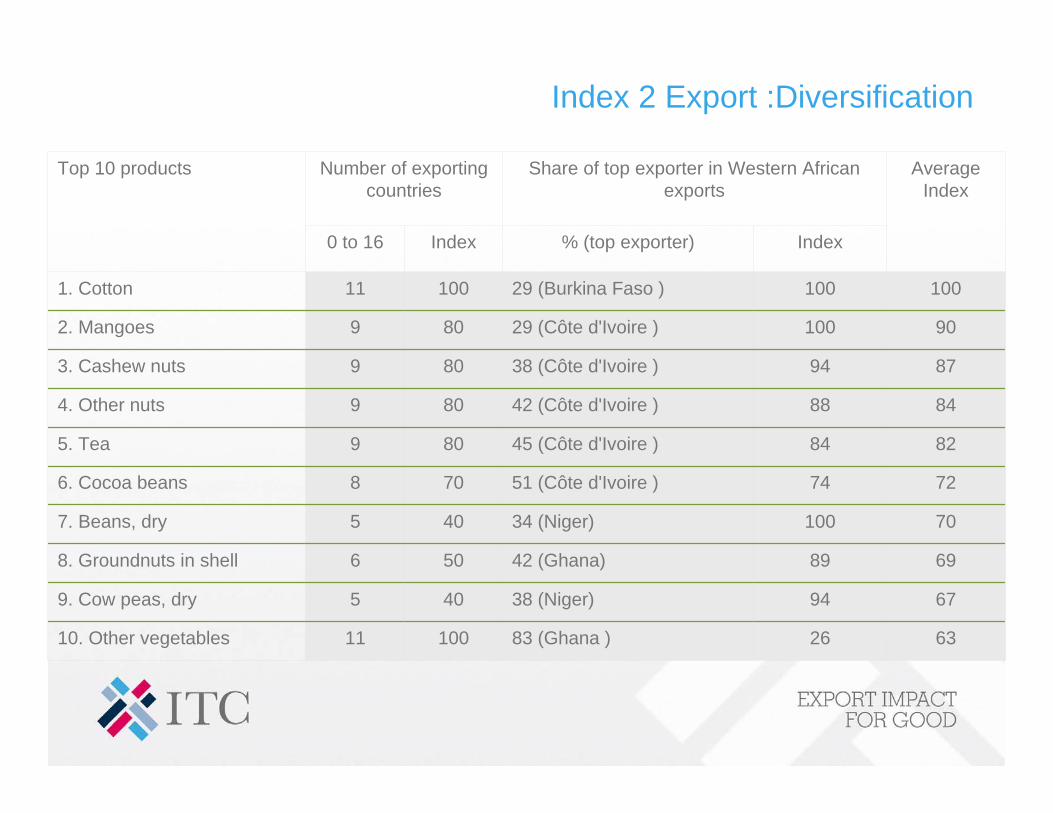
Index 2 Export :Diversification
7010034 (Niger)4057. Beans, dry
727451 (Côte d'Ivoire )7086. Cocoa beans
828445 (Côte d'Ivoire )8095. Tea
848842 (Côte d'Ivoire )8094. Other nuts
879438 (Côte d'Ivoire )8093. Cashew nuts
9010029 (Côte d'Ivoire )8092. Mangoes
632683 (Ghana )1001110. Other vegetables
5
6
11
0 to 16
Number of exporting countries
10010029 (Burkina Faso )1001. Cotton
698942 (Ghana)508. Groundnuts in shell
679438 (Niger)409. Cow peas, dry
Index % (top exporter)Index
Average Index
Share of top exporter in Western African exports
Top 10 products

Index 2 Export: Trade Balance
651001003047,8357. Sesame seed
7298974592,5105. Coffee, green
721001004592,3495. Bananas, plantains
7710010054119,2174. Pineapples
100100100100261,1561. Cashew nuts
100100100100826,0091. Cotton
5910099179,0828. Other oil crops
11,709
13,665
2,868,449
USD 1,000
Absolute trade balance
1001001001001. Cocoa beans
59100100198. Other roots and tubers
5910099188. Ginger
Index %Index
Average Index
Relative trade balanceTop 10 products

Index 2 Export: Overall
7143457. Sesame seed
1389218. Groundnuts in shell
5114799. Coffee, green
204392110. Other nuts
11232. Cotton
16313. Cocoa beans
4173944. Pineapples
11233125. Mangoes
12
3
Rankdiversification
8475. Other oil crops
1111. Cashew nuts
Ranktrade balance
Rankdynamism
Ranksize

Index 3 Import : Size
54902178,7547. Rice, paddy
561005136,6346. Jute and other bast fibres
571709649,3905. Maize
96912100200,7224. Oil palm
1001004100848,0581. Wheat
100100210072,6231. Tea
34511168,13710. Sorghum
5,464
24,753
51,439
USD 1,000
Western Africa imports from world
10010031001. Onions
52561488. Potatoes
47842119. Cow peas, dry
Index%Index
Average index
Share of Western Africain world imports
Top 10 products
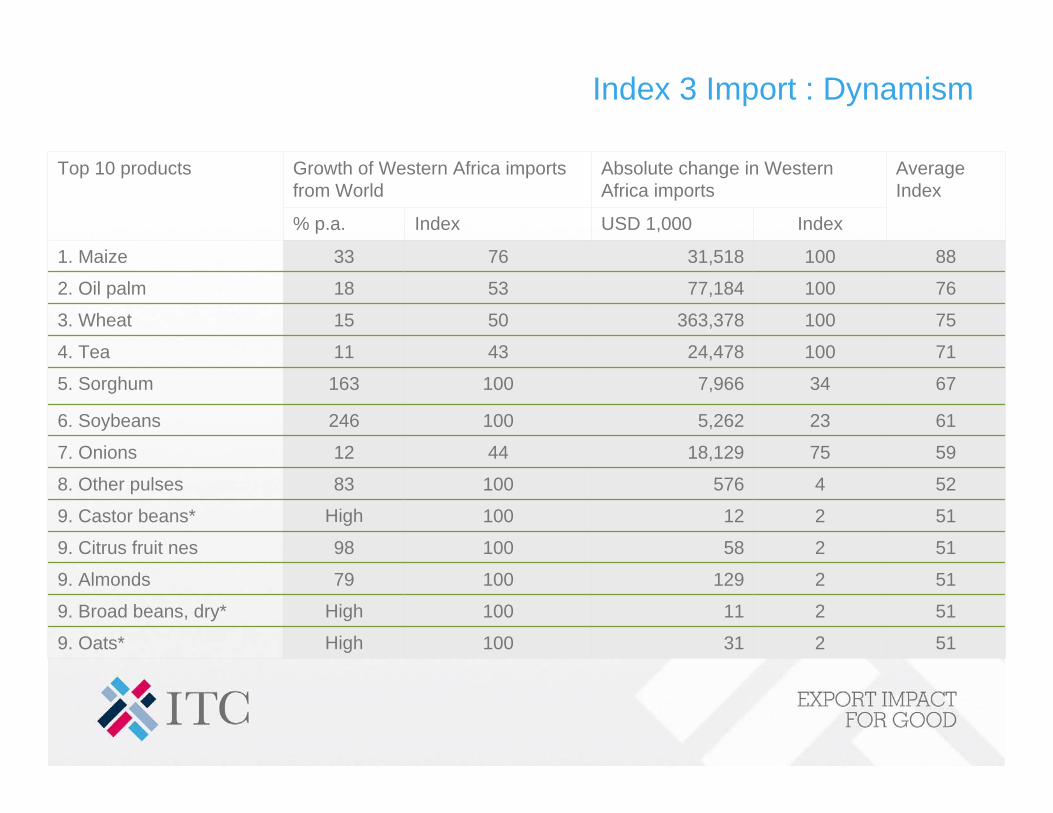
Index 3 Import : Dynamism
51211100High9. Broad beans, dry*
51212100High9. Castor beans*
51258100989. Citrus fruit nes
597518,12944127. Onions
61235,2621002466. Soybeans
67347,9661001635. Sorghum
7110024,47843114. Tea
75100363,37850153. Wheat
7610077,18453182. Oil palm
512 31100High9. Oats*
79
83
33
% p.a.
Growth of Western Africa imports from World
8810031,518761. Maize
5245761008. Other pulses
5121291009. Almonds
IndexUSD 1,000Index
Average Index
Absolute change in Western Africa imports
Top 10 products
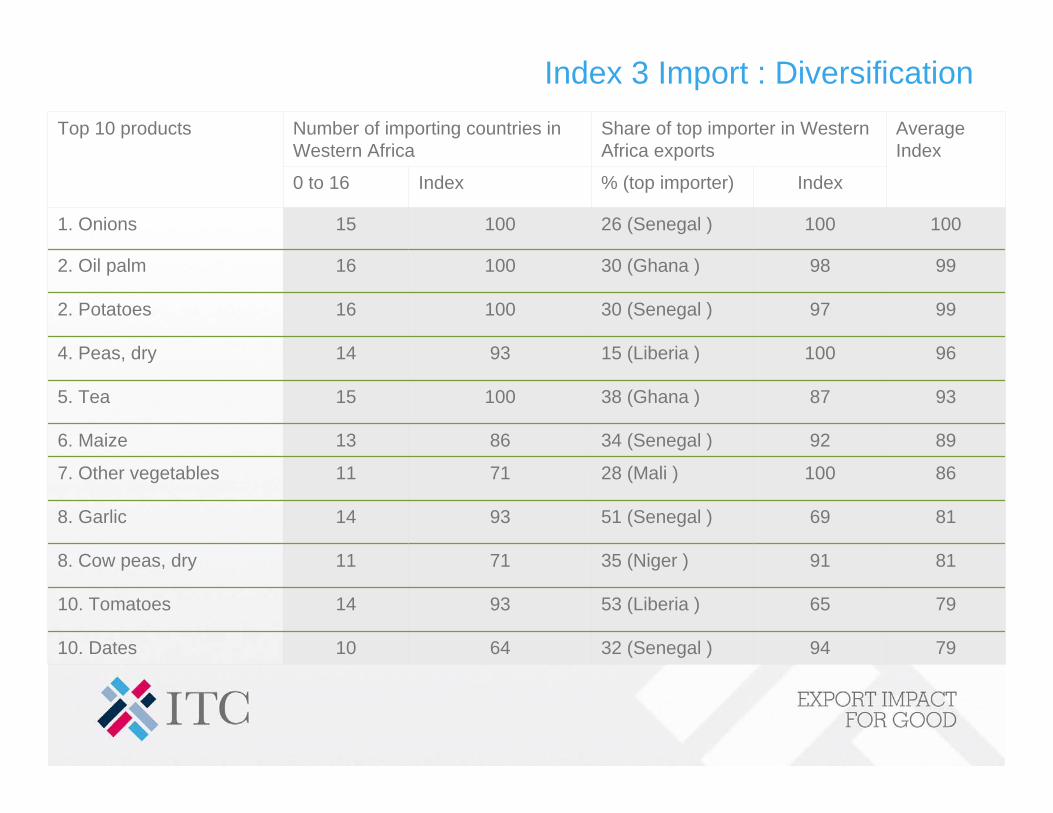
Index 3 Import : Diversification
819135 (Niger )71118. Cow peas, dry
796553 (Liberia )931410. Tomatoes
8610028 (Mali )71117. Other vegetables
899234 (Senegal )86136. Maize
938738 (Ghana )100155. Tea
9610015 (Liberia )93144. Peas, dry
999730 (Senegal )100162. Potatoes
999830 (Ghana )100162. Oil palm
10
14
15
0 to 16
Number of importing countries in Western Africa
10010026 (Senegal )1001. Onions
816951 (Senegal )938. Garlic
799432 (Senegal )6410. Dates
Index% (top importer)Index
Average Index
Share of top importer in Western Africa exports
Top 10 products

Index 3 Import: Overall
84297. Cow peas, dry
431198. Peas, dry
335109. Sorghum
8381410. Garlic
5412. Tea1713. Onions
14314. Wheat
6155. Maize
10
2
2
Rankdiversification
421310. Dates
1986. Potatoes
241. Oil palm
Rankgrowth
Ranksize

Index 4 World market: Size
959,9226. Cotton
848,7437. Bananas, plantains
505,2538. Tomatoes
454,7459. Cocoa beans
10021,3811. Wheat
10018,9161. Soybeans
10013,2501. Maize
10010,4411. Oil palm
394,11910. Barley
9710,1545. Coffee, green
IndexUSD million
World importsTop 10 products

Index 4 World market: Dynamism
59712,70447109. Bananas, plantains
58165741002410. Avocados
60271,00093217. Cashew nuts
61572,16865146. Tomatoes
651004,1673164. Wheat
65572,15273164. Cocoa beans
781006,91857123. Soybeans
791003,82659132. Coffee, green
7
23
% p.a.
Growth of world imports
1001005,8071001. Oil palm
60833,180377. Maize
IndexUSD millionIndex
Average Index
Absolute change in world importsTop 10 products

Index 4 World Market: Access conditions
6327898110. Cantaloupes & other melons
6437119139. Oats
6330996110. Cabbages
6843139326. Tang. mand. clement. satsma
6842139426. Lettuce
7554169615. Tomatoes
8289277484. Garlic
831004266103. Maize
87100457382. Cassava
5
1
6
%
Tariff applied to Western Africa
9010061811. Sesame seed
65319988. Beans
6344138210. Pimento, allspice
Index%Index
Average Index
Tariff advantage for Western Africa
Top 10 products

Index 4 World market: Overall
54977. Bananas, plantains
581568. Cotton
29499. Cocoa beans
1273010. Sesame seed
32252. Coffee, green
58112. Oil palm
41414. Wheat
62315. Soybeans
6
5
3
RankMarket access conditions
181410. Tang. mand. clement. satsma
686. Tomatoes
711. Maize
Rankgrowth
Ranksize
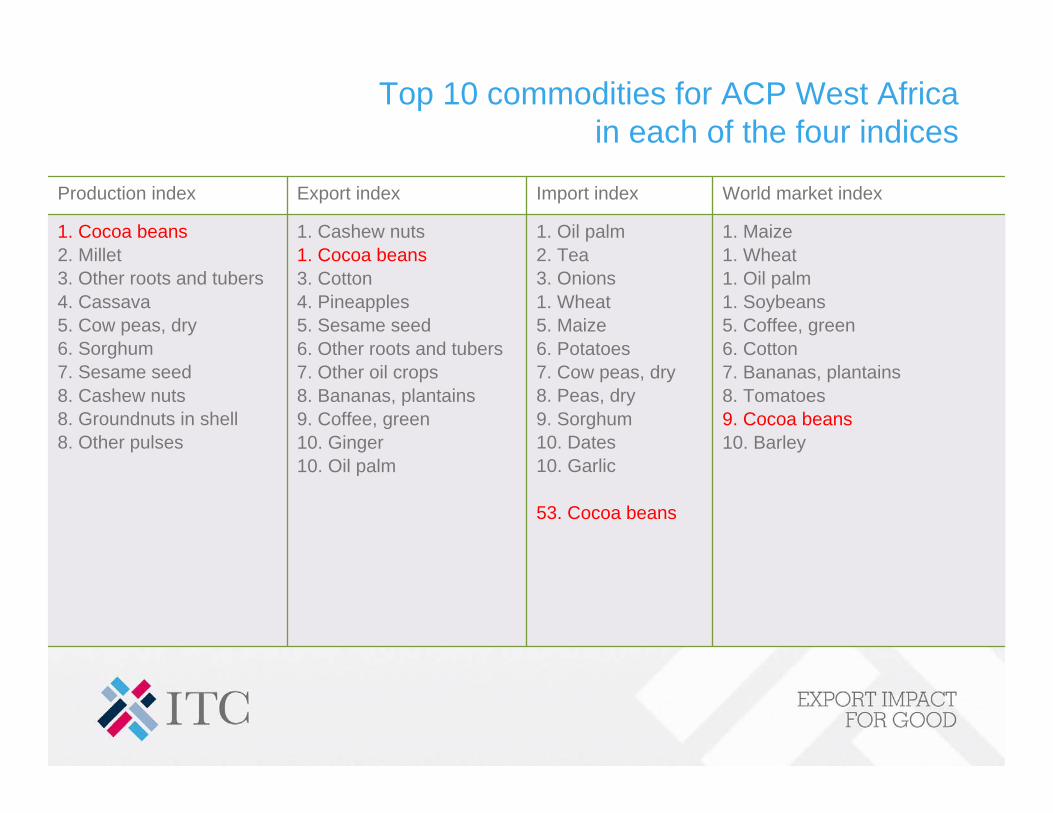
1. Cashew nuts1. Cocoa beans3. Cotton4. Pineapples5. Sesame seed6. Other roots and tubers7. Other oil crops8. Bananas, plantains9. Coffee, green10. Ginger10. Oil palm
Export index
1. Cocoa beans2. Millet3. Other roots and tubers 4. Cassava5. Cow peas, dry6. Sorghum7. Sesame seed8. Cashew nuts8. Groundnuts in shell 8. Other pulses
Production index
1. Oil palm2. Tea3. Onions1. Wheat5. Maize6. Potatoes7. Cow peas, dry8. Peas, dry9. Sorghum10. Dates10. Garlic
53. Cocoa beans
Import index World market index
1. Maize1. Wheat1. Oil palm1. Soybeans5. Coffee, green6. Cotton7. Bananas, plantains8. Tomatoes9. Cocoa beans10. Barley
Top 10 commodities for ACP West Africain each of the four indices
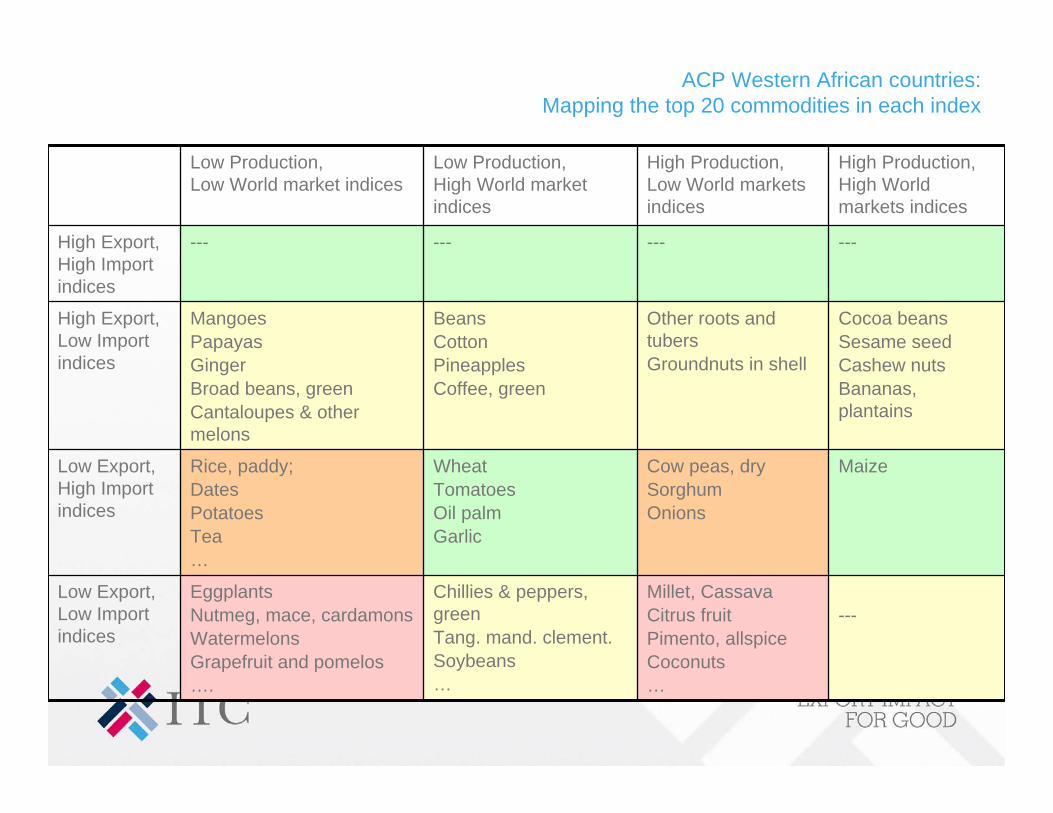
ACP Western African countries: Mapping the top 20 commodities in each index
---Millet, CassavaCitrus fruit Pimento, allspiceCoconuts…
Chillies & peppers, green Tang. mand. clement. Soybeans…
Eggplants Nutmeg, mace, cardamons Watermelons Grapefruit and pomelos ….
Low Export,Low Import indices
MaizeCow peas, dry Sorghum Onions
Wheat Tomatoes Oil palm Garlic
Rice, paddy; Dates Potatoes Tea …
Low Export,High Import indices
Cocoa beans Sesame seedCashew nuts Bananas, plantains
Other roots and tubers Groundnuts in shell
BeansCotton PineapplesCoffee, green
Mangoes Papayas Ginger Broad beans, green Cantaloupes & other melons
High Export,Low Import indices
------------High Export,High Import indices
High Production,High World markets indices
High Production,Low World markets indices
Low Production,High World market indices
Low Production,Low World market indices

Pimento, allspice
Cassava
Coconuts
Beans, dryBroad beans, dryMillet
No apparent potential
Other roots and tubers
Sesame seedGroundnuts in shell
Cashew nuts
Bananas, plantains
Cocoa beans
Export developmentHight rank in World markets or Exports
Import substitution and Export development
High rank in Imports and (Exports or World Markets)
Import substitutionHigh rank in
import
Product sectors
Spices
Roots and tubers
Oil crops
Nuts
Fruits and vegetables
Coffee, cocoa, tea
Cereals, grains, beans, peas and pulses
Onions
Cow peas, dry Sorghum Maize
ACP Western African countries: Commodities with high ranks (top 20) in production:
import substitution and/or export development

ACP Western African countries: Commodities with medium ranks (Top 21 to 40) in production:
import substitution and/or export development
Oil palm Oil crops
PotatoesRoots & tubers
Nutmeg, mace, cardamons
WatermelonsCucumbers & gherkinsEggplants Grapefruit & pomelos
Chick-peas
No apparent potential
BeansPineapplesMangoes
Cotton
Export development
Import substitution and Export
development
Import substitution
Product sectors
Spices
Nuts
Fruits and vegetables
Cotton
Cereals, grains, beans, peas and pulses
Pepper, white / long / black
Dates
Rice, paddy
Tomatoes
Wheat
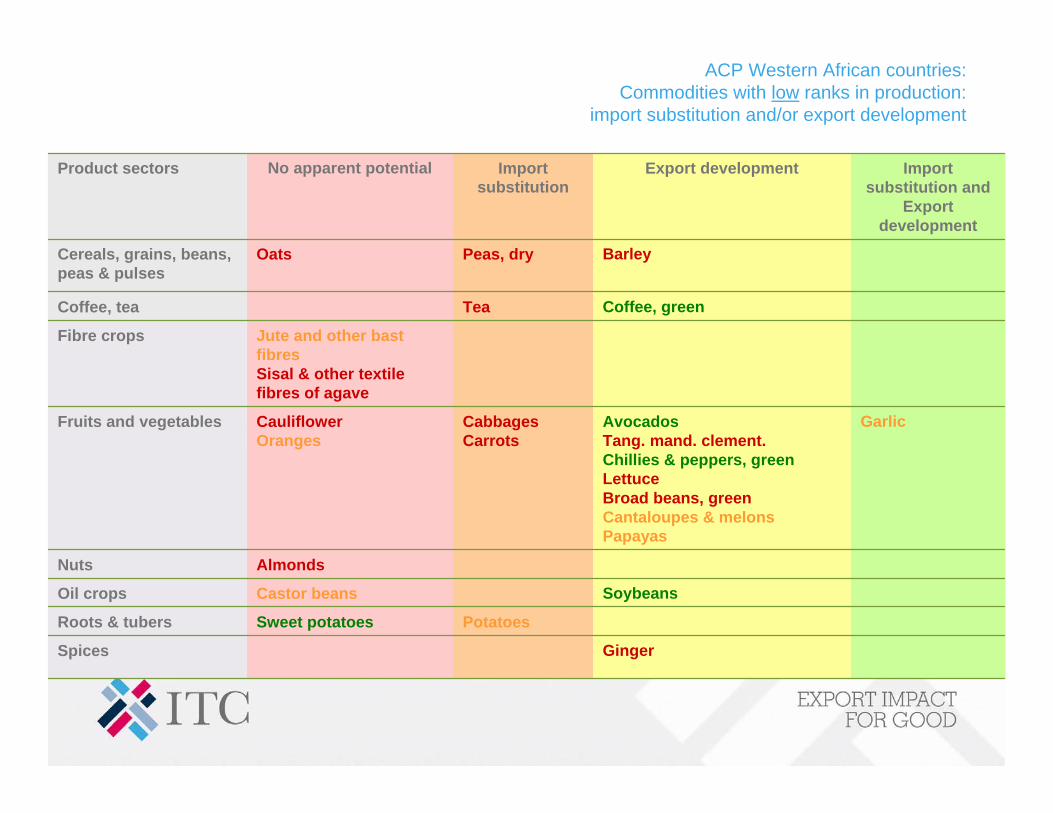
ACP Western African countries: Commodities with low ranks in production:
import substitution and/or export development
SoybeansCastor beansOil crops
PotatoesSweet potatoes Roots & tubers
Almonds
CauliflowerOranges
Jute and other bastfibres Sisal & other textile fibres of agave
Oats
No apparent potential
Barley
Ginger
Avocados Tang. mand. clement.Chillies & peppers, greenLettuce Broad beans, green Cantaloupes & melons Papayas
Coffee, green
Export development Import substitution and
Export development
Import substitution
Product sectors
Spices
Nuts
Fruits and vegetables
Fibre crops
Coffee, tea
Cereals, grains, beans, peas & pulses
CabbagesCarrots
Tea
Peas, dry
Garlic
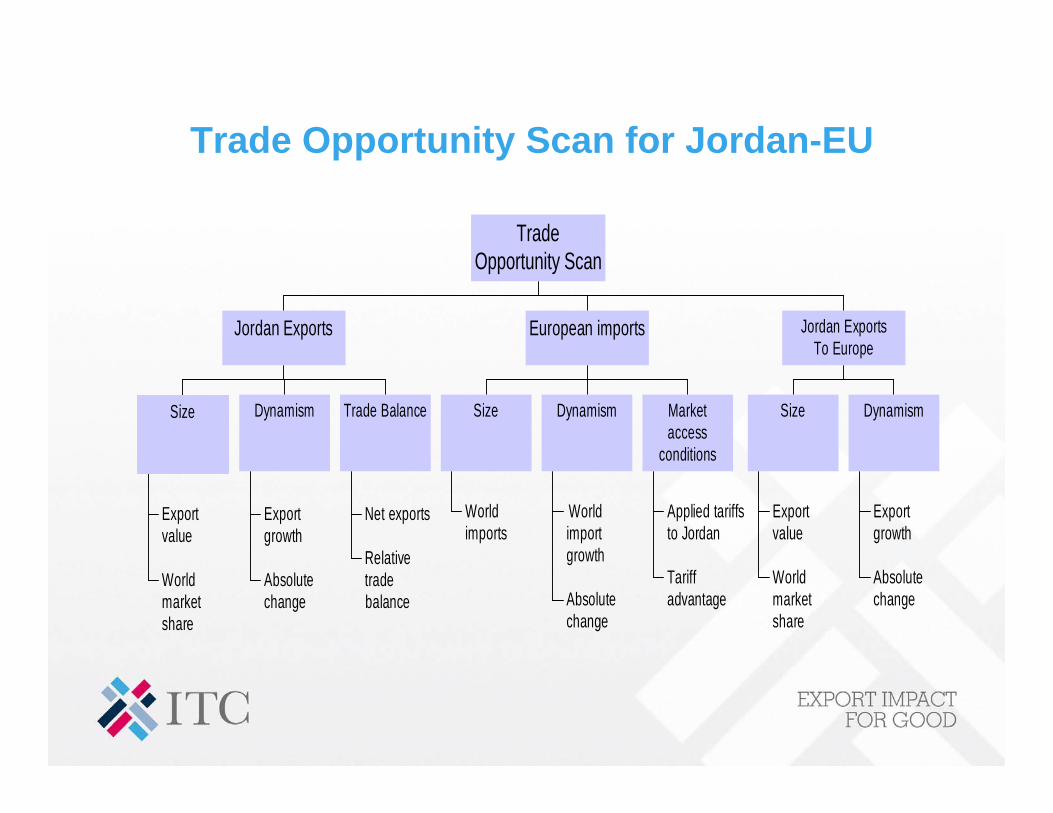
Exportvalue
Worldmarketshare
Size
Exportgrowth
Absolutechange
Dynamism
Net exports
Relativetradebalance
Trade Balance
Jordan Exports
Worldimports
Size
Worldimportgrowth
Absolutechange
Dynamism
Applied tariffsto Jordan
Tariffadvantage
Marketaccess
conditions
European imports
Exportvalue
Worldmarketshare
Size
Exportgrowth
Absolutechange
Dynamism
Jordan ExportsTo Europe
TradeOpportunity Scan
Trade Opportunity Scan for Jordan-EU

Jordan export index vs Europe import index
Low Europe market index,but high Jordan export index:
Fertilizers (2, 87)Salt/ sulphur/ earth/ stone/ plaster/ lime and cement (3, 66)Inorganic chemicals (5, 72)Vegetables (6, 69)Lead (8, 33)Pearls/ precious stones (8, 33)Fats and oils (10, 66)Nickel (13, 45)Copper (15, 49)Silk (15, 80)(…)
Low Europe marketand Jordan export indices:
Remaining product groups
Low Europeimport index
High Europe market and Jordan exportindices:
Garments (knit) (1, 15)Garments (not knit) (3, 9)Pharmaceutical prod. (7, 1)Aluminium (11, 24)Dairy prod. (12, 24)Ores/ slag/ ash (13, 17)Floating structures (Ships/boats) (15, 12)Other base metals (15, 19)Organic chemicals (21, 11)Prod. of animal origin (21, 19)(…)
High Europe market index,but low Jordan export:
Electronic equipment (35, 5)Meat and fish prep. (38, 15)Cereal and flour prod. (41, 19)Fruits and nuts (46, 19)Plastics (50, 5)Cocoa prod. (63, 17)Essential oils (66, 24)Paper (66, 12)Apparatus (72, 7)Art. of iron or steel (72, 10)(…)
High (top 30)
Europe import index
High (top 30) Jordan’s export indexLow Jordan’s export index
Rank of Europe import Index
Rank of Jordan Export Index
*Product groups in red indicates Jordan exports to Europe.
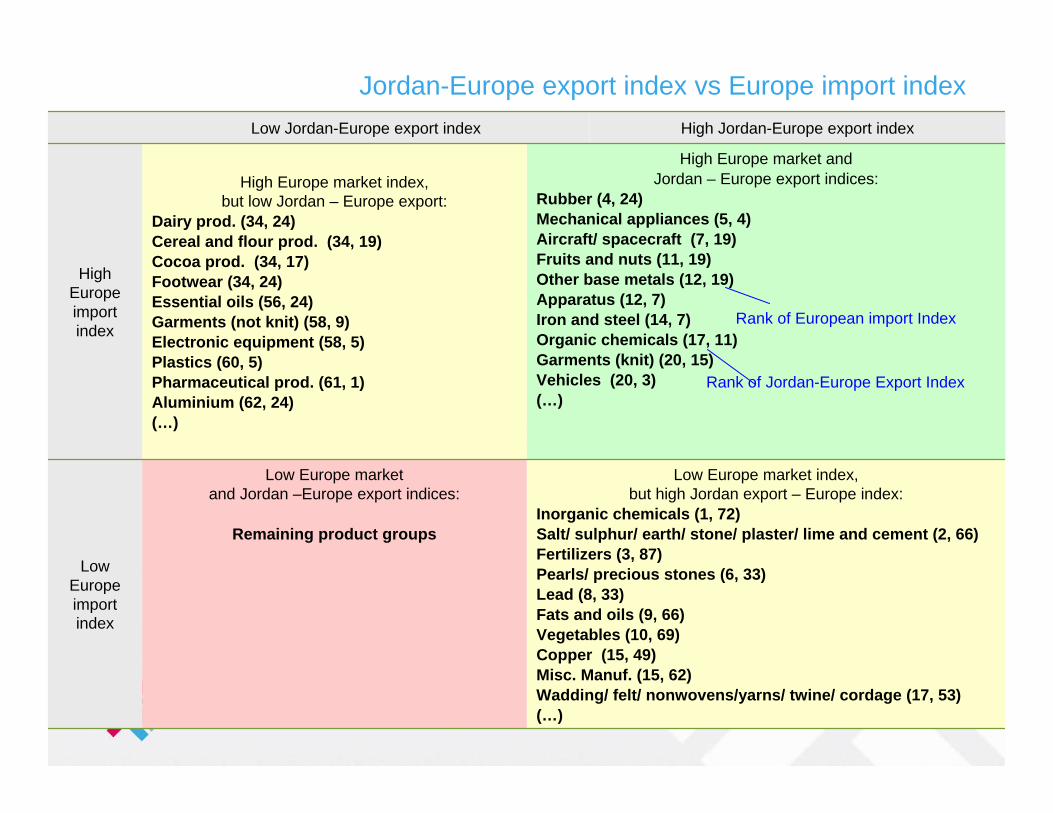
Jordan-Europe export index vs Europe import index
Low Europe market index,but high Jordan export – Europe index:
Inorganic chemicals (1, 72)Salt/ sulphur/ earth/ stone/ plaster/ lime and cement (2, 66)Fertilizers (3, 87)Pearls/ precious stones (6, 33)Lead (8, 33)Fats and oils (9, 66)Vegetables (10, 69)Copper (15, 49)Misc. Manuf. (15, 62)Wadding/ felt/ nonwovens/yarns/ twine/ cordage (17, 53)(…)
Low Europe marketand Jordan –Europe export indices:
Remaining product groups
Low Europe import index
High Europe market and Jordan – Europe export indices:
Rubber (4, 24)Mechanical appliances (5, 4)Aircraft/ spacecraft (7, 19)Fruits and nuts (11, 19)Other base metals (12, 19)Apparatus (12, 7)Iron and steel (14, 7)Organic chemicals (17, 11)Garments (knit) (20, 15)Vehicles (20, 3)(…)
High Europe market index,but low Jordan – Europe export:
Dairy prod. (34, 24)Cereal and flour prod. (34, 19)Cocoa prod. (34, 17)Footwear (34, 24)Essential oils (56, 24)Garments (not knit) (58, 9)Electronic equipment (58, 5)Plastics (60, 5)Pharmaceutical prod. (61, 1)Aluminium (62, 24)(…)
High Europe import index
High Jordan-Europe export indexLow Jordan-Europe export index
Rank of European import Index
Rank of Jordan-Europe Export Index

Viet Nam
Trade Competitiveness AssessmentExport Potential Assessment
Studies of the Market Analysis and Research Team
Lao PDR
Kazakhstan
Nepal
Romania
Uruguay Botswana
Zambia
Cambodia
Mongolia
Ghana
Jordan
Oman
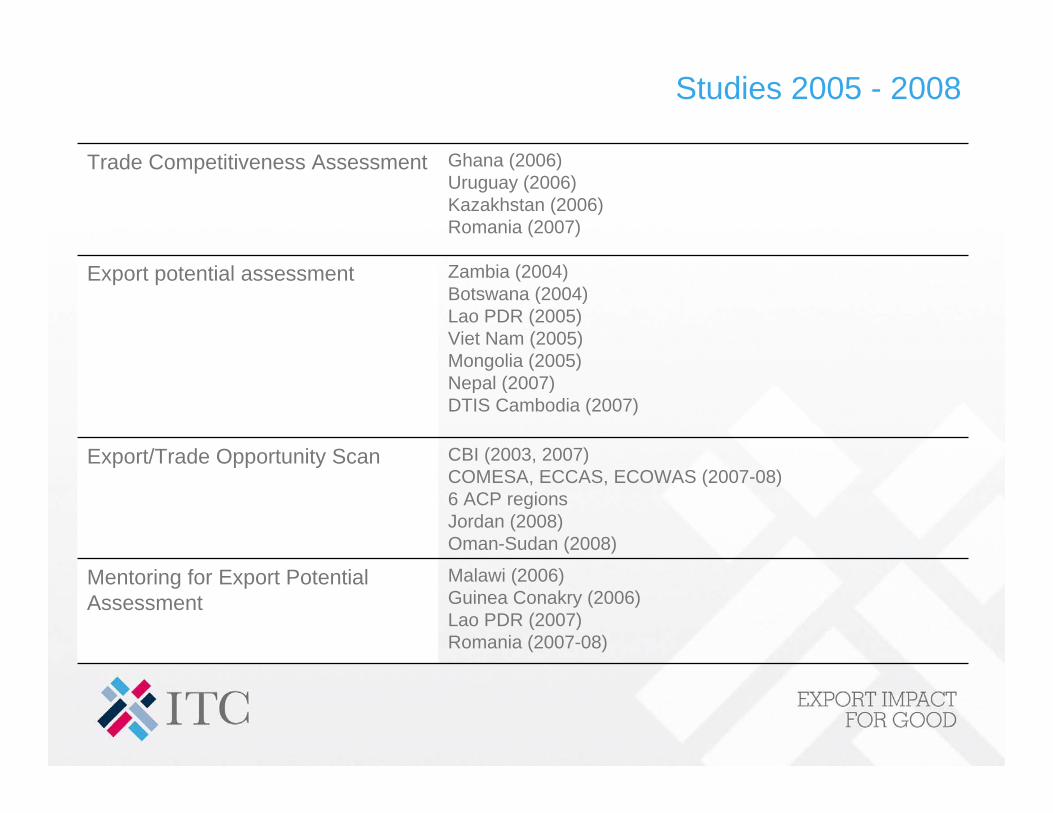
Studies 2005 - 2008
Ghana (2006)Uruguay (2006) Kazakhstan (2006) Romania (2007)
Trade Competitiveness Assessment
Malawi (2006) Guinea Conakry (2006) Lao PDR (2007)Romania (2007-08)
Mentoring for Export Potential Assessment
CBI (2003, 2007)COMESA, ECCAS, ECOWAS (2007-08)6 ACP regionsJordan (2008)Oman-Sudan (2008)
Export/Trade Opportunity Scan
Zambia (2004) Botswana (2004) Lao PDR (2005)Viet Nam (2005)Mongolia (2005) Nepal (2007)DTIS Cambodia (2007)
Export potential assessment

Thank you for your attention