it2.weebly.com applied ict 9713it2.weebly.com/uploads/1/4/7/2/1472680/as_ict__chapter_11.pdf ·...
TRANSCRIPT

IT2.weebly.com Applied ICT 9713
Chapter 11 Database and charts
You already know how to o define database record structures o enter data into a database o select subsets of data within a database o sort data within a database o produce and export reports for use within another package o produce and label graphs and charts from a charting package o create, rename and delete files using an operating system o Access folders/directories within the operating system.
In this chapter you will learn how to:
1. design and create the most efficient database structure to solve a problem 2. link data tables by creating and using relationships 3. understand the importance of accurate data entry 4. check data entry using validation and verification 5. select subsets, of data using multiple criteria 6. sort data in a database using multiple criteria 7. enter formulae to calculate results 8. use the display features of the database to produce a report 9. group data 10. summaries data 11. export data using different file formats 12. produce an appropriate type of graph or chart with suitable labels 13. add and edit data series and axes in a graph or chart.
11.1 Introduction and terminology Data storage A single data item is known as a field. Each field has a Specified type (e.g. it may contain numbers, text, a date, etc.). A record is a collection of fields (which may be of different data types) containing information about one person or one object. In terms of a database, a file is a logically organized collection of records. MS Access stores its data in the form of tables, which are organized by rows and columns. Each row of the table contains a record. Each column in the table represents a field and each cell in that column has the same (pre-defined) field type. Within Access several tables can be stored in a single database. Here is an example of a small data table containing three records and five fields:
IT2.weebly.com Applied ICT 9713
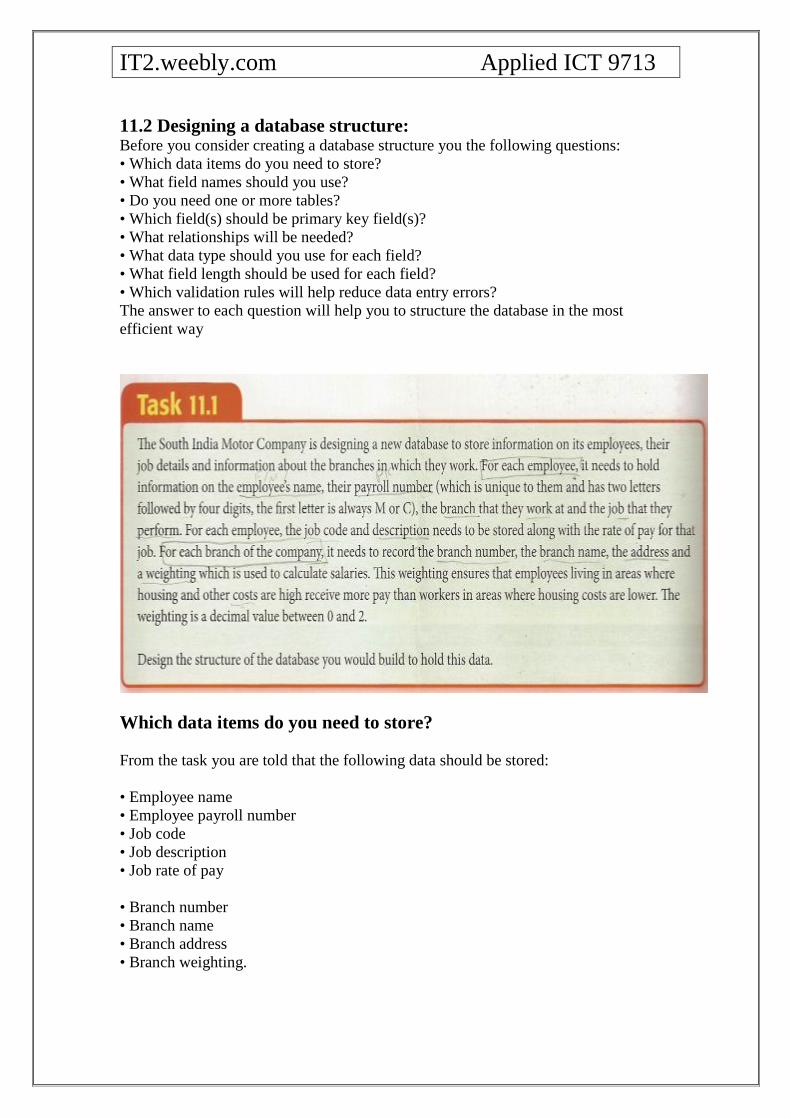
11.2 Designing a database structure: Before you consider creating a database structure you the following questions: • Which data items do you need to store? • What field names should you use? • Do you need one or more tables? • Which field(s) should be primary key field(s)? • What relationships will be needed? • What data type should you use for each field? • What field length should be used for each field? • Which validation rules will help reduce data entry errors? The answer to each question will help you to structure the database in the most efficient way
Which data items do you need to store? From the task you are told that the following data should be stored: • Employee name • Employee payroll number • Job code • Job description • Job rate of pay • Branch number • Branch name • Branch address • Branch weighting.
IT2.weebly.com Applied ICT 9713
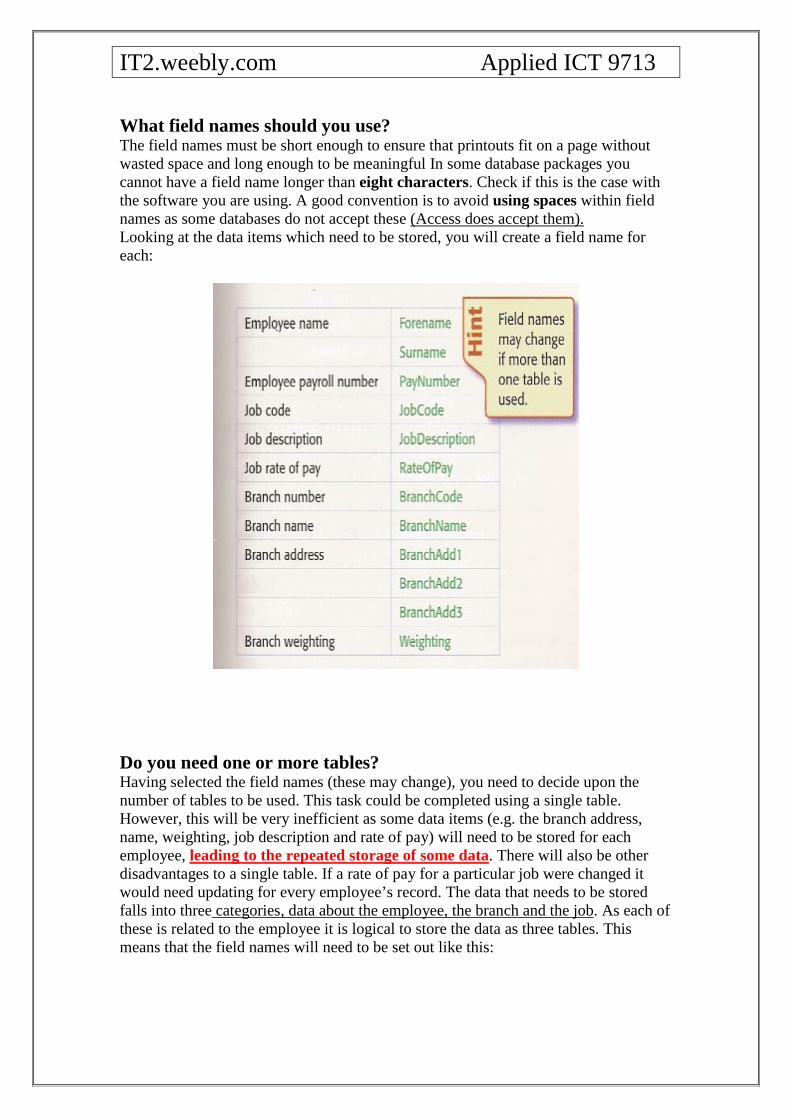
What field names should you use? The field names must be short enough to ensure that printouts fit on a page without wasted space and long enough to be meaningful In some database packages you cannot have a field name longer than eight characters. Check if this is the case with the software you are using. A good convention is to avoid using spaces within field names as some databases do not accept these (Access does accept them). Looking at the data items which need to be stored, you will create a field name for each:
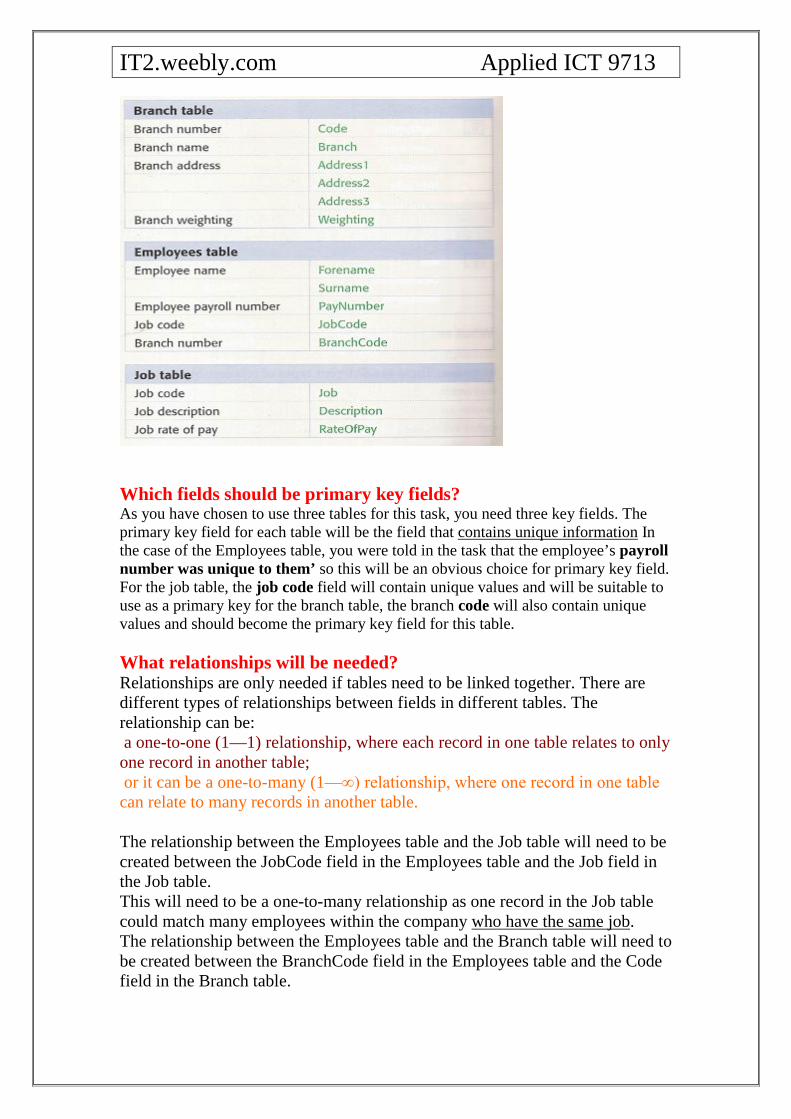
Do you need one or more tables? Having selected the field names (these may change), you need to decide upon the number of tables to be used. This task could be completed using a single table. However, this will be very inefficient as some data items (e.g. the branch address, name, weighting, job description and rate of pay) will need to be stored for each employee, leading to the repeated storage of some data. There will also be other disadvantages to a single table. If a rate of pay for a particular job were changed it would need updating for every employee’s record. The data that needs to be stored falls into three categories, data about the employee, the branch and the job. As each of these is related to the employee it is logical to store the data as three tables. This means that the field names will need to be set out like this:
IT2.weebly.com Applied ICT 9713
Which fields should be primary key fields? As you have chosen to use three tables for this task, you need three key fields. The primary key field for each table will be the field that contains unique information In the case of the Employees table, you were told in the task that the employee’s payroll number was unique to them’ so this will be an obvious choice for primary key field. For the job table, the job code field will contain unique values and will be suitable to use as a primary key for the branch table, the branch code will also contain unique values and should become the primary key field for this table. What relationships will be needed? Relationships are only needed if tables need to be linked together. There are different types of relationships between fields in different tables. The relationship can be: a one-to-one (1—1) relationship, where each record in one table relates to only one record in another table; or it can be a one-to-many (1—∞) relationship, where one record in one table can relate to many records in another table. The relationship between the Employees table and the Job table will need to be created between the JobCode field in the Employees table and the Job field in the Job table. This will need to be a one-to-many relationship as one record in the Job table could match many employees within the company who have the same job. The relationship between the Employees table and the Branch table will need to be created between the BranchCode field in the Employees table and the Code field in the Branch table.
IT2.weebly.com Applied ICT 9713
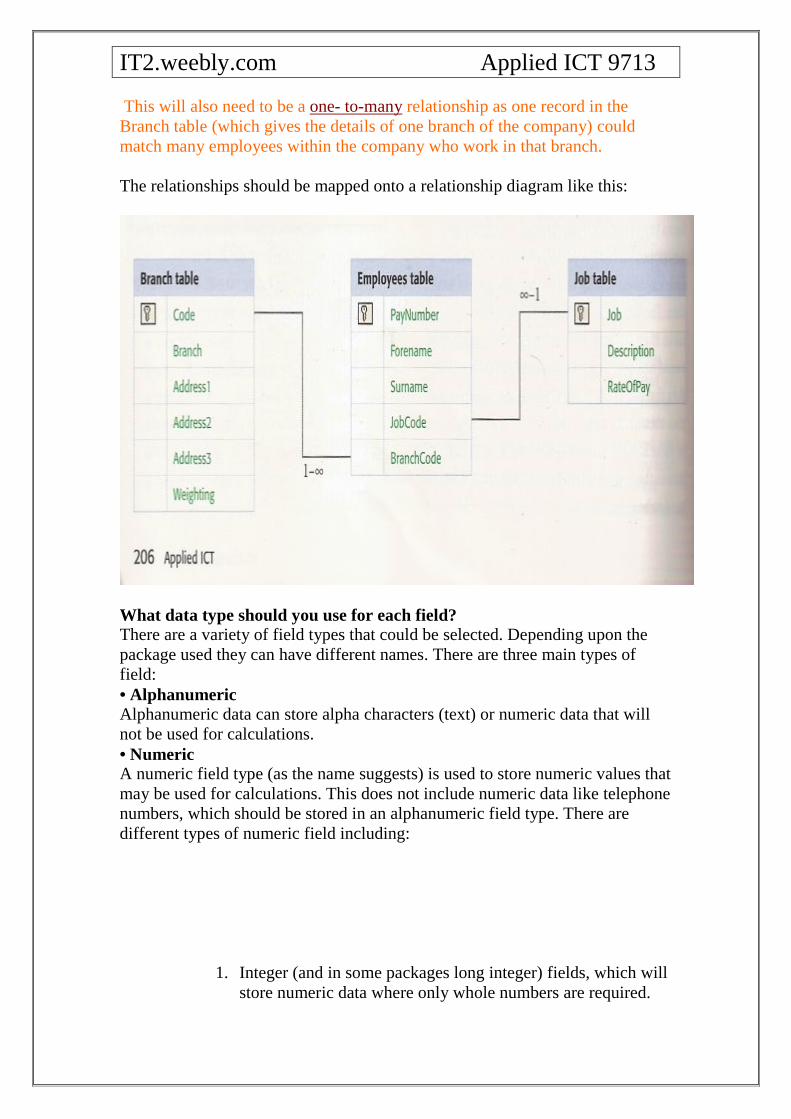
This will also need to be a one- to-many relationship as one record in the Branch table (which gives the details of one branch of the company) could match many employees within the company who work in that branch. The relationships should be mapped onto a relationship diagram like this:
What data type should you use for each field? There are a variety of field types that could be selected. Depending upon the package used they can have different names. There are three main types of field: • Alphanumeric Alphanumeric data can store alpha characters (text) or numeric data that will not be used for calculations. • Numeric A numeric field type (as the name suggests) is used to store numeric values that may be used for calculations. This does not include numeric data like telephone numbers, which should be stored in an alphanumeric field type. There are different types of numeric field including:
1. Integer (and in some packages long integer) fields, which will store numeric data where only whole numbers are required.
IT2.weebly.com Applied ICT 9713
2. Decimal formats, which will allow a large number of decimal places,
3. Currency values, which allow currency formatting to be added to the display.
• Boolean A Boolean (sometimes called logical) field type used where a Yes/No (or True/False, 0/1) response required. There are other field types as well, like memo, date and time. These may not be available in all packages. In order to select the correct field type you will have to look carefully at the data which will be stored. For the Employees table, the payroll number contains ha characters as well as numeric characters so must be set as an alphanumeric field. In Access this has been called "text". What field length should be used for each field? Access uses a ‘text’ field type to hold alphanumeric data. In Access, only text fields require their lengths to be set. The field will be set with the shortest possible length, so that valuable storage capacity is not wasted. The most efficient method of calculating the length of any field is to look at the data, find the longest data item and count the number of characters. This count must include spaces. Note down the field lengths that you will require for each field. Some field lengths can be obtained from the information given, for example in Task 11.1 the PayNumber needs to be set to six characters in length, as you are told in the task that the payroll number ‘is unique to them and has two letters followed by four digits: If the data for the JobDescription field is analysed for this company and the longest data item is ‘Systems Analyst and Programmer the field length would need to be set to 30 characters. This was found by counting all the characters (including the spaces). Which validation rules will help reduce data entry errors? Look at each field and see if there are validation rules that could be applied to reduce data entry errors. These validation rules could include a range check, which checks that data fits within a specified range. A good example of this will be the weighting field in the branch table. The weighting must be between 0 and 2 (but cannot be equal to either of these values) so a rule could be applied to this field such that 0 <weighting < 2. A length check may be used to make sure that a field has the correct number of characters, for example the PayNumber field in the Employees table must be two letters, followed by four digits. This could be done by setting a validation rule to check that six characters only are entered and that the first character is M or C. The rule for
IT2.weebly.com Applied ICT 9713
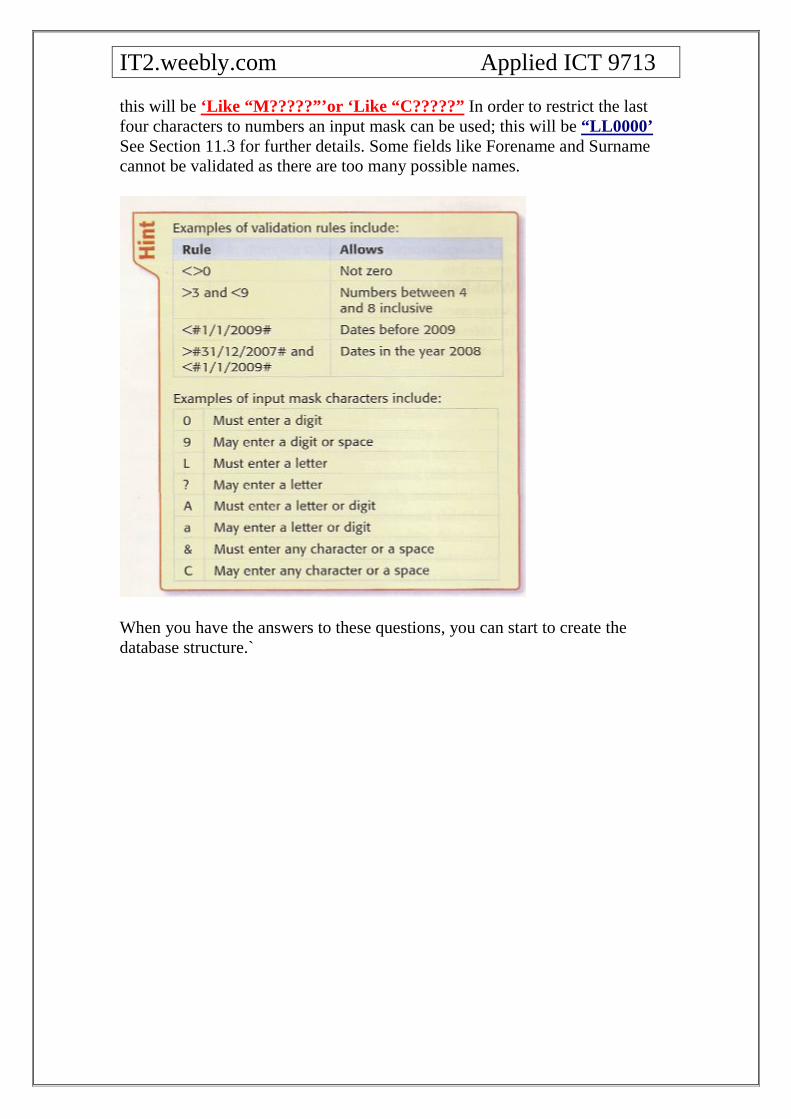
this will be ‘Like “M?????”’or ‘Like “C?????” In order to restrict the last four characters to numbers an input mask can be used; this will be “LL0000’ See Section 11.3 for further details. Some fields like Forename and Surname cannot be validated as there are too many possible names.
When you have the answers to these questions, you can start to create the database structure.`
IT2.weebly.com Applied ICT 9713
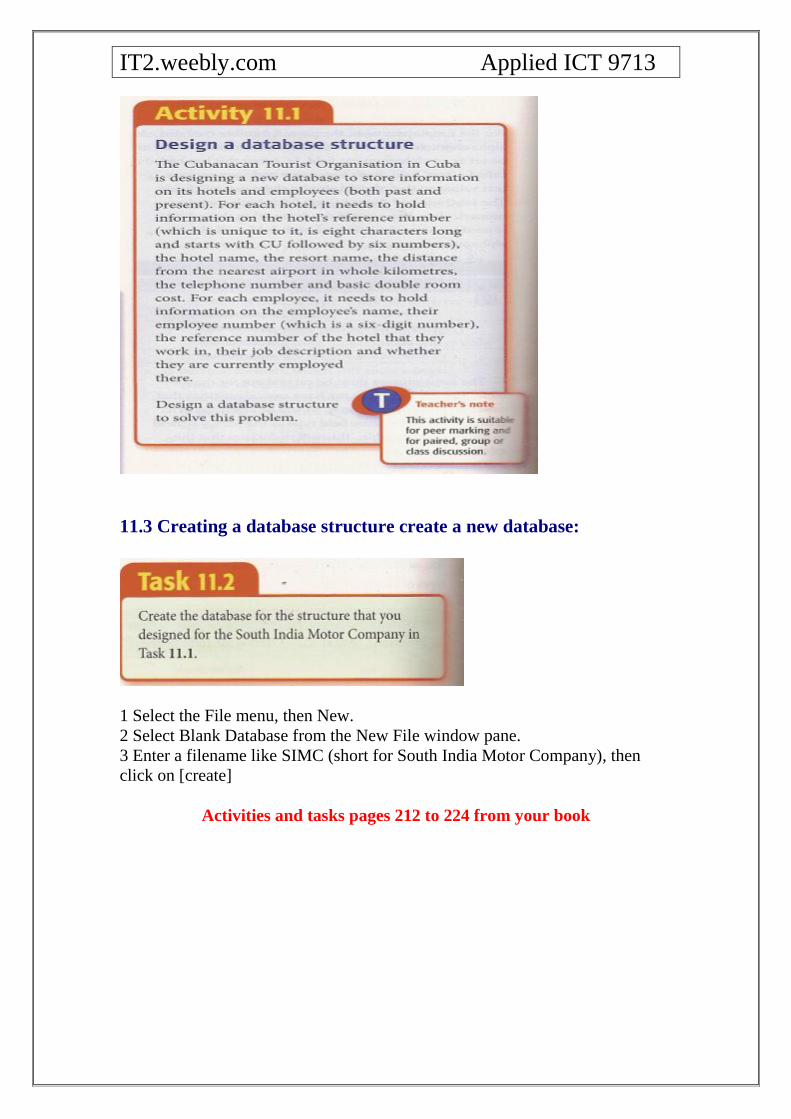
11.3 Creating a database structure create a new database:
1 Select the File menu, then New. 2 Select Blank Database from the New File window pane. 3 Enter a filename like SIMC (short for South India Motor Company), then click on [create]
Activities and tasks pages 212 to 224 from your book

IT2.weebly.com Applied ICT 9713
/ 11.9 Outputting data in Access: You started to look at the structure of Access reports in Section 11.8 when you added a calculated control to a report. However, we did not cover the structures of these reports in depth. This section will give more detail to this area. Access report structure: When you look at the design view of an Access report, you can see that it has five sections: Report Header, Page Header, Detail, Page Footer and Report Footer. Some information needs to appear on every page (e.g. field names) and other information is only required at the start or end of the entire document. only once at the end of the document (like the calculated control in Section 11.8) are placed in the Report Footer. The Detail section of the report is used for the individual records within the report. Controls can be moved from one section of the report to another by dragging and dropping them. It is sensible to do this by moving the control and its label at the same time. These are selected together by holding down the <Shift> key whilst selecting the second item. The features of each calculated control can be changed using the properties window. Many of these features will be required for the practical examinations, including changing many font features like the font style, enhancements, size and alignment. These are amended here.
The properties window can also be used to hide objects. Setting the Visible property to No will make the control invisible.
IT2.weebly.com Applied ICT 9713
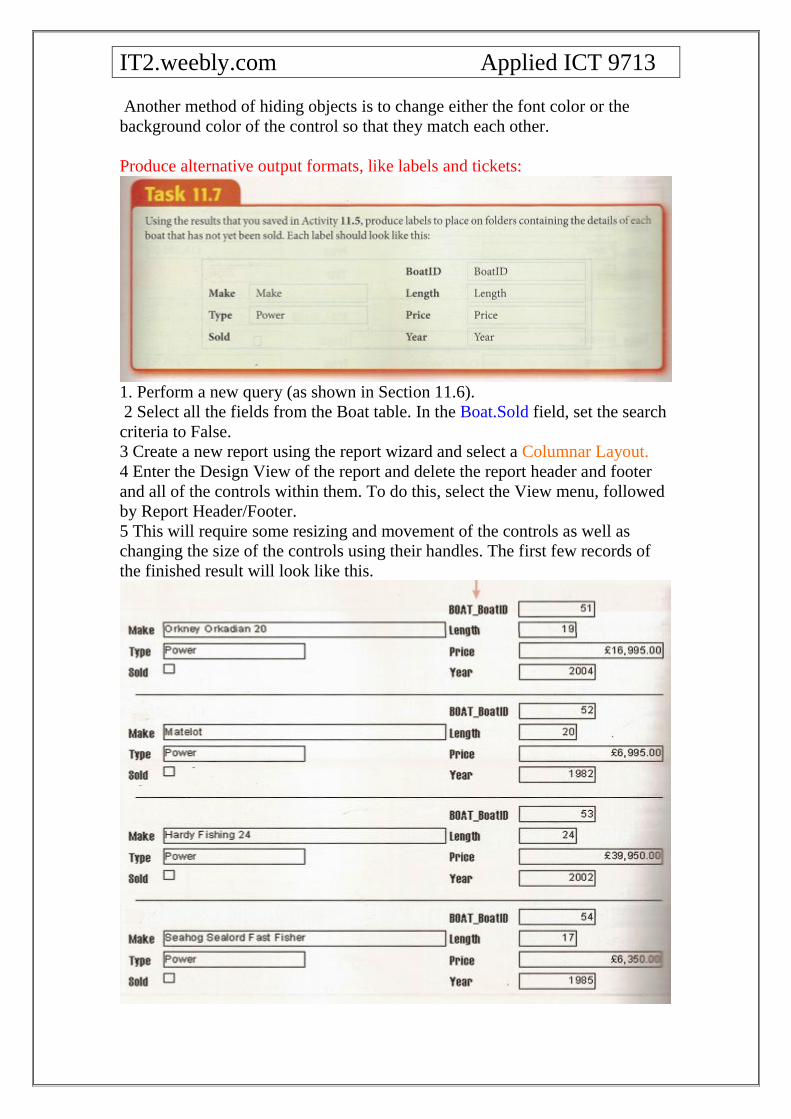
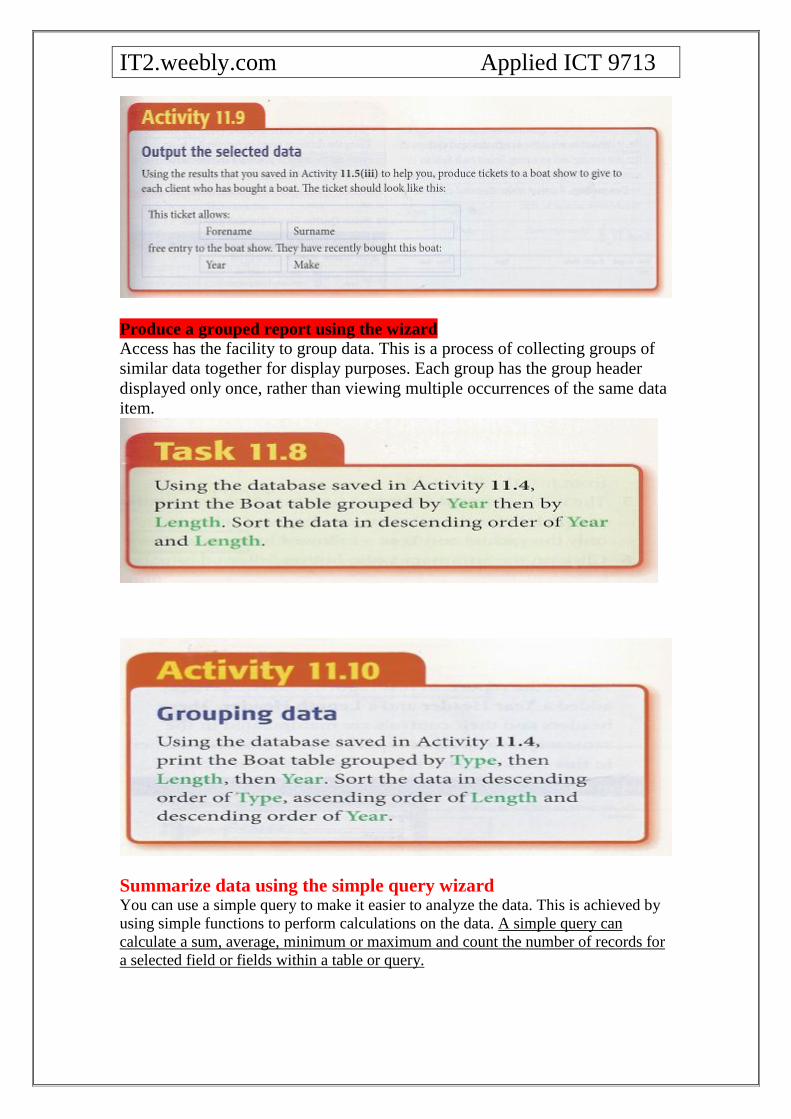
Another method of hiding objects is to change either the font color or the background color of the control so that they match each other. Produce alternative output formats, like labels and tickets:
1. Perform a new query (as shown in Section 11.6). 2 Select all the fields from the Boat table. In the Boat.Sold field, set the search criteria to False. 3 Create a new report using the report wizard and select a Columnar Layout. 4 Enter the Design View of the report and delete the report header and footer and all of the controls within them. To do this, select the View menu, followed by Report Header/Footer. 5 This will require some resizing and movement of the controls as well as changing the size of the controls using their handles. The first few records of the finished result will look like this.
IT2.weebly.com Applied ICT 9713
Produce a grouped report using the wizard Access has the facility to group data. This is a process of collecting groups of similar data together for display purposes. Each group has the group header displayed only once, rather than viewing multiple occurrences of the same data item.
Summarize data using the simple query wizard You can use a simple query to make it easier to analyze the data. This is achieved by using simple functions to perform calculations on the data. A simple query can calculate a sum, average, minimum or maximum and count the number of records for a selected field or fields within a table or query.

IT2.weebly.com Applied ICT 9713
1 Select Queries from the available options. (Database objects). 2. Select create query by using wizard 3 Select the table (or other query) that you wish to use for the search. In this example, the data will come from just the Boat table. 4 The fields required must be selected — in this case Price (for the calculation), Type (to select only the yachts) and Year — followed by Next. 5 Click on the Summary radio button followed by Summary Option. 6 The Summary Options window is where the calculations are performed. Click on the tick box for the function that you require for each field. In this case you want the average price . 7 When you have selected all of the required options. Click on OK, then Next. 8 Name the query, ensure that the radio button for Modify the query design is chosen, then click on finish. 9 Set the criteria line for the Type field to “Yacht” to select only the yachts. Remove the tick from the Show tick box for the Type field.
Summarise data using crosstab queries You use a crosstab query to make it easier to analyse the data in two
dimensions, by restructuring and calculating the data. A crosstab query can calculate a sum, average, count or other type of total for data that is grouped by two types of information.
This produces a two-dimensional grid which has one type of information down the left-hand side of a datasheet and another across the top, with summary data between.

IT2.weebly.com Applied ICT 9713
Before starting to attempt any question using a crosstab query it is important to
identify the row headings, column headings and data to be summarized.
Before you start using the computer, it is often easier to sketch a planning
diagram for the layout of the crosstab. In this task you are asked to produce a result similar to this:
The row headings will be Types of boats And the column headings will be the Years. The calculation to be performed will be the counting of the boats. Summarise data using the crosstab query wizard 1 Select Queries from the available options. 2 Click on New to allow you to select the type of query that the wizard will perform. 3 Select the Crosstab Query Wizard then OK 4 Select the source from which to extract the fields for the crosstab query. In this case all of the data will be extracted from the Boat table, so this table should be selected followed by Next> 5 Select the field to be used for the row headings (use the planning diagram that you sketched to help you). In this case it is Type. Then click on Next> 6 Using the planning diagram select the field for the column headings, in this case Year, then click on Next>
IT2.weebly.com Applied ICT 9713
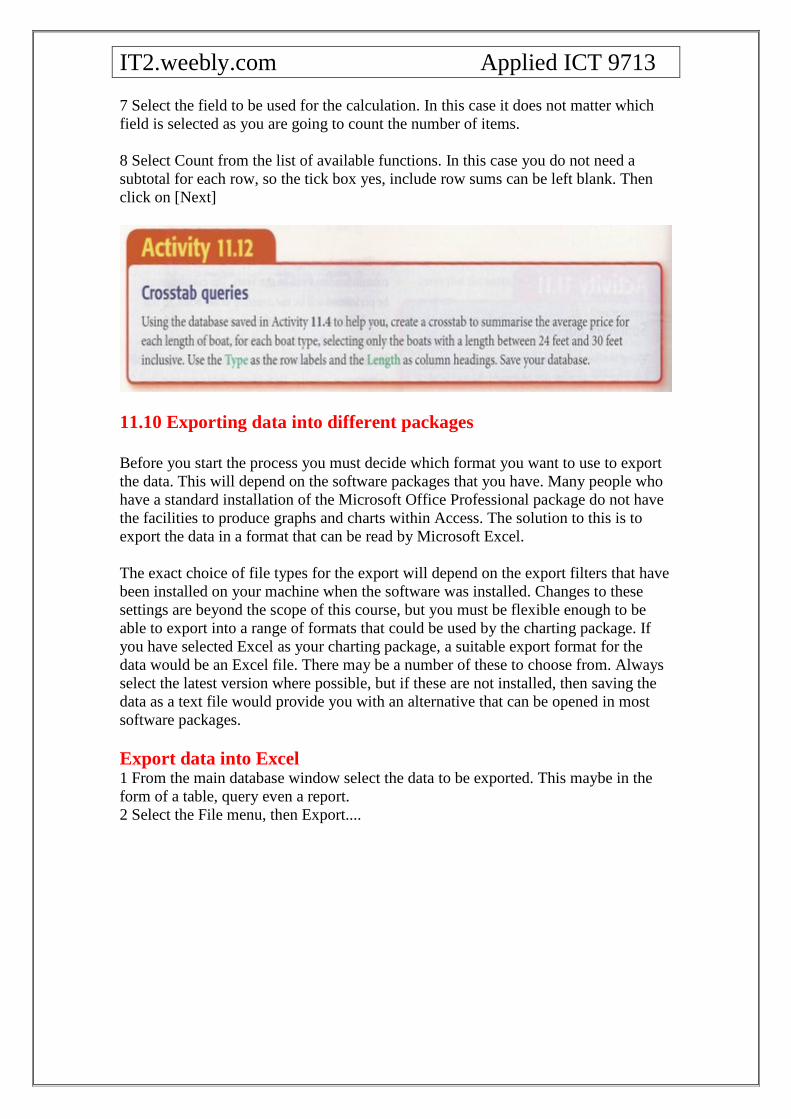
7 Select the field to be used for the calculation. In this case it does not matter which field is selected as you are going to count the number of items. 8 Select Count from the list of available functions. In this case you do not need a subtotal for each row, so the tick box yes, include row sums can be left blank. Then click on [Next]
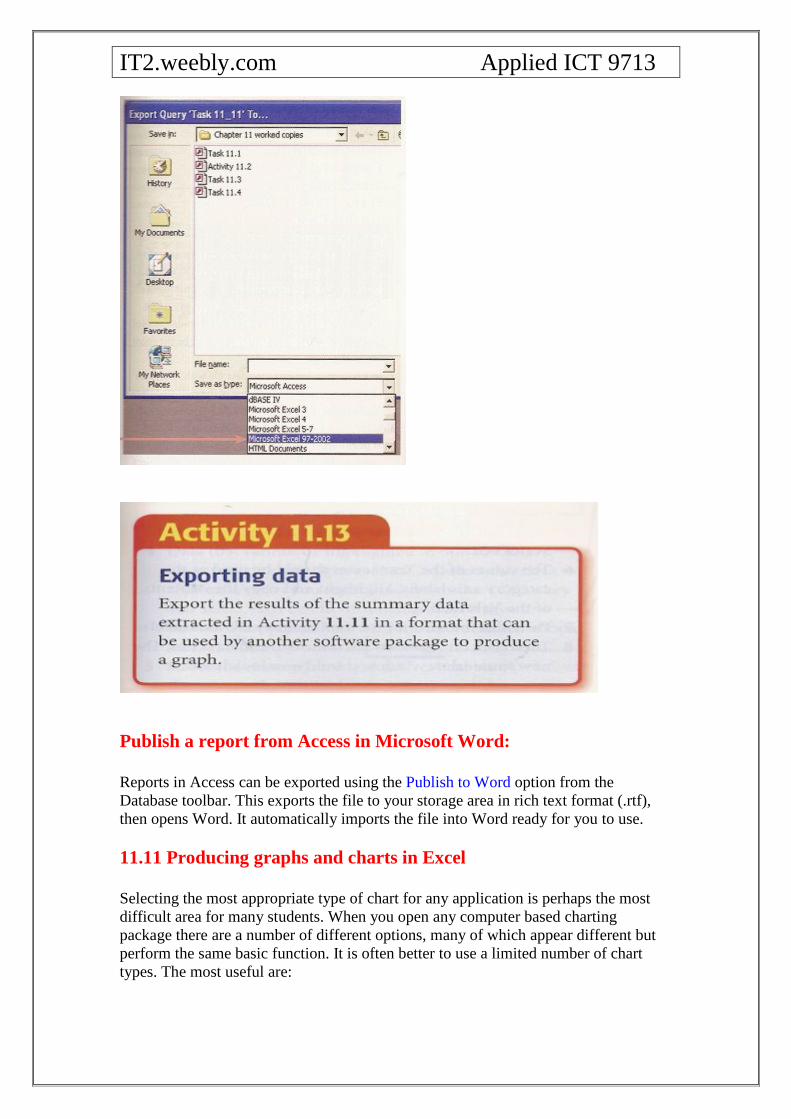
11.10 Exporting data into different packages Before you start the process you must decide which format you want to use to export the data. This will depend on the software packages that you have. Many people who have a standard installation of the Microsoft Office Professional package do not have the facilities to produce graphs and charts within Access. The solution to this is to export the data in a format that can be read by Microsoft Excel. The exact choice of file types for the export will depend on the export filters that have been installed on your machine when the software was installed. Changes to these settings are beyond the scope of this course, but you must be flexible enough to be able to export into a range of formats that could be used by the charting package. If you have selected Excel as your charting package, a suitable export format for the data would be an Excel file. There may be a number of these to choose from. Always select the latest version where possible, but if these are not installed, then saving the data as a text file would provide you with an alternative that can be opened in most software packages. Export data into Excel 1 From the main database window select the data to be exported. This maybe in the form of a table, query even a report. 2 Select the File menu, then Export....
IT2.weebly.com Applied ICT 9713
Publish a report from Access in Microsoft Word: Reports in Access can be exported using the Publish to Word option from the Database toolbar. This exports the file to your storage area in rich text format (.rtf), then opens Word. It automatically imports the file into Word ready for you to use. 11.11 Producing graphs and charts in Excel Selecting the most appropriate type of chart for any application is perhaps the most difficult area for many students. When you open any computer based charting package there are a number of different options, many of which appear different but perform the same basic function. It is often better to use a limited number of chart types. The most useful are:
IT2.weebly.com Applied ICT 9713
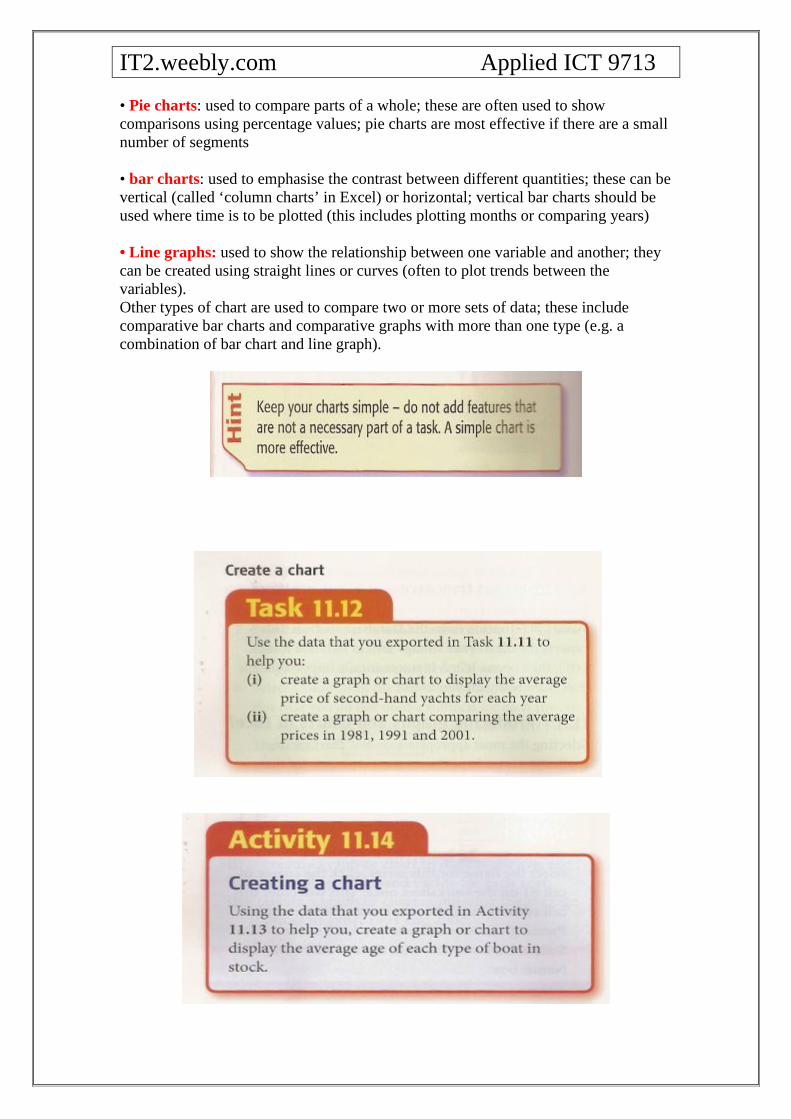
• Pie charts: used to compare parts of a whole; these are often used to show comparisons using percentage values; pie charts are most effective if there are a small number of segments • bar charts: used to emphasise the contrast between different quantities; these can be vertical (called ‘column charts’ in Excel) or horizontal; vertical bar charts should be used where time is to be plotted (this includes plotting months or comparing years) • Line graphs: used to show the relationship between one variable and another; they can be created using straight lines or curves (often to plot trends between the variables). Other types of chart are used to compare two or more sets of data; these include comparative bar charts and comparative graphs with more than one type (e.g. a combination of bar chart and line graph).
IT2.weebly.com Applied ICT 9713
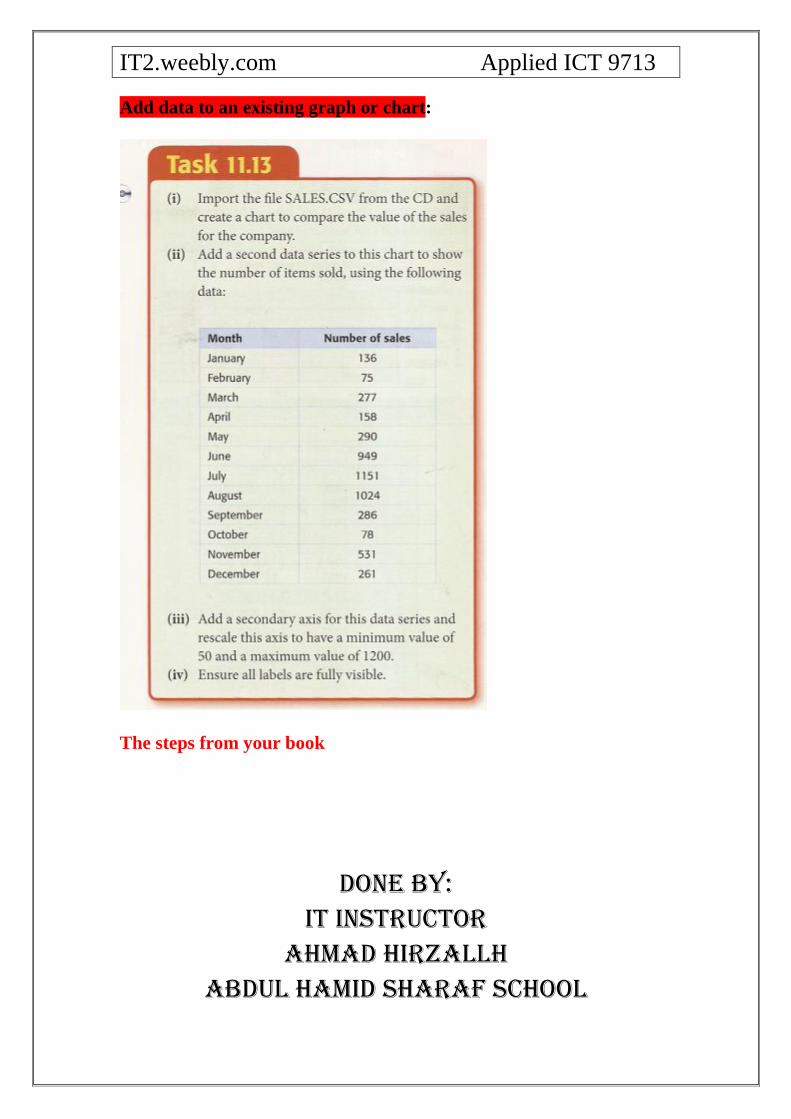
Add data to an existing graph or chart:
The steps from your book
Done by: IT Instructor
Ahmad Hirzallh Abdul Hamid Sharaf School

IT2.weebly.com Applied ICT 9713