it summit - modernizing enterprise analytics: the it story
TRANSCRIPT

Modernizing Enterprise AnalyticsThe IT Story
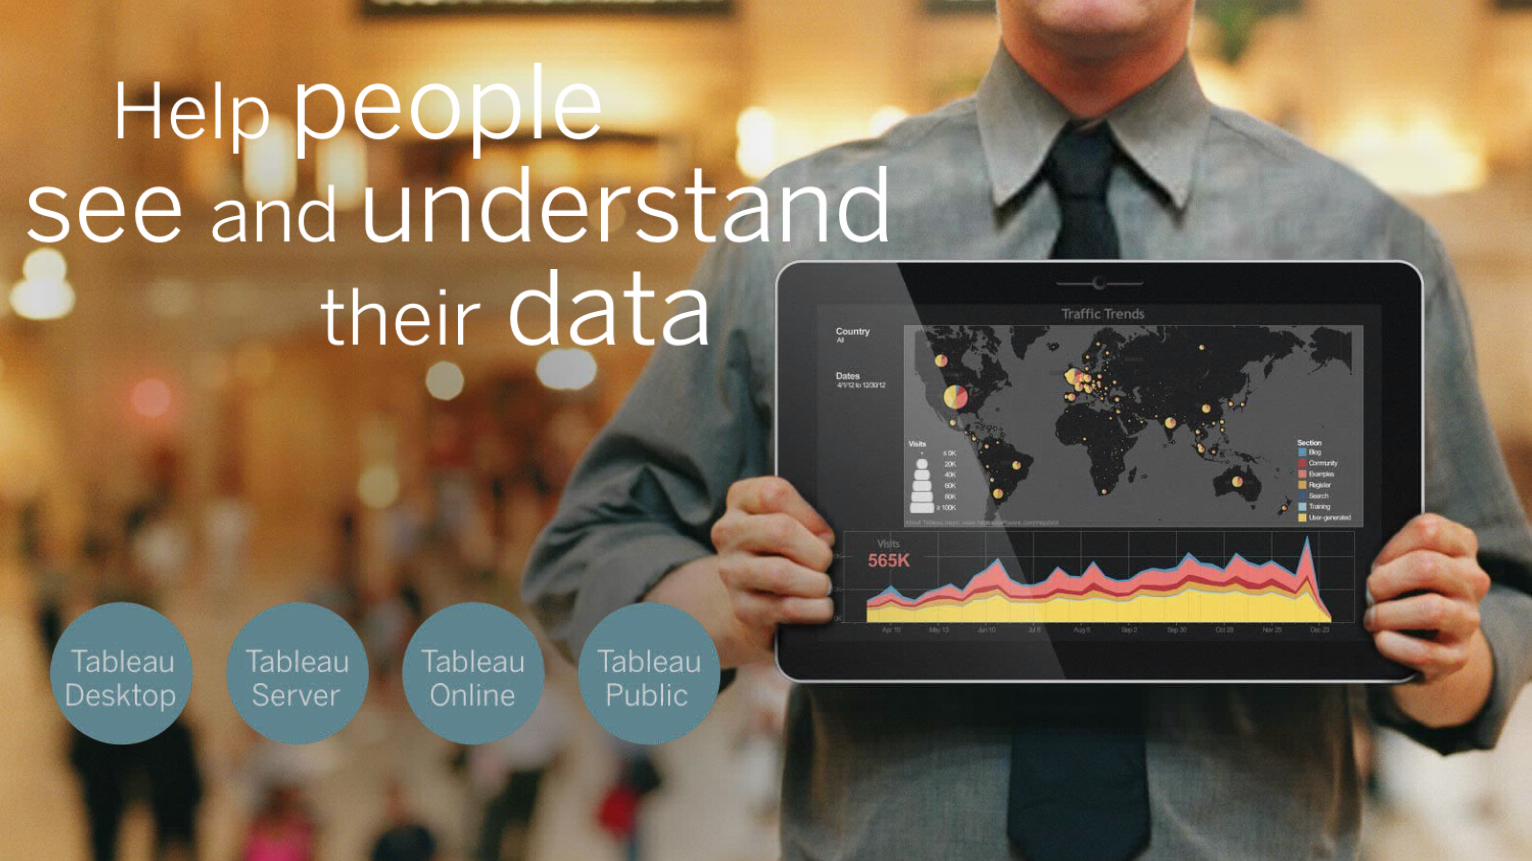
Tableau overview

Tell me and I forget;Show me and I may remember;Involve me and I’ll understand.
Chinese Proverb

The people who know the data should be empowered to ask questions of the data

old school
old school
People are smart and computers are tools to augment their intelligence and creativity

break free
Flow, flexibility, and freedomare the keys to creative
thinking

Driving change not just discovering insights
We can’t solve problems by using the same kind of thinking we used when we created them.
Albert Einstein

Culture of Analytics

Change isn’t coming. It’s here.
Business users are demanding self service…wherever they are.
Their data is everywhere and they have questions.Databases Big Data Spreadsheets Application Data Cloud

Self-service @ scale
Data Visual Analytics Cloud
Mobile Fast, easy, beautiful

Transformation is happening now….
People Process
Technology
0100010001000001
DATA0100000101010100
We need to re-imagine our IT processes and how we support our business
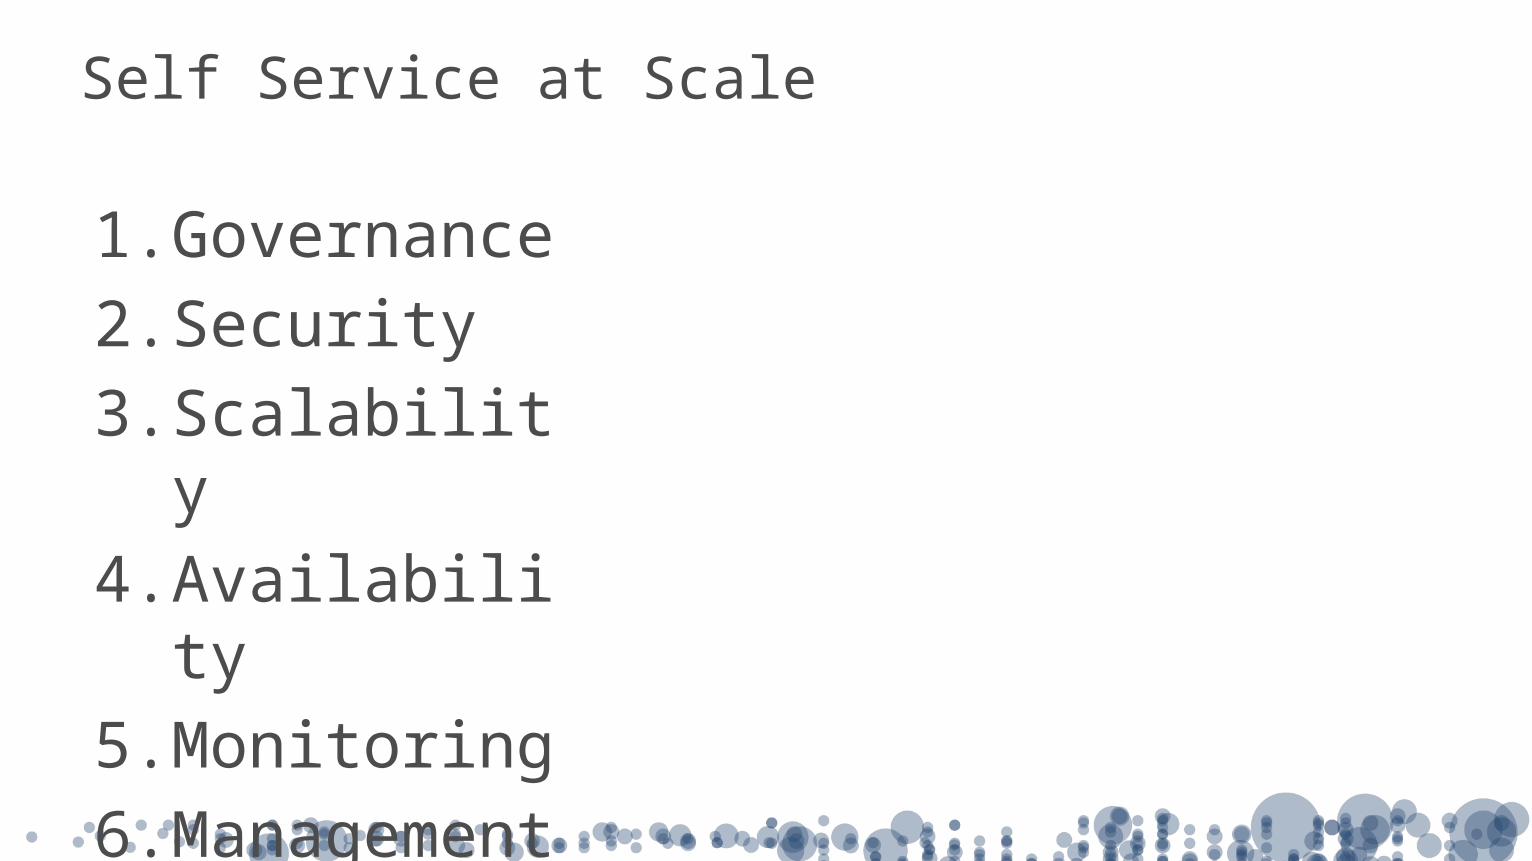
1. Governance2. Security3. Scalability 4. Availability 5. Monitoring 6. Management
Self Service at Scale

The Trial…You download the server trial, start installer, hits “Next” a bunch of times
You have a Tableau Server!! Now what??

A Day In the Life of ITFrom Getting Started to Enterprise

Network, Storage
Infrastructure Systems
Application / Services
Mon
itorin
g, M
anag
emen
t, G
over
nanc
e, S
cala
bilit
y, A
vaila
bilit
y,
Sec
urity
Service Desk (ITIL)
AP
Is /
Ext
ensi
bilit
y /
Inte
grat
ion
In IT We have too much on our plate.
Infrastructure teams are driving toward private clouds, embracing converged infrastructure and have little time to understand every application they have to deploy, monitor and manage. Every application needs integration to the enterprise technology fabric that takes time and effort. And all of this needs to be monitored and managed end to end.

Tableau ServerData Clients
Command LineTools
Browser/Mobile
Tableau DesktopSQL
User Tier
Storage Tier
ManagementTier

Tableau ServerData Clients
Base InstallResponsible for monitoring various components, detecting failures, and executing failover when needed.In distributed installations, responsible for ensuring there is a quorum for making decisions during failover.Manages the licensing of Tableau Server through periodic compliance checks.
Command LineTools
Browser/Mobile
Tableau Desktop
SQL
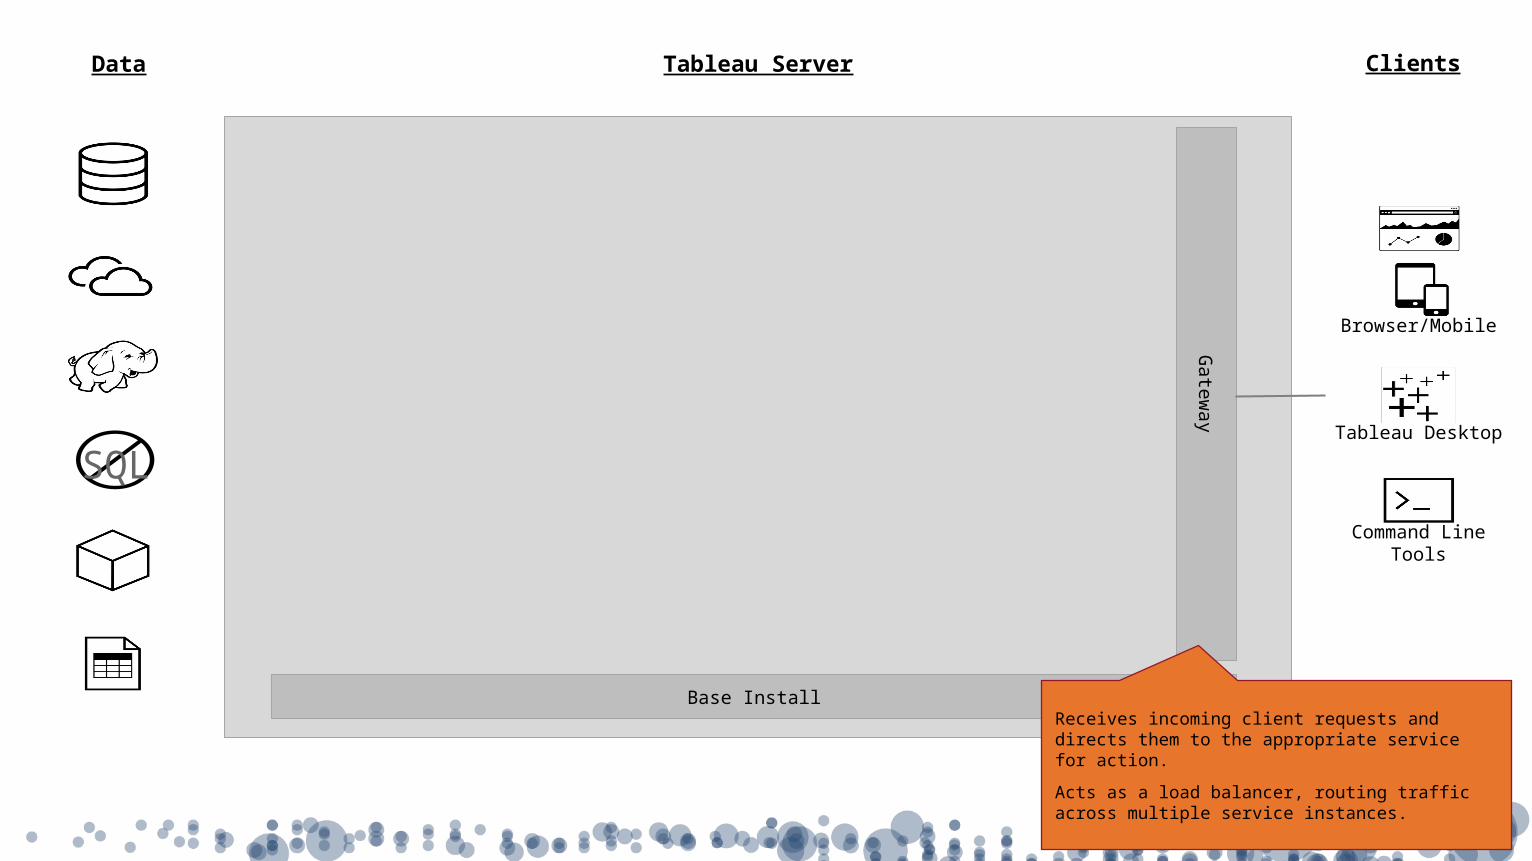
Tableau ServerData Clients
Gateway
Base InstallReceives incoming client requests and directs them to the appropriate service for action.Acts as a load balancer, routing traffic across multiple service instances.
Command LineTools
Browser/Mobile
Tableau Desktop
SQL

Tableau ServerData Clients
Gateway
App Server
Base Install Includes two processes – one that renders the web portal (vizportal) and one that handles REST APIs (wgserver). Processes logins, content searches, content and permission management, uploads/downloads and other tasks not related to visualizing data.
Repository
Command LineTools
Browser/Mobile
Tableau Desktop
SQL
Stores Tableau Server metadata: users, group assignments, permissions, projects, etc. Also stores flat files (TWB, TDS). Responds to queries from other services when they need metadata.Holds audit data for performance reporting.Has a SQL interface so external applications can connect (read-only).

Tableau ServerData Clients
Gateway
Base Install
Repository Search & Browse App Server
Command LineTools
Browser/Mobile
Tableau Desktop
SQL
Handles fast search, filter, retrieval , and display of content metadata on the server.
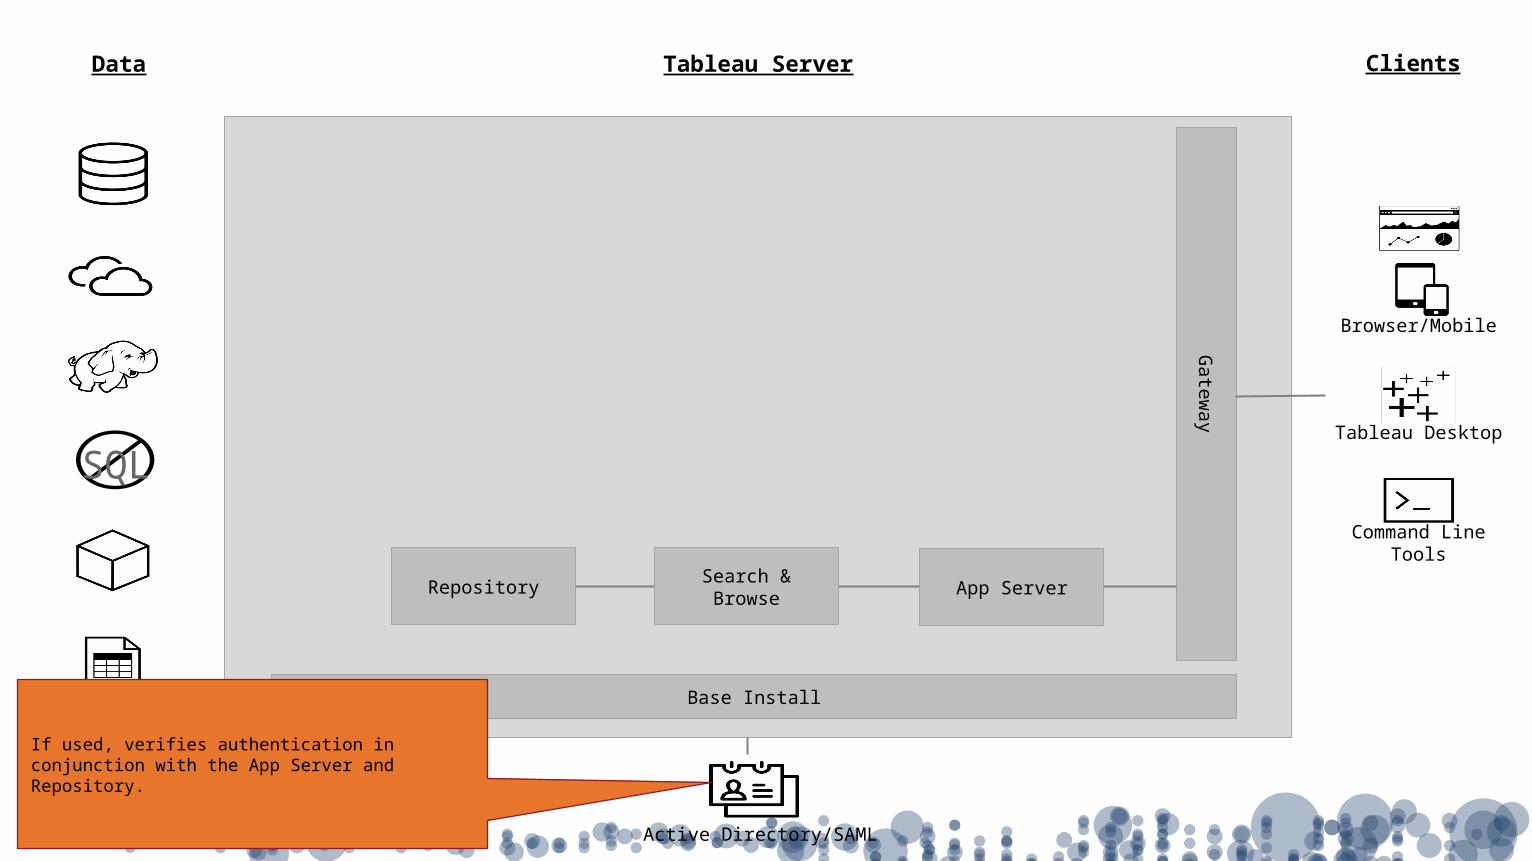
Tableau ServerData Clients
Gateway
Base Install
App ServerRepository Search & Browse
Active Directory/SAML
Command LineTools
Browser/Mobile
Tableau Desktop
SQL
If used, verifies authentication in conjunction with the App Server and Repository.

Tableau ServerData Clients
Gateway
Base Install
Data Source Drivers
App ServerRepository Search & Browse
Active Directory/SAML
Command LineTools
Browser/Mobile
Tableau Desktop
SQL
Drivers need to be installed for each data source (32-bit or 64-bit, depending on installed version of Tableau Server).Downloads and more details at http://www.tableau.com/support/drivers

Tableau ServerData Clients
Gateway
Base Install
Data Source Drivers VizQL Server
Cache Server
App Server
Loads and renders views, computes and executes queries.
Repository Search & Browse
Active Directory/SAML
Command LineTools
Browser/Mobile
Tableau Desktop
SQL
The query cache used to be local to each service but now it is distributed and shared across the server cluster. The cache speeds user experience across many scenarios. VizQL Server, Backgrounder, and Data Server make requests to the Cache Server before hitting the data source.

Tableau ServerData Clients
Gateway
Base Install
Data Source Drivers VizQL Server
Cache Server
Data EngineFile Store
App Server
Stores and services queries to data extracts (TDE). Invoked when a data extract is published or viewed.
Repository Search & Browse
Active Directory/SAML
Command LineTools
Browser/Mobile
Tableau Desktop
SQL
Installed with the Data Engine. Automatically replicates extracts across data engine nodes.

Tableau ServerData Clients
Gateway
Base Install
Data Source Drivers VizQL Server
Cache Server
Data EngineFile Store
Backgrounder
App ServerRepository Search & Browse
Active Directory/SAML
Command LineTools
Browser/Mobile
Tableau Desktop
SQL
Runs maintenance tasks to ensure Tableau Server is running efficiently.When the Data Engine is used, also handles scheduled data refreshes.Handles tasks initiated via TABCMD.

Tableau ServerData
Data Source Drivers
Clients
Gateway
VizQL Server
Data EngineFile Store
Data Server
Base Install
Cache ServerBackgrounder
App Server
Invoked when a data source is published via Tableau Desktop. Serves as proxy for queries to the actual data source (file, DB server or extract host). Enables centralized metadata management for data sources and an additional layer of access control. Allows multiple workbooks to use the same data extract. Allows centralized driver deployment.
Repository Search & Browse
Active Directory/SAML
Command LineTools
Browser/Mobile
Tableau Desktop
SQL

Tableau ServerData
Data Source Drivers
Clients
Gateway
VizQL Server
Data EngineFile Store
Data Server
Base Install
Cache ServerBackgrounder
Active Directory/SAML
App ServerRepository Search & Browse
Command LineTools
Browser/Mobile
Tableau Desktop
SQL

Active Repository
HTT
P(S)
Ser
ver
Gateway, etc.
Cluster Controller
Coordination
VizPortal
File Store
Passive Repository
HTT
P(S)
Ser
verWor
ker 1
Search & Browse
Wor
ker 2
HTT
P(S)
Ser
ver
Cluster Controller
Coordination
File Store
Wor
ker 3
Data Engine
Gateway, etc.
Cluster Controller
Coordination
VizQL Server
File Store
Search & Browse
Data Engine
Backgrounder
HTT
P(S)
Ser
ver
Prim
ary Cluster Controller
Coordination
Gateway
Search & Browse
Licensing
Loading a viz
Backgrounder

User Authentication
SAML
Kerberos

Row Level Security - Kerberos
A
B

Deployment Architectures

• Single Machine, Default Installation • Use Sample Workbooks Included• Published your home grown workbook
Trial Deployment / Prototyping
Load testing is not recommended with trial deployments (tuned for trial)

Simple and Small - Production Deployment
• Single Machine Deployment– 1x8 Core– 8GB Per Core RAM– 5MBPS IOPS or More
• Trade Offs: – Easy to manage and administer one
node.– Good for small teams with little to no IT
support– Hardware and Software are single point
of failure, higher risk of down time– Likely hood of shared resource
(RAM,DISK etc.) contention increases with increased usage over time
Primary Node
Gateway
Search
VizQL Server
Cache Server
Data Server
*
Data Engine
File StoreBase
Inst
all
Backgrounder
Repository
Application Server
*
**
**
**
**
**
**
*
*
1x8 Core Machine
Higher Risk Deployment
Gateway, Repository, Application Server, Data Engine become single point of failures on single machine systems
Backgrounder is CPU and Disk intensive by design. Can starve other server processes with increased workload
Adding additional server processes will come at the cost of user scale and performance.

Medium Deployment
• Multi-Machine Deployment– 2x8 Core Machines
• Trade Offs: – Small increase in complexity for
companies/teams with no IT support– Improved availability with 2
machines, at process level– Repository still single point of failure– Scalable to a certain degree, under
peak loads likelihood of shared resource (RAM,DISK etc.) contention increases
Primary Node
Gateway
Search
VizQL Server
Cache Server
Data Server
*
Data Engine
File StoreBase
Inst
all
Backgrounder
Repository
Application Server
*
*
**
****
**
*
*
*
*
Worker Node
Base
Inst
all
Gateway
VizQL Server
Cache Server
Data Server
*
Application Server *
**
****
**
Added gateway*, reduces risk
Added worker alleviates RAM, Disk contentions
Repository remains single point of failure
Backgrounder can compete with resources with VizQL,
Data Engine and Repository
1x8 Core Machine
1x8 Core Machine
Lower Risk Deployment, Increased Availability
*Assumes ELB

Primary Node
Base
In
stal
l
Worker Node 1 Worker Node 2
Gateway
Search
VizQL Server
Cache Server
Data Server
*
Data Engine
File StoreBase
Inst
all
Application Server
*
*
**
**
**
**
*
Repository (active) *
Gateway
VizQL Server
Cache Server
Data Server
*
Data Engine
File StoreBase
Inst
all
Application Server *
****
****
**
**
*
Search *
Gateway
Backgrounder (N to 2N) ****
Extract Heavy Production Deployment501-1000 Users
1x8 Core Physical or VM64GB + 4GB = 68 GB RAM
1x8 Core 1x8 Core
2 Additional backgrounders for higher extract
1 Additional Worker2 Additional VizQL for user load2 Additional Cache Servers2 Additional Data Engines
1x8 Core

An Enterprise Deployment Architecture
Database
Untrusted Zone
(Internet)
Public DMZ
App Zone
Intranet Zone
DB ZoneMaps
ReverseProxy
Shadow Sync
PolicyServerClient
SSO
Firewall

Tableau Server Scalability

Scalability
Scales outScales up
Tableau architecture is designed for scale

Data Refresh Frequency for Effective Business Decisions Ana
lytic
s U
se fo
r Effe
ctiv
e B
usin
ess
Dec
isio
ns

Data Refresh Frequency for Effective Business Decisions Ana
lytic
s U
se fo
r Effe
ctiv
e B
usin
ess
Dec
isio
ns
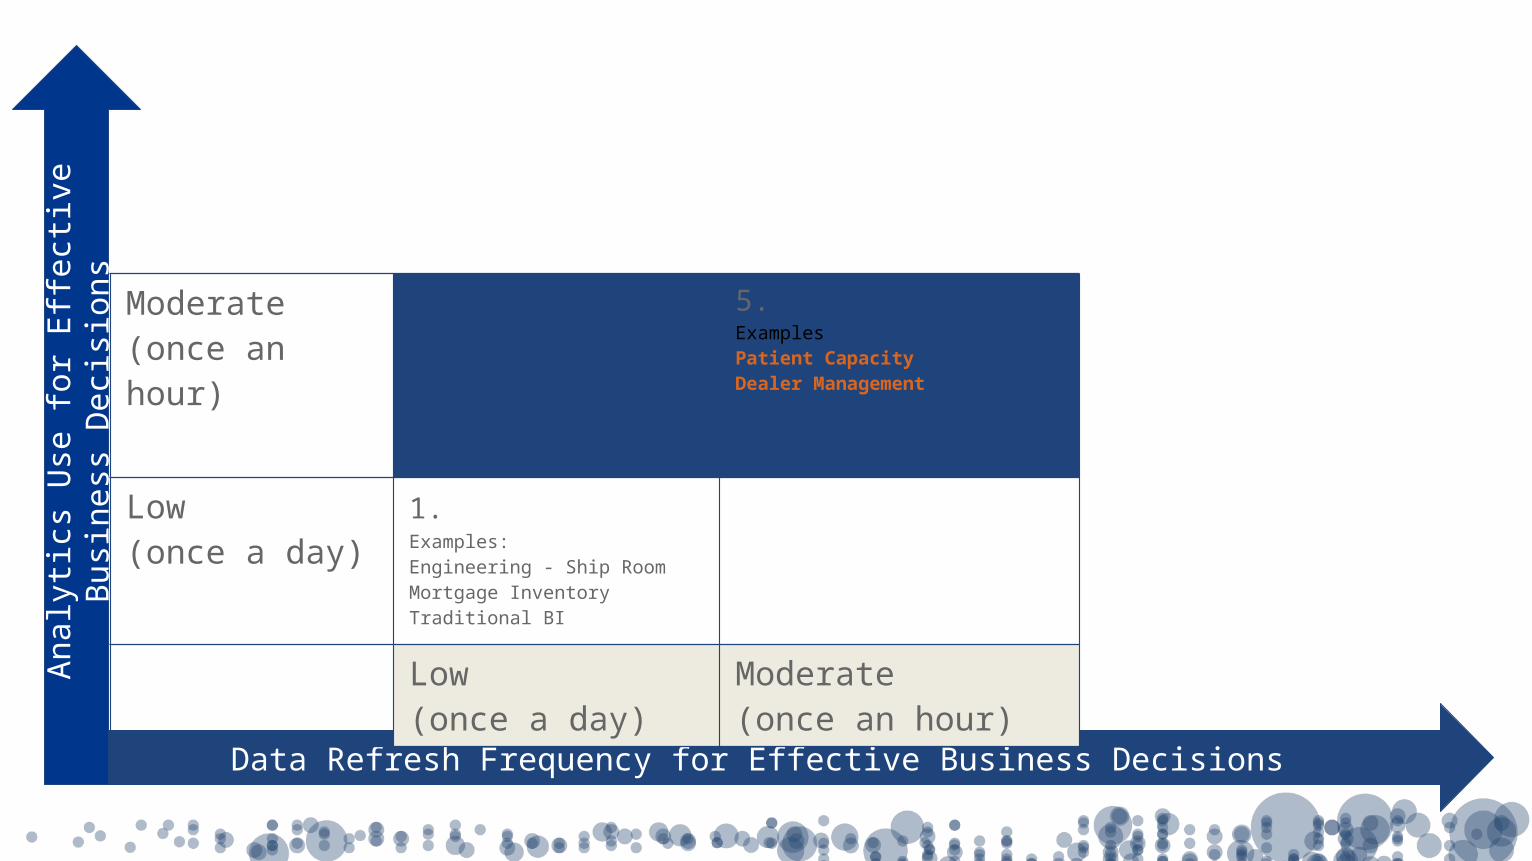
Low(once a day)
1. Examples: Engineering - Ship RoomMortgage Inventory Traditional BI
Low(once a day)
Data Refresh Frequency for Effective Business Decisions Ana
lytic
s U
se fo
r Effe
ctiv
e B
usin
ess
Dec
isio
ns
Moderate(once an hour)
5.ExamplesPatient CapacityDealer Management
Low(once a day)
1. Examples: Engineering - Ship RoomMortgage Inventory Traditional BI
Low(once a day)
Moderate(once an hour)

Data Refresh Frequency for Effective Business Decisions Ana
lytic
s U
se fo
r Effe
ctiv
e B
usin
ess
Dec
isio
ns High(every second)
9. Examples: Air Traffic ControllerFinance Trade Execution
Moderate(once an hour)
5.ExamplesPatient CapacityDealer Management
Low(once a day)
1. Examples: Engineering - Ship RoomMortgage Inventory Traditional BI
Low(once a day)
Moderate(once an hour)
Always (Live)

Ana
lytic
s U
se fo
r Effe
ctiv
e B
usin
ess
Dec
isio
ns High(every second)
7. Examples:WW Data ExplorationTableau Public (US Presidential Election) 30KViews/hour
8. Examples: Sales Quota Dashboard,Tableau on TV
9. Examples: Air Traffic Controller MonitoringFinance Trade Execution
Moderate(once an hour)
4.ExamplesDaily Store Inventory Insurance Customer AnalysisMarketing (targeting)
5.ExamplesPatient CapacityDealer Management
6. Examples:Support Escalation DashboardFinance Portfolio DashboardFraud Investigation
Low(once a day)
1. Examples: Engineering - Ship RoomMortgage Inventory Traditional BI
2. Examples:Who’s HotSales Lead Tracking
3.Examples:Highway Web Traffic Dashboards
Low(once a day)
Moderate(once an hour)
Always (Live)
Data Refresh Frequency for Effective Business Decisions
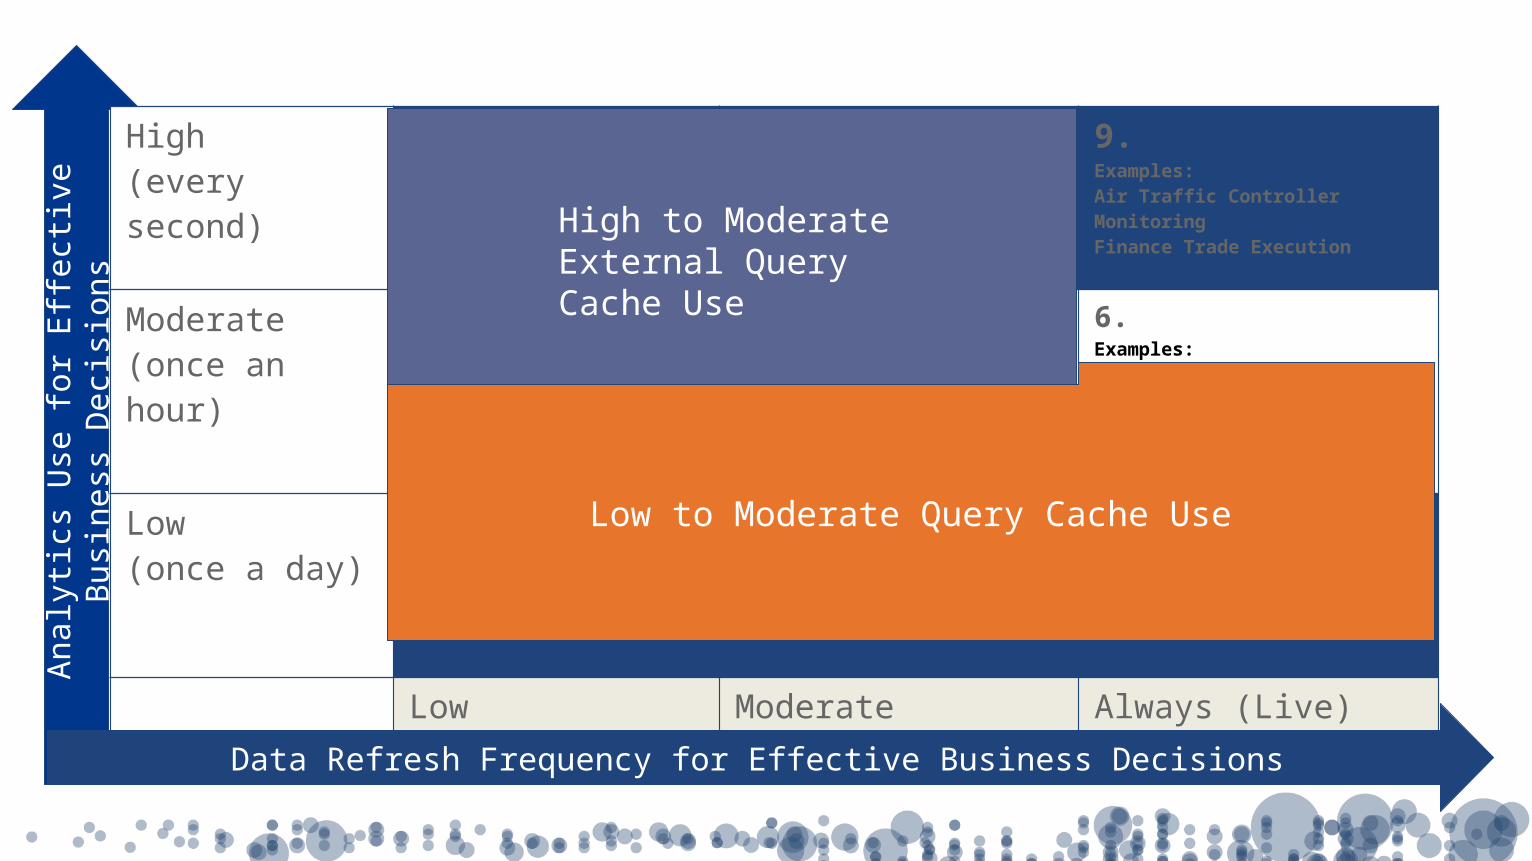
High to Moderate External Query Cache Use
Low to Moderate Query Cache Use

High(every second)
7. Examples:WW Data ExplorationTableau Public (US Presidential Election) 30KViews/hour
8. Examples: Sales Quota Dashboard,Tableau on TV
9. Examples: Air Traffic Controller MonitoringFinance Trade Execution
Moderate(once an hour)
4.ExamplesDaily Store Inventory Insurance Customer AnalysisMarketing (targeting)
5.ExamplesPatient CapacityDealer Management
6. Examples:Support Escalation DashboardFinance Portfolio DashboardFraud Investigation
Low(once a day)
1. Examples: Engineering - Ship RoomMortgage Inventory Traditional BI
2. Examples:Who’s HotSales Lead Tracking
3.Examples:Highway Web Traffic Dashboards
Low(once a day)
Moderate(once an hour)
Always (Live)
Ana
lytic
s U
se fo
r Effe
ctiv
e B
usin
ess
Dec
isio
ns
Data Refresh Frequency for Effective Business Decisions
VizQL, Cache, Backgrounders and/or,
Data Servers
Add BackgroundersVizQ
L, D
ata
Serv
er (P
ublis
hed
DS)
, D
ata
Engi
ne, C
ache
Ser
vers


PERFORMANCE

Improvements across the product
Query Improvements
Data Engine Improvements
Server Improvements
Parallel Query Vectorization All Query Improvements
Query Fusion Parallel Plans Rendering Performance
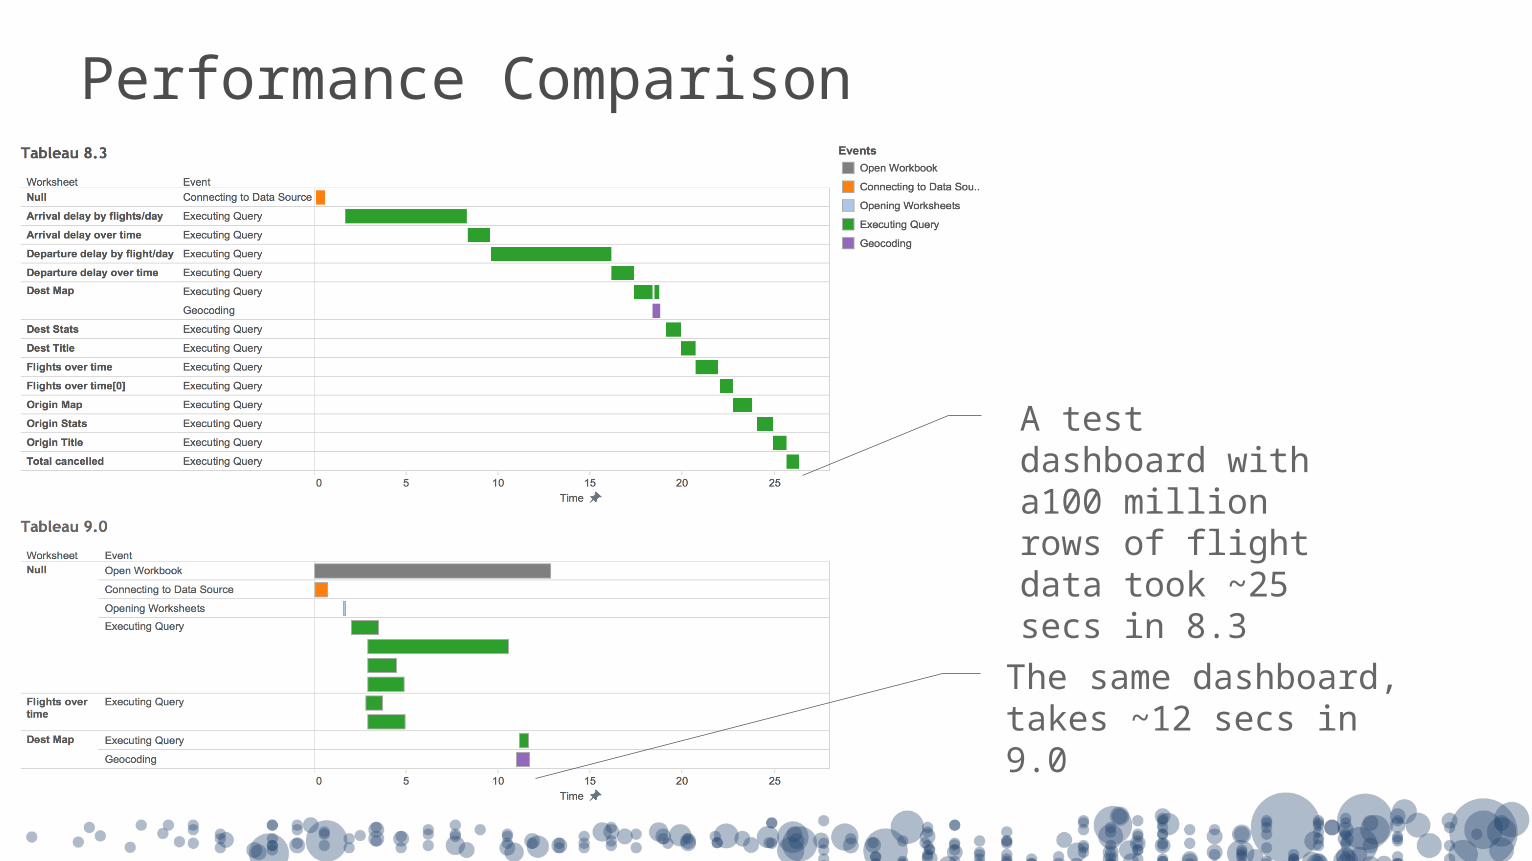
Performance Comparison
A test dashboard with a100 million rows of flight data took ~25 secs in 8.3
The same dashboard, takes ~12 secs in 9.0
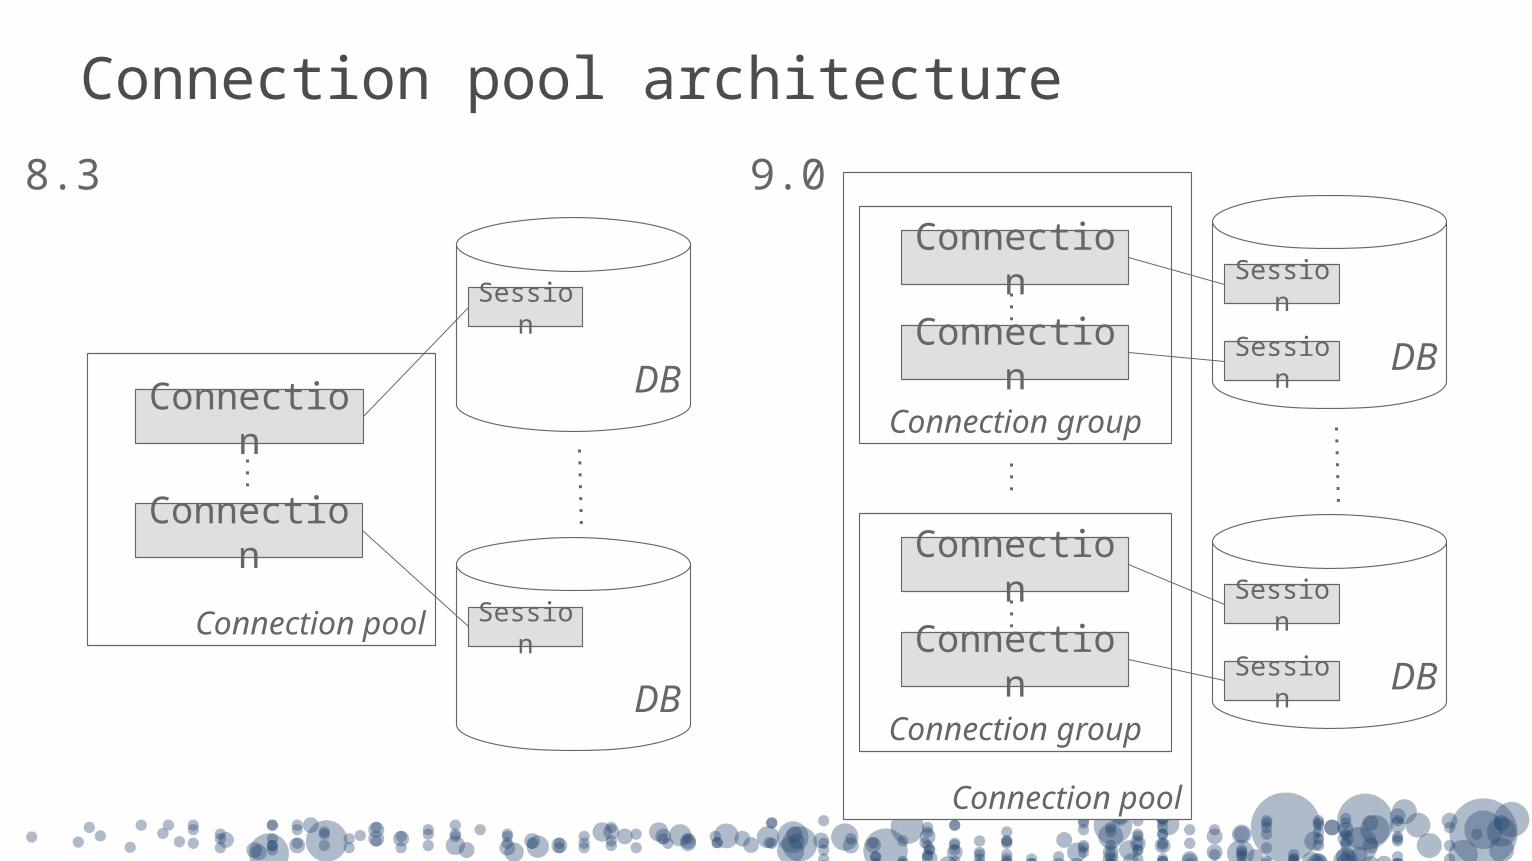
Connection pool architecture
Connection pool
Connection group
Connection
Connection
Connection group
Connection
Connection
DBSession
Session
DBSession
SessionConnection pool
Connection
Connection
DB
Session
DB
Session
8.3 9.0

High Availability
935 days
94 days
98 hours
950 mins
95 mins
%
CoordinationCoordination
Active Repository
HTT
P(S)
Ser
ver
Gateway, etc.
Cluster Controller
VizPortal
File Store
CoordinationCoordination
CoordinationCoordination
Passive Repository
HTT
P(S)
Ser
ver
Wor
ker 1
Search & Browse
Wor
ker 2
Data Engine
Gateway, etc.
Cluster Controller
VizQL Server
File Store
Search & Browse
Data Engine
HTT
P(S)
Ser
ver
Prim
ary Cluster Controller
Gateway
Search & Browse
Licensing
Coordination
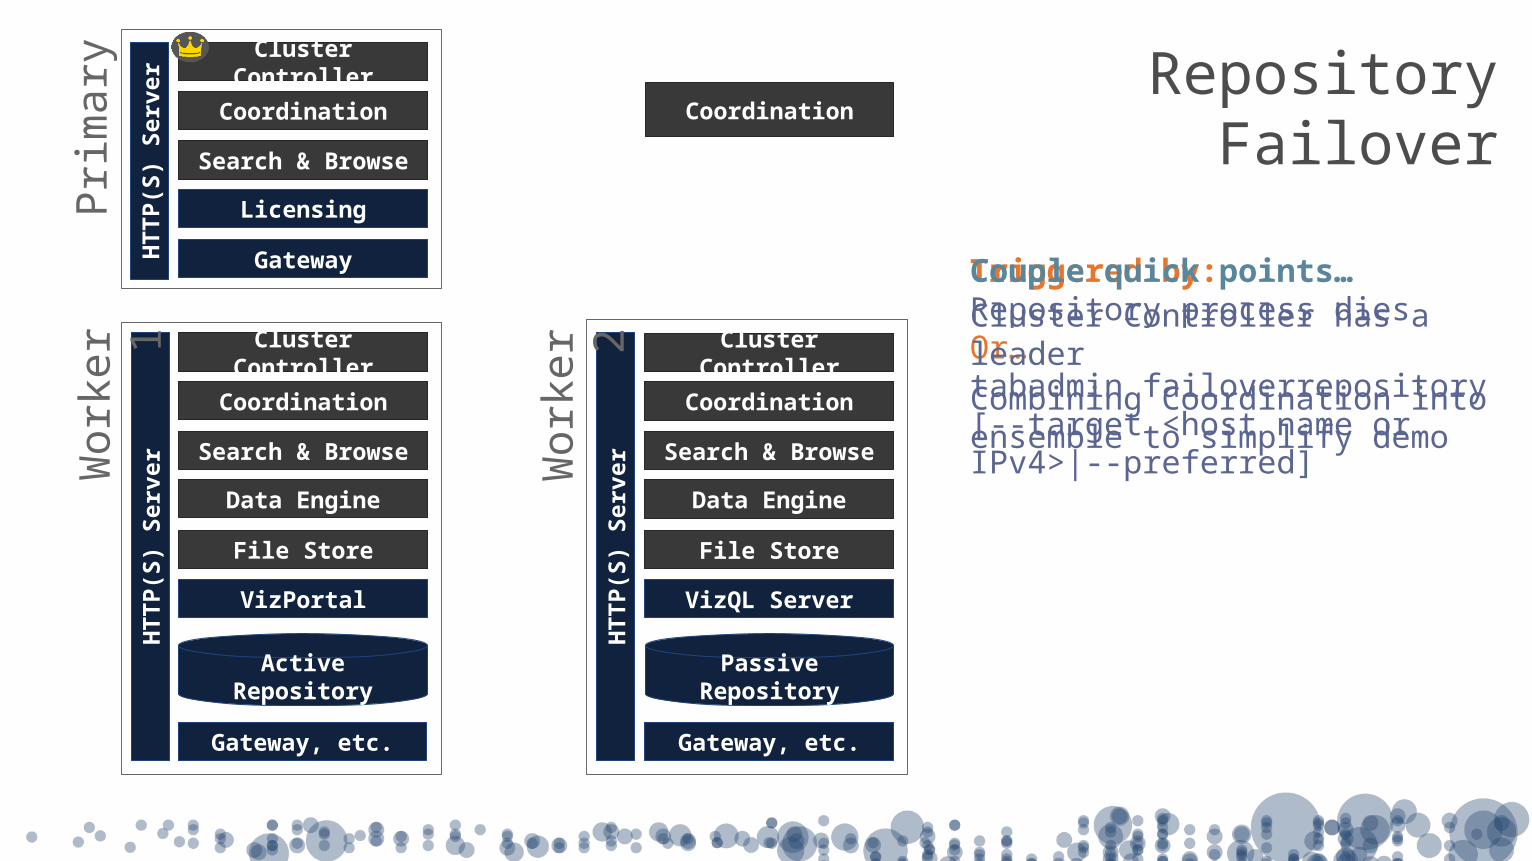
Triggered by:Repository process diesOr…tabadmin failoverrepository [--target <host name or IPv4>|--preferred]
Couple quick points…Cluster Controller has a leaderCombining Coordination into ensemble to simplify demo
RepositoryFailover
Coordination
Active Repository
HTT
P(S)
Ser
ver
Gateway, etc.
VizPortal
File Store
Passive RepositoryActive Repository
HTT
P(S)
Ser
ver
Wor
ker 1
Search & Browse
Wor
ker 2
Data Engine
Gateway, etc.
Cluster Controller
VizQL Server
File Store
Search & Browse
Data Engine
HTT
P(S)
Ser
ver
Prim
ary
Gateway
Search & Browse
Licensing
!
!
Cluster Controller
Coordination Coordination
Coordination
Cluster Controller
Passive Repository
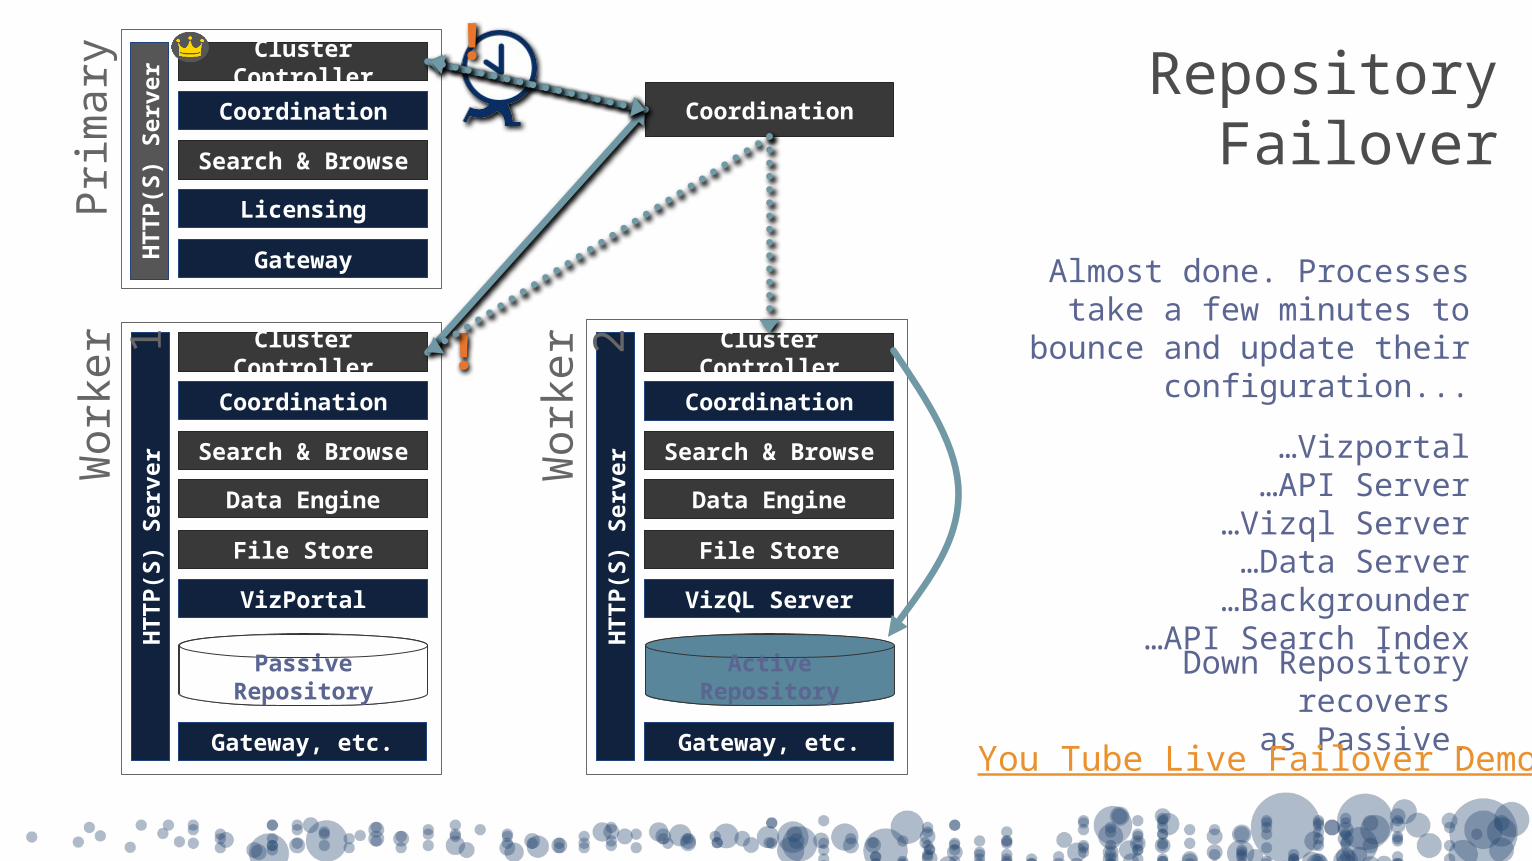
Almost done. Processes take a few minutes to bounce and update their configuration...
…Vizportal…API Server
…Vizql Server…Data Server
…Backgrounder…API Search Index
Down Repository recovers as Passive.
RepositoryFailover
You Tube Live Failover Demo
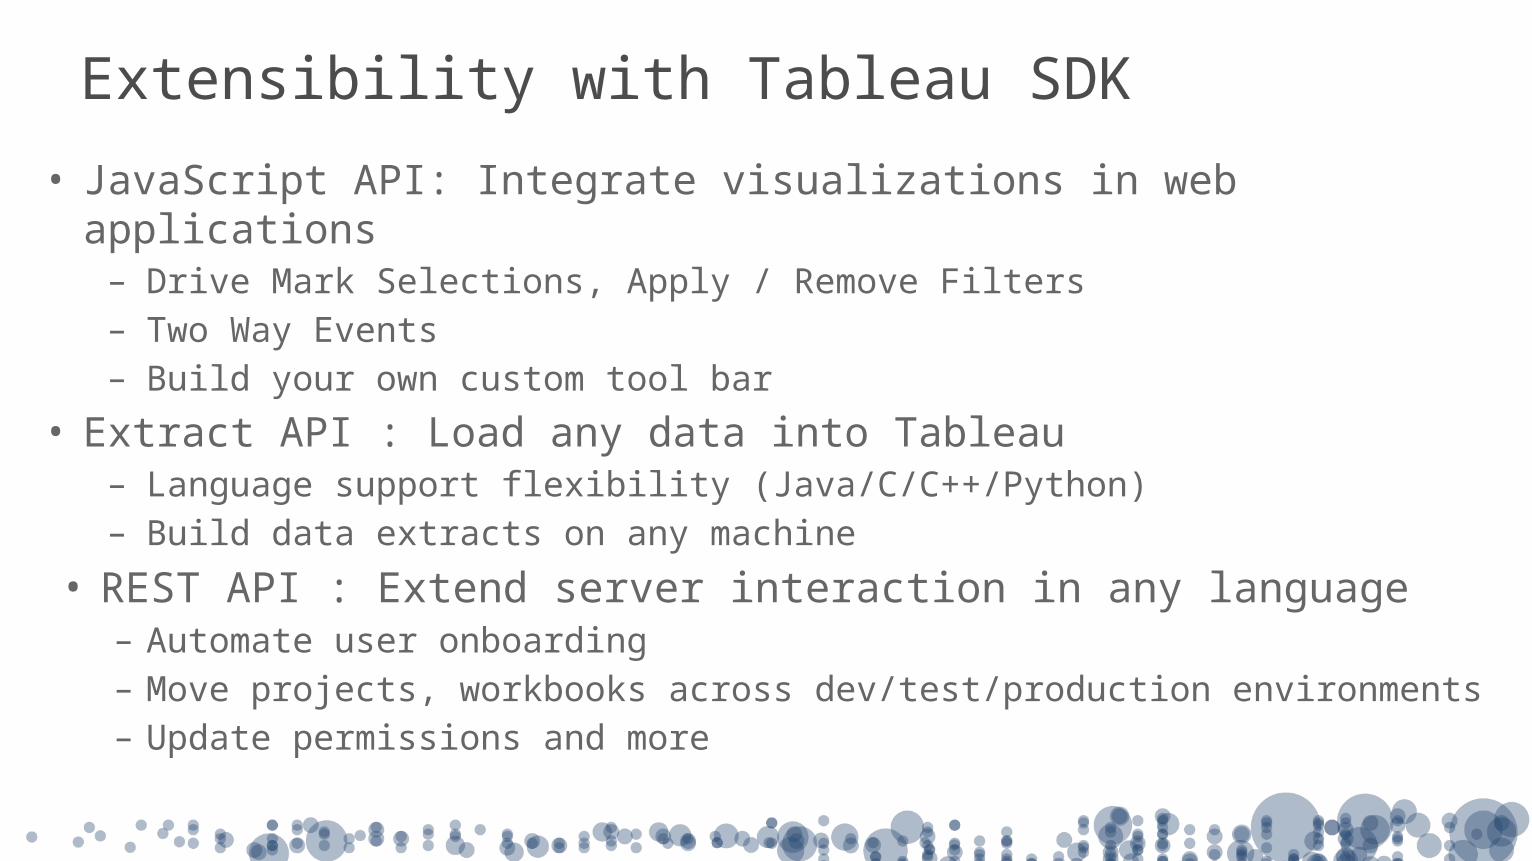
• JavaScript API: Integrate visualizations in web applications– Drive Mark Selections, Apply / Remove Filters – Two Way Events– Build your own custom tool bar
• Extract API : Load any data into Tableau– Language support flexibility (Java/C/C++/Python)– Build data extracts on any machine
• REST API : Extend server interaction in any language – Automate user onboarding– Move projects, workbooks across dev/test/production environments – Update permissions and more
Extensibility with Tableau SDK
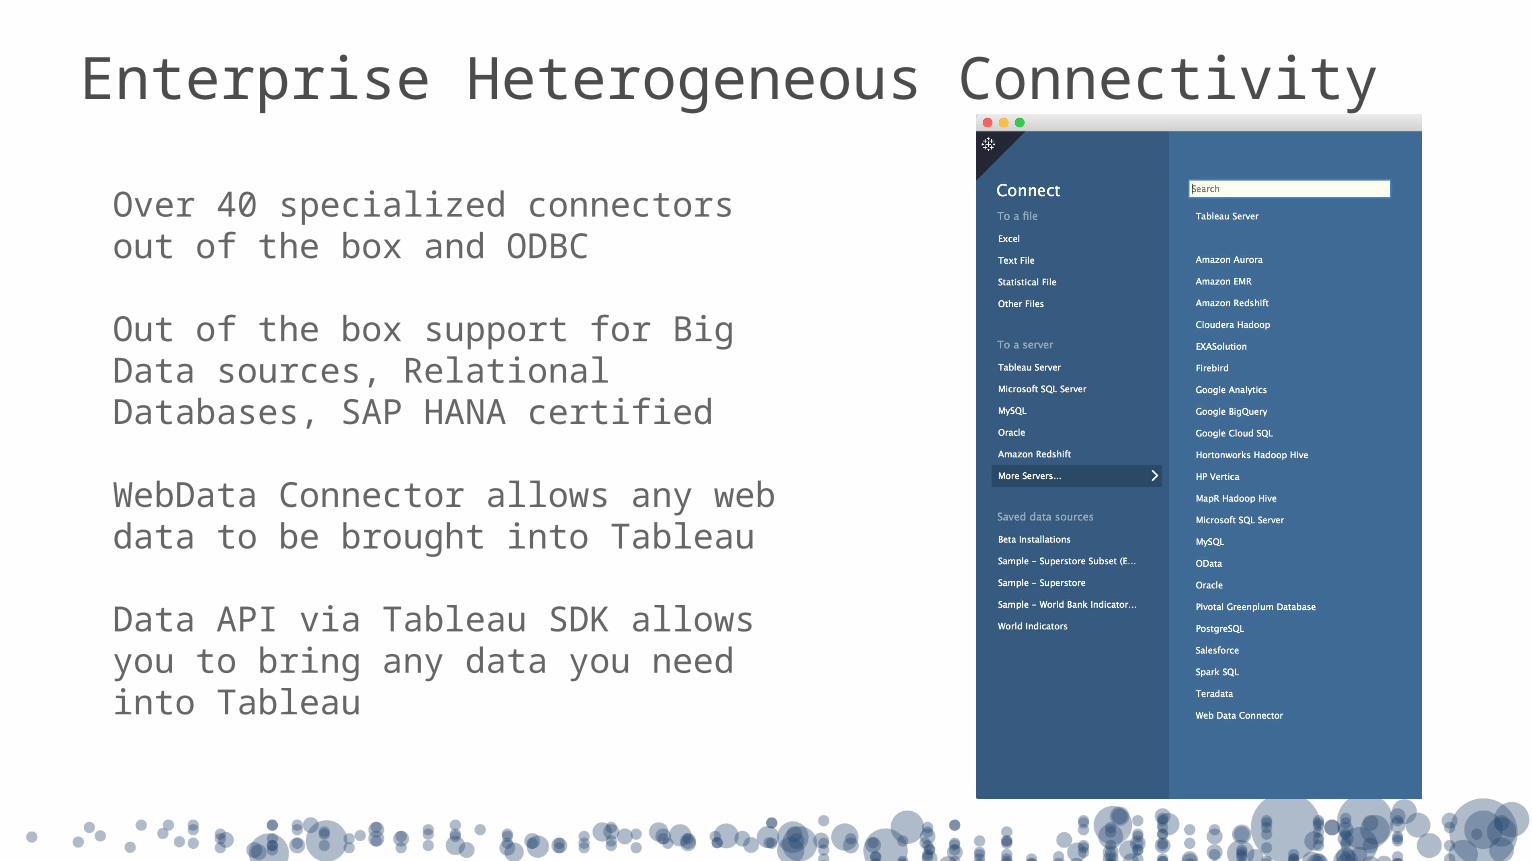
Enterprise Heterogeneous Connectivity
Over 40 specialized connectors out of the box and ODBC
Out of the box support for Big Data sources, Relational Databases, SAP HANA certified
WebData Connector allows any web data to be brought into Tableau
Data API via Tableau SDK allows you to bring any data you need into Tableau
Server Architecture Deep Dive

Gateway
VizQL Server
Data Server (Extracts)Postgres
Data Engine
Extracts
Customer Data Source
Published data source (live)
Live Connection
Permissions/MetaData/twb/twbx
Request Flow – Web Visualization

Request Flow – Admin Management
Gateway
Application Server (JAVA)
Search ServiceSOLR
Postgres
JSON -RPC

Gateway
API Services (aka WGServer)
SOLR Postgres
Request Flow - REST API

Gateway
Data Server (Extracts)
Postgres
Request Flow - Published Data Server
Data Engine
Extracts
Customer Data Source
Published data source (live)
Live Connection
Permissions/Metadata/tds/tdsx

Backgrounder
Postgres Data EngineSame as Web Visualization Request Flow
Refresh Extract
Request Flow – Backgrounder

Tableau ServerData
Data Source Drivers
Clients
Gateway
VizQL Server
Data EngineFile Store
Data Server
Base Install
Cache ServerBackgrounder
Active Directory/SAML
App ServerRepository Search & Browse
Command LineTools
Browser/Mobile
Tableau Desktop
SQL

An Enterprise Deployment Architecture
Database
Untrusted Zone
(Internet)
Public DMZ
App Zone
Intranet Zone
DB ZoneMaps
ReverseProxy
Shadow Sync
PolicyServerClient
SSO
Firewall

Does not mean simplisticTableau architecture drives enterprises
Scaling Analytic Culturewith Tableau Drive

Is this how you feel (now)?

So why do it?

Tableau is different.
It can help you create better workplaces by building analytic culture.

Does the “report factory” model work for anyone?
Requirements
Gathering
Development
Planning
UserAcceptan
ce
Test
Production
… is an IT mission...
Subject Matter Expert (ideas)
Every idea….
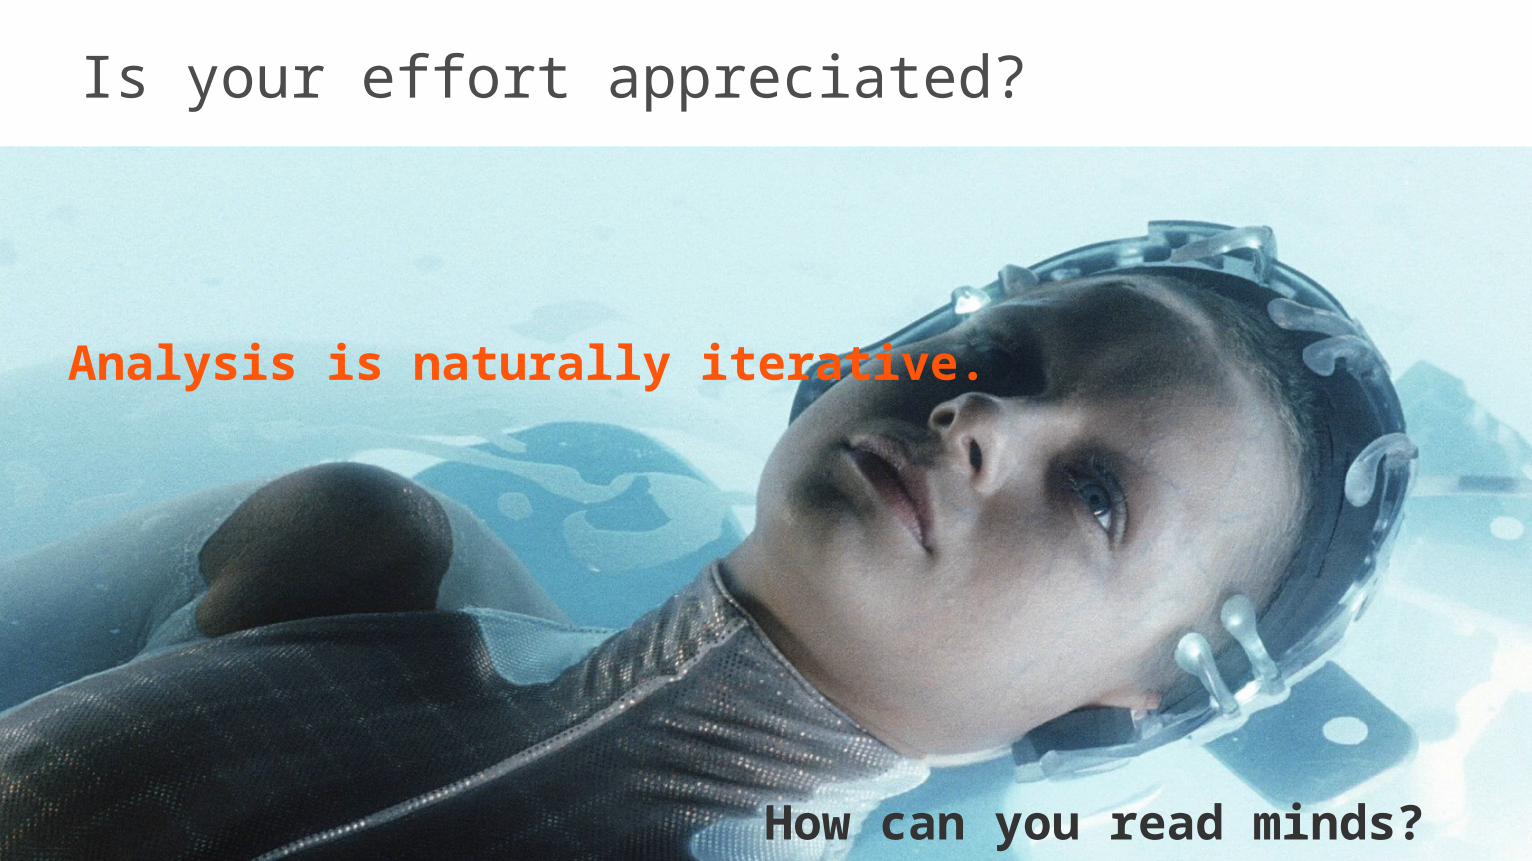
Is your effort appreciated?
Analysis is naturally iterative.
How can you read minds?
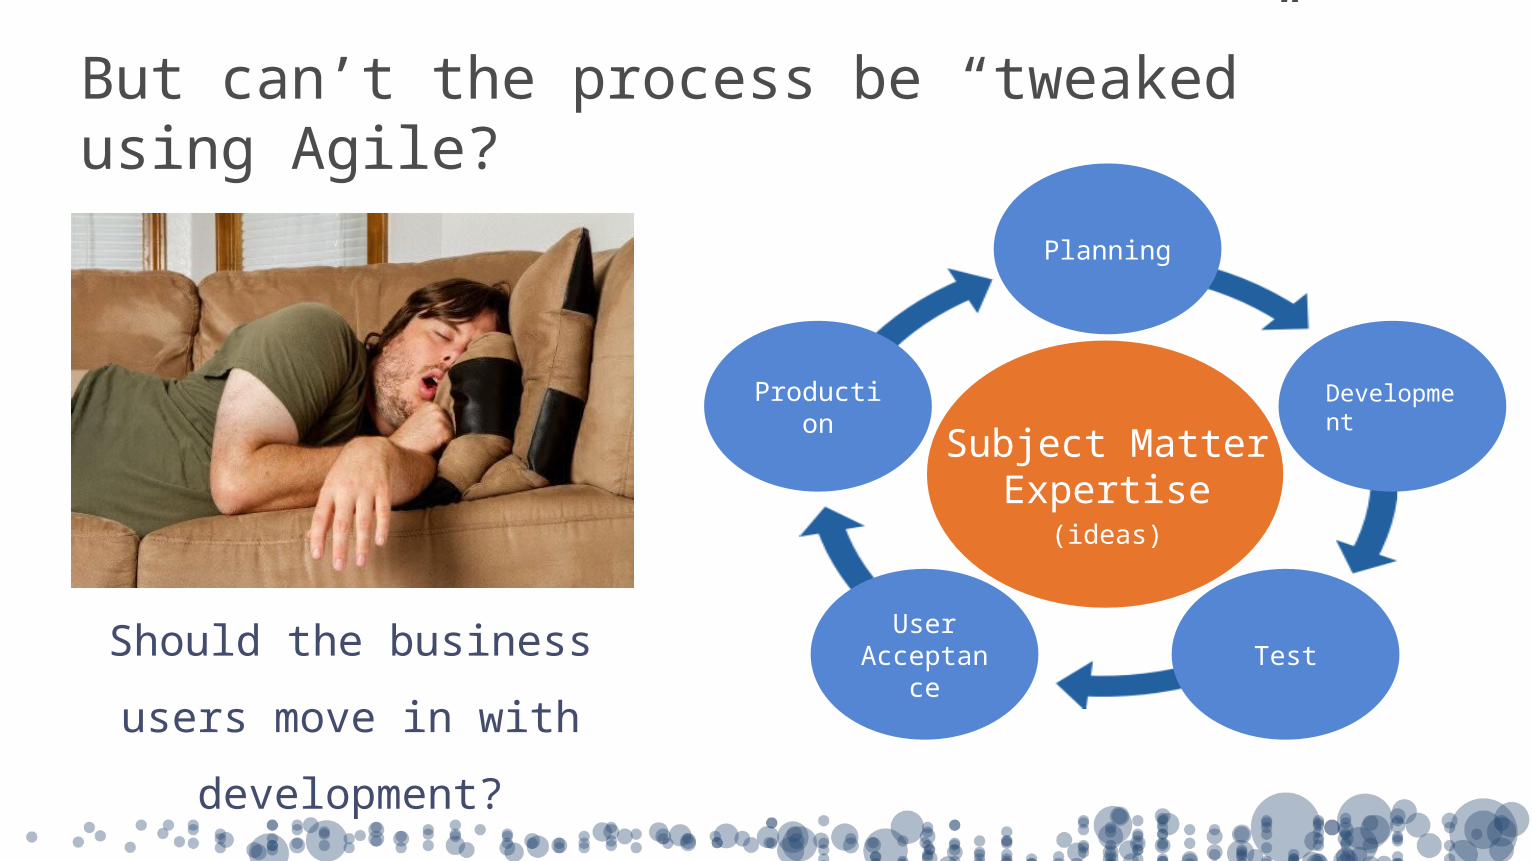
But can’t the process be “tweaked” using Agile?
Should the business users move in with
development?
Planning
Development
Production
UserAcceptan
ceTest
Subject MatterExpertise
(ideas)
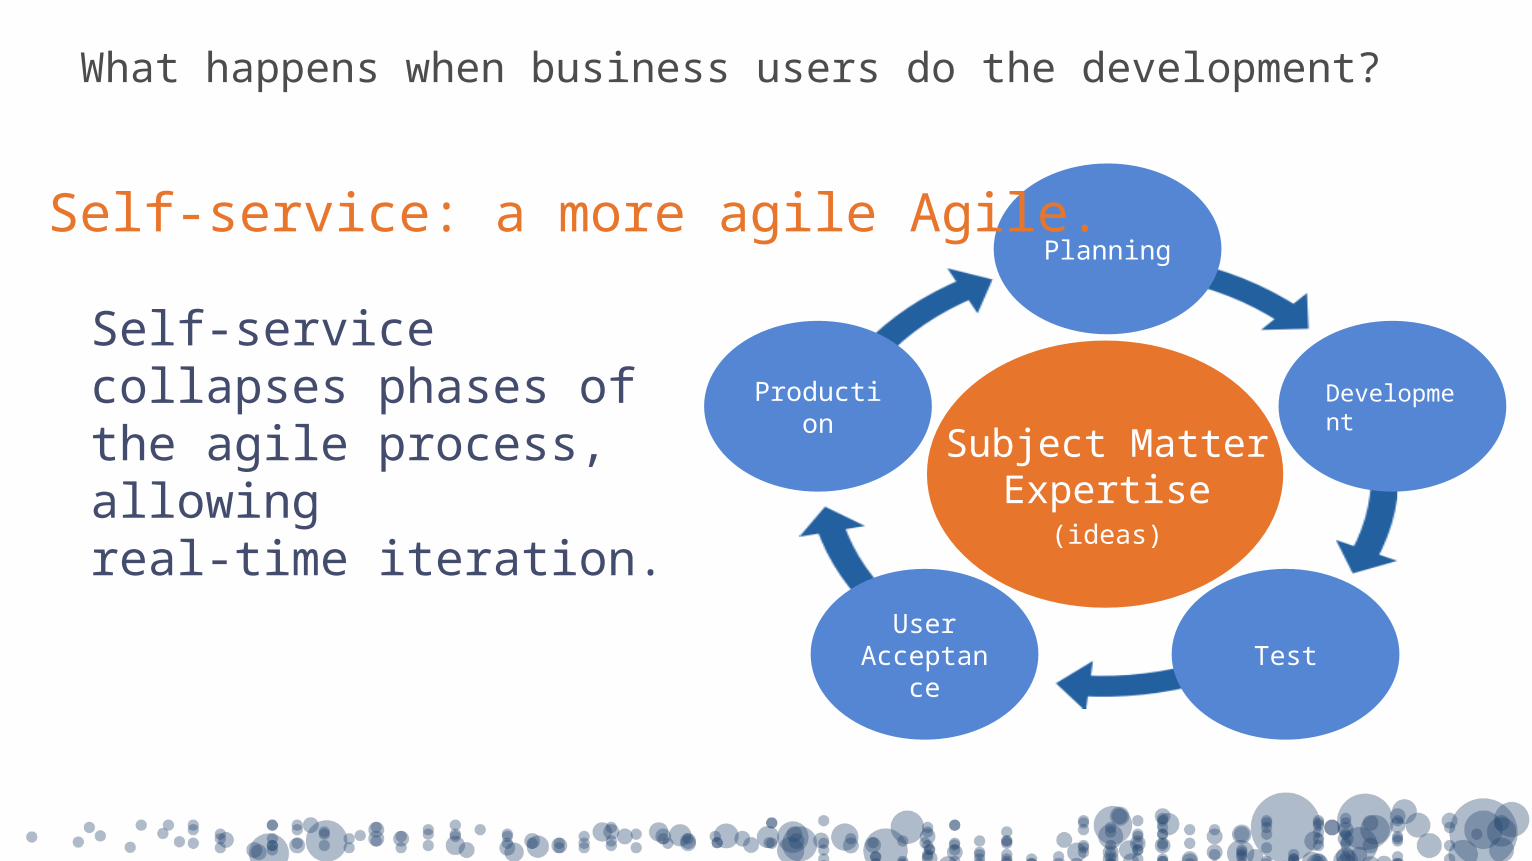
What happens when business users do the development?
Self-service collapses phases of the agile process, allowing real-time iteration.
ProductionDevelopment
Planning
UserAcceptance
Test
Subject MatterExpertise
(requirements)
Planning
Development
Production
UserAcceptan
ceTest
Subject MatterExpertise
(ideas)
Self-service: a more agile Agile.

Self service model: IT = enabler
ITBusinessUsers
?
??
???
?
?
?
???
?
Report factory model: IT = bottleneck

Tableau = Disrupter
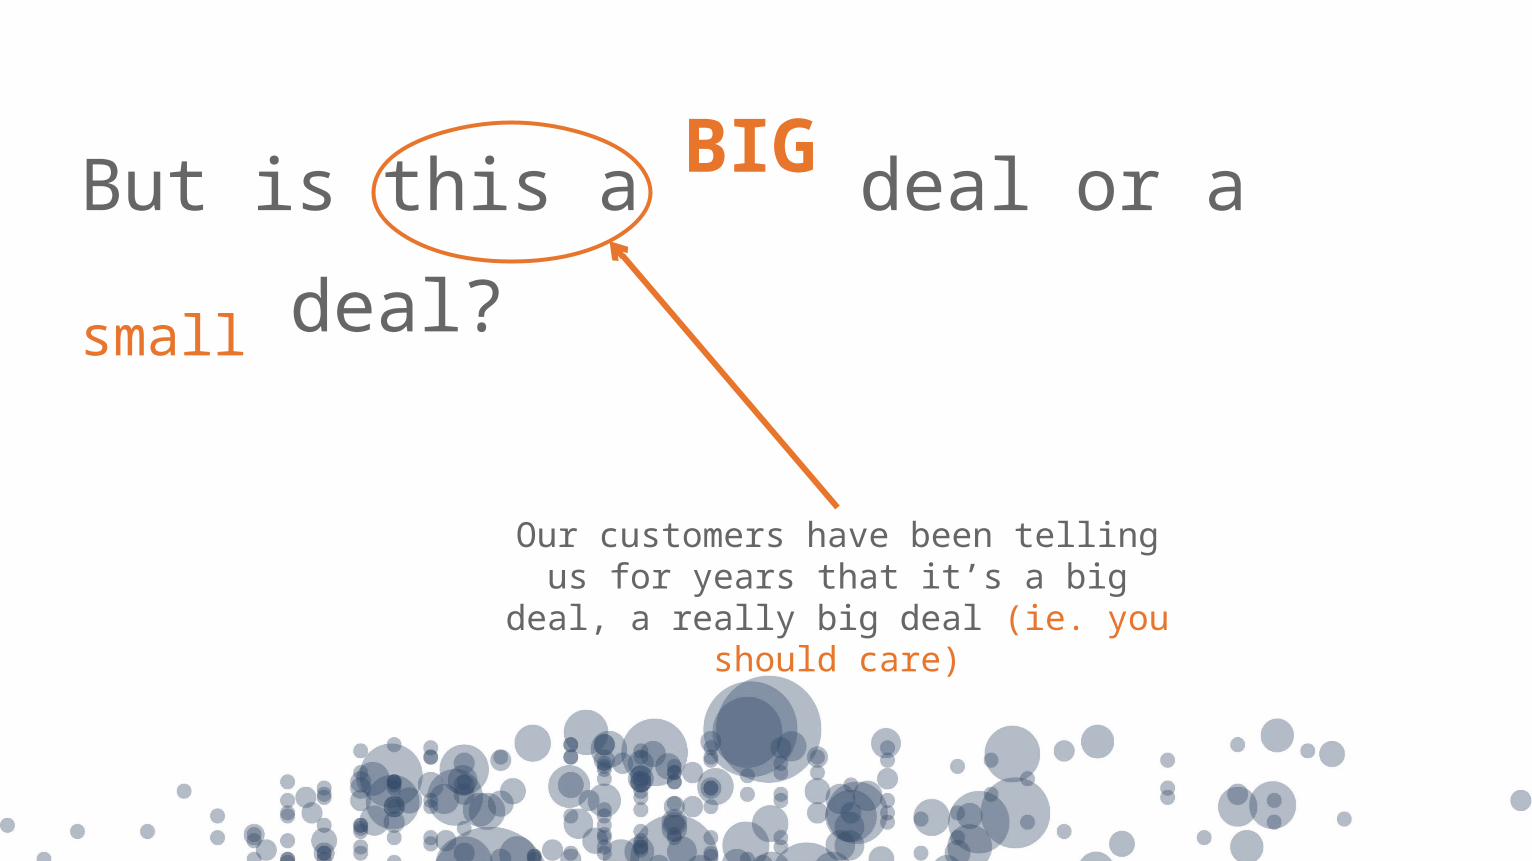
But is this a BIG deal or a small deal?
Our customers have been telling us for years that it’s a big deal, a really big deal
(ie. you should care)


“Try it, you’ll like it”

Fun aside… what value is this bringing to my users and organization?

We work in a knowledge economy
Intangibles (Human Capital contribution) as % of S&P 500 market cap.
1975 201517% 84%

Knowledge work cannot be forced
Analytic Culture
Thinking
Knowledge
Participation
Engagement

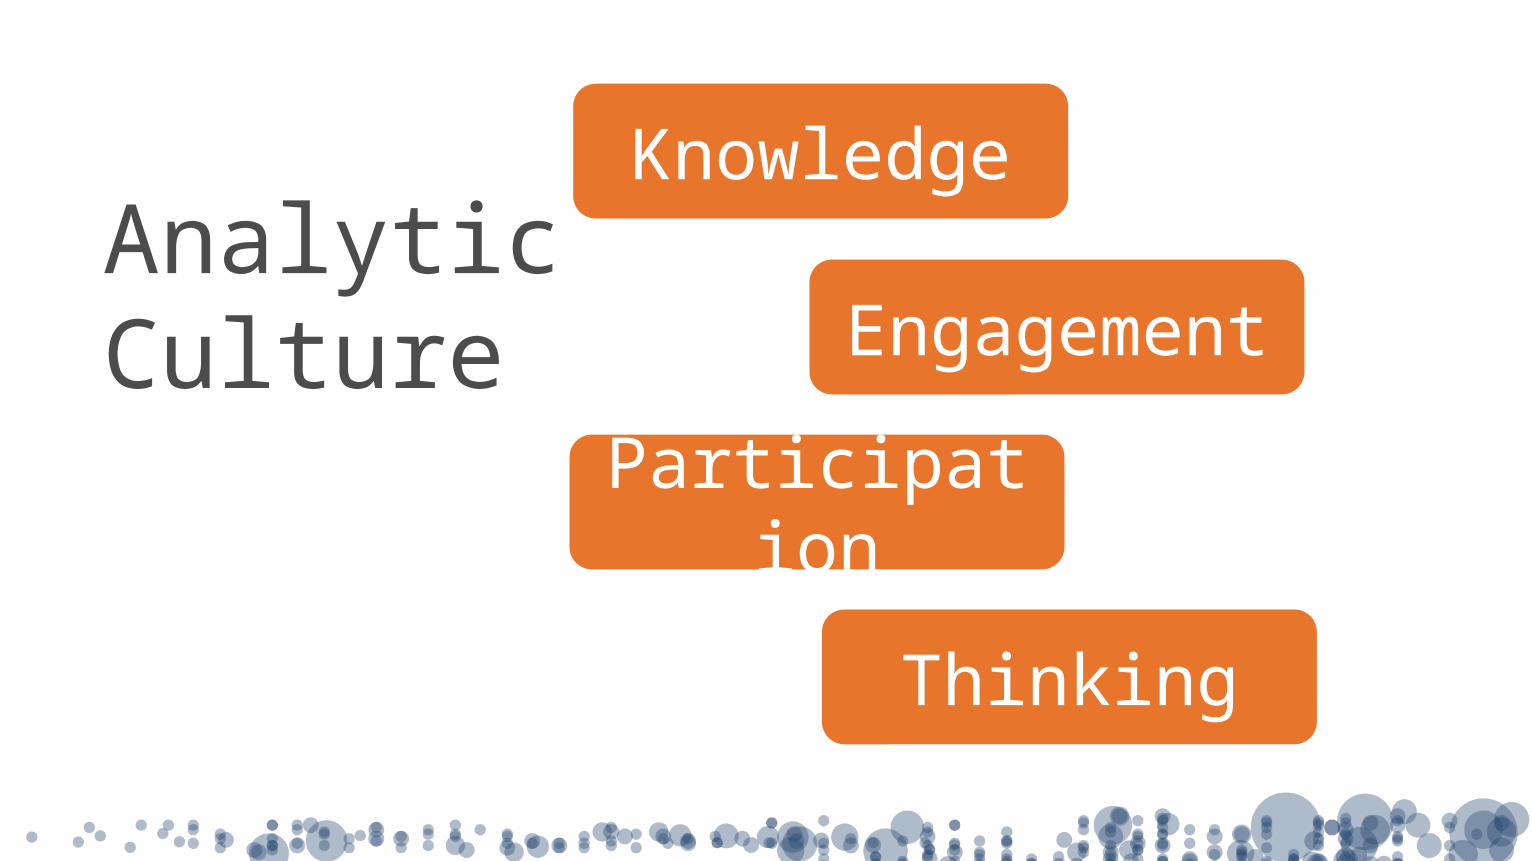
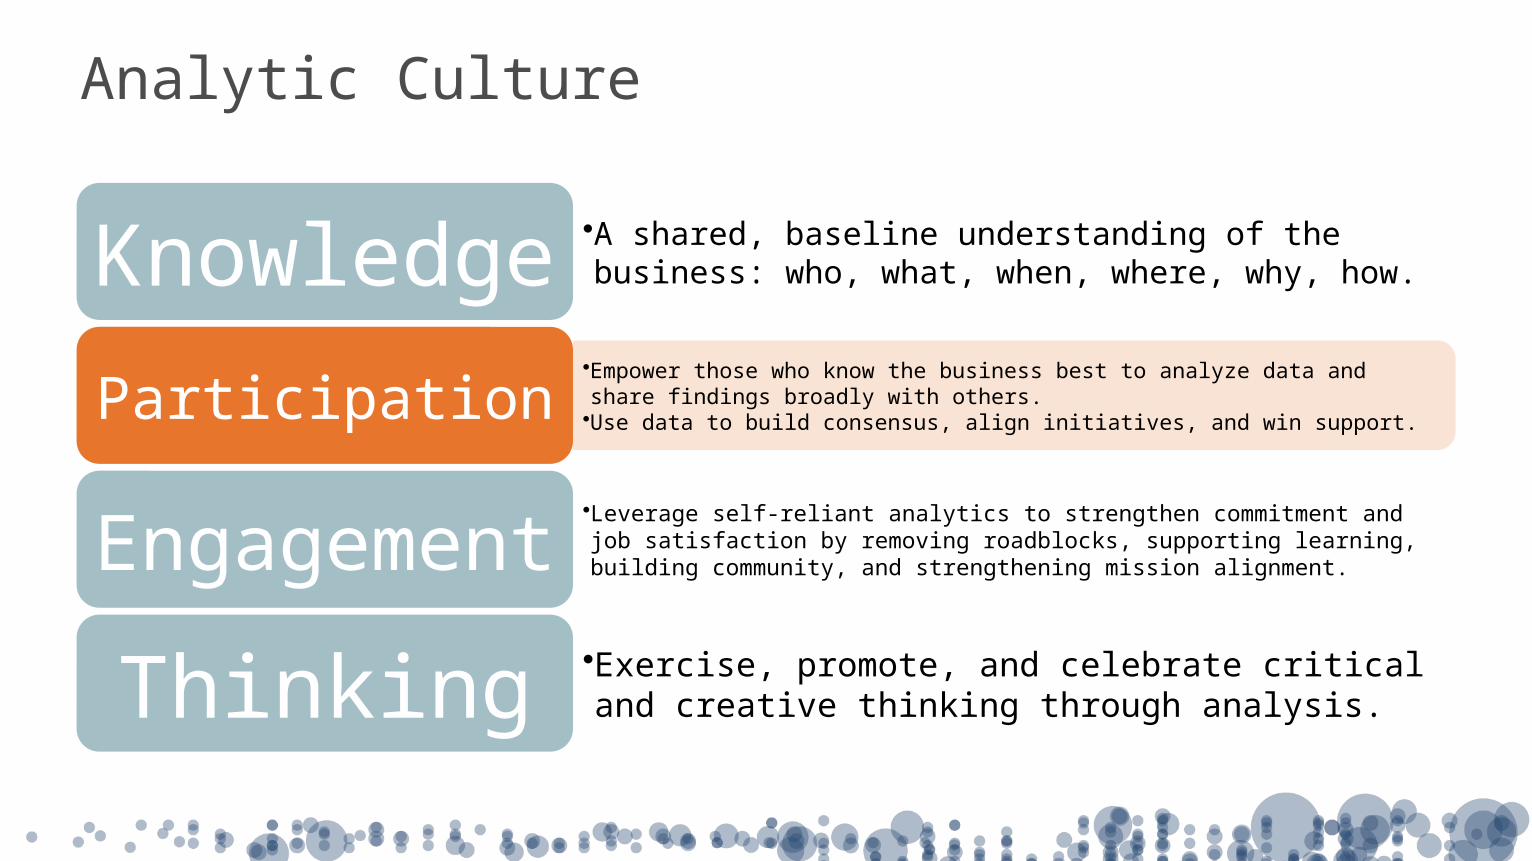
Analytic Culture
•A shared, baseline understanding of the business: who, what, when, where, why, how.Knowledge
•Empower those who know the business best to analyze data and share findings broadly with others. •Use data to build consensus, align initiatives, and win support.Participation•Leverage self-reliant analytics to strengthen commitment and job satisfaction by removing roadblocks, supporting learning, building community, and strengthening mission alignment.Engagement•Exercise, promote, and celebrate critical and creative thinking through analysis.Thinking

Curiosity: Wanting to know

Anxiety: Needing to know

Anxiety: Needing to know

Anxiety: Needing to know


Report Factory

- By technical specialists who often don’t have business context knowledge
- Using specialized skills and complex tools
- With exclusive access to enterprise data
- As “Sole” source for reports
“Report factory”

- Business-aligned subject matter experts with analytic skills
- Run the “Center of Evangelism”- Participate in promotion to production
workflow- Are hghly encouraged to become
proficient (jedi-caliber)- Train, mentor, and work in real-time with
others- Are sometimes paid to do analysis full
time- Goal:
- Everyone an analyst
Tableau “Analyst”
Community of Tableau Users
Analyst
Learner
Consumer
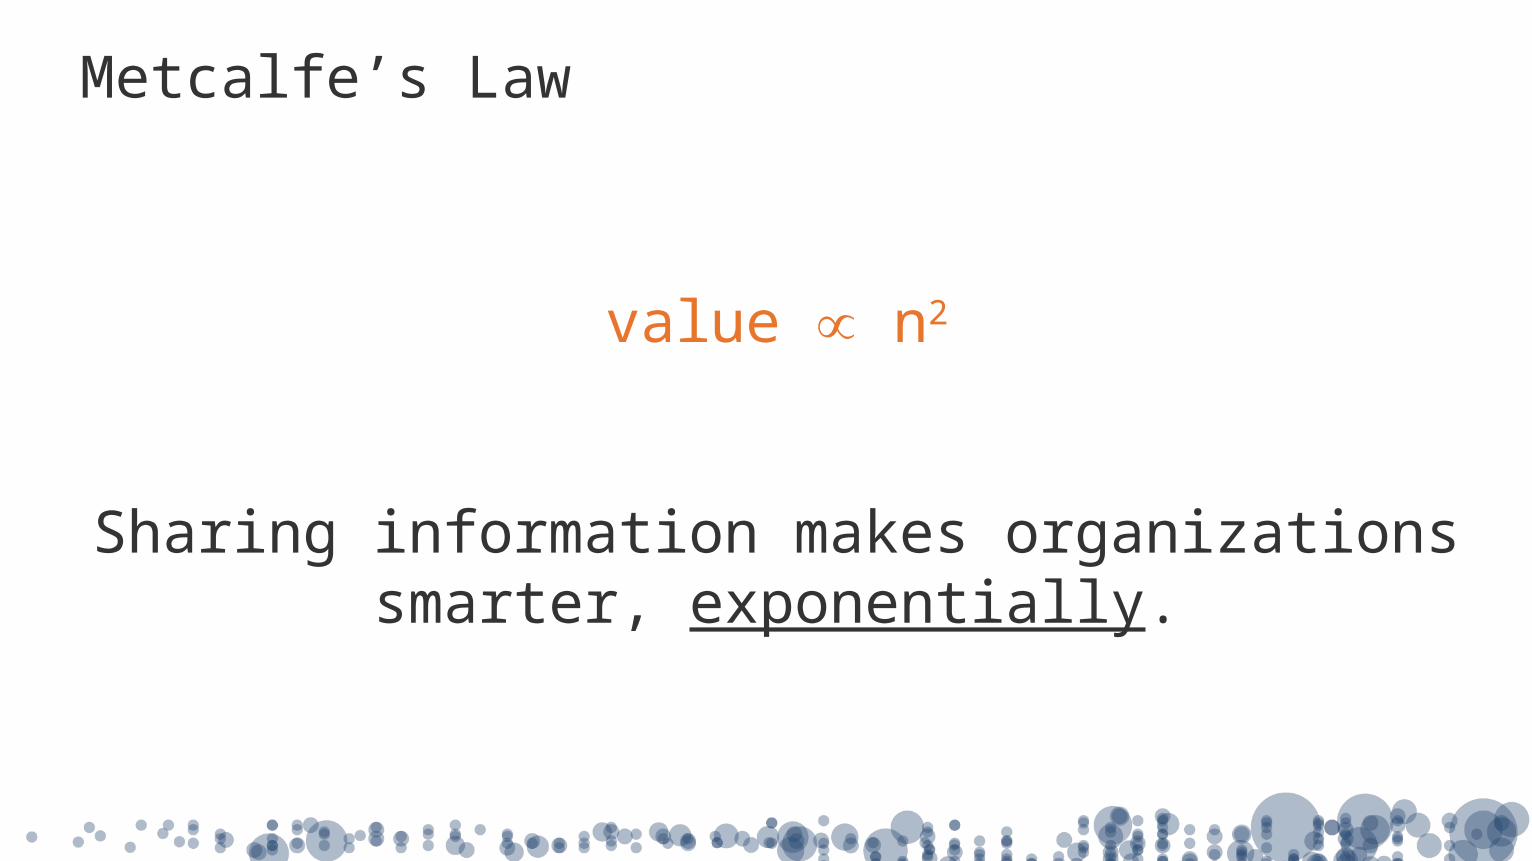
Metcalfe’s Law
value ∝ n2
Sharing information makes organizations smarter, exponentially.

Knowledge allows sense making
“Core”Contextual
KnowledgeNew Information
FilteringValidationSynthesis

Capuchin monkey fairness experiment
https://www.youtube.com/watch?v=-KSryJXDpZo
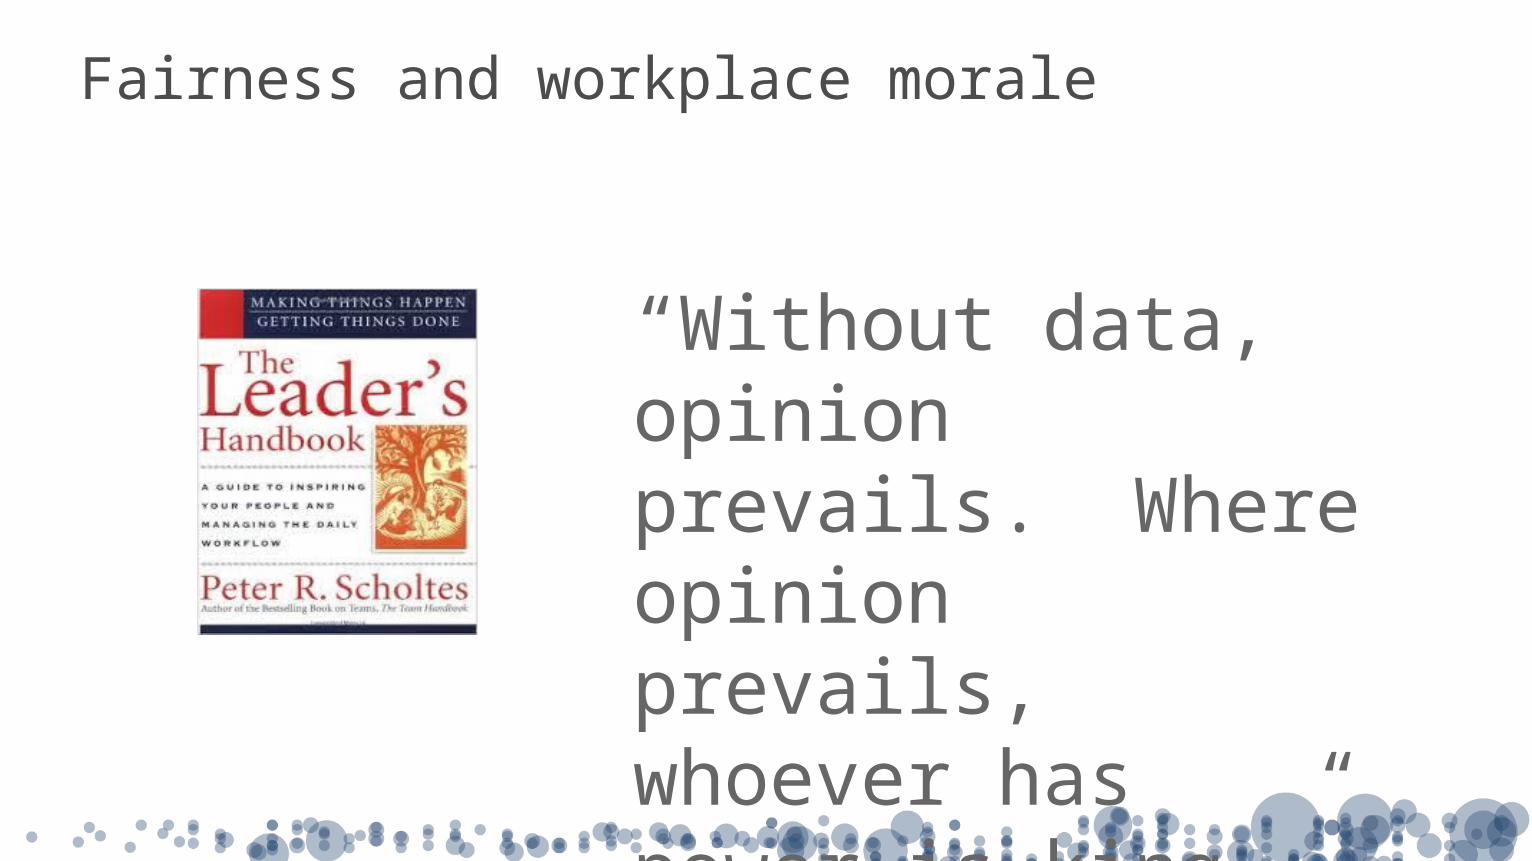
Fairness and workplace morale
“Without data, opinion prevails. Where opinion prevails, whoever has power is king.”

Scientists seek the truth through data

Google decides with data

Systems Thinking

Simplistic isn’t sufficient
By Nicolaus Copernicus
The Earth revolves around the sun.
(Applause)
“All you need to knowIs in this
envelope!”

Execution is more than understanding
Analytic Culture
•A shared, baseline understanding of the business: who, what, when, where, why, how.Knowledge
•Empower those who know the business best to analyze data and share findings broadly with others. •Use data to build consensus, align initiatives, and win support.Participation•Leverage self-reliant analytics to strengthen commitment and job satisfaction by removing roadblocks, supporting learning, building community, and strengthening mission alignment.Engagement•Exercise, promote, and celebrate critical and creative thinking through analysis.Thinking

Feeling left out?
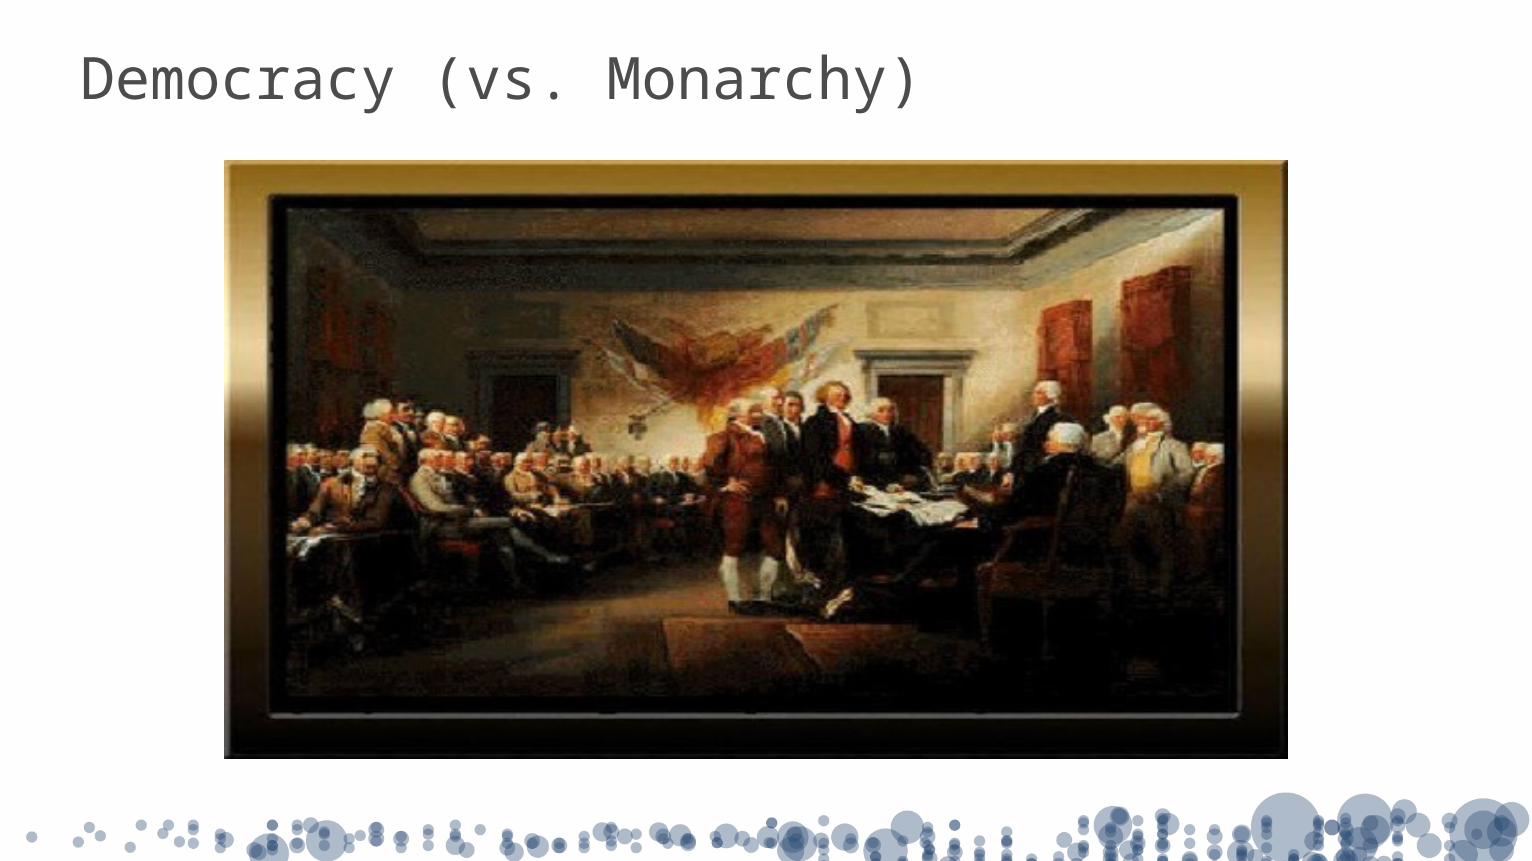
Democracy (vs. Monarchy)
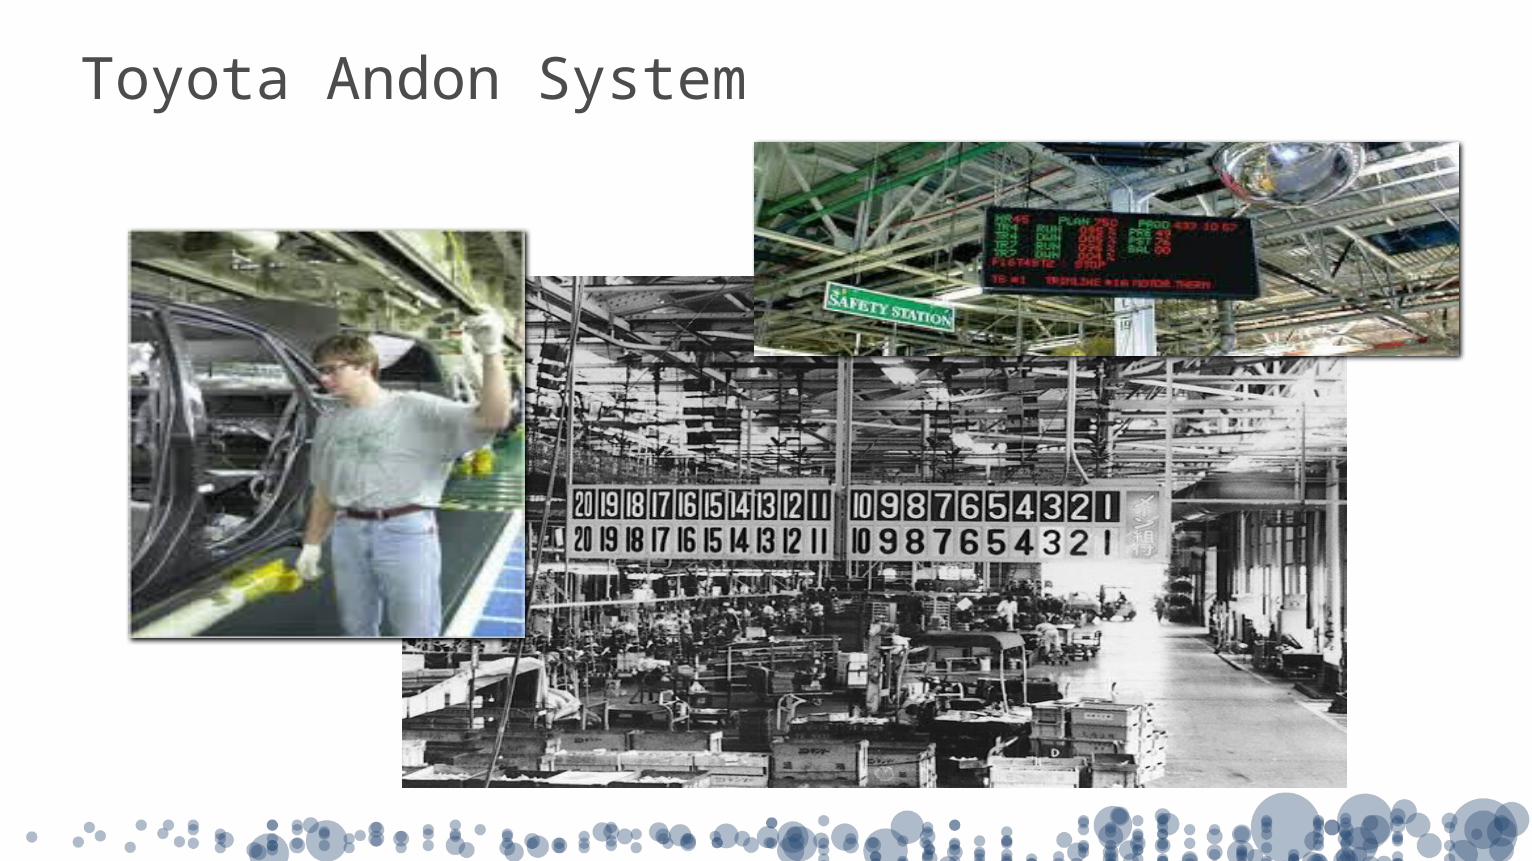
Toyota Andon System

Toyota Way

Analytic Culture
•A shared, baseline understanding of the business: who, what, when, where, why, how.Knowledge
•Empower those who know the business best to analyze data and share findings broadly with others. •Use data to build consensus, align initiatives, and win support.Participation•Leverage self-reliant analytics to strengthen commitment and job satisfaction by removing roadblocks, supporting learning, building community, and strengthening mission alignment.Engagement•Exercise, promote, and celebrate critical and creative thinking through analysis.Thinking

Not Carrots, Not Sticks

Not about the Perks

Maslow

Eupsychian Management

Thinkers about thinking
Abraham Maslow
Mihaly Csikszentmihalyi
Peter Drucker
Martin Seligman
(and many more)

• Autonomy• Mastery• Purpose• Community
The Four Amigos of Engagement

Engaged Not Engaged
• Autonomous• Challenged/Growing• Communal• Purposeful
• Blocked• Stuck• Isolated• Meaningless
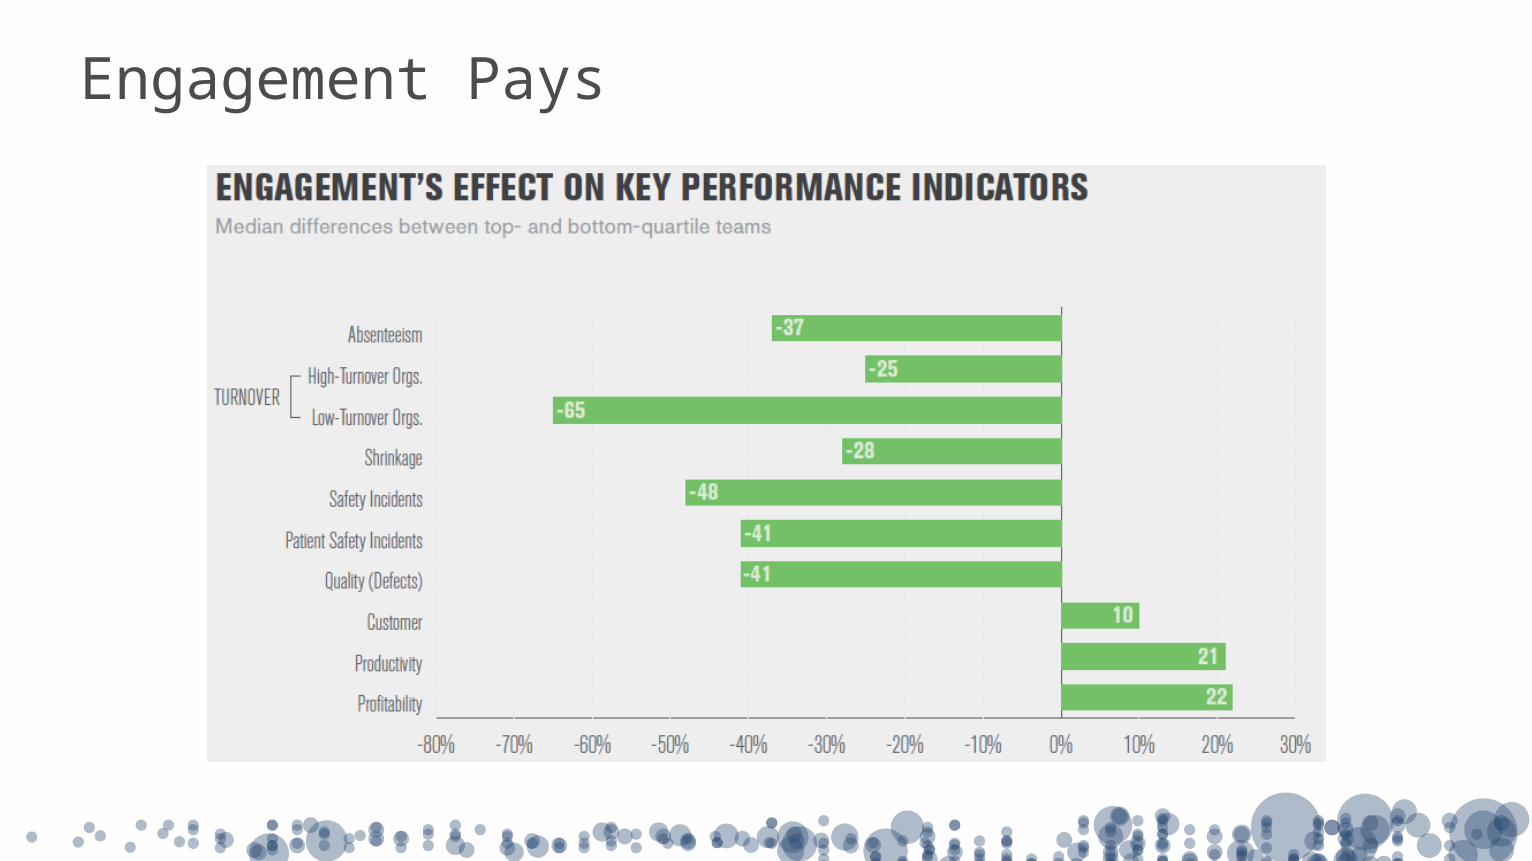
Engagement Pays

Most organizations aren’t doing so well…
In developed countries, enagement hovers around 20% on average.

Employee Value Proposition

#1 Demotivator: Road Blocks
“People are most satisfied with their jobs (and therefore most motivated) when those jobs give them the opportunity to experience achievement.”

#1 Demotivator: Road-blocks
“[W]e discovered the progress principle: Of all the things that can boost emotions, motivation, and perceptions during a workday, the single most important is making progress in meaningful work.”

Flow matters
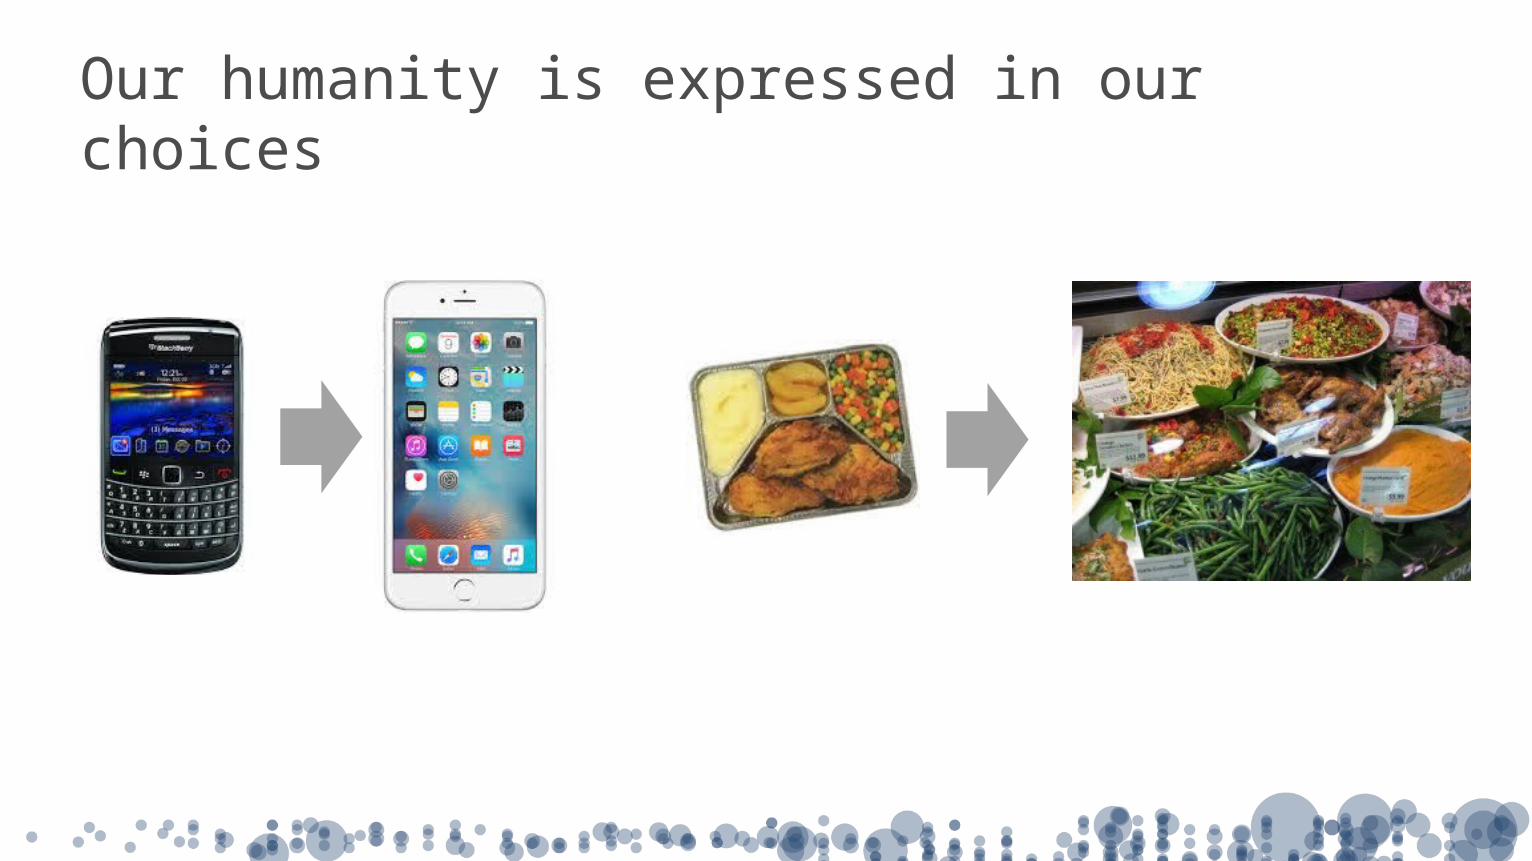
Our humanity is expressed in our choices

Our humanity is expressed in our choices

Which workplace reflects our humanity?
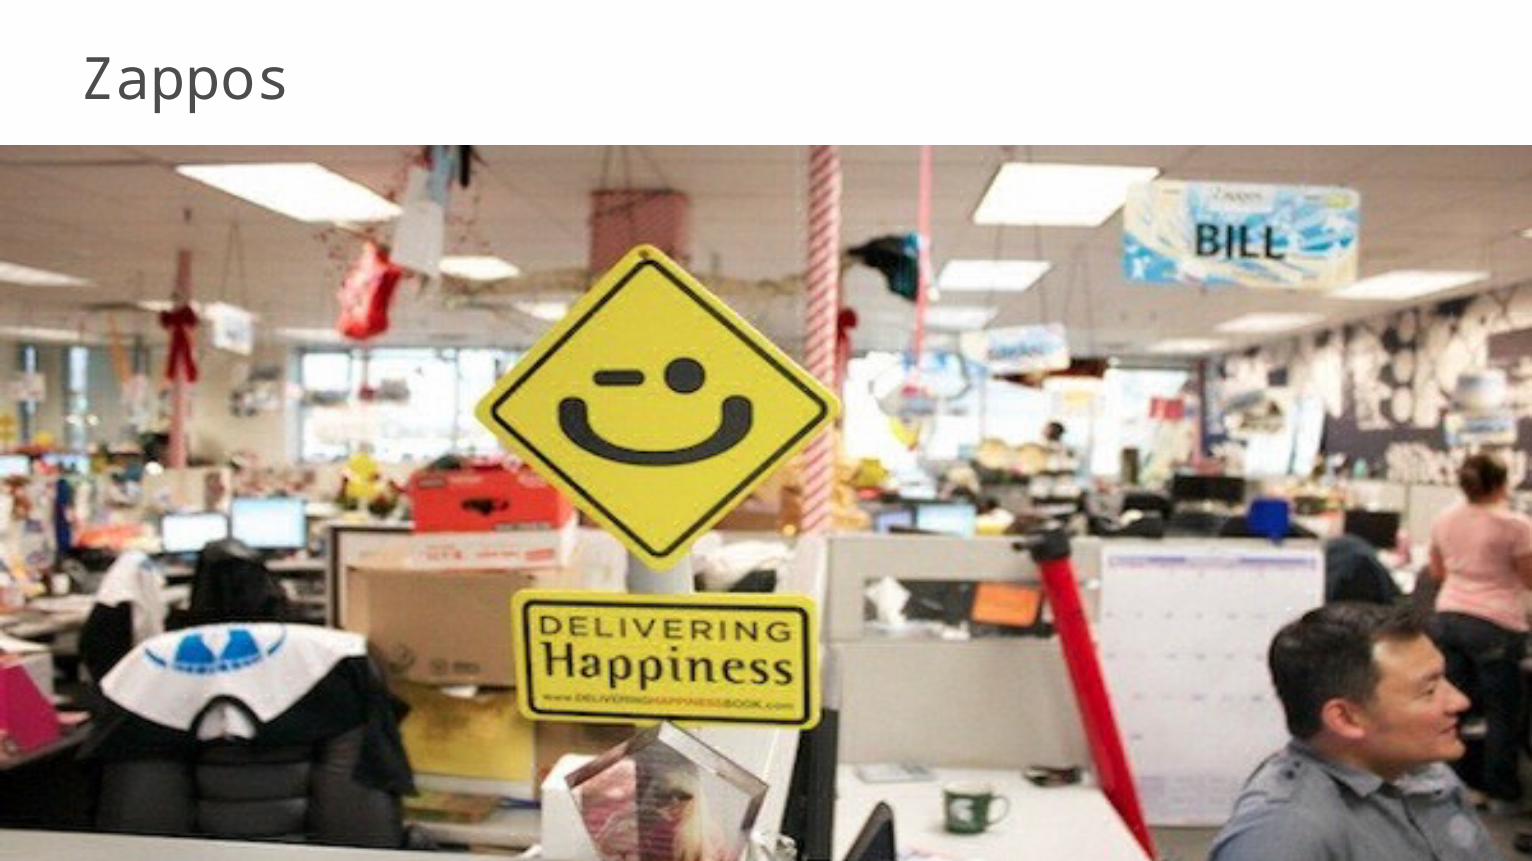
Zappos

Traditional BI is disengaging. It is inhumane.

Analytic Culture
•A shared, baseline understanding of the business: who, what, when, where, why, how.Knowledge
•Empower those who know the business best to analyze data and share findings broadly with others. •Use data to build consensus, align initiatives, and win support.Participation•Leverage self-reliant analytics to strengthen commitment and job satisfaction by removing roadblocks, supporting learning, building community, and strengthening mission alignment.Engagement•Exercise, promote, and celebrate critical and creative thinking through analysis.Thinking

Where will the next great idea come from?Where will the next great idea come from?

Critical thinking Evaluate• Judge• Compare• Contrast• Critique• Choose• Rate• Select Synthesize• Compose• Originate• Design• Construct• Plan• Create• Invent• Organize• Combine• Predict• Revise
Analyze• Compare• Classify• Point out• Distinguish• Infer• Select• Dissect• Specify• Distinguish• Categorize

Brain exercise

Foundational skill-set, “A Liberal Art”
Cicero
Socrates
David S. Moore
“Rich setting for problem solving and group work.”

Applied, experiential, active learning

Analytic Culture
Thinking
Knowledge
Participation
Engagement
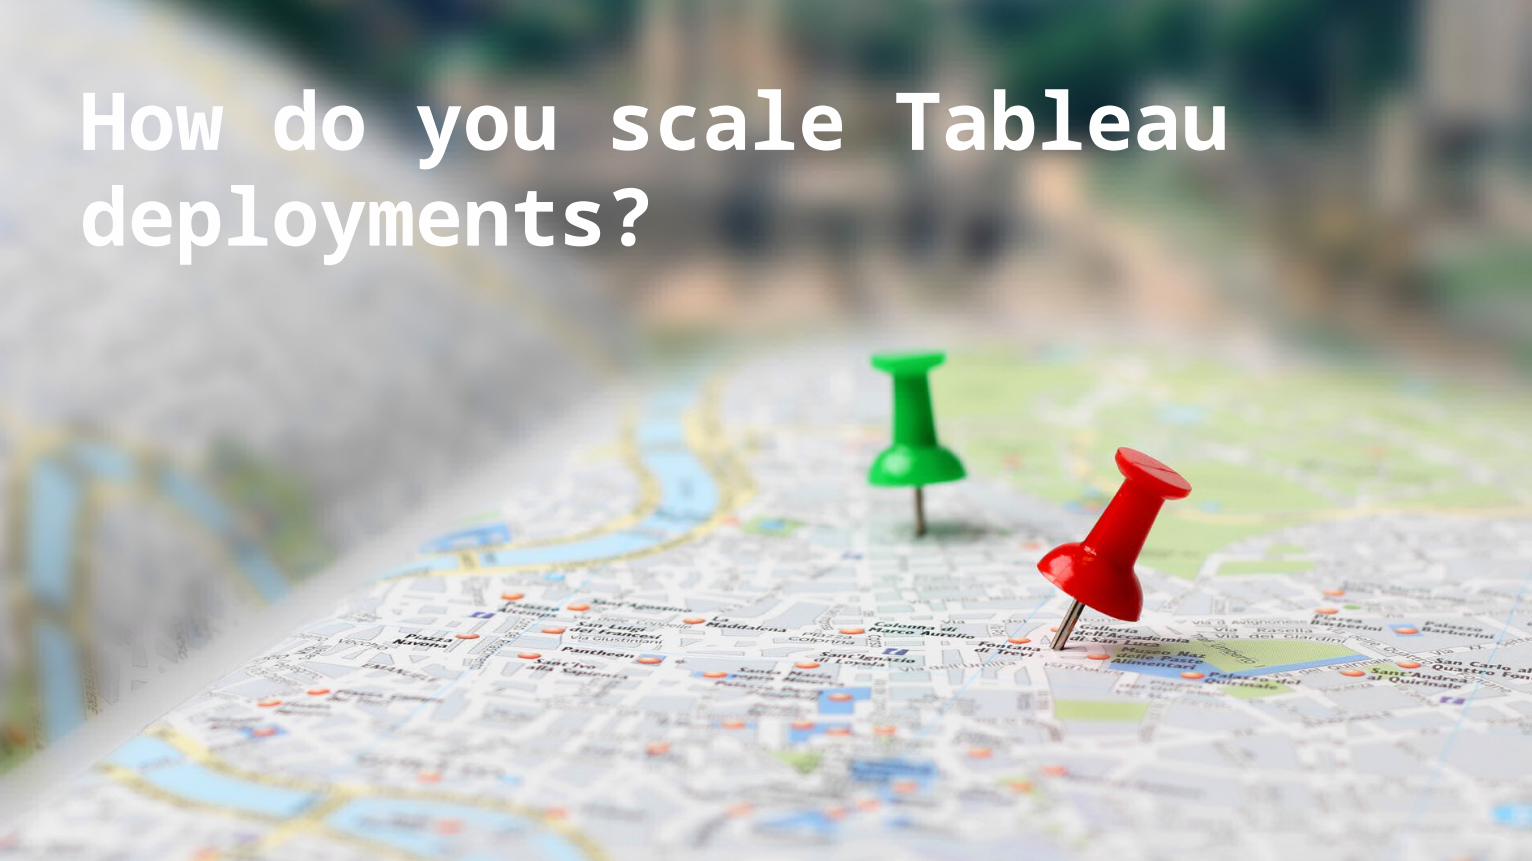
How do you scale Tableau deployments?

“Organic Growth”
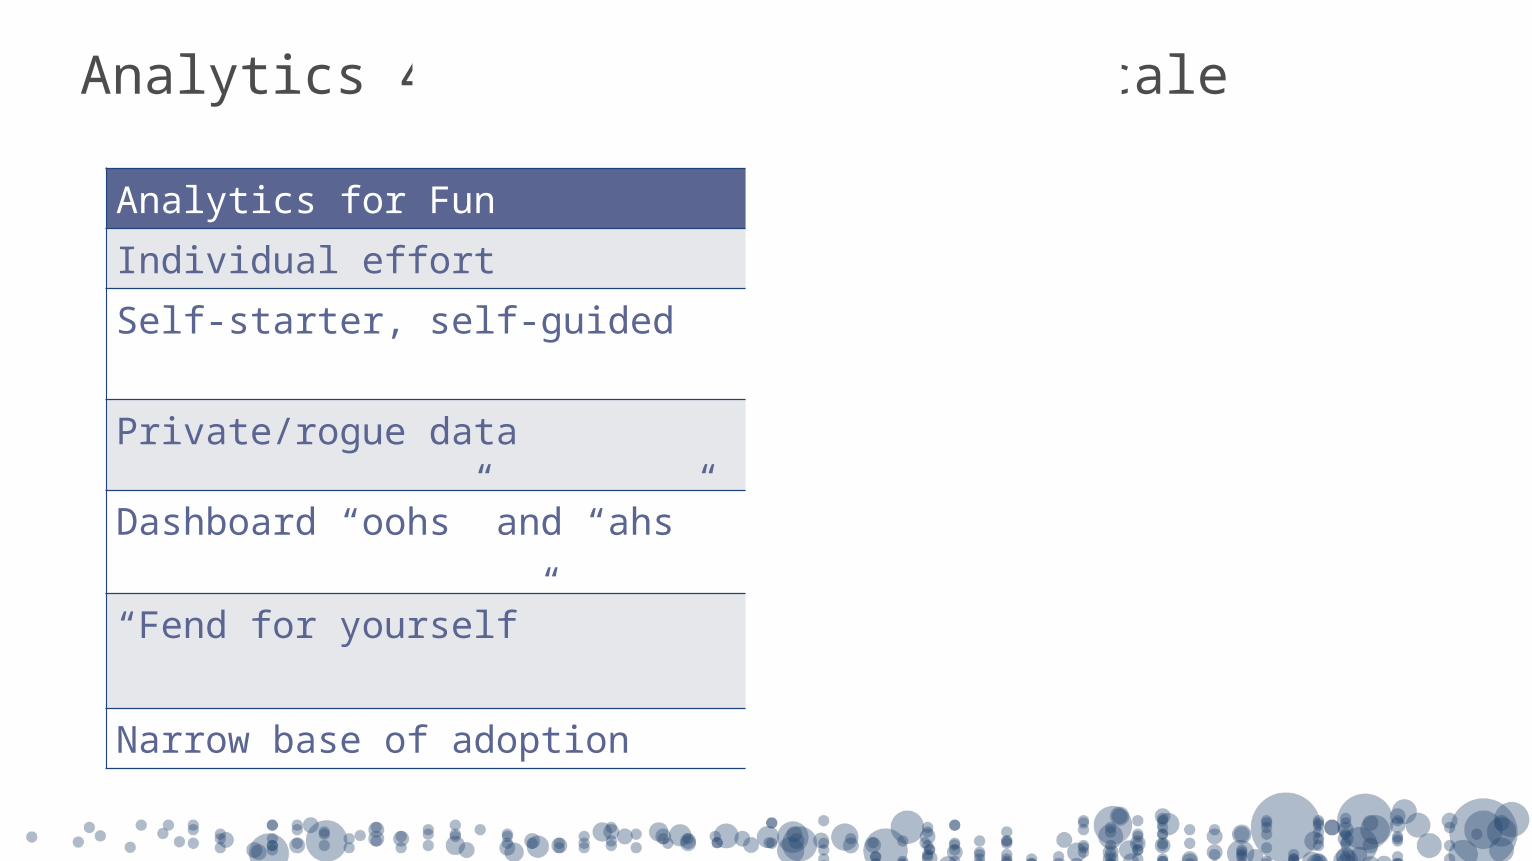
Analytics 4 Fun != Analytics @ Scale
Analytics for Fun Analytics at ScaleIndividual effort Community effortSelf-starter, self-guided Shared resources/division of labor
Private/rogue data Sanctioned, enterprise data
Dashboard “oohs” and “ahs” Systematic skill building
“Fend for yourself” Programmatic support & encouragement
Narrow base of adoption Broad-based adoption

Deliberate, programmatic support
Why deliberate, programmatic support?

Why deliberate, programmatic support?

Why deliberate, programmatic support?
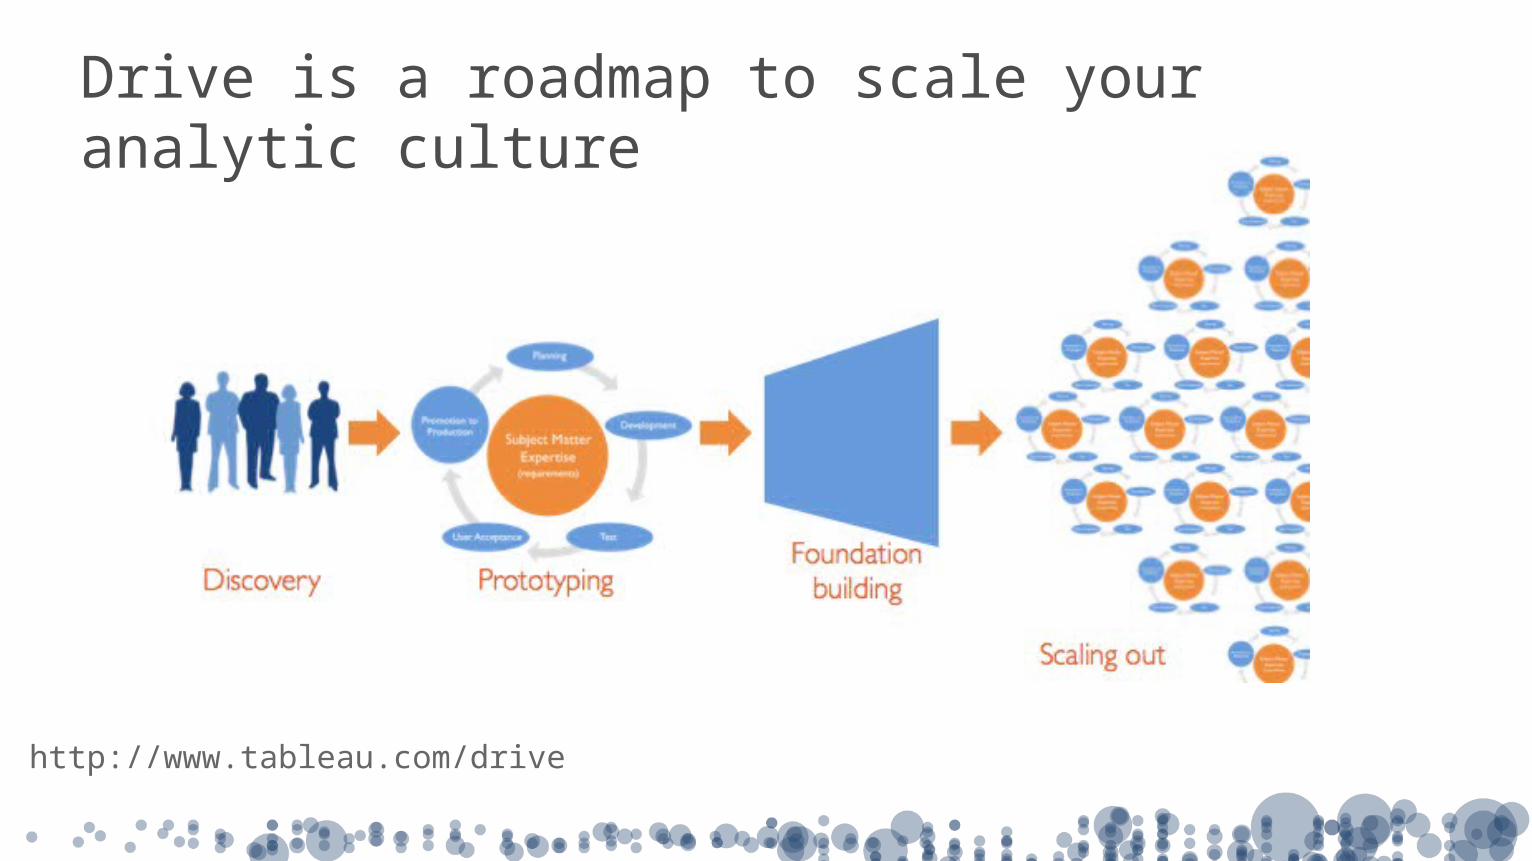
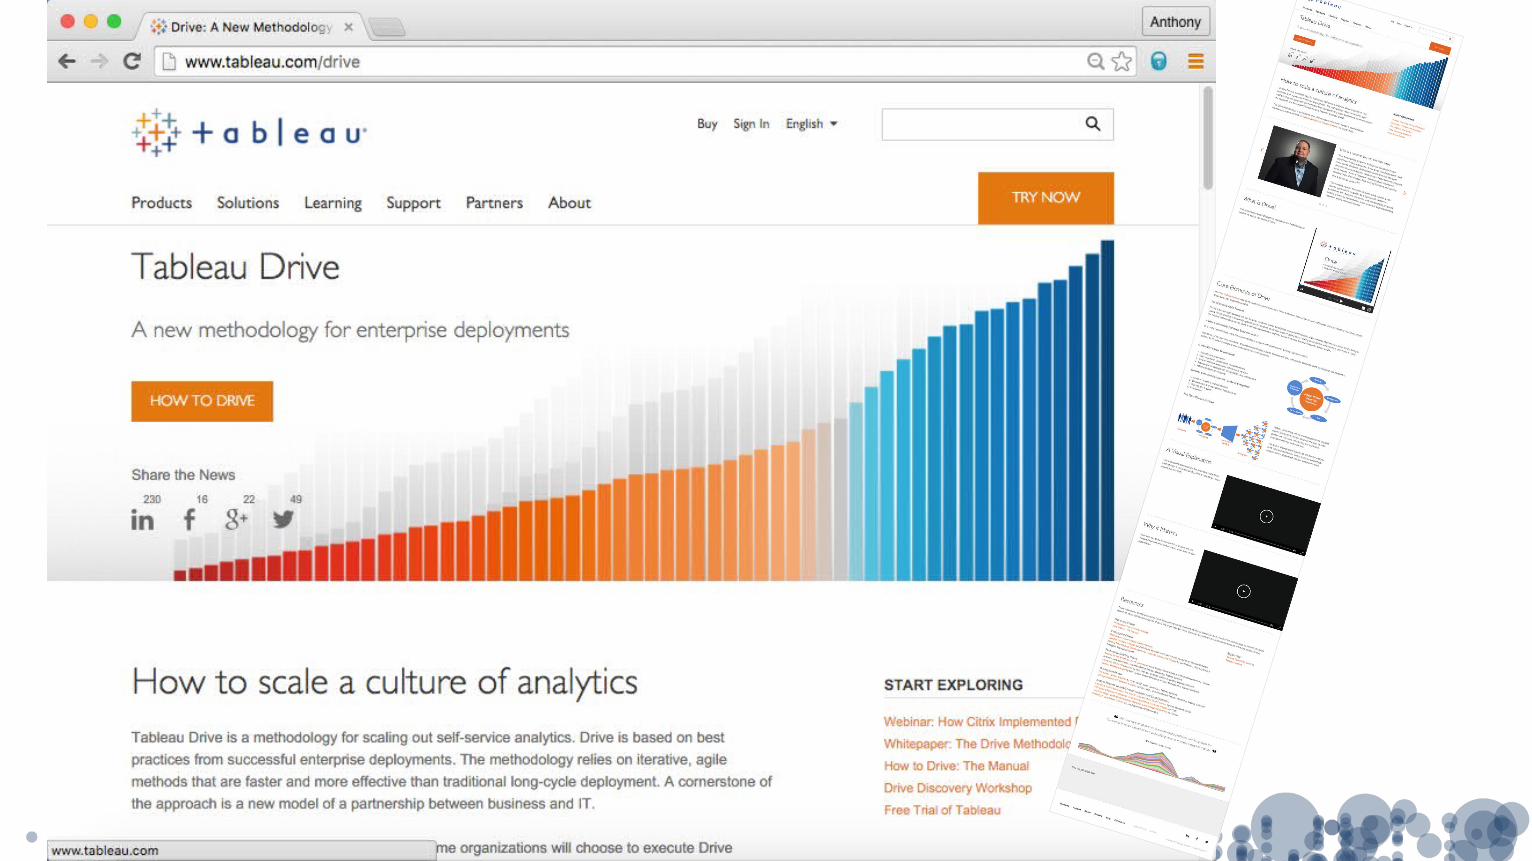
Drive is a roadmap to scale your analytic culture
http://www.tableau.com/drive

Drive’s Big Ideas
• Business owns the creative and analytical work.• IT is empowered to do what they do best, better.• Great visualizations are the beginning, not the end, of
adoption.• Drive provides a concrete plan that expands the
vision and reduces risk in deploying enterprise-wide analytics whether implemented in-house, with Tableau consulting, or partner consulting.

A partnership that works
IT Role• Operations• Infrastructure• Systems• Security• Data• Production environment
Business Role• Creative work• Data requirements• Community• Helpdesk• Evangelism• Sandbox environment
ExecutionEnablement
MORE responsibility
NEWresponsibilities

Drive best practices

Getting Started, Properly
– Own the “getting started” experience and do it right.

Skills Pyramid
– Develop champions throughout the organization and enable users.

Analysis Not Replication
– Follow a repeatable process to translate business questions into data projects.

Balance Control with Agility
– There is a difference between managed data discovery and traditional BI lockdown.

Teamwork or Bust
– Bridge the gap between business and IT.
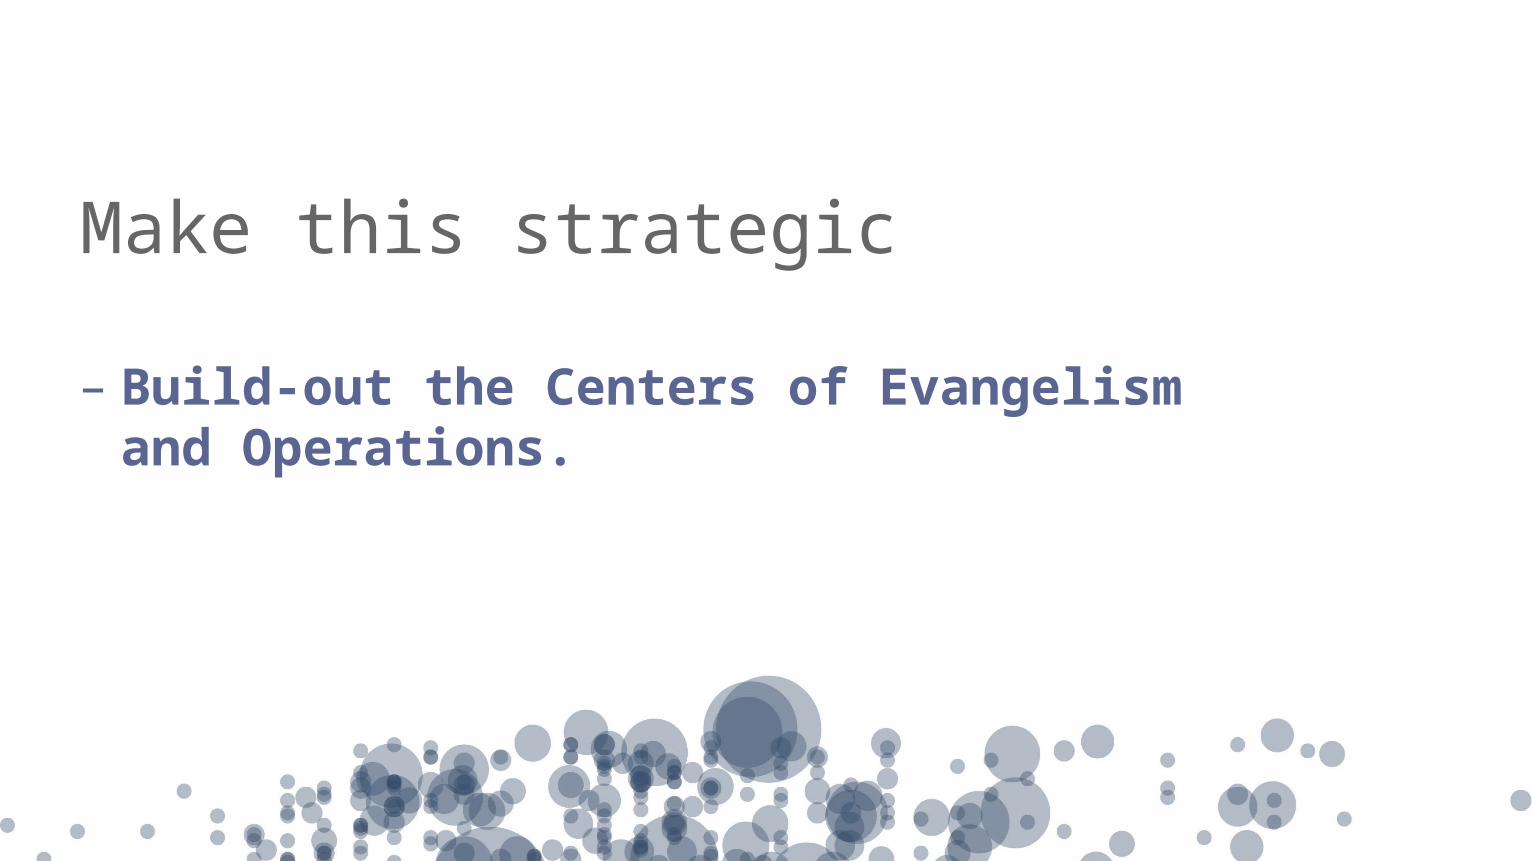
Make this strategic
– Build-out the Centers of Evangelism and Operations.

Measure and Monitor
– Create a feedback loop to quantify business impact.

• Discovery• Prototyping• Best Practices development• Custom training• Helpdesk• Scale-out• Assessment• Events
Service Offerings

Tableau’s Mission
Help people see and understand their data.

Self-reliant analytics at scale is doable.

Ask a Tableau champion

Tableau Drive
ThinkingKnowledge Participation Engagement

Thankyou.