“it isn’t welfare.”
DESCRIPTION
Social Security 1935-2006. Know these items for the SS quiz. “It isn’t welfare.”. There are 300 million in the U.S. About how many people receive Social Security benefits ? a. 2 million b. 8 million c. 53 million d. 75 million - PowerPoint PPT PresentationTRANSCRIPT

““It isn’t It isn’t welfare.”welfare.”
Know theseKnow these
items foritems forthe SS quiz.the SS quiz.
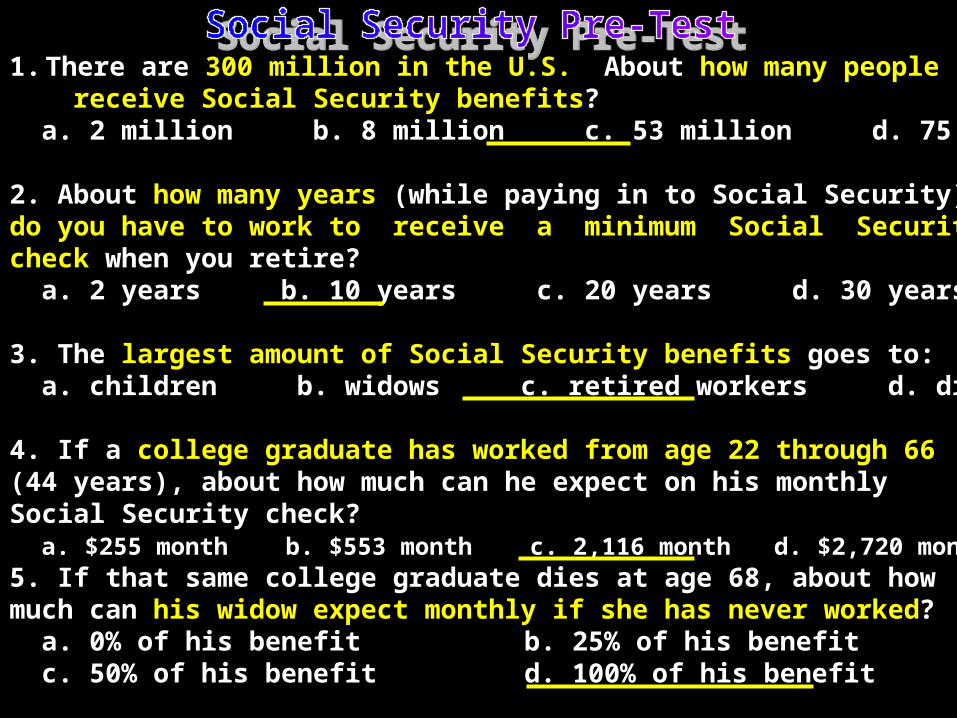
1. There are 300 million300 million in the U.S. About how many people how many people receive Social Security benefitsreceive Social Security benefits? a. 2 million b. 8 million c. 53 million d. 75 million
2. About how many yearshow many years (while paying in to Social Security)do you have to work to receive a minimum Social Securitydo you have to work to receive a minimum Social Securitycheckcheck when you retire? a. 2 years b. 10 years c. 20 years d. 30 years
3. The largest amount of Social Security benefitslargest amount of Social Security benefits goes to: a. children b. widows c. retired workers d. disabled
4. If a college graduate has worked from age 22 through 66has worked from age 22 through 66(44 years), about how much can he expect on his monthlySocial Security check? a. $255 month b. $553 month c. 2,116 month d. $2,720 month5. If that same college graduate dies at age 68, about howmuch can his widow expect monthly if she has never workedhis widow expect monthly if she has never worked? a. 0% of his benefit b. 25% of his benefit c. 50% of his benefit d. 100% of his benefit
Social Insecurity?Social Insecurity?
70% of retirees70% of retirees get at least half of half of their cash income from Social their cash income from Social SecuritySecurity. 40% get 90% from Social 40% get 90% from Social SecuritySecurity. This makes Social Security the differencedifference betweenbetween dignitydignity and povertypoverty for most retirees – while literally saving saving some fromsome from starvationstarvation. There is no reason to believe this dependence will be less in the future.
80 81 82 83 84 85 86 87 88 89 90 91 92 93 94 94 95 96 97 98 99 00 01 02 03 04 05 06 0780 81 82 83 84 85 86 87 88 89 90 91 92 93 94 94 95 96 97 98 99 00 01 02 03 04 05 06 07
14%14%
12%12%
10%10%
8%8%
6%6%
4%4%
2%2%
00
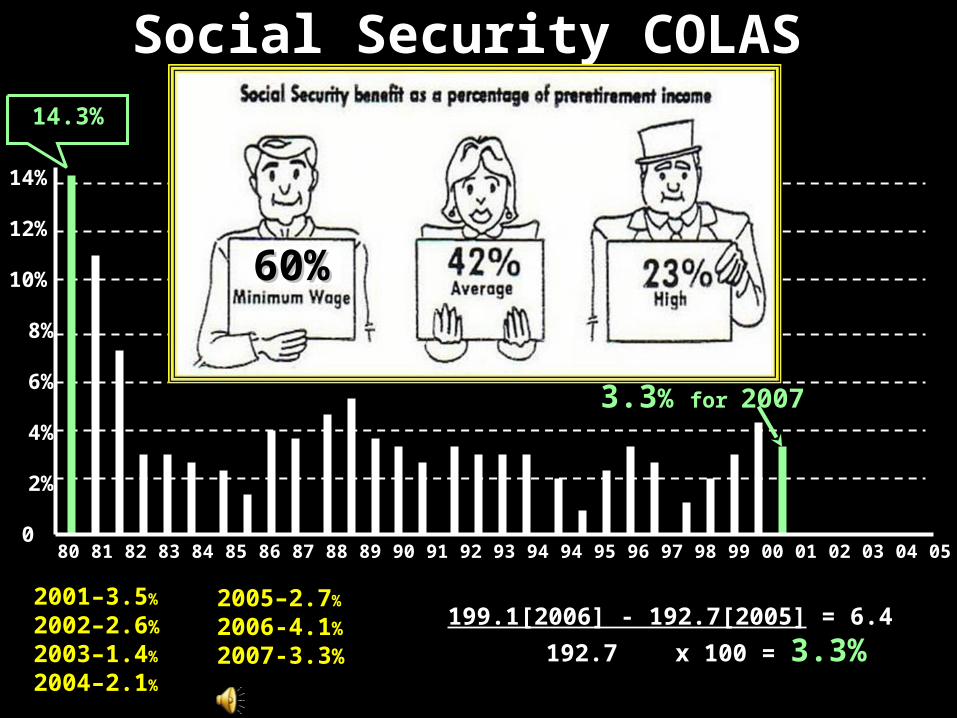
SSocial ocial SSecurity COLAecurity COLASS
2005–2.72005–2.7%%
2006-4.12006-4.1%%
2007-3.32007-3.3%%
3.33.3% % for for 20072007
199.1[2006] - 192.7[2005]199.1[2006] - 192.7[2005] = 6.4 = 6.4
192.7 x 100 = 192.7 x 100 = 3.3%3.3%
2001–3.52001–3.5% %
2002–2.62002–2.6%%
2003–1.42003–1.4%%
2004–2.12004–2.1%%
14.3%14.3%
60%60%
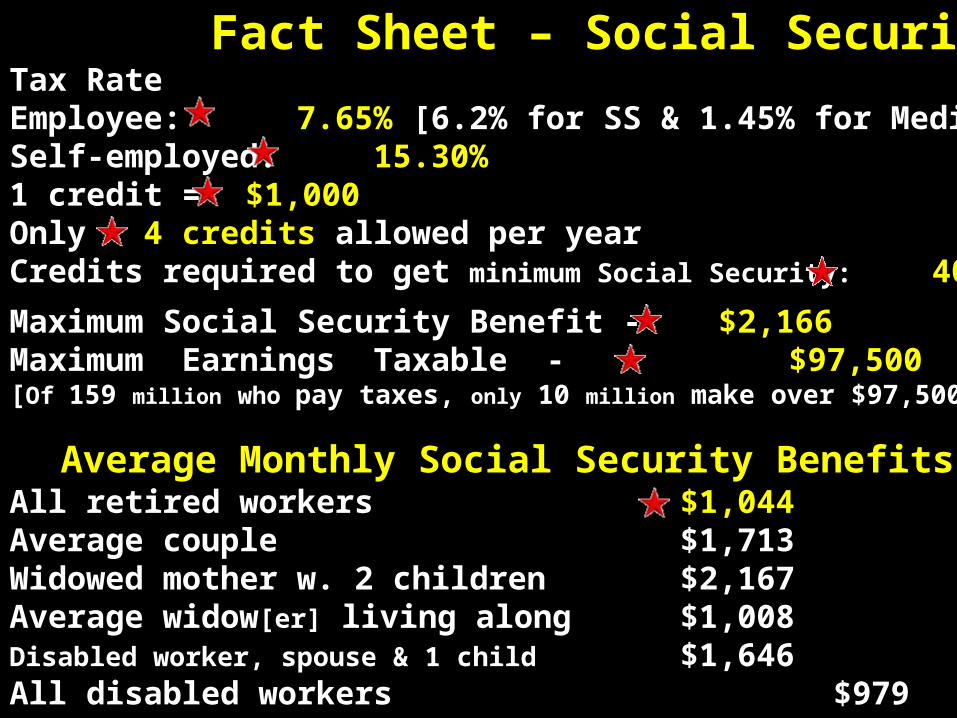
Fact Sheet – Social Security 2006Fact Sheet – Social Security 2006Tax RateEmployee: 7.65%7.65% [6.2% for SS & 1.45% for Medicare]Self-employed: 15.30%15.30%1 credit = $1,000$1,000Only 4 credits4 credits allowed per yearCredits required to get minimum Social Security: 4040
Maximum Social Security Benefit - $2,166$2,166Maximum Earnings Taxable - $97,500$97,500[Of 159 million who pay taxes, only 10 million make over $97,500]
Average Monthly Social Security BenefitsAverage Monthly Social Security BenefitsAll retired workers $1,044$1,044Average couple $1,713Widowed mother w. 2 children $2,167Average widow[er] living along $1,008Disabled worker, spouse & 1 child $1,646All disabled workers $979
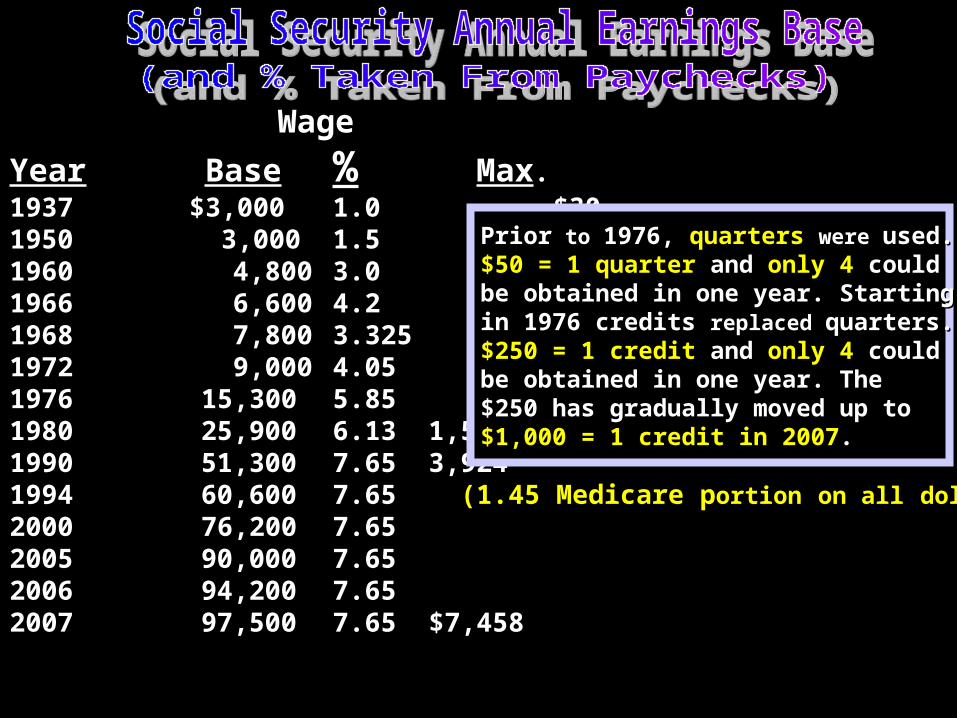
WageWage
YearYear BaseBase %% MaxMax..19371937 $3,000 $3,000 1.0 1.0 $30 $3019501950 3,000 3,000 1.51.5 $45 $4519601960 4,8004,800 3.03.0 144 14419661966 6,6006,600 4.24.2 277 27719681968 7,8007,800 3.3253.325 343 34319721972 9,0009,000 4.054.05 468 4681976 15,3001976 15,300 5.855.85 895 895 19801980 25,90025,900 6.136.13 1,588 1,588 19901990 51,30051,300 7.657.65 3,9243,92419941994 60,60060,600 7.65 7.65 (1.45 Medicare p(1.45 Medicare portionortion on allon all dollarsdollars) (SS=6.2%)) (SS=6.2%)2000 76,2002000 76,200 7.657.6520052005 90,00090,000 7.657.6520062006 94,20094,200 7.657.6520072007 97,50097,500 7.657.65 $7,458$7,458
PriorPrior to to 1976, 1976, quartersquarters were were used.used.$50 = 1 quarter$50 = 1 quarter and and only 4only 4 could couldbe obtained in one year. Starting be obtained in one year. Starting in 1976 credits in 1976 credits replaced replaced quarters.quarters.$250 = 1 credit$250 = 1 credit and and only 4only 4 could couldbe obtained in one year. The be obtained in one year. The $250 has gradually moved up to$250 has gradually moved up to$1,000 = 1 credit in 2007$1,000 = 1 credit in 2007..
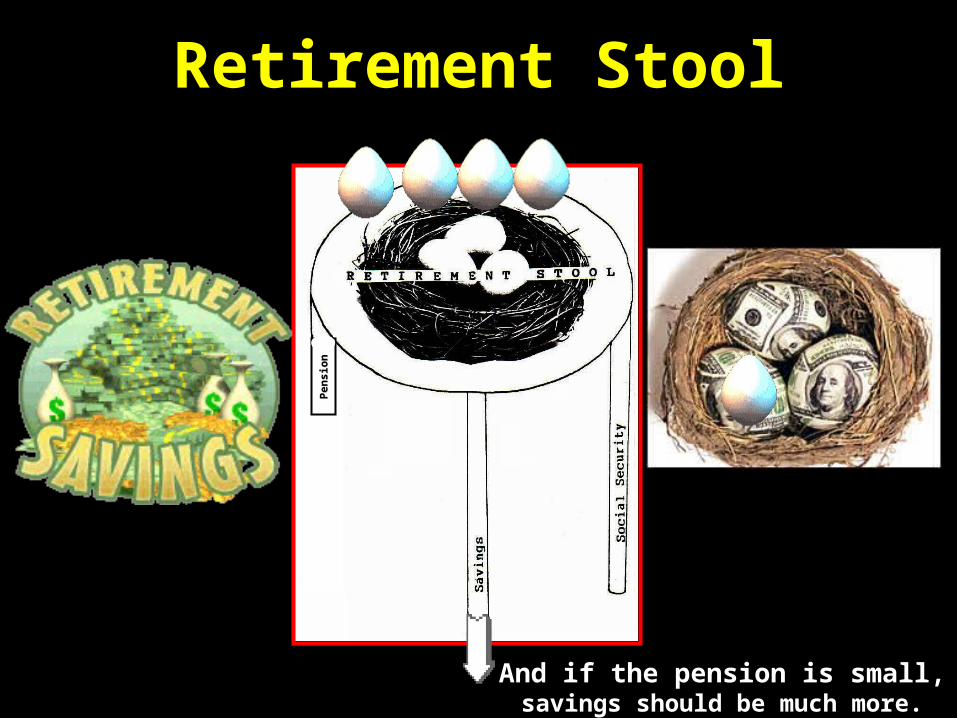
Retirement StoolRetirement Stool
And if the pension is small,And if the pension is small,savings should be much more.savings should be much more.
Pen
sio
nP
en
sio
n
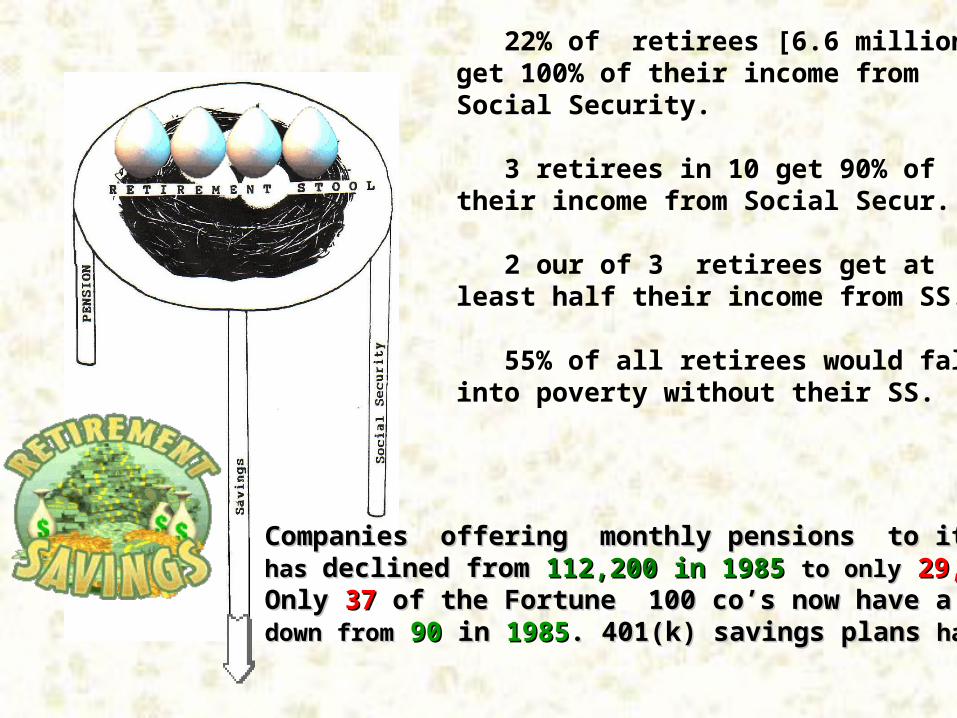
22% of retirees [6.6 million]get 100% of their income from Social Security.
3 retirees in 10 get 90% oftheir income from Social Secur.
2 our of 3 retirees get atleast half their income from SS.
55% of all retirees would fallinto poverty without their SS.
Companies offering monthly pensions to its retirees Companies offering monthly pensions to its retirees has has declined from declined from 112,200 in 1985 112,200 in 1985 to onlyto only 29,700 today29,700 today. . Only Only 3737 of the Fortune 100 co’s now have a pension, of the Fortune 100 co’s now have a pension, down fromdown from 9090 in in 19851985. 401(k) savings plans . 401(k) savings plans have have tripled.tripled.
50 60 70 80 90 200650 60 70 80 90 2006
8080 years oldyears old
7575
7070
6565
6060
5555
5050
4545
78 in78 in20062006
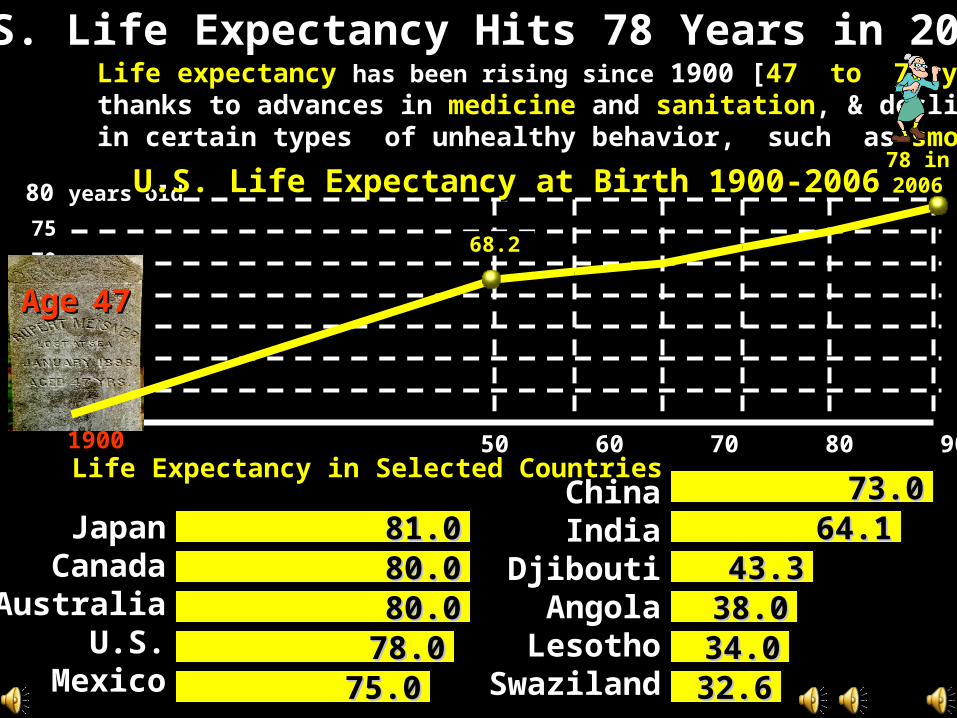
U.S. Life Expectancy Hits 78 Years in 2006U.S. Life Expectancy Hits 78 Years in 2006Life expectancyLife expectancy has been rising sincehas been rising since 1900 [ 1900 [47 to 78 years47 to 78 years], ], thanks to advances in thanks to advances in medicinemedicine and and sanitationsanitation, & declines , & declines in certain types of unhealthy behavior, such as in certain types of unhealthy behavior, such as smokingsmoking..
68.268.2
U.S. Life Expectancy at Birth 1900-2006U.S. Life Expectancy at Birth 1900-2006
Life Expectancy in Selected CountriesLife Expectancy in Selected Countries
JapanJapanCanadaCanada
AustraliaAustraliaU.S.U.S.
MexicoMexico
ChinaChinaIndiaIndia
DjiboutiDjiboutiAngolaAngola
LesothoLesothoSwazilandSwaziland
81.081.0
75.075.078.078.080.080.080.080.0
32.632.634.034.038.038.043.343.3
64.164.173.073.0
AgeAge 4747
19001900
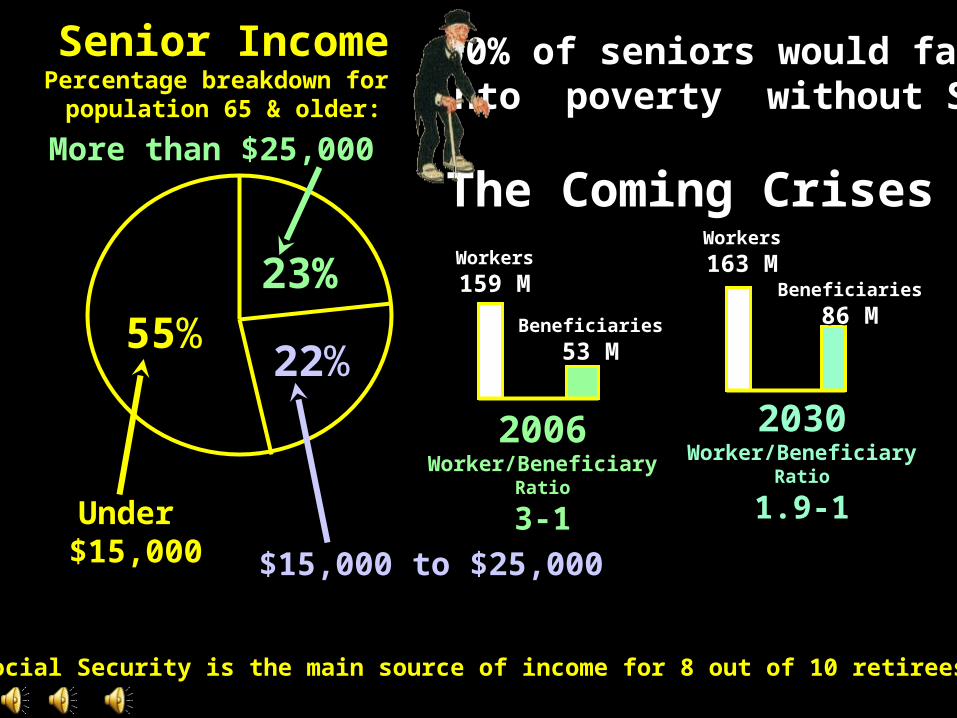
Social Security is the main source of income for 8 out of 10 retirees.Social Security is the main source of income for 8 out of 10 retirees.
5555%%23%23%
2222%%
Senior IncomeSenior IncomePercentage breakdown for Percentage breakdown for
population 65 & older:population 65 & older:
More than $25,000More than $25,000
$15,000 to $25,000$15,000 to $25,000
Under Under $15,000$15,000
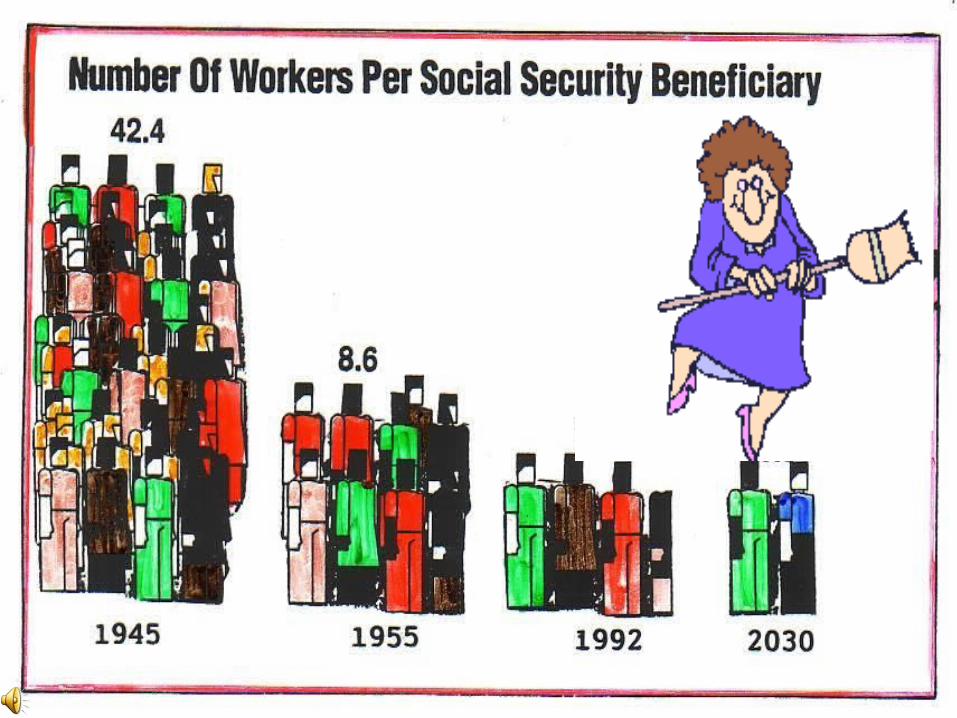
20062006Worker/BeneficiaryWorker/Beneficiary
RatioRatio
3-13-1
20302030Worker/BeneficiaryWorker/Beneficiary
RatioRatio
1.9-11.9-1
The The Coming CrisesComing CrisesWorkersWorkers
159 M159 M
BeneficiariesBeneficiaries
53 M53 M
WorkersWorkers
163 M163 MBeneficiariesBeneficiaries
86 M86 M
50% of seniors would fall50% of seniors would fallinto poverty without SS.into poverty without SS.
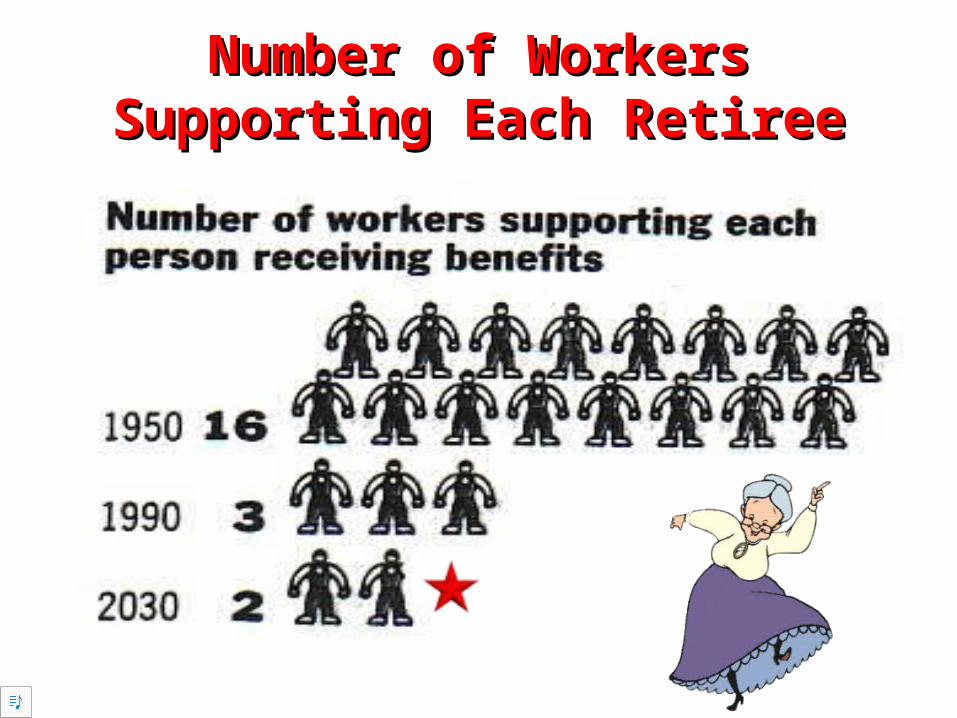
Number of WorkersNumber of WorkersSupporting Each RetireeSupporting Each Retiree

6363%%
1414%%
1010%%
Where The Money GoesWhere The Money GoesSurvivors of deceased workers [6.6 M]Survivors of deceased workers [6.6 M]
RetireesRetirees[34 million][34 million]
13%13%Spouses and childrenSpouses and childrenof retires & disabled of retires & disabled workers [4.8 million]workers [4.8 million]
Disabled workers [6.6 million]Disabled workers [6.6 million]

Social SecuritySocial Security53 million53 million people receive over $625 billion dollars.
7.657.65 up to $97,500$97,500 [$7,458 max. $7,458 max. for a single person]
Self employedSelf employed pay 15.3%15.3% up to $97,500$97,500 or $14,917$14,917.Only about 10 million exceed $97,000 in yearly income.
This act was passed in 19351935 to go into effect in 1940.In 1940s, you paid 1% on up to $3,000 [max. of $30].
Ida FullerIda Fuller[First Lady of social Security][First Lady of social Security]Of Vermont after contributing $24.75 from 1937-1939 received the 1st check for $22.54. She died at age 100 and collected $22,888.92$22,888.92 for her $24.75$24.75 contribution contribution.
Check #: 00-000-001Check #: 00-000-001

FICA gives 4-way protectionFICA gives 4-way protection
RetirementRetirement
34 million retirees34 million retirees
MedicareMedicare1.45%1.45%
For people over 65For people over 65For people receivingFor people receivingdisability benefits fordisability benefits forat least 24 monthsat least 24 months
For people with perman-For people with perman-nent kidney failurenent kidney failure
SurvivorsSurvivors
6.6 mil. [spouse and children]6.6 mil. [spouse and children]Unmarried child under 18 or19Unmarried child under 18 or19 if still in high school.if still in high school.
A widow who has never worked A widow who has never worked would receive 100% would receive 100% of hisof his benefit. benefit.1 out of every 8 females and 11 out of every 8 females and 1of every 5 males will die beforeof every 5 males will die beforeage 65.age 65.
DisabilityDisability
6.6 mil. Disabled6.6 mil. Disabled1.8 depen. of disabled1.8 depen. of disabled
1 out of 4 females1 out of 4 femaleswill become severelywill become severelydisabled before 65. disabled before 65.
34 mil. Retirees34 mil. Retirees3.0 mil. Dependents3.0 mil. Dependents6.6 mil. Disabled6.6 mil. Disabled1.8 mil. Dependents1.8 mil. Dependents of disabledof disabled6.6 mil. survivors6.6 mil. survivors

Social Security FinancesSocial Security Finances
Where Tax Revenue Comes FromWhere Tax Revenue Comes From
7.65% paid by workers7.65% paid by workers7.65% paid by employers7.65% paid by employers
Where Where TransferTransfer Payments Go Payments Go
Annual Retirement BenefitAnnual Retirement Benefit
Payroll taxesPayroll taxes
Retirement bRetirement benefitsenefitsSurvivor benefitsSurvivor benefitsDisability benefitsDisability benefits
MinimumMinimumMedianMedianMaximumMaximum
$330 billion$330 billion$87 billion$87 billion
$80$80
$12,528$12,528$25,992$25,992
$64 billion$64 billion
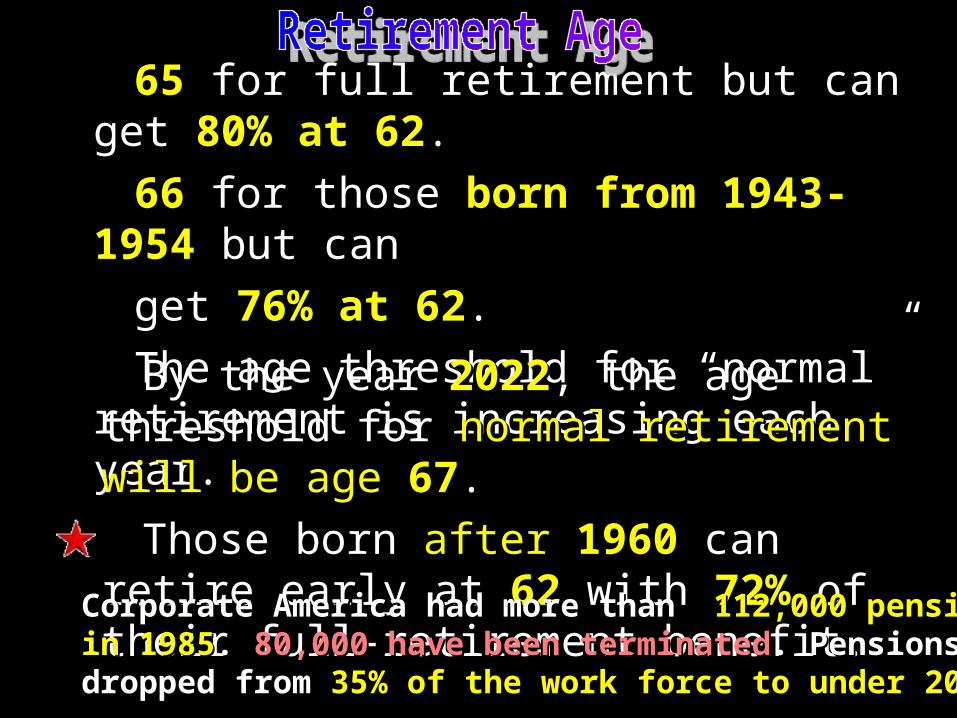
6565 for full retirement but can get 80% at 6280% at 62.
6666 for those born from 1943-1954born from 1943-1954 but can
get 76% at 6276% at 62.
The age threshold for “normal” retirement is increasing each year.
By the year 20222022, the age threshold for normal retirement will be agenormal retirement will be age 6767.
Those born afterafter 19601960 can retire early at 6262 with 72%72% of their full-retirement benefit.
Corporate America had more than Corporate America had more than 112,000 pensions112,000 pensionsin 1985in 1985. . 80,00080,000 have been terminatedhave been terminated. Pensions have. Pensions havedropped from dropped from 35% of the work force to under 20%35% of the work force to under 20%. .
Retirement benefits are based on an individual’s wages.
High-wage workers receive larger benefit checks than low-wage workers.
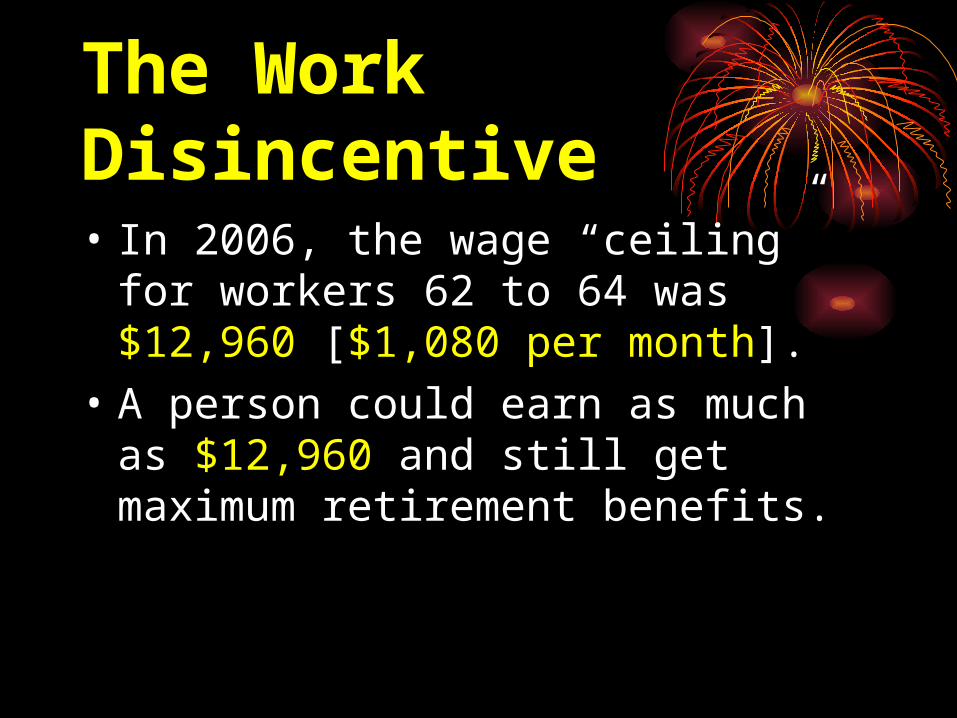
The Work The Work DisincentiveDisincentive• In 2006, the wage “ceiling” for
workers 62 to 64 was $12,960$12,960 [$1,080 per month$1,080 per month].
• A person could earn as much as $12,960$12,960 and still get maximum retirement benefits.
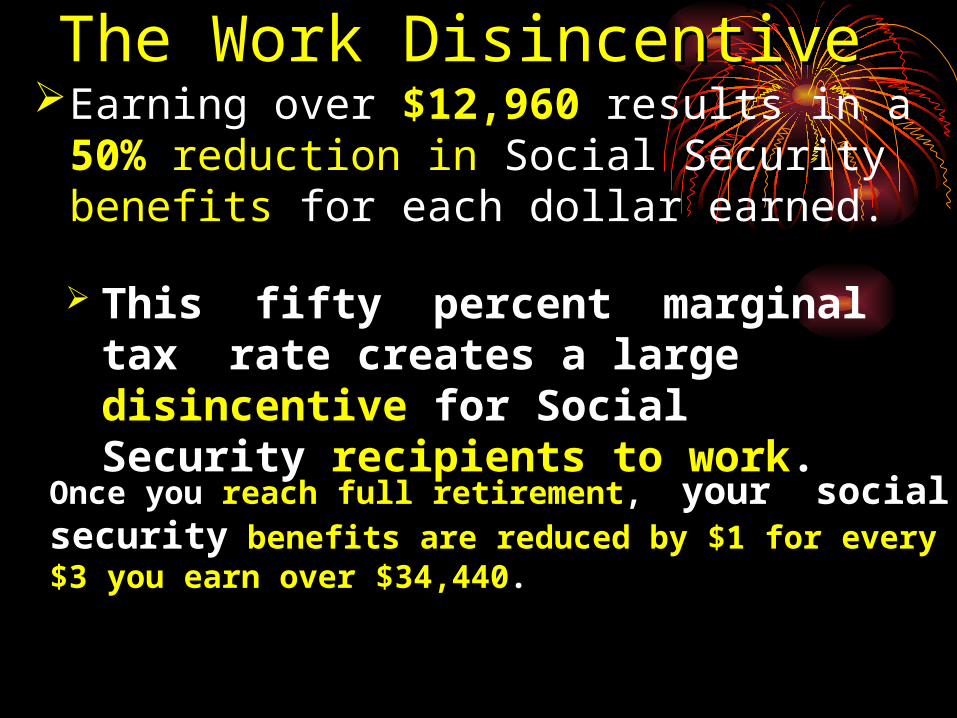
The Work DisincentiveThe Work DisincentiveEarning over $12,960$12,960 results in a 50%50%
reductionreduction inin Social Security benefitsbenefits for each dollar earned.
This fifty percent marginal tax rate creates a large disincentivedisincentive for Social Security recipients to workrecipients to work.
Once you Once you reach full retirementreach full retirement, , your socialyour social securitysecurity benefits are reduced by $1 for every benefits are reduced by $1 for every $3 you earn over $34,440$3 you earn over $34,440. .
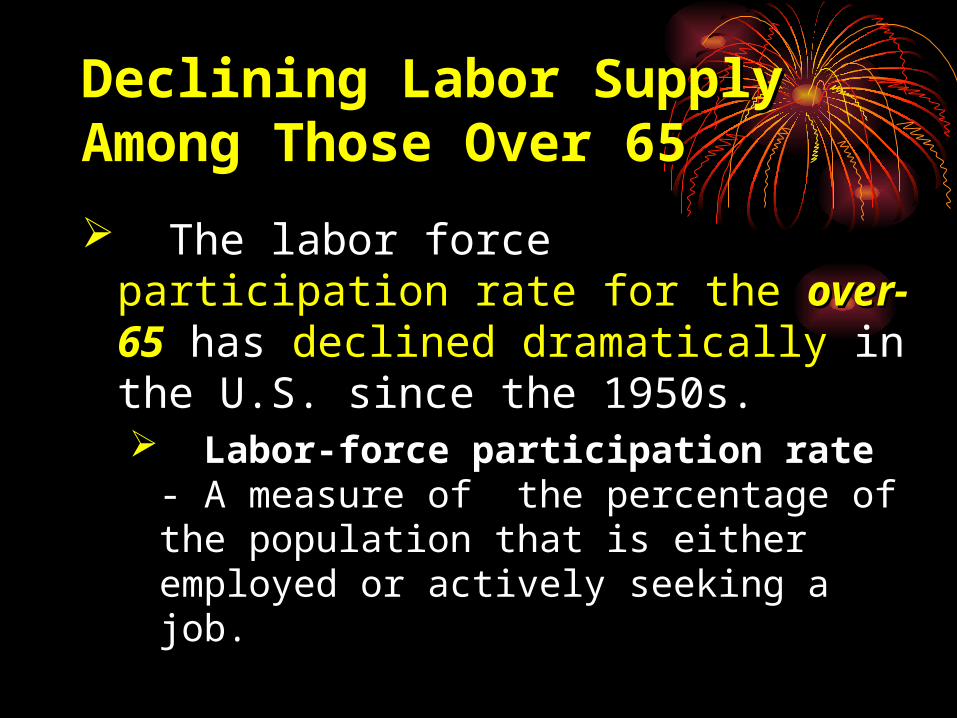
Declining Labor Supply Declining Labor Supply Among Those Over 65Among Those Over 65
The labor force participation rate participation rate for the for the over-65over-65 has declined declined dramaticallydramatically in the U.S. since the 1950s. Labor-force participation rate - A
measure of the percentage of the population that is either employed or actively seeking a job.
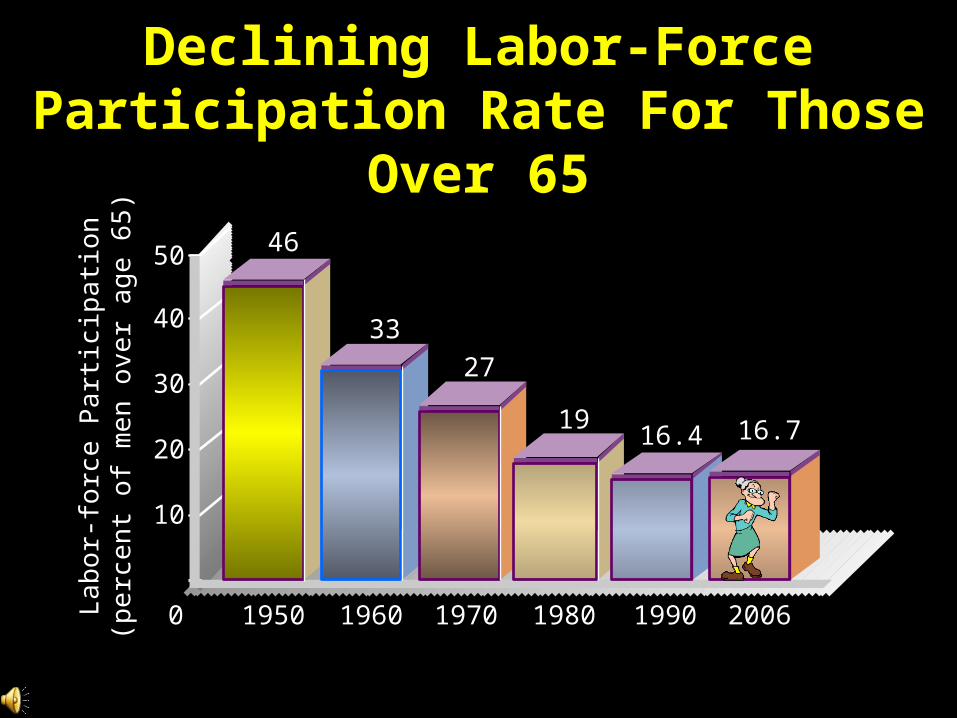
Declining Labor-Force Participation Declining Labor-Force Participation Rate For Those Over 65Rate For Those Over 65
Lab
or-
forc
e P
art
icip
atio
nL
abo
r-fo
rce
Pa
rtic
ipa
tion
(per
cent
of m
en o
ver a
ge 6
5)(p
erce
nt o
f men
ove
r age
65)
4646
27273333
191916.416.4 16.716.7
5050
4040
3030
2020
1010
00 1950950 19601960 19701970 19801980 19901990 20062006

Ida May Fuller – First Lady of Social SecurityIda May Fuller – First Lady of Social Security
Received thefirst check for
$22.54$22.54

First Check Issued on Jan. 31, First Check Issued on Jan. 31, 19401940

Last of the 1Last of the 1stst 31,557 to Get SS 31,557 to Get SS
BenefitsBenefits
106 year old William WeamerWilliam Weamer was the last of the last of the firstfirst to get benefits. 31,557 received benefits on January 31, 1940. Mr. Weamer died in July of 1981.
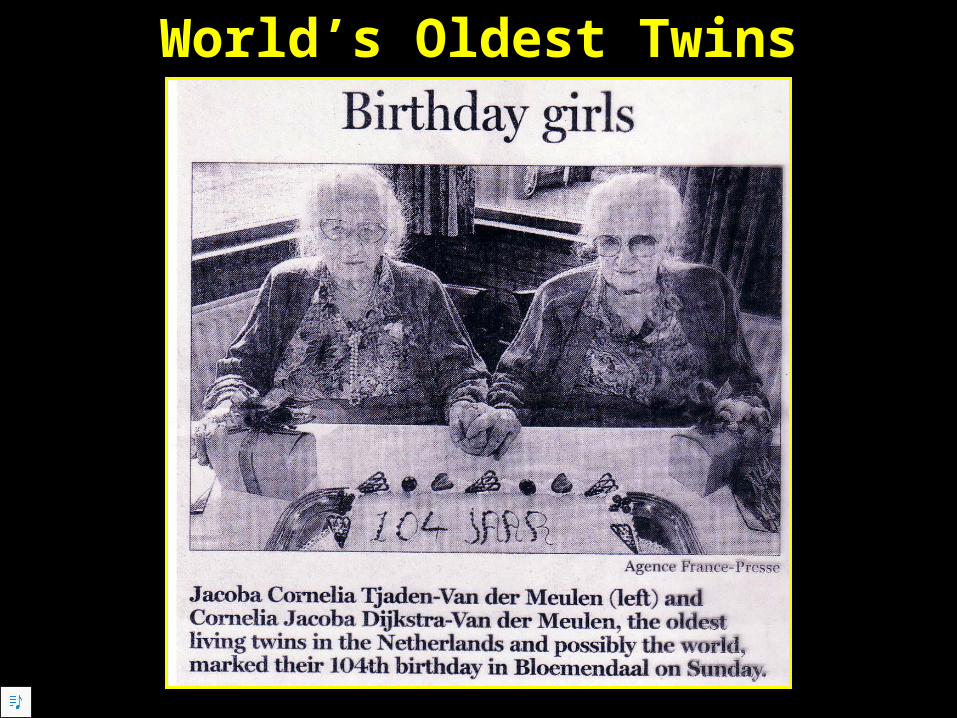
World’s Oldest TwinsWorld’s Oldest Twins
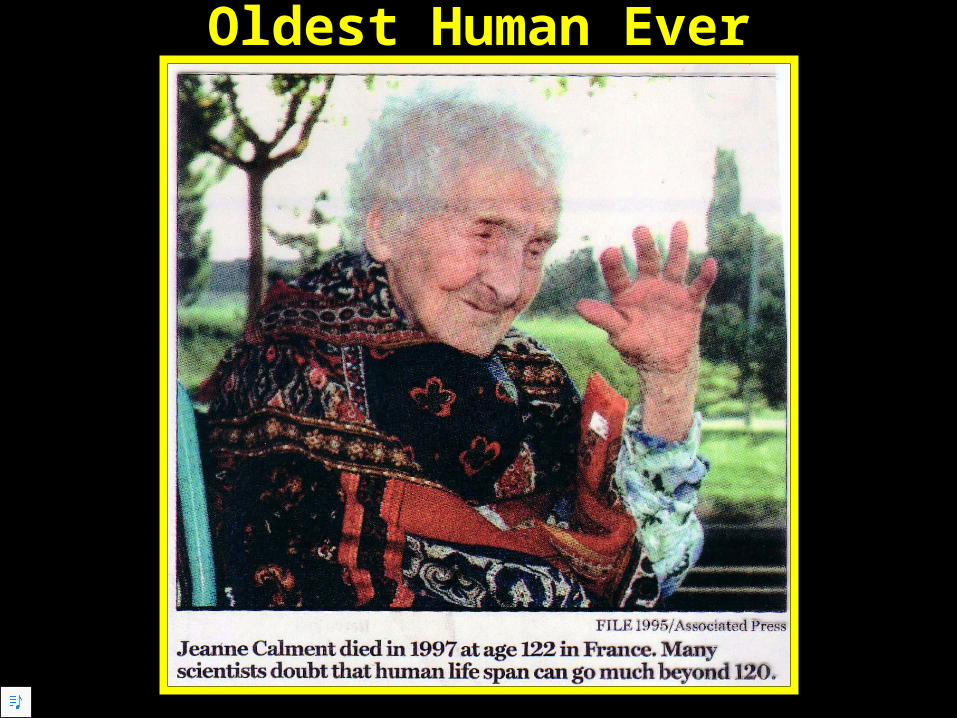
Oldest Human EverOldest Human Ever

What does it Take to Live A Long Time?What does it Take to Live A Long Time?Jeanne was still riding her bicyclestill riding her bicycle at age 100 at age 100.
On her 120 birthday, she was asked, “What“Whatkind of future do you expect?”kind of future do you expect?” She replied,““A very short one.”A very short one.”
Only one other person (Japanese woman)lived to be 120.
As can be seen on the graph, the “85 “85 and over”and over” make up the fastest growing segment of the population.
There were 67,473 over 10067,473 over 100 last year. By 20402040, there will be over 580,000580,000.
When asked how she felt, Jeanne replied,““I’m feeling pretty good, but I have quit I’m feeling pretty good, but I have quit buying green bananas.”buying green bananas.”
There are 40over 110.
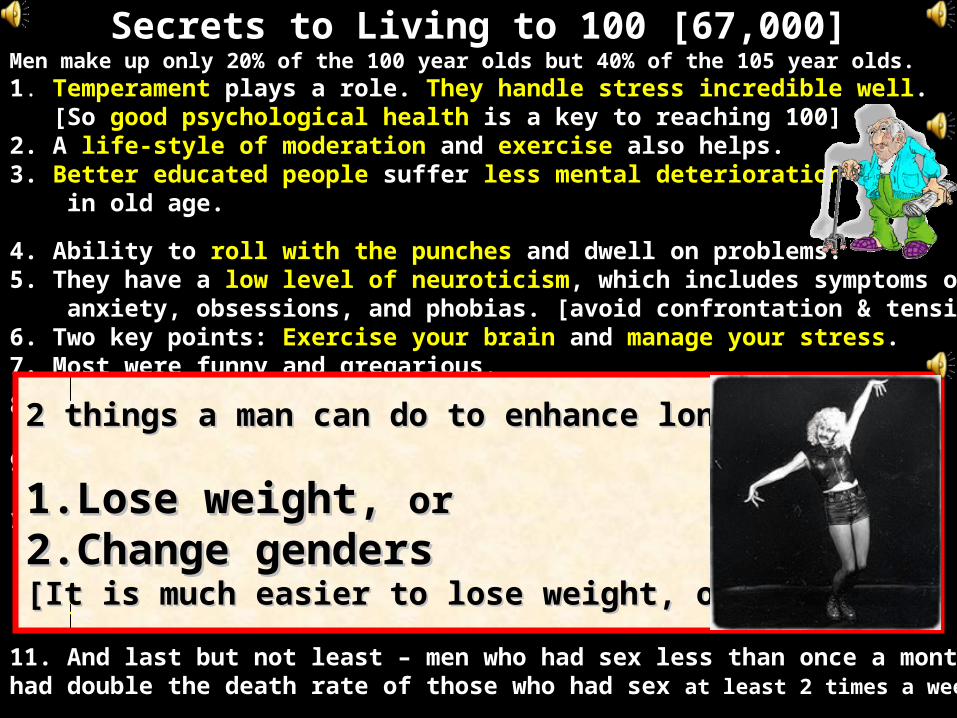
Secrets to Living to 100 [67,000]Secrets to Living to 100 [67,000]Men make up only 20% of the 100 year olds but 40% of the 105 year olds.1. TemperamentTemperament plays a role. They handle stress incredible wellThey handle stress incredible well. [So good psychologicalgood psychological healthhealth is a key to reaching 100]2. A life-style of moderationlife-style of moderation and exerciseexercise also helps.3. Better educated peopleBetter educated people suffer less mental deteriorationless mental deterioration in old age.
4. Ability to roll with the punchesroll with the punches and dwell on problems. 5. They have a low level of neuroticismlow level of neuroticism, which includes symptoms of anxiety, obsessions, and phobias. [avoid confrontation & tension]6. Two key points: Exercise your brainExercise your brain and manage your stressmanage your stress.7. Most were funny and gregariousfunny and gregarious.
8.Those who reach 100 usually have had no dementiano dementia or serious cognitive problems up through their mid-90s.9. 90% are women but 80% of them have some dementia, 80% of the men are relatively healthy & mentally alert. 10. The reason a positive outlookpositive outlook contributes to a long life is that “happiness & optimism increase the number & “happiness & optimism increase the number & strength of immune cells in the bodystrength of immune cells in the body. This leads to an improved ability to prevent and fight disease.”improved ability to prevent and fight disease.”
11. And last but not least – men who had sex less than once a monthhad double the death rate of those who had sex at least 2 times a week.
2 things a man can do to enhance longevity:2 things a man can do to enhance longevity:
1.1.Lose weight, Lose weight, oror
2.2.Change gendersChange genders[It is much easier to lose weight, oh!][It is much easier to lose weight, oh!]
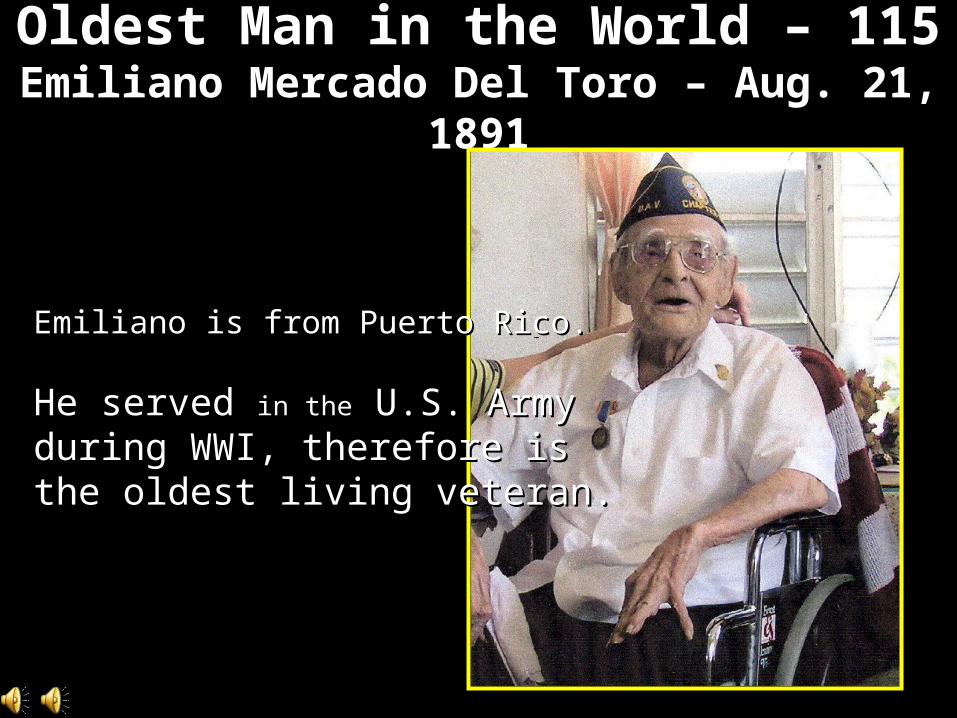
Oldest Man in the World – 115Oldest Man in the World – 115Emiliano Mercado Del Toro – Aug. 21, Emiliano Mercado Del Toro – Aug. 21,
18911891
Emiliano is from Puerto Rico.Emiliano is from Puerto Rico.
He served He served in thein the U.S. Army U.S. Armyduring WWI, therefore is during WWI, therefore is the oldest living veteran.the oldest living veteran.
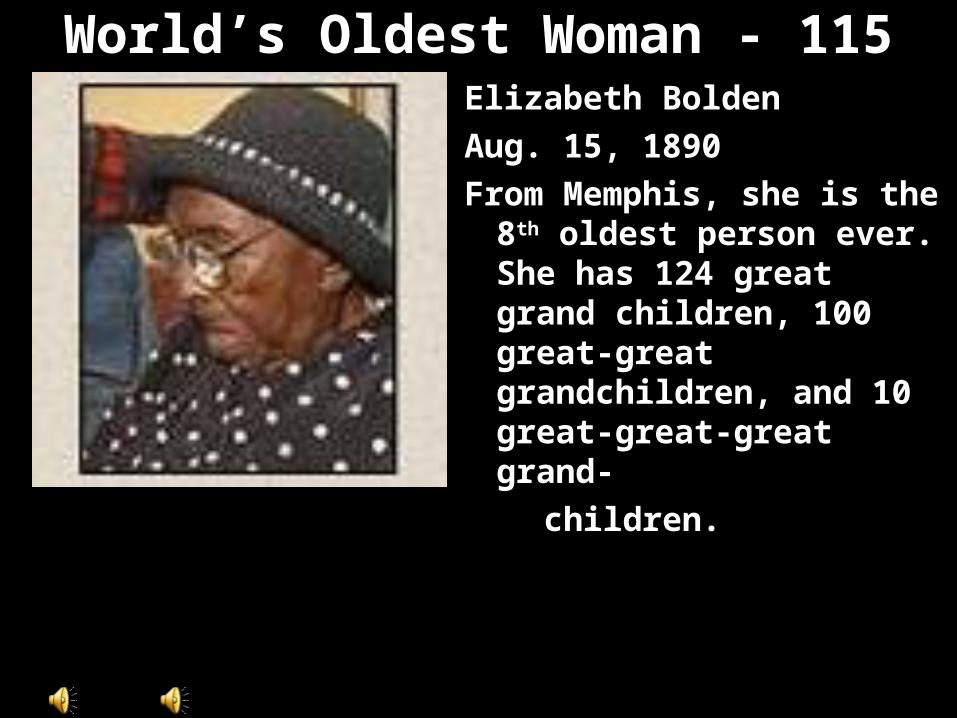
World’s Oldest Woman - World’s Oldest Woman - 115115
Elizabeth Bolden
Aug. 15, 1890
From Memphis, she is the 8th oldest person ever. She has 124 great grand children, 100 great-great grandchildren, and 10 great-great-great grand-
children.

OK, this woman from Brazil, OK, this woman from Brazil, Maria da SilvaMaria da Silva, has surfaced, has surfaced
and at and at 125 years old125 years old, she would be the , she would be the oldest everoldest ever.. Maria Olivia da SilvaMaria Olivia da Silva
She was born Feb. 28,1880Feb. 28,1880.She has been described as ““mentally sound mentally sound & & rational.”rational.”She was married twicemarried twice andoutlived all but 3 of her 14children. She loves to talkloves to talk and lives ina small wooden shack in southern Brazil.
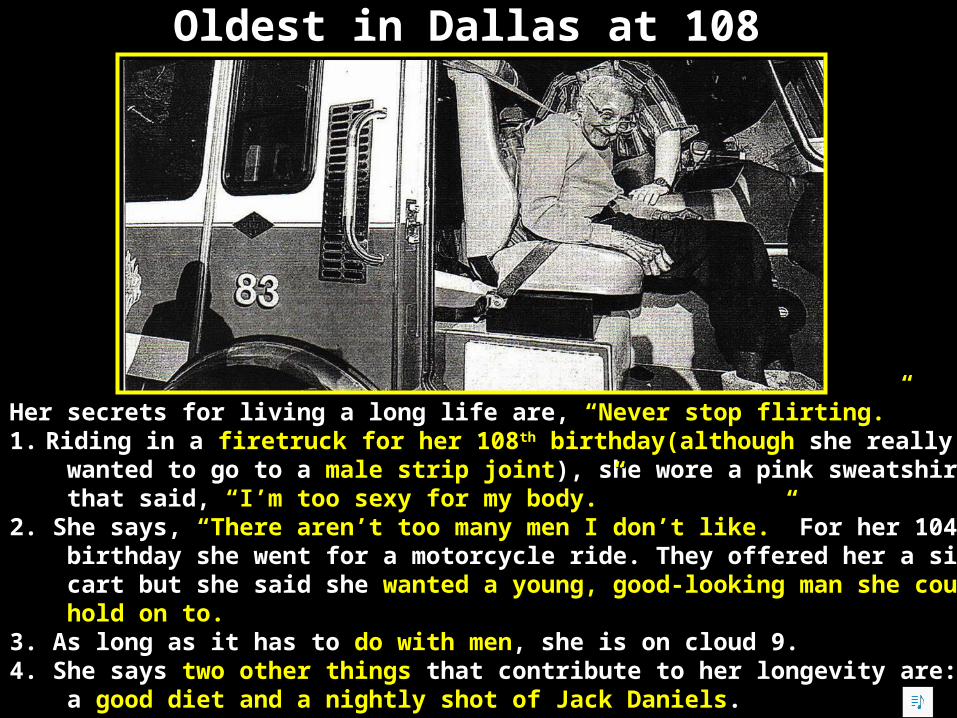
Her secrets for living a long life are, “Never stop flirting.”“Never stop flirting.”1. Riding in a firetruck for her 108firetruck for her 108thth birthday birthday(although she really wanted to go to a male strip jointmale strip joint), she wore a pink sweatshirt that said, “I’m too sexy for my body.”“I’m too sexy for my body.”2. She says, “There aren’t too many men I don’t like.”“There aren’t too many men I don’t like.” For her 104th
birthday she went for a motorcycle ride. They offered her a side cart but she said she wanted a young, good-looking man she could wanted a young, good-looking man she could hold on to.hold on to.3. As long as it has to do withdo with menmen, she is on cloud 9.4. She says two other thingstwo other things that contribute to her longevity are: a good dietgood diet and a nightly shot of Jack Danielsnightly shot of Jack Daniels.
Oldest in Dallas at 108Oldest in Dallas at 108
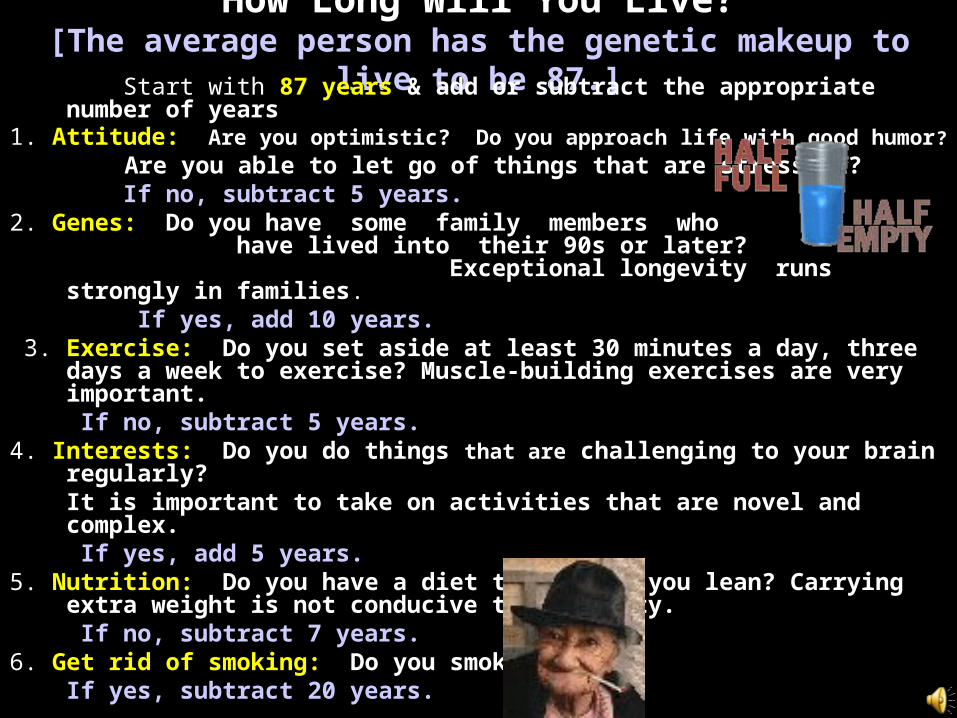
How Long Will You Live?How Long Will You Live?[The average person has the genetic makeup to live to be 87.][The average person has the genetic makeup to live to be 87.] Start with 87 years87 years & add or subtract the appropriate number of years1. Attitude:Attitude: Are you optimistic? Do you approach life with good humor?
Are you able to let go of things that are stressful? If no, subtract 5 years.If no, subtract 5 years.2. Genes:Genes: Do you have some family members who
have lived into their 90s or later? Exceptional longevity runs strongly in families.
If yes, add 10 years.If yes, add 10 years. 3. Exercise:Exercise: Do you set aside at least 30 minutes a day, three days a
week to exercise? Muscle-building exercises are very important. If no, subtract 5 years.If no, subtract 5 years.4. Interests:Interests: Do you do things that are challenging to your brain regularly? It is important to take on activities that are novel and complex. If yes, add 5 years.If yes, add 5 years.5. Nutrition:Nutrition: Do you have a diet that keeps you lean? Carrying extra
weight is not conducive to longevity. If no, subtract 7 years.If no, subtract 7 years.6. Get rid of smoking:Get rid of smoking: Do you smoke? If yes, subtract 20 years.If yes, subtract 20 years.
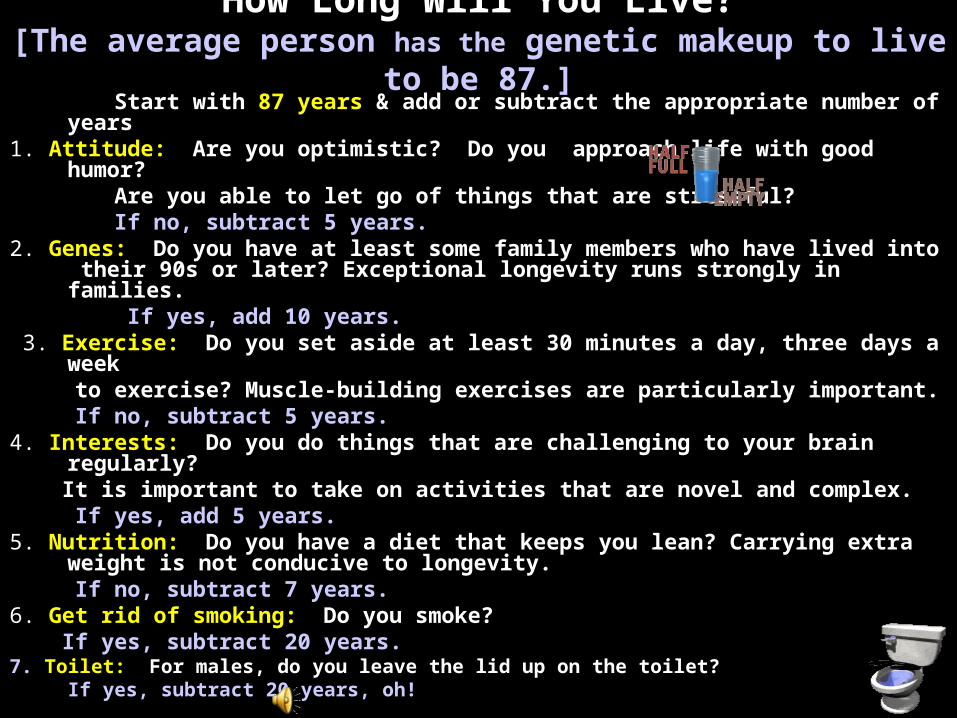
How Long Will You Live?How Long Will You Live?[The average person [The average person has thehas the genetic makeup to live to be 87.] genetic makeup to live to be 87.]
Start with 87 years87 years & add or subtract the appropriate number of years1. Attitude:Attitude: Are you optimistic? Do you approach life with good humor? Are you able to let go of things that are stressful?Are you able to let go of things that are stressful? If no, subtract 5 years.If no, subtract 5 years.2. Genes:Genes: Do you have at least some family members who have lived into their
90s or later? Exceptional longevity runs strongly in families. If yes, add 10 years.If yes, add 10 years. 3. Exercise:Exercise: Do you set aside at least 30 minutes a day, three days a week to exercise? Muscle-building exercises are particularly important. If no, subtract 5 years.If no, subtract 5 years.4. Interests:Interests: Do you do things that are challenging to your brain regularly? It is important to take on activities that are novel and complex. If yes, add 5 years.If yes, add 5 years.5. Nutrition:Nutrition: Do you have a diet that keeps you lean? Carrying extra weight is not
conducive to longevity. If no, subtract 7 years.If no, subtract 7 years.6. Get rid of smoking:Get rid of smoking: Do you smoke? If yes, subtract 20 years.If yes, subtract 20 years. 7. 7. Toilet:Toilet: For males, do you leave the lid up on the toilet? For males, do you leave the lid up on the toilet? If yes, subtract 20 years, oh!If yes, subtract 20 years, oh!

Typical BenefitsTypical Benefits$1,044$1,044 for a single worker
[Men average about $150 more] $1,713$1,713 for a couplecouple
You can expect SS to replace 40%40% of your final pay[25%25% for high high earnersearners & 60% for low earners]
MaximumMaximum
$2,116.00$2,116.00
Disabled Disabled WorkerWorker
$979.00$979.00
Typical Typical Disabled Disabled
Worker with Worker with Wife & ChildWife & Child
$1,646$1,646
Typical Typical Widowed Widowed
Mother withMother with 2 children2 children
$2,167$2,167
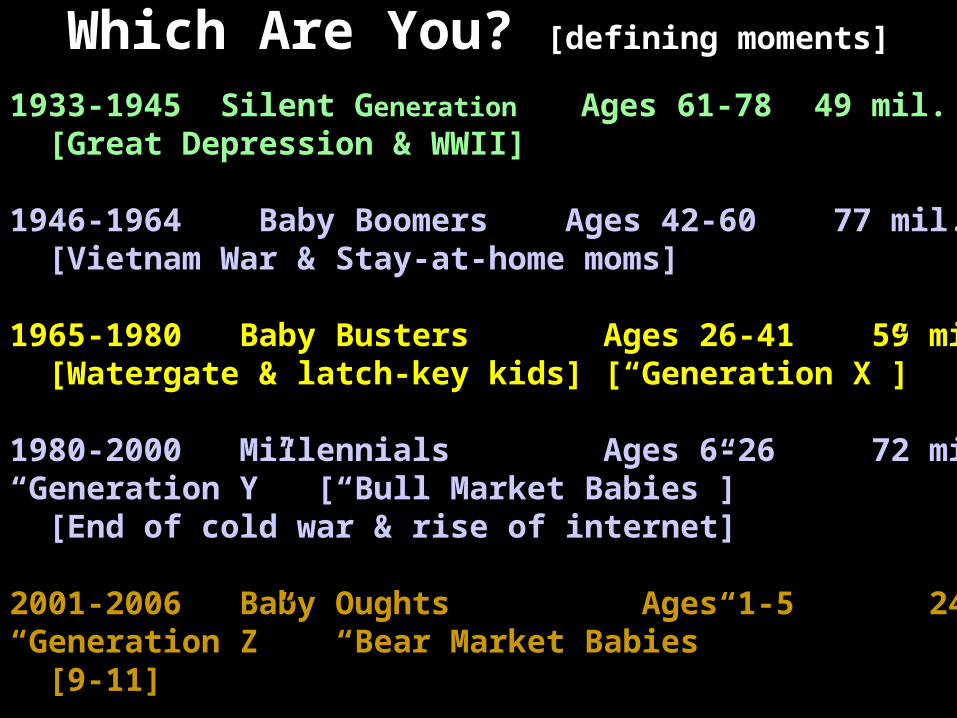
Which Are You? Which Are You? [defining moments][defining moments]
1933-1945 Silent G1933-1945 Silent Generation eneration Ages 61-78Ages 61-78 49 mil. 49 mil. [Great Depression & WWII][Great Depression & WWII]
1946-1964 Baby Boomers Ages 42-60 77 mil.1946-1964 Baby Boomers Ages 42-60 77 mil. [Vietnam War & Stay-at-home moms][Vietnam War & Stay-at-home moms]
1965-1980 Baby Busters1965-1980 Baby Busters Ages 26-41 59 mil. Ages 26-41 59 mil. [Watergate & latch-key kids] [“Generation X”][Watergate & latch-key kids] [“Generation X”]
1980-2000 Millennials1980-2000 Millennials Ages 6-26 72 mil. Ages 6-26 72 mil.““Generation Y” [“Bull Market Babies”]Generation Y” [“Bull Market Babies”] [End of cold war & rise of internet][End of cold war & rise of internet]
2001-2006 Baby Oughts2001-2006 Baby Oughts Ages 1-5 Ages 1-5 24 mil. 24 mil.““Generation Z” “Bear Market Babies”Generation Z” “Bear Market Babies” [9-11][9-11]
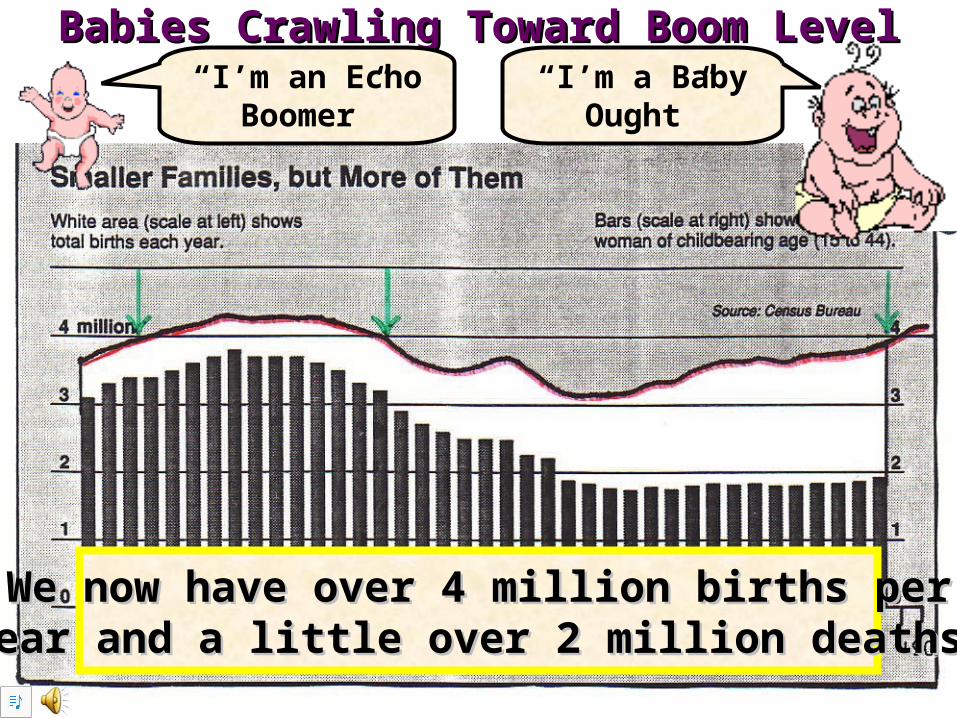
Babies Crawling Toward Boom LevelBabies Crawling Toward Boom Level“I’m an Echo
Boomer”“I’m a Baby
Ought”
We now have over 4 million births perWe now have over 4 million births peryear and a little over 2 million deaths.year and a little over 2 million deaths.
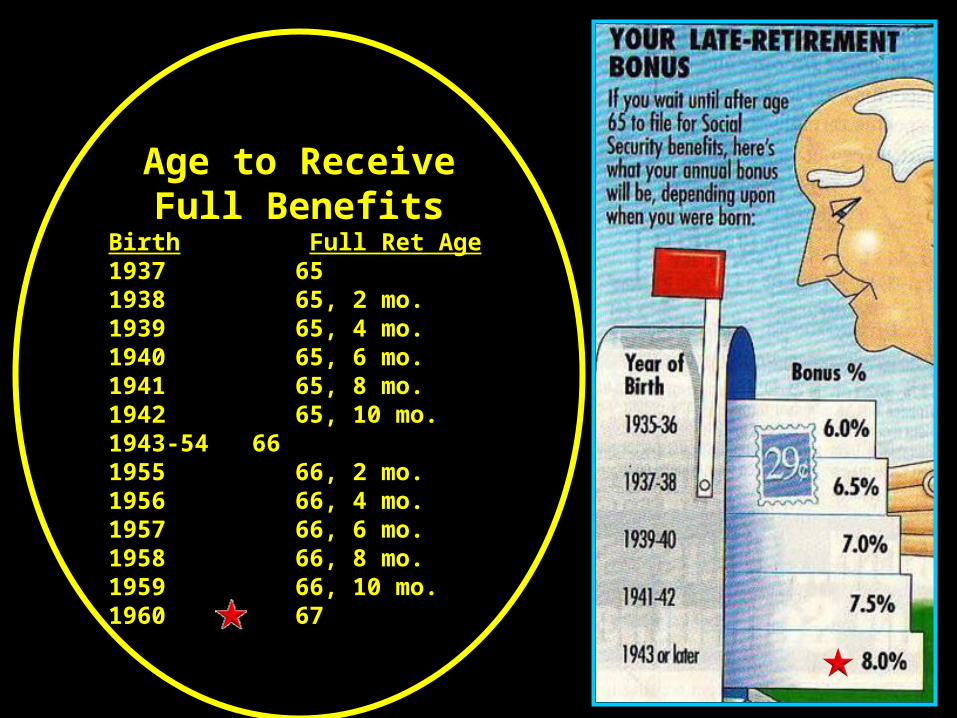
Age to ReceiveAge to ReceiveFull BenefitsFull Benefits
BirthBirth Full Ret AgeFull Ret Age1937 651937 6519381938 65, 2 mo. 65, 2 mo. 19391939 65, 4 mo.65, 4 mo.19401940 65, 6 mo.65, 6 mo.19411941 65, 8 mo.65, 8 mo.19421942 65, 10 mo.65, 10 mo.19431943-54 66-54 6619551955 66, 2 mo.66, 2 mo.19561956 66, 4 mo.66, 4 mo.19571957 66, 6 mo.66, 6 mo.19581958 66, 8 mo.66, 8 mo.19591959 66, 10 mo.66, 10 mo.19601960 67 67
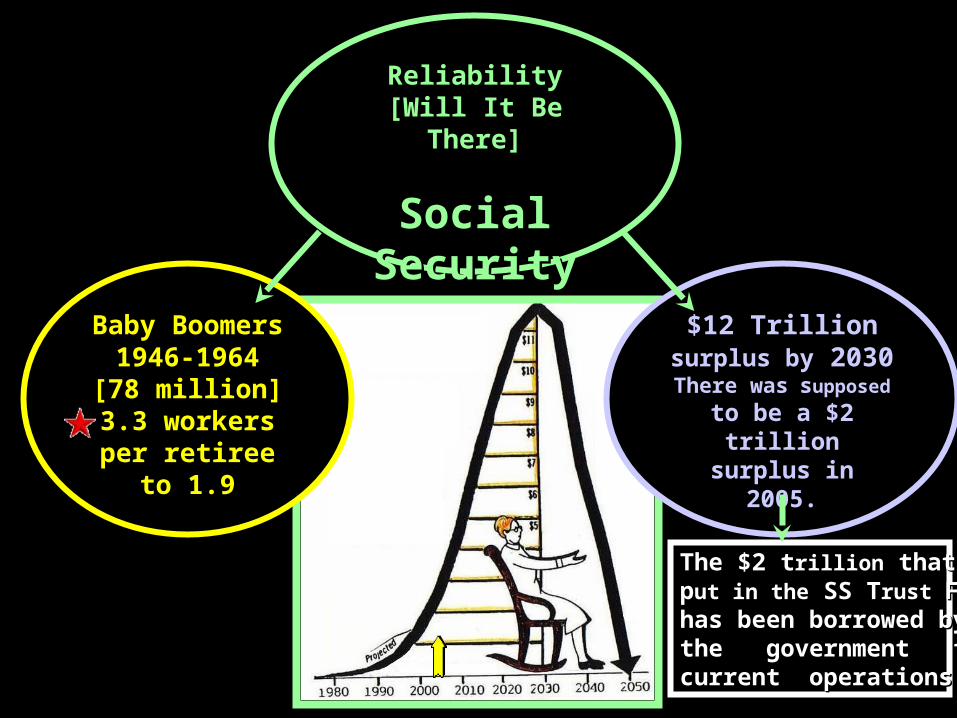
ReliabilityReliability[Will It Be There][Will It Be There]
Social Social SecuritySecurity
Baby Baby BoomersBoomers
1946-19641946-1964[78 million][78 million]3.3 workers 3.3 workers per retireeper retiree
to 1.9to 1.9
$12 Trillion $12 Trillion surplus bysurplus by 2030 2030
There wasThere was
ssupposedupposed to be a to be a $2 trillion $2 trillion
surplus in 2005.surplus in 2005.
The $2 tThe $2 trillionrillion that was that waspput in theut in the SS T SS Trust rust FFundund
has been borrowed byhas been borrowed bythe government forthe government forcurrent operations.current operations.

How To Fix Social How To Fix Social SecuritySecurity Members of congressMembers of congress do not paynot pay into SS nor do
they collect from it. SS benefits were not good not good enoughenough for them. Here is their plan. When they retire, they continue to draw the same paycontinue to draw the same pay until they diedie, and they get COLAsget COLAs on top of that.
Senator Byrd and Congressman White and their wives may expect to draw $7,800,000.00$7,800,000.00 ($7 million, eight-hundred thousand dollars), with their wives drawing $275,000 during the last years of their lives. Their cost for this is $0.00cost for this is $0.00. We get around $1,000 a month$1,000 a month after paying into the system all our lives. It would take 68 years and one month to equal Senator Bill Bradley’s benefits.
Social Security could be fixedfixed by jerking the Golden Fleece
Retirement Plan from under the congressmen and putting them on Social Security. Then sit back and watch how fast they would fix it.

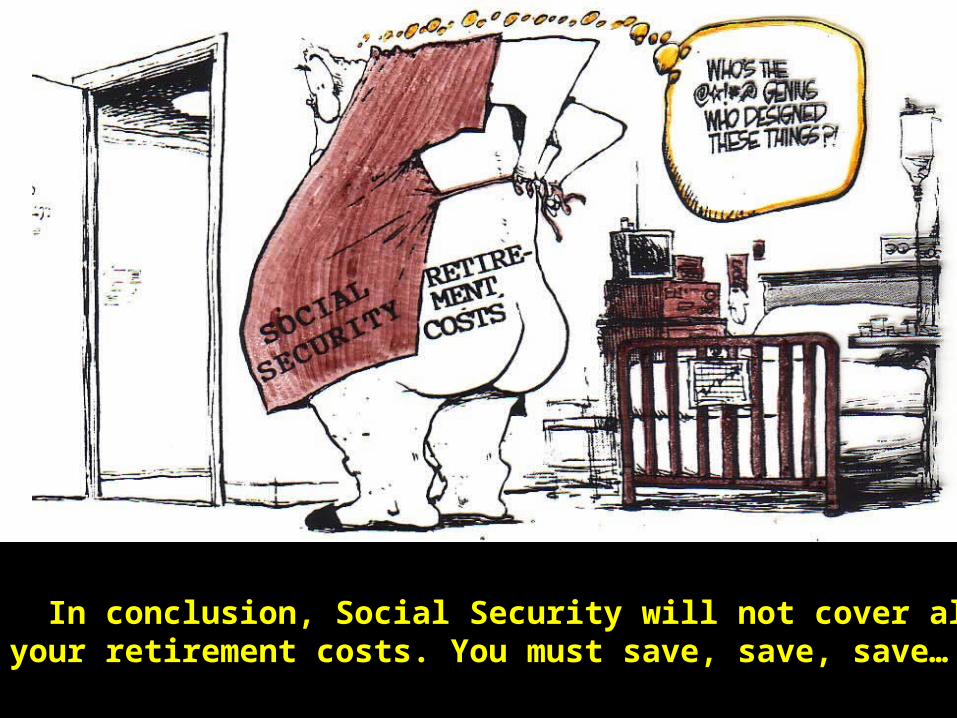
In conclusion, Social Security will not cover all ofIn conclusion, Social Security will not cover all ofyour retirement costs. You must save, save, save…your retirement costs. You must save, save, save…
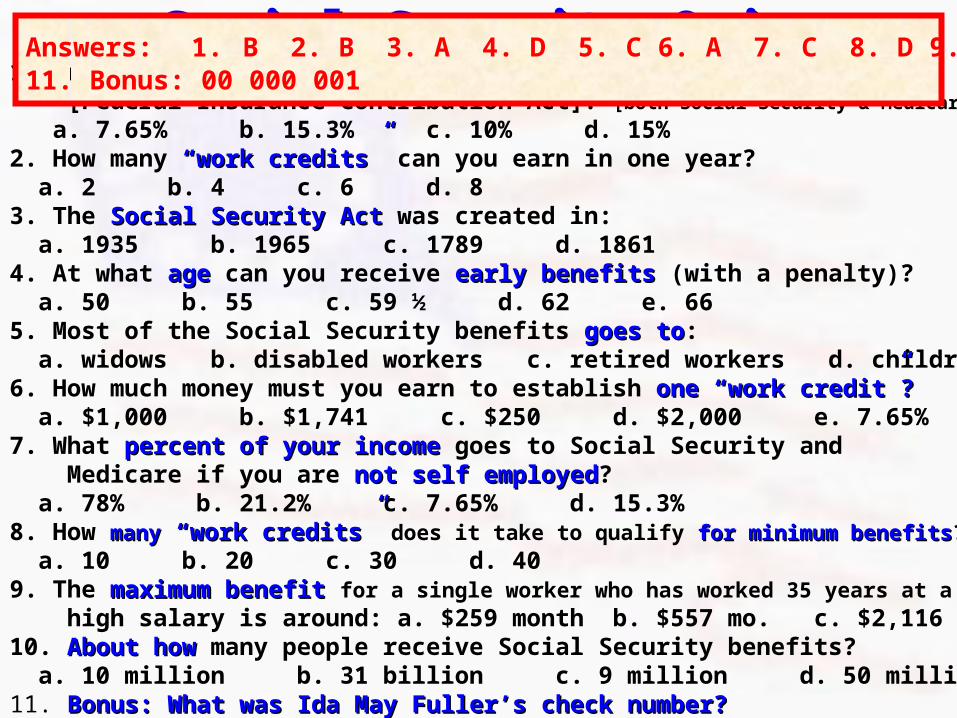
Social Security QuizSocial Security Quiz1. The self employedself employed have to pay [Federal Insurance Contribution Act]? [both Social Security & Medicare]
a. 7.65% b. 15.3% c. 10% d. 15%2. How many “work credits”“work credits” can you earn in one year? a. 2 b. 4 c. 6 d. 83. The Social Security ActSocial Security Act was created in: a. 1935 b. 1965 c. 1789 d. 18614. At what ageage can you receive early benefitsearly benefits (with a penalty)? a. 50 b. 55 c. 59 ½ d. 62 e. 665. Most of the Social Security benefits goes togoes to: a. widows b. disabled workers c. retired workers d. children6. How much money must you earn to establish one “work credit”?one “work credit”? a. $1,000 b. $1,741 c. $250 d. $2,000 e. 7.65%7. What percent of your incomepercent of your income goes to Social Security and Medicare if you are not self employednot self employed? a. 78% b. 21.2% c. 7.65% d. 15.3%8. How manymany “work credits” “work credits” does it take to qualify for minimum benefitsfor minimum benefits? a. 10 b. 20 c. 30 d. 409. The maximum benefitmaximum benefit for a single worker who has worked 35 years at a high salary is around: a. $259 month b. $557 mo. c. $2,116 mo.10. About howAbout how many people receive Social Security benefits? a. 10 million b. 31 billion c. 9 million d. 50 million11. Bonus: What was Ida May Fuller’s check number? Bonus: What was Ida May Fuller’s check number?
Answers: 1. B 2. B 3. A 4. D 5. C 6. A 7. C 8. D 9. C 10. D11. Bonus: 00 000 001