it is never too late? evidence on increasing the retirement age in a transition economy
TRANSCRIPT

Increasing retirement age in transition
It is never too late?Evidence on increasing the retirement age in a transition economy
Pawel Strzelecki12 Joanna Tyrowicz31
1National Bank of Poland2Warsaw School of Economics
3University of Warsaw
IZA / World BankJune 2015

Increasing retirement age in transition
Motivation and insights from literature
Motivation I
Issues common to many (not only transition) countries
Longevity ...
... aggravated with (really!) early retirement, see Fox (1997)⇒ average female exit age in 2000 in PL: 52 years
Solutions:
introduce universal DC systems⇒ stronger link between contributions and benefitsPL in 1997-1999, but temporarily keep occupational privileges
gradually reduce the occupational privileges⇒ keep people in activity longerPL in 2004: extend occupational privileges and additional exceptionsPL in 2009: only medical criteria for early retirement

Increasing retirement age in transition
Motivation and insights from literature
Motivation II

Increasing retirement age in transition
Motivation and insights from literature
Motivation I
In about 2007 things start to change

Increasing retirement age in transition
Motivation and insights from literature
Motivation II

Increasing retirement age in transition
Motivation and insights from literature
Motivation III
In 2009 reform of early retirement
Eligibility for pension benefits
Prior to 2009 After 2009W born before 1954 Experience: 25, age: 55 Experience: 25, age 55W born after 1954 Experience: 25, age: 55 Experience: 25, age: 60*M born before 1949 Experience: 30, age: 60 Experience: 30, age: 65M born after 1949 Experience: 30, age: 60 Experience: 30, age: 65*
* selected occupations based on medical criteria
Bottom line: 85% of workers lost eligibility for early retirement

Increasing retirement age in transition
Motivation and insights from literature
Earlier insights
For the US (or other advanced economies): Krueger and Pischke (1992);Jensen and Richter (2003); Snyder and Evans (2006); Liebman et al.(2009); Mastrobuoni (2009); Blau and Goodstein (2010); Behaghel andBlau (2012), summarized wonderfully by Manoli and Weber (2014)
For transition economies:Jensen and Richter (2003) for RussiaDanzer (2013) for Ukraine
Bottom line: “pass-through” is not complete, but people respond tochanges in incentives

Increasing retirement age in transition
Motivation and insights from literature
Our objectives
Take the (huge!) Polish reform of 2009,
exploit the discontinuity
and inquire:
Reduction in pension benefits take-up
Increase in labor force participation
Reduction in outflows to inactivity

Increasing retirement age in transition
Motivation and insights from literature
Table of contents
1 Motivation and insights from literature
2 Data
3 Results
4 Conclusions
5 References

Increasing retirement age in transition
Data
Our data - Labor Force Surveys (2007-2012)
Exploit the rotating panel
Compute the age on Jan 1st, 2009 (adequate up to 1 month)
Focus on transitions (earlier literature focuses on stocks)
Control for confounding factors (age, education, household structure)
Control for eligible/ineligible occupations

Increasing retirement age in transition
Data
Stocks - that everybody loves so much: pension take-up I

Increasing retirement age in transition
Data
Stocks - that everybody loves so much: pension take-up II

Increasing retirement age in transition
Data
Stocks - that everybody loves so much: exit age (women)

Increasing retirement age in transition
Data
Stocks - that everybody loves so much: exit age (men)

Increasing retirement age in transition
Data
Descriptives I
Before the reform After the reformeligible ineligible eligible ineligible
Number of individuals 68,788 562 2,083 38,535
Labor force participation rate (in %) 22.1 18.3 51.1 42.9Share of pension benefit recipients (in %) 52.7 12.6 39.4 19.3
Quarterly transition probabilities:remain active 0.95 0.75 0.94 0.96exit to early pension 0.05 0.03 0.06 0.03exit to inactivity (age) 0.05 0.25 0.06 0.04exit to inactivity (exp) 0.05 - 0.05 0.03

Increasing retirement age in transition
Data
Descriptives II
Before the reform After the reformeligible ineligible eligible ineligible
Individual characteristics (in %):Share of women 60.8 81.0 29.6 56.8
Tertiary education 12.5 3.9 11.5 13.2Secondary education 37.1 26.5 32.8 35.8Vocational 29.4 29.0 38.9 33.4Primary 20.9 40.6 16.8 17.6
Households with:other worker (in %) 44.1 45.6 49.4 50.9other pension (in %) 50.7 43.4 46.6 38.6other child (in %) 12.8 16.2 13.0 12.5

Increasing retirement age in transition
Data
Descriptives II
Before the reform After the reformeligible ineligible eligible ineligible
Individual characteristics (in %):Share of women 60.8 81.0 29.6 56.8Tertiary education 12.5 3.9 11.5 13.2
Secondary education 37.1 26.5 32.8 35.8Vocational 29.4 29.0 38.9 33.4Primary 20.9 40.6 16.8 17.6
Households with:other worker (in %) 44.1 45.6 49.4 50.9other pension (in %) 50.7 43.4 46.6 38.6other child (in %) 12.8 16.2 13.0 12.5

Increasing retirement age in transition
Data
Descriptives II
Before the reform After the reformeligible ineligible eligible ineligible
Individual characteristics (in %):Share of women 60.8 81.0 29.6 56.8Tertiary education 12.5 3.9 11.5 13.2Secondary education 37.1 26.5 32.8 35.8Vocational 29.4 29.0 38.9 33.4Primary 20.9 40.6 16.8 17.6
Households with:other worker (in %) 44.1 45.6 49.4 50.9other pension (in %) 50.7 43.4 46.6 38.6other child (in %) 12.8 16.2 13.0 12.5

Increasing retirement age in transition
Results
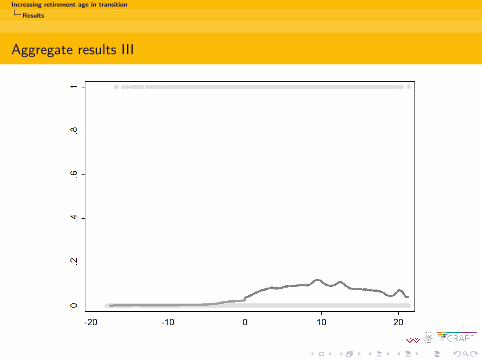
Aggregate results I
Please, remember, this was a HUGE reform (5 years, 85% affected)

Increasing retirement age in transition
Results
Aggregate results II
Model Coefficient (Std. Err.) z-statistic Significance level(a) transition to early retirement - 6%
- sharp -0.0108 0.0066 1.637 0.102- fuzzy -0.0118 0.0072 -1.637 0.102
(b) remaining economically active - 94%- sharp 0.0270 0.0095 -2.836 0.005- fuzzy 0.0308 0.0109 2.835 0.005
(c) transition to inactivity (adequate age) - 6%- sharp -0.0269 0.0095 2.829 0.005- fuzzy -0.0308 0.0109 -2.828 0.005
(d) transition to inactivity (with sufficient tenure) - 5%- sharp -0.0221 0.0095 2.324 0.020- fuzzy -0.0252 0.0108 -2.324 0.020
Increasing retirement age in transition
Results
Aggregate results III

Increasing retirement age in transition
Results
Aggregate results IV
But don’t people always retire at retirement?

Increasing retirement age in transition
Results
Placebo tests - eyeballing I
Exit to retirement

Increasing retirement age in transition
Results
Placebo tests - eyeballing II
Remain active

Increasing retirement age in transition
Results
Placebo tests - eyeballing III
Exit to inactivity
Increasing retirement age in transition
Results
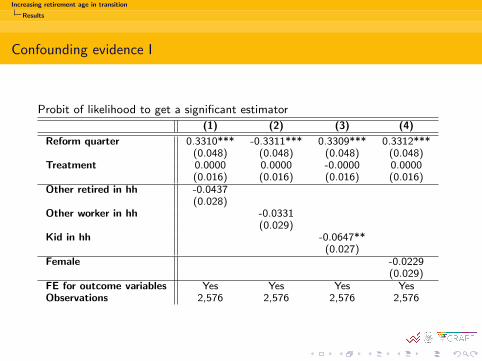
Confounding evidence I
Probit of likelihood to get a significant estimator
(1) (2) (3) (4)
Reform quarter 0.3310*** -0.3311*** 0.3309*** 0.3312***(0.048) (0.048) (0.048) (0.048)
Treatment 0.0000 0.0000 -0.0000 0.0000(0.016) (0.016) (0.016) (0.016)
Other retired in hh -0.0437(0.028)
Other worker in hh -0.0331(0.029)
Kid in hh -0.0647**(0.027)
Female -0.0229(0.029)
FE for outcome variables Yes Yes Yes YesObservations 2,576 2,576 2,576 2,576

Increasing retirement age in transition
Results
Confounding evidence II
Probit of likelihood to get a significant estimator
(1) (2) (3) (4)
Reform quarter 0.3310*** -0.3311*** 0.3309*** 0.3312***(0.048) (0.048) (0.048) (0.048)
Treatment 0.0000 0.0000 -0.0000 0.0000(0.016) (0.016) (0.016) (0.016)
Primary -0.0637** -0.0628** -0.0619** -0.0657**(0.027) (0.027) (0.027) (0.027)
Gymnasium -0.0374 -0.0363 -0.0354 -0.0395(0.029) (0.029) (0.029) (0.029)
Vocational -0.0784*** -0.0775*** -0.0767*** -0.0802***(0.026) (0.026) (0.026) (0.026)
Tertiary -0.0361 -0.0350 -0.0341 -0.0383(0.029) (0.029) (0.029) (0.029)
FE for outcome variables Yes Yes Yes YesObservations 2,576 2,576 2,576 2,576

Increasing retirement age in transition
Conclusions
Conclusions
Discontinuity from the reform: small relative to the scope of the reform
Almost no heterogeneity
Would have happened even without the reform?

Increasing retirement age in transition
Conclusions
Questions or suggestions?
Thank you!

Increasing retirement age in transition
References
References
Behaghel, L. and Blau, D. (2012). Framing social security reform: behavioral responses to changesin the full retirement age. American Economic Journal: Economic Policy, 4:41–67.
Blau, D. and Goodstein, R. (2010). Can social security explain trends in labor force participationof older men in the United States? Journal of Human Resources, 45:328–363.
Danzer, A. (2013). Benefit generosity and the income effect on labour supply: quasi-experimentalevidence. Economic Journal, 123:1059–1084.
Fox, L. (1997). Pension reform in the post-communist transition economies. In Nelson, J. M.,Tilly, C., and Walker, L., editors, Transforming Post-Communist Political Economies. NationalAcademy Press, Washington, D.C.
Jensen, R. and Richter, K. (2003). The health implications of social security failure: evidence fromthe Russian pensions. Journal of Public Economics, 88:209–236.
Krueger, A. and Pischke, J.-S. (1992). The effect of social security on labor supply: a cohortanalysis of the notch generation. Journal of Labor Economics, 10:4120–4437.
Liebman, J., Luttmer, E., and Seif, D. (2009). Labor supply responsens to marginal Social Securitybenefits: Evidence from discontinuities. Journal of Public Economics, 93:1224–1233.
Manoli, D. and Weber, A. (2014). Intertemporal substitution in labor force participation: evidencefrom policy discontinuities. CESifo Working Paper Series 4619, CESifo.
Mastrobuoni, G. (2009). Labor supply effects of the recent social security benefit cuts: Empiricalestimates using cohort discontinuities. Journal of Public Economics, 93(11):1224–1233.
Snyder, S. and Evans, W. (2006). The effect of income on mortality: evidence from social securitynotch. Review of Economics and Statistics, 88:482–495.