it depends
TRANSCRIPT

It DependsDatabase administration for developers


Stuff your DBA Does
Hardware configuration and maintenance
Manage backups
Manage server updates and maintenance jobs
Document database functionality
Monitor databases for problem code
Performance tuning

The ‘Slowness’ ProblemTroubleshooting with your DBA


Dynamic Management Views for Performance Tuning
DMVs can find
Wait statistics
Poorly Performing queries by several metrics including
CPU
Logical/Physical Reads/Writes
Cached execution plans
Missing indexes
DMVs refresh after every server restart, so be sure to only look when the server has been running for a while
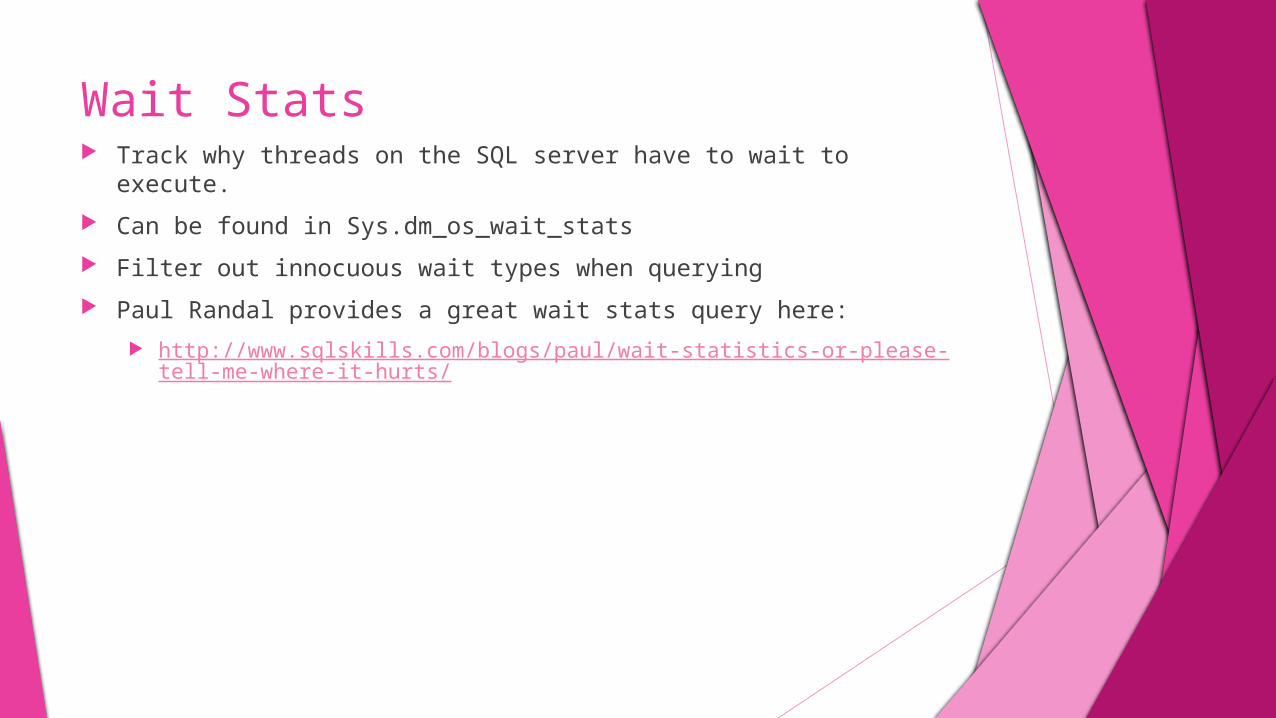
Wait Stats Track why threads on the SQL server have to wait to execute.
Can be found in Sys.dm_os_wait_stats
Filter out innocuous wait types when querying
Paul Randal provides a great wait stats query here:
http://www.sqlskills.com/blogs/paul/wait-statistics-or-please-tell-me-where-it-hurts/


Async_Network_IO
Waiting for client to consume data Is the application doing row-by-row processing of
data returned from the SQL server?

PageIOLatch_XX
Indicate waiting for data to be moved from disk into buffer
Is there a way to add an index to a large query to cause it to seek instead of scan?

LCK_M_XX
Waiting for a lock to be granted Are there long running transactions causing other
processes to have to wait?

CXPacket Waits
Indicates parallelism Are there some huge queries that could be
simplified or broken into pieces?

SOS_Scheduler_Yield
Indicates high CPU usage (typically) Are there CPU intensive queries that can be
simplified or broken into parts?

Wait Summary
Async_Network_IO – client taking a long time to consume data
PageIOLatch_XX – waiting for data to move from disc to buffer
Lck_M_XX – waiting to acquire locks CxPacket – lots of parallelism in queries SOS_Scheduler_Yield – indicates high CPU usage
(usually)

Lck_M_XX WaitsThe case of the long running transaction

Transactions
A transaction is a set of operations that succeed or fail as one
When a successful transaction is committed, all parts of the transaction become committed to the database
If a transaction fails, no parts of the transaction are committed to the database
SQL server creates a transaction for every SQL statement, unless explicit ‘begin transaction’ and ‘commit transaction’ statements are used
ACID
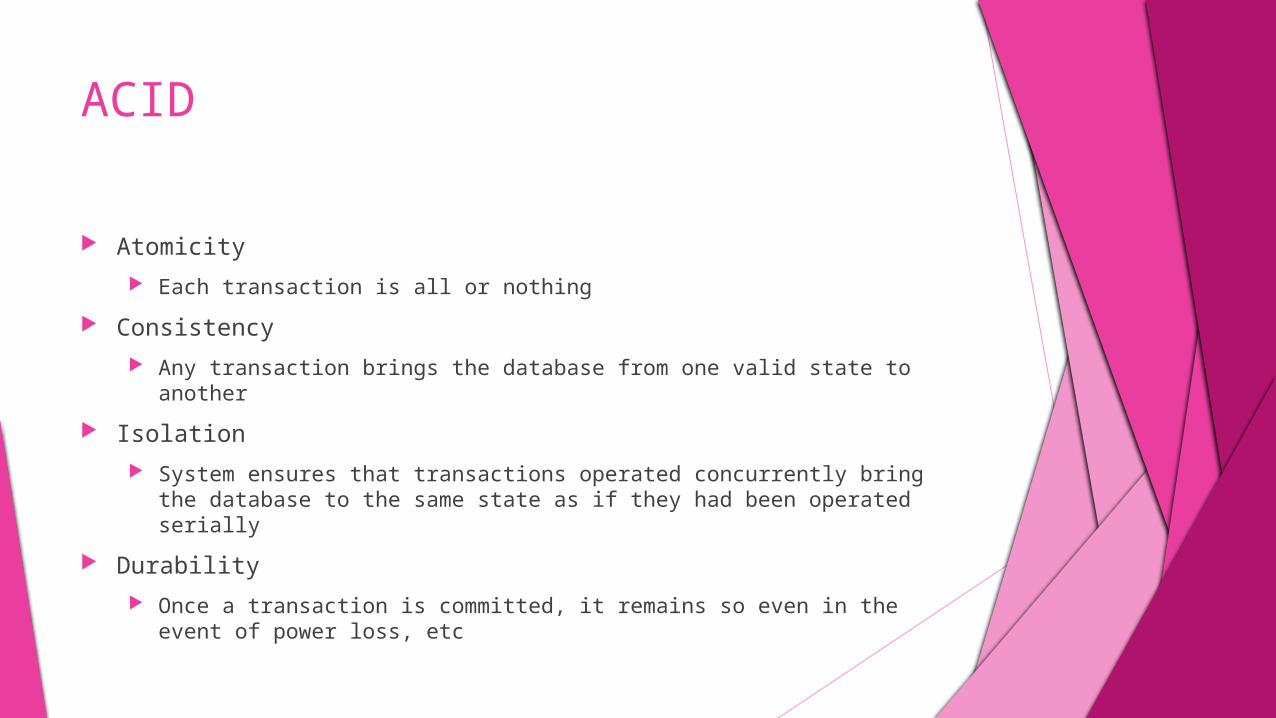
Atomicity
Each transaction is all or nothing
Consistency
Any transaction brings the database from one valid state to another
Isolation
System ensures that transactions operated concurrently bring the database to the same state as if they had been operated serially
Durability
Once a transaction is committed, it remains so even in the event of power loss, etc

Locking
Locks prevent resources from being read in an inconsistent state, or being updated out-of-order
Locks create the Isolation part of ACID
Shared locks are taken when data is being read
Multiple shared locks can be taken on a resource at one time
Update locks are taking in anticipation of an update
Only one transaction can obtain an update lock on a resource. If data is actually updated, this is converted to an exclusive lock.
Exclusive locks are taken when data is being written
Only one exclusive lock can be taken on a resource

Finding long running queriesSELECT TOP 1000 SUBSTRING(qt.TEXT, (qs.statement_start_offset/2)+1,((CASE qs.statement_end_offsetWHEN -1 THEN DATALENGTH(qt.TEXT)ELSE qs.statement_end_offsetEND - qs.statement_start_offset)/2)+1),qs.execution_count,qs.total_logical_reads, qs.last_logical_reads,qs.total_logical_writes, qs.last_logical_writes,qs.total_worker_time,qs.last_worker_time,qs.total_physical_reads,qs.total_elapsed_time/1000000 total_elapsed_time_in_S,qs.last_elapsed_time/1000000 last_elapsed_time_in_S,qs.last_execution_time,qp.query_planFROM sys.dm_exec_query_stats qsCROSS APPLY sys.dm_exec_sql_text(qs.sql_handle) qtCROSS APPLY sys.dm_exec_query_plan(qs.plan_handle) qp--ORDER BY qs.total_logical_reads DESC -- logical reads-- ORDER BY qs.total_logical_writes DESC -- logical writesORDER BY qs.total_elapsed_time DESC -- total time

A Problem Query
;WITH res AS (SELECT d.OwnerOriginId, MAX(d.docid) as hasRes from DocumentRoot d join DocumentTypeRoot dt on d.DocTypeId = dt.DocTypeIdwhere dt.isresume = 1 and d.OwnerOriginTypeId in (1,36)GROUP BY d.OwnerOriginId)SELECT TOP 1000 c.[AIdent] , c.[LastName] , c.[FirstName] , r.hasResFROM Employee cleft JOIN res r ON c.AIdent = r.OwnerOriginIdWHERE 1 = 1 AND c.[SSN] LIKE '%999999999%'ORDER BY c.[LastName] , c.[FirstName]
CPU Time: 6903 ms, Total Time: 2009 ms

Tips for Optimizing Queries
Before all else, try to reduce the number of rows being touched by a query
Complexity is a killer. Simpler queries perform better.
Remove any IN or NOT IN clauses if possible
Change common table expressions to cross apply or temp tables
Utilize the tempdb for temporary tables if you are working in raw sql

Optimization continued
Sometimes, multiple roundtrips from the client beat out one complex query
If you can lazy load, do lazy load The best resource you have is an execution plan
from the production database

Attempt 1: Cross/Outer Apply
SELECT TOP 1000 c.[AIdent] , c.[LastName] , c.[FirstName] , res.hasResFROM Employee couter apply (Select MAX(d.docid) as hasRes from DocumentRoot d join DocumentTypeRoot dt on d.DocTypeId = dt.DocTypeIdwhere dt.isresume = 1 and d.OwnerOriginId = c.AIdentand d.OwnerOriginTypeId IN (1,36)) resWHERE 1 = 1 AND c.[SSN] LIKE '%999999999%'ORDER BY c.[LastName] , c.[FirstName]
CPU Time: 9517 ms, Total Time: 9897 ms

Attempt 2: Union;WITH res AS (SELECT d.OwnerOriginId, MAX(d.docid) as hasRes from DocumentRoot d join DocumentTypeRoot dt on d.DocTypeId = dt.DocTypeIdwhere dt.isresume = 1 and d.OwnerOriginTypeId = 1GROUP BY d.OwnerOriginIdunionSELECT d.OwnerOriginId, MAX(d.docid) as hasRes from DocumentRoot d join DocumentTypeRoot dt on d.DocTypeId = dt.DocTypeIdwhere dt.isresume = 1 and d.OwnerOriginTypeId = 36GROUP BY d.OwnerOriginId)SELECT TOP 1000 c.[AIdent] , c.[LastName] , c.[FirstName] , r.hasResFROM Employee cleft JOIN res r ON c.AIdent = r.OwnerOriginIdWHERE 1 = 1 AND c.[SSN] LIKE '%999999999%'ORDER BY c.[LastName] , c.[FirstName]
CPU Time: 8096 ms, Total Time: 4094 ms
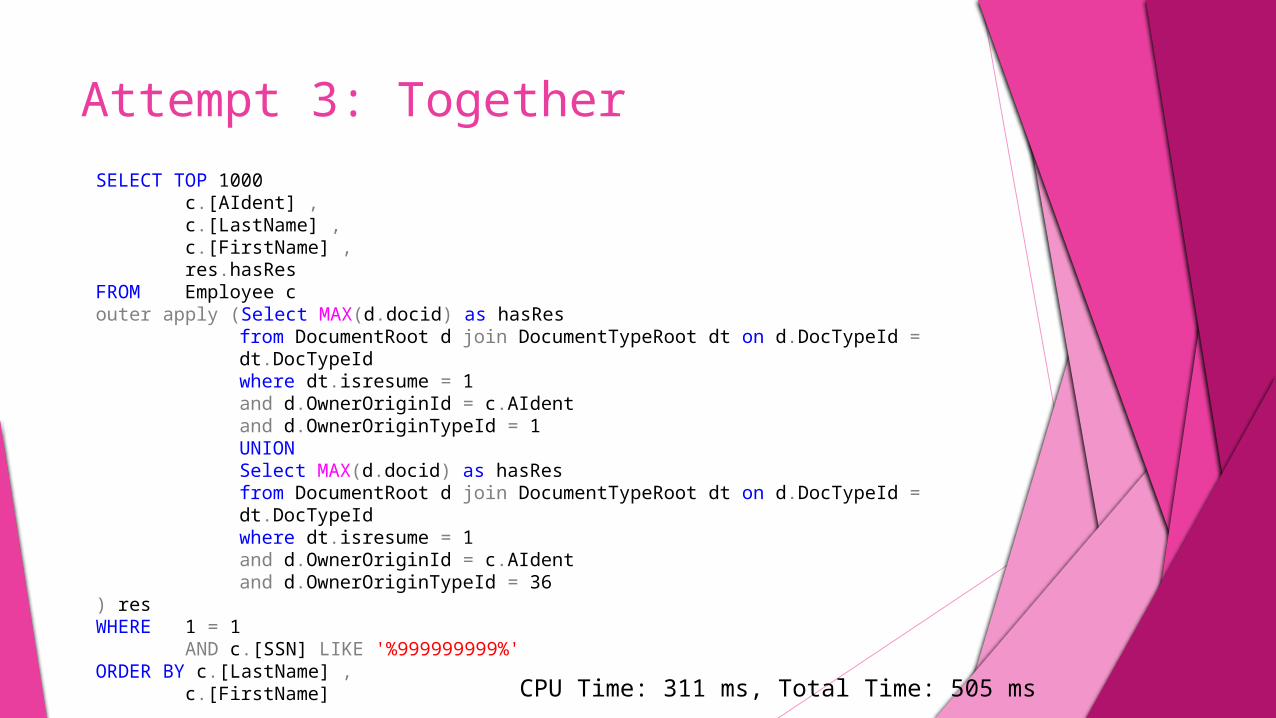
Attempt 3: Together
SELECT TOP 1000 c.[AIdent] , c.[LastName] , c.[FirstName] , res.hasResFROM Employee couter apply (Select MAX(d.docid) as hasRes
from DocumentRoot d join DocumentTypeRoot dt on d.DocTypeId = dt.DocTypeIdwhere dt.isresume = 1 and d.OwnerOriginId = c.AIdentand d.OwnerOriginTypeId = 1UNIONSelect MAX(d.docid) as hasRes from DocumentRoot d join DocumentTypeRoot dt on d.DocTypeId = dt.DocTypeIdwhere dt.isresume = 1 and d.OwnerOriginId = c.AIdentand d.OwnerOriginTypeId = 36
) resWHERE 1 = 1 AND c.[SSN] LIKE '%999999999%'ORDER BY c.[LastName] , c.[FirstName] CPU Time: 311 ms, Total Time: 505 ms

PageIOLatch WaitsThe indexing problem

Pages
All data in SQL server is stored on 8kb pages
Pages are read from disc into the buffer (RAM) in their entirety
PageIOLatch waits occur when the SQL server is taking a long time reading the pages from disc into the buffer
http://www.brentozar.com/archive/2013/02/how-does-sql-server-store-data/

Indexes: They’re B-Trees

Clustered VS Non-Clustered
Clustered indexes
This IS the table. It stores the actual table data at the leaf level.
Non-Clustered indexes
Store a reference to the actual data row rather than containing data

Determining Clustered Index Column(s)
Keep data in a clustered index short
Choose a column with many unique values
Choose a column that frequently appears in the where clause of SQL statements
Usually the primary key is right, but sometimes it is not
In rare cases where a table is almost always written, and almost never read, it may be better to skip the clustered index completely
https://www.simple-talk.com/sql/learn-sql-server/sql-server-index-basics/

When to create a non-clustered index
Execution plan cost is concentrated on a table scan or index scan
A large amount of execution plan cost is centered on a key lookup
The missing indexes dynamic management view indicates need for an index
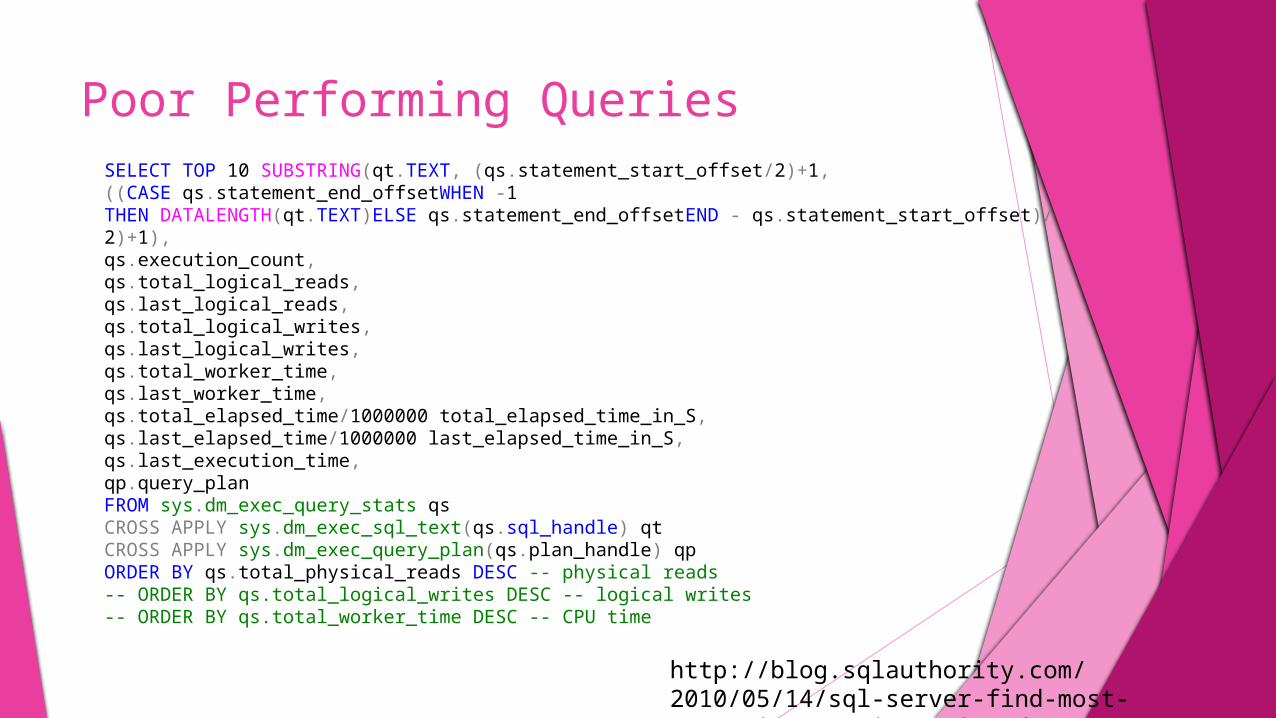
Poor Performing Queries
http://blog.sqlauthority.com/2010/05/14/sql-server-find-most-expensive-queries-using-dmv/
SELECT TOP 10 SUBSTRING(qt.TEXT, (qs.statement_start_offset/2)+1,((CASE qs.statement_end_offsetWHEN -1 THEN DATALENGTH(qt.TEXT)ELSE qs.statement_end_offsetEND - qs.statement_start_offset)/2)+1),qs.execution_count,qs.total_logical_reads, qs.last_logical_reads,qs.total_logical_writes, qs.last_logical_writes,qs.total_worker_time,qs.last_worker_time,qs.total_elapsed_time/1000000 total_elapsed_time_in_S,qs.last_elapsed_time/1000000 last_elapsed_time_in_S,qs.last_execution_time,qp.query_planFROM sys.dm_exec_query_stats qsCROSS APPLY sys.dm_exec_sql_text(qs.sql_handle) qtCROSS APPLY sys.dm_exec_query_plan(qs.plan_handle) qpORDER BY qs.total_physical_reads DESC -- physical reads-- ORDER BY qs.total_logical_writes DESC -- logical writes-- ORDER BY qs.total_worker_time DESC -- CPU time
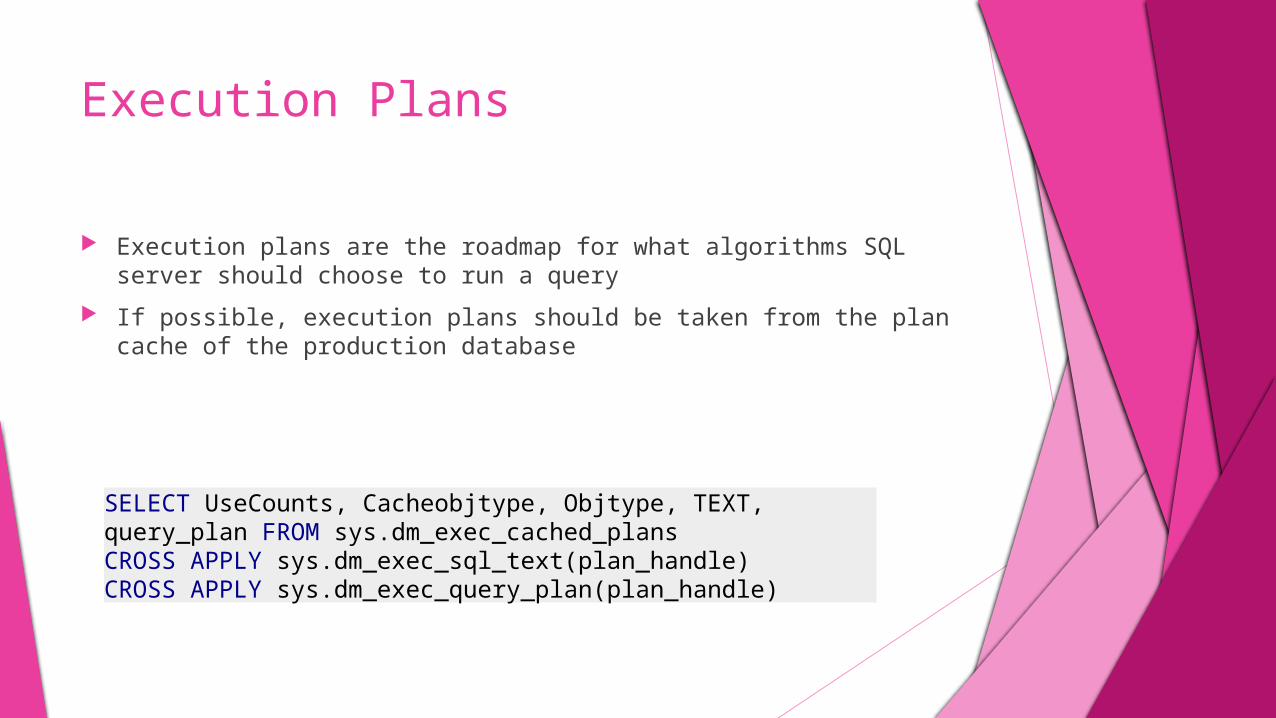
Execution Plans
Execution plans are the roadmap for what algorithms SQL server should choose to run a query
If possible, execution plans should be taken from the plan cache of the production database
SELECT UseCounts, Cacheobjtype, Objtype, TEXT, query_plan FROM sys.dm_exec_cached_plans CROSS APPLY sys.dm_exec_sql_text(plan_handle) CROSS APPLY sys.dm_exec_query_plan(plan_handle)

A problem query

The Execution Plan (10 Operations)

Hover Window of Gold

My Index
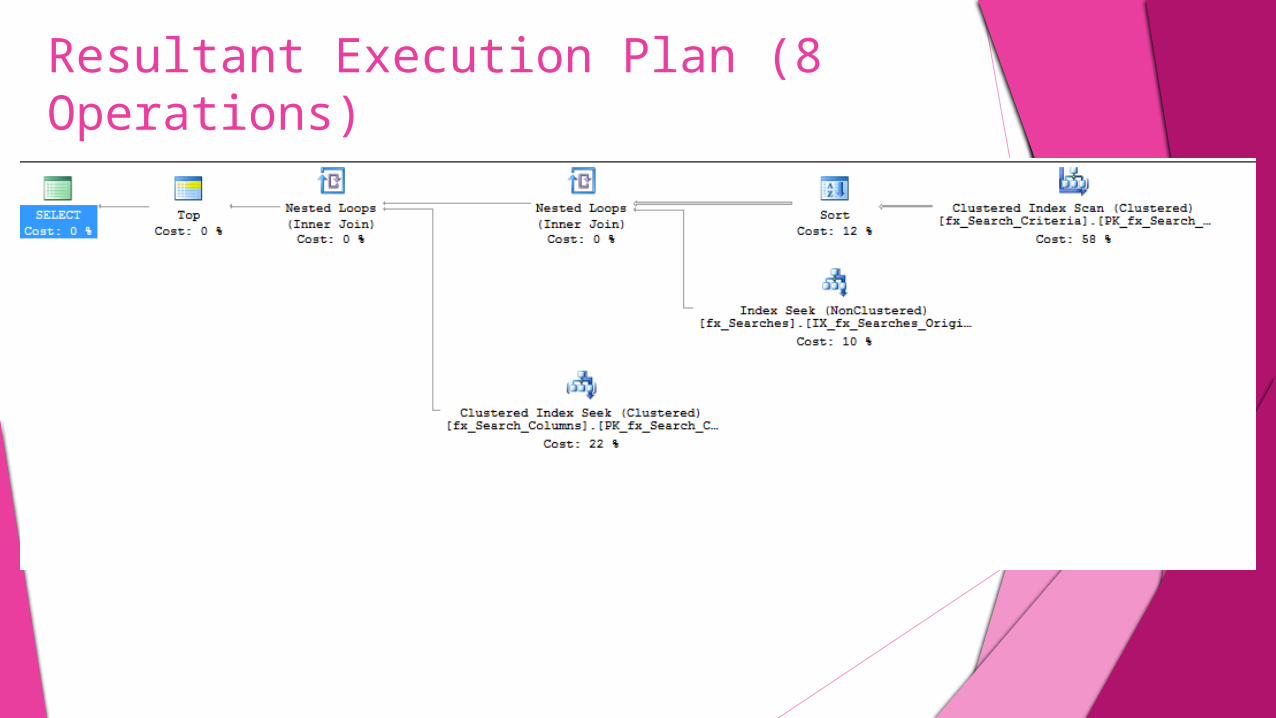
Resultant Execution Plan (8 Operations)

Missing Index DMV
SELECT migs.avg_total_user_cost * (migs.avg_user_impact / 100.0) * (migs.user_seeks + migs.user_scans) ASimprovement_measure, 'CREATE INDEX [missing_index_' + CONVERT (varchar, mig.index_group_handle) + '_' + CONVERT (varchar,mid.index_handle) + '_' + LEFT (PARSENAME(mid.statement, 1), 32) + ']' + ' ON ' + mid.statement + ' (' + ISNULL (mid.equality_columns,'') + CASE WHEN mid.equality_columns IS NOT NULL AND mid.inequality_columns IS NOT NULL THEN ',' ELSE '‘ END + ISNULL (mid.inequality_columns, '') + ')' + ISNULL (' INCLUDE (' + mid.included_columns + ')', '') AS create_index_statement, migs.*, mid.database_id, mid.[object_id]FROM sys.dm_db_missing_index_groups migINNER JOIN sys.dm_db_missing_index_group_stats migs ON migs.group_handle = mig.index_group_handleINNER JOIN sys.dm_db_missing_index_details mid ON mig.index_handle = mid.index_handleWHERE migs.avg_total_user_cost * (migs.avg_user_impact / 100.0) * (migs.user_seeks + migs.user_scans) > 10ORDER BY migs.avg_total_user_cost * migs.avg_user_impact * (migs.user_seeks + migs.user_scans) DESC

If the table is write heavy, and the query is infrequent – skip it!
Indexes take up space, and must be rebuilt when data is written

SOS_Scheduler_YieldQueries that are taking up CPU

High CPU Time QueriesSELECT TOP 10 SUBSTRING(qt.TEXT, (qs.statement_start_offset/2)+1,((CASE qs.statement_end_offsetWHEN -1 THEN DATALENGTH(qt.TEXT)ELSE qs.statement_end_offsetEND - qs.statement_start_offset)/2)+1),qs.execution_count,qs.total_logical_reads, qs.last_logical_reads,qs.total_logical_writes, qs.last_logical_writes,qs.total_worker_time,qs.last_worker_time,qs.total_physical_reads,qs.total_elapsed_time/1000000 total_elapsed_time_in_S,qs.last_elapsed_time/1000000 last_elapsed_time_in_S,qs.last_execution_time,qp.query_planFROM sys.dm_exec_query_stats qsCROSS APPLY sys.dm_exec_sql_text(qs.sql_handle) qtCROSS APPLY sys.dm_exec_query_plan(qs.plan_handle) qp--ORDER BY qs.total_physical_reads DESC -- logical reads-- ORDER BY qs.total_logical_writes DESC -- logical writesORDER BY qs.total_worker_time DESC -- CPU time

SQL Server Statistics
SQL Server Statistics contain information about the distribution of values in a SQL server table
This information is used to estimate the number of rows a given query will return
This in turn allows SQL server to choose appropriate join algorithms for the data set in question

How do I know if my statistics are bad?

Updating Statistics
Statistics can be updated on a single table
Statistics can be update on all tables and indexed views at once
Updating statistics causes all query plans dependent on those stats to recompile, so it’s a very expensive operation that should be done as part of a maintenance process during off hours if possible

Time Out Execution Plans Time out execution plans can be found by
right clicking on the plan’s initial ‘select’ in management studio and choosing properties
The query optimizer can only spend a limited amount of time compiling a plan before it must choose one
Complex queries can result in the query optimizer being forced to choose a sub-optimal plan
Remove as many views and functions as possible from these queries, or split them into multiple parts

Interacting with your DBANot as hard as you thought

Ask what wait types are running high in the system
Think about the code you’ve written and whether it may have long running transactions, high levels of complexity, or pull huge amounts of data

Ask for data on the poorest performing queries in the system
You may have better insights than your DBA on how these queries can be improved

Ask for outputs from the missing index DMV
You are better able to know what indexes will be used and reused than your DBA, because you wrote the queries

Ask for execution plans from the production server
It always helps to optimize for the real world, and not the dev box.

Combine your domain knowledge
Your DBA is able to identify problem areas for you. He or she is able to fix many of those problems, but your knowledge of how application code could be changed to improve performance is invaluable to your DBA.

If you want to know more Paul Randal’s Blog:
http://www.sqlskills.com/blogs/paul/
Brent Ozar’s Website:
http://www.brentozar.com/
Troubleshooting SQL Server: A Guide for the Accidental DBA
Jonathan Kehayias and Ted Krueger
http://www.red-gate.com/community/books/accidental-dba
Slide Share: Maggie’s email: [email protected]