it ******* · 2014-03-24 · the early and elementary education program. this program is working to...
TRANSCRIPT

ED 324 120
AUTHORTITLE
INSTITUTION
SPONS AGENCY
PUB DATECONTRACTNOTEPUB TYPE
EDRS PRICEDESCRIPTORS
IDENTIFIEES
ABSTRACT
DOCUMENT RESUME
PS 019 089
Slavin, Robert E.; And OthersSuccess for All: Effects of Variations in Durationand Resources of a Schoolwide ElementaryRestructuring Program. Report No. 2.Center for Research on Effective Schooling forDisadvantaged Students, Baltimore, HD.Office of Educational Research and Improvement (ED).
Washington, DC.Hay 90R117R9000240p.Reports - Descriptive (141)
MF01/PCO2 Plus PostagP.Economically Disadvantaged; Educational Resources;Elementary Education; *Elementary School Curriculum;Elementary School Students; Grade Repetition; HighRisk Students; *Kindergarten Children; Placement;*Prereading Experience; Preschool Children; PreschoolEducation; Program Effectiveness; ProgramImplementation; *Reading Skills; SchoolRestructuring; *Time Factors (Learning); Urban
EducationBaltimor City Public Schools MD; *Success for All
Program
This paper describes the second year of the Successfor All program, which tries to assure that each student in aninner-city school succeeds in acquiring basic skills in the earlygrades. The program was first implemented in the 1987-88 school yearin Abbottson Elementary :chool in Baltimore. First year resultsrevealed substantially higher student performance in language and
reading, and substantially reduced student retention and placement in
special classes in comparison with a matched school. This paper addsfour major sets of findings to the earlier study. The discussion
covers: (1) results of the second year of program implementation at
the pilot school; (2) the evaluation of a replication of Success for
All in its fully funded form in one of the poorest elementary schools
in Baltimore; (3) the evaluation of a form of Success for All
designed to be implemented under Chapter 1 schoolwide funds withrelatively minor additional costs; and (4) the evaluation of thebeginning reading component of the program. Sections of the document
detail program elements, variations, evaluation design, and results.
Findings imply that the insur_ 3 of kindergarten children's successat school may almost eliminate the need for retention in grade and
placement in special classes. (RH)
*** ******** ********** ************** ********* ***** *It ******* *************
Reproductions supplied by EDRS are the best that can be madefrom the original document.

U.& DEPARTMENT Of EDUCATIONOrk c EctucatxoN Reviver, and onocoopotent
EDUCARONAL RESOURCES INFORMATIONCENTER tERtO
X COOM miotosod Irons lIso 00110n Or CePEW:SISOnThiS Cent wen terepoutect
ltCOOKLIIN
Z.' MAO, criAnden Rev* betn mace to .mptovetwoth.COCA e.athry
Pants of 'new C$ OC,r00$ staled %tU3COCUmoni do no/ nodSlanly rOpreda at ottsCittPERI 004OtO0 0, °obey
tt%
SUCCESS FOR ALL
Effects of Variations in Duration and Resources of a
Schoolwide Elementary Restructuring Program
Robert E. Slavin
Nancy A. Madden
Nancy L. Karweit
Lawrence Dolan
Barbara A. Wasik
2
Report No. 2
May 1990

tt--"- -.7r
National Advisory Panel
Bestriz Arias, Colkge of Education, Arizona State University
Wry Parsee: Berry, DepartneM of Victory, University of Permsylvanis
Anthony S. Wyk, Department of Education, University of mango
Michael Chsrleston, Educational Policy Studies, Pennsylvania State
University
Constance E. Clayton, Superintendent, Philndclña PI.V.ic Schools
Edmund Gordon (Chair), Department of Psychology, Yale University
Ronald D. limderson, Nseonal Education Association
Vim= Jones, Dew, Education and Urban Affairs, Morgan State Univasity
Amu 1. Madrid, Director, Tomas Rivera Center
Hernan LaFontaine, Superintendent, Hartford Publk Schools
Peter Stanley, Dimmer, Education and Culture Program, Ford Foundation
William Julius Wilson, Department of Sociolozy, University of Chicago
Center Liaison
Harold Hinunelferb, Office of Educational Research and Improvement
3

Success For All
Effects of Variations in Duration and Resources of a
Schoolwide Elementary Restructuring Program
Robert E. Slavin
Nancy A. Madden
Nancy L. Karweit
Lawrence Dolan
Barbara A. Wasik
Grant No. R117 R90002
Report No. 2
May 1990
Published by the Center for Research on Effective Schooling for Disadvantaged Students,supported as a national research and development center by funds from the Office of EducationalResearch and Improvement, U.S. Department of Education. rhe opinions expressed in thispublication do not necessarily reflect the position or policy of the OERL and no officialendorsement should be inferred.
Center for Research on Effective Schooling for Disadvantaged StudentsThe Johns Hopkins University
3505 North Charles StreetBaltimore, Maryland 21218
4

The Center
The mission of the Center for Research on Effective Schooling for Disadvantaged Students(CDS) is to siprificantly improve the education Mdisadvantaged students at each level ofschooling thmugh new knowledge and practices produced by thorough scientific study andevaluation. The anter conducts its research in 2-our program areas: The Early and EkmentaryEducation Program, The Middle Grades and High Schools Program, the Language MinorityProgram, and the School, Family, and Community Connections Pmgram.
The Early and Elementary Education Program
This program is working to develop, evaluate; and disseminate instructional programscapable of bringing disadvantaged students to high levels of achievement, particularly in thefundamental areas of mading, writing, and mathematics The goal is to expand the range ofeffective alternatives which schools may use under Chapter 1 and other compensatory educationfunding and to study issues of direct relevance to federal, state, and local policy on education ofdisadvantaged students.
The Middle Grades and High Schools Program
This program is conducting research syntheses, survey analyses, and field studies in middleand high schools. The three types of projects move from basic research to useful practice.Syntheses compile and analyze existing knowledge about effective education of disadvantagedstudents. Survey analyses identify and describe current programs, practices, and trends in middleand high schools, and allow studies of their effects. Field su.dies are conducted in collaborationwith school staffs to develop and evaluate effective programs and practices.
The Language Minority Program
This program represents a collaborative effort. The University of California at SantaBarbara is focusing on the education of Mexican-American students in California and Texas;studies of dropout among children of recent immigrants are being conducted in San Diego andMiami by Johns Hopkins, and evaluations of learning strategies in schools serving Navajo,Cherokee, and Lumbee Indians are being conducted by the University of Northern Arizona. Thegoal of the program is to identify, develop, and evaluate effective programs for disadvantagedHispanic, American Indian, Southeast Asian, and other language minority children.
The School, Family, and Community Connections Program
This program is focusing on the key connections between schools and families and betweenschools and communities to build better educational progams for disadvantaged children andyouth. Initial work is seeking to provide a research base concerning the most effective ways forschools to interact with and assist parents of disadvantaged students and interact with thecommunity to produce effective community involvement.
5
Abstract
This report presents the results of the implementation of the Success for All elementary
school restructuring progam after two years in Abbottston Elementary School in Baltimore and
after one year in City Springs Elementary School in Baltimore. It also presents results of one-
year implementations of a less extensive Success for All program in four schools and year-and-a-
half implemernations of the beginning reading curriculum of Success for All in two other
schools. Overall, the effects on student me-reading and reading achievement from preschool
through fourth grade indicate that Success for All is moving in the right direction toward the
program's goal of insuring that all students be at grade "level in reading by the end of third grade.
6

Acknowledgments
We would like to thank the following individuals for their assistance in this research:
Clifton Ball, Matthew Riley, James Sarnecki, Ernestine Reid, I ^onard Wheeler, Carla Fold,
Nancy Gimbel, Lawrence Howe, Craig Spilman, Charlene Cooper-Boston, Harold Sanders,
Cornelius Johnson, Ardena Dixon, Barbara Wheeler, Alexander Gates, Alma Brown, Anna
Cop lin, Anne Roberts, Phoebe Shorter, and Mazy tonna)/ of the Baltimore City Public Schools;
Alice Pinderhughes, Alta Shaw, and Mary Leightor of The Johns Hopkins University; Barbara
Livermon of Notre Dame College; Joseph Gutkoske. and Ellen Notar of Towson State
University; and Ed Friendlander and Craig Schulze.
Introduction
This is a time of rapid change and new opportuni-ties for research and practice relating to theeducation of students who are at risk of schoolfailure. The education of disadvantaged studentsis being seriously discussed at all levels ofgovernment and society. Although most federaleducation programs are falling behind the mte ofinflation, funding for Chapter 1 (programs for lowachieving disadvantaged students) was increasedin 1989 by nearly a billion dollars, to five billionper year. Changes in Chapter 1 implementedunder the Hawkins-Stafford bill of 1988 haveencouraged school districts to implement a morediverse range of Chapter 1 programs. In partic-ular, many inner-city districts arc taking advan-tage of the bill's provision that schools servingvery disadvantaged populations can use theirChapter i dollars to serve all 'students (seeCommittee on Education and Labor, 1989).
While there is now an unprecedented willing-ness to experiment with alternative instructionalmodels in schools serving disadvantaged studentsand a willingness to spend more on programs withdemonstrated effectiveness, few coherent modelshave been designed for schoolwide use in schoolsthat serve disadvantaged students, and fewer stillhave convincing evidence that they increasestudent achievement.
One exception to this is a program calledSuccess for All (Slavin, Madden, Karweit,Livermon, & Dolan, in press). Success for All isdesigned to attempt to ensure that every student ina high-poverty school will succeed in acquiringbasic skills in the early grades. Success is definedas performance in reading, writing, language arts,and mathematics at or near grade level by thethird grade, and maintenance of this status throughthe end of the elementary grades, and avoidanceof retention or special education. The programseeks to accomplish this objective by imple-menting research-based preschool and kinder-garten programs; beginning and intermediatereading, writing, language arts, and mathematicsprograms; one-to-one tutoring in reading tostudents (especially first graders) who need it;frequent assessment of progress in reading, and afamily sum 4 program.
Success for All ws first implemented in the1987-88 school year in one inner-city Baltimoreelementary school, Abbottston Elementary. Thefirst year results revealed substantially higherstudent ilaa---;',nranee on measures of language inpreschool at- !earten and on measures ofreading in gratiag. 1-3, compared to students in amatched school. Reading gains were especiallylarge for students who had been in the lowest 25%of their grade on pretests; for these students, effectsizes averaged +.80 on individually administeredmeasures. Further, there were subatantial reduc-tions in the numbers of students retained orassigned to special education (see Slavin et al., inpress).
As impressive as the results were, the Slavinet al. (in press) study has many limitations. First,the program was implemented in only one school.It is unclear to what degree unique characteristicsof this school may have influenced the results.Also, theory underlying the Success for Allprograaa depends on a cumulative effect ofprevention and early intervention. The first yeardata indicate a positive direction, but the cumula-tive impact cannot be determined until more timehas gone by.
Success for All is expensive, which limits itsimplications for practice. Design and evaluationof a less expensive and therefore more replicableform of the program would be of great practicalvalue. Finally, Success for All has manycomponents, and an overall evaluation cannotdetermine the contribution of each component.
The present paper describes the secondimplementation year of the Success for Allprogra It adds four major sets of findings to theearlier Slavin et al. (in press) study. First, thispaper presents results of the second year ofprogram implementation at Abbottston Elemen-tary, the original pilot school. Second, itdescribes the evaluation of a teplication ofSuccess for All in its fully funded form (as atAbbonston) in one of the poorest elementaryschools in Baltimore. Third, it describes theevaluation of a form of Success for All designedto be implemented under existing Chapter 1
schoolwide funds, with relatively minor additional
costs. Finally, it describes the separate evaluationof the specific beginning reading component ofSuccess for All.
The contribution of this paper is both prac-tical and tlreoretical. Construction of a form ofSuccess for All that could be successfully usedunder typical Chapter 1 funding constraints wouldbe a major practical contribution to many Chapter
1 schoolwide projects being formulated under thenew Hawkins-Stafford regulations. For theory aswell as practice, it is critical to know the cumula-tive effects of Success for All, whether theprogram can be successfully transferred to newlocations, and what in&pendent effects theinnovative beginning rezaing program developedfor Success for All may have.
Program Elements
Success for All exists in three principal formsin the Baltimore City Public Schools. In itsoriginal conception, Success for All was intendedto provide whatever resources are needed toensure that every child learned adequate basicskills. To fulfill this guarantee, additionalresources must be provided over &id above theusual local and Chapter 1 funds received by theschool. Two schools are currently implementingthis fully funded form of Success for All.
Four additional schools are implementing aless expensive form of the program which isfunded primarily by Chapter 1 monies, supple-mented by materials, training, and a half-timefacilitator from a federal dropout prevention grant.Two schools are implementing the beginningreading program only, without any additionalfunds. The two fully funded and four Chapter1-only schools are Chapter 1 schoolwide projects,which means that at least 75% of their studentsreceive free lunch and that they can use theirfederal Chapter 1 funds to improve the school as awhole rather than to serve only identified students.One of the Chapter 1-only schools contains anumber of white as well as African-Americanstudents; at all other schools, almost all studenesare A frican-American.
The curricula being implemented in all threeforms of Success for All are identical, with eachschool receiving the same curriculum materialsand supplies. What varies across the three formsof the program are the numbers of personnel, inparticular the numbers of tutors and familysupport staff. Also, the two fully funded schoolshave a full-time project facilitator, the fourChapter 1-only schools a half-time facilitator, andthe two curriculum-only schools no facilitator.
-2-
The characteristics of the three forms of theprogram are described in more detail in a latersection.
The main elements of Success for All aredescribed below (adapted from Slavin et al., inpress).
Reading Tutors
One of the most important elements of theSuccess for All model is the use of tutors topromote students' success in reading. One-to-onetutoring is the most effective form of instructionknown (see Slavin, Karweit, & Madden, 1989).The tutors are cenified teachers with experienceteaching Chapter 1, special education, and/orprimary reading. Tutors work one-on-one withstudents who ale having difficulties keeping upwith their reading groups. The tutoring occurs in20-minute sessions taken from an hour-long socialstudies period. In general, tutors support students'success in the regalar reading curriculum, ratherthan teaching different objectives. For example, ifthe regular reading teacher is working on longvowels, so does the tutor. However, tutors seek toidentify learning problems and use differentstrategies to teach the same skills.
During daily 90-minute reading periods,tutors serve as additional reading teachers toreduce class size for reading to about 15 in fullyfunded schools and about 20 in Chapter 1 onlyschools. Reading teachers and tutois use briefforms to communicate about students' specificproblems and neecs and meet at regular times tocoordinate their approaches with individualchildren.
Initial decisions about reading groupplacement and the need for tutoring are based oninformal reading inventories that the tutors give toeach child. Subsequent reading group placementsand tutoring assignments are made based oneight-week assessments, which include teacherjudgments as well as more formal assessments.First graders receive first priority for tutoring, onthe assumption that the primary function of thetutors is to help all students be successful inreading the first time, before they becomeremedial readers.
Reading Progyam
Students in grades 1-3 are regrouped forreading. The students are assigned to heteroge-neous, age-grouped classes with class sizes ofabout 25 most of the day, but during a regular90-minute reading period they are regrouped by toreading performance levels into reading classes of15 students all at the same level. For example, a24 reading class might contain first, second, andthird grade students all reading at the same level.
Regrouping allows teachers to teach thewhole reading class without having to break theclass into reading groups. This greatly reducesthe time spent in seatwork and increases directinstruction time. We do not expect reduction inclass size to increase reading achievement byitself (see Slavin, 1989), but it does enable everyreading class to be conducted at only one readinglevel, and the teacher can teach to students at thesame level. This will eliminate workbooks, dittos,or other follow-up activities which are needed inclasses that have multiple reading groups. Theregrouping is a form of the Joplin Plan, which hasbeen found to increase reading achievement in theelementary grades (Slavin, 1987a).
The reading gram itself (Madden, Slavin,Livermon, Karwe.., at Stevens, 1987) takes fulladvantage of having 90 minutes of direct instruc-tion. Reading teachers at every grade level beginthe reading time by reading children's literature tostudents and engaging them in a discussion of thestory to enhance their understanding of the story,listening and speaking vocabulary, and knowledgeof story structure. In kindergarten and first grade,the program emphasizes development of basiclanguage skills with the use of Story Telling and
-3-
Retelling (STA), which involves the students inlistening to, retelling, and dramatizing children'sliterature. Big books as well as oral and writtencomposing activities allow students to developconcepts of print as they also develop knowledgeof &Dory SMICtUre. Peabody Language Develop-ment kits are used to further develop receptive andexpressive language.
Beginning reading is introduced whenstudents are ready, either in kindergarten or at thebeginning of first grade. In this program, lettersand sounds are introduced in an acrive, engagingseries of activities that begins with oral languageand moves iMo written symbols. Once lettersounds are taught, they are reinforced by thereading of stories which use the sounds. The K-1reading program uses a series of phoneticallyregular but interesting minibooks and emphasizesrepeated oral reading to parMers as well as to theteacher, instruction in stuly structure and specificcomprehension skills, and integration of readingand writing.
When students reach the 2-1 reading level,they use a form of Cooperative IntegratedReading and Composition (CIRC) (Stevens,Madden, Slavin, & Famish, 1987) with thedistrict's Macmillan basal series. CIRC usescooperative learning activities built around storystructum, prediction, summarization, vocabularybuilding, decoding practice, and story-relatedwriting. Students engage in partner leading andstrucuned discussion of the basal stories, andwork toward mastery of the vocabulary andcontent of the story in teams. Story-relatedwriting is also shared within teams.
In addition to these basal story-relatedactivities, teachers provide direct instruction inreading comprehension skills, and studentspractice these skills in their teams. Classroomlibraries of trade books at students' reading levelsare provided tor each teacher, and students readbooks of their choice for homework for 20minutes each night. Home readings are shared viapresentations, summaries, puppet shows, andother formats twice a week during "book club"sessions. Reseant on CHIC has found it tosignificantly increase students' reading compre-ension and language skills (Stevens, et al., 1987).
1 0

Eight-Week Reading Assessments
At eight week intervals, reading teachersassess student progress through the readingprogram. The results of the assessments are usedto determine who is to receive tutoring, to changestudents' reading groups, to suggest other adapta-tions in students' programs, and to identifystudents who need other types of assistance, suchas family interventions screening for or vision andhearing problems.
Preschool and Kindergarten
Many of the Success for All schools providea half-day preschool and/or a full-day kinder-garten for eligible students. The preschool andkindergarten programs focus on providing abalanced and developmentally appropriatelearning experience for young children. Thecurriculum emphasizes on the development anduse of language. It provides a balance ofacademic readiness and non-academic music, art,and movement activities. Readiness activitiesinclude use of the Peabody Language Develop-ment Kits and a program called Story Telling andRetelling (STaR) in which students retell storiesread by the teachers (Karweit. 1988). Prereadingactivities begin during the second semester ofkindergarten.
Family Support Team
A family support team works full-time ineach school. In the fully funded schools, socialworkers, attendance monitors, and other staff areadded to the school's usual staff. In Chapter1-only sdools, the family support team consistsof the parent liaison, vice-principal (if any),counselor (if any), facilitator, and any otherappropriate staff already present in the school.The family support team provides parentingeducation and works to involve parents in supportof their children's success in school. Also, familysupport staff ate called on to provide assistancewhen students seem to be working at less thantheir full potential because of problems at home.Families of students who are not receivingadequate sleep or nutrition, need glasses, are notattending school regularly, or are exhibitingserious behavior problem!, receive family supportassistance. The family support team is stronglyintegrated into the academic program of theschool. It receives referrals from teachers and
-4-
61111111/1111/11MMIMMNIINIPAITIMOIMM.
tutors regarding children who are not makingadequate academic progress and thereby consti-tutes an additional stage of intervention forsnidents in need above and beyond that providedby the classroom teacher or tutor.
Program Facilitator
A program facilitator works at the school fulltime to oversee (with the principal) the operationof the Success for All model. Fully fundedschools have a full-time facilitator while Chapter1-only schools have half-time facilitators. Thefacilitator helps plan the Success for All program,helps the principal with scheduling, and visitsclasses and tutoring sessions frequently to helpteachers and tutors with individual problems. Heor she works directly with the teachers onimplementation of the curriculum, classroommanagement, and other issues, helps teachers andtutors deal with any behavior problems or otherspecial problems, and coordinates the activities ofthe family support team with those of the instruc-tional staff.
Teachers and Teacher Training
The teachers and tutors are regular BaltimoreCity teachers. They received detailed teacher'smanuals supplemented by two days of inservice atthe beginning of the school year. For teachers ofgrades 1-3 and for reading tutors, these trainingsessions focused on implementation of the readingprogram, and their detailed teachers' manualscovered general teaching strategies as well asspecific lessons. Preschool and kindergartenteachers and aides were trained in use of the STaRand Peabody programs, thematic units, and otheraspects of the preschool and kindergarten models.Tutors later received an additional day of trainingon tutoring strategies and reading assessment.
Throughout the year, inservice presentationscovered sub topics as classroom management,instructional pace, and cooperative learning; andthe facilitator organized many informal sessionswere to allow teachers to shae problems andproblem solutions, suggest changes, and discussindividual children. The staff development modelused in Success for All emphasizes relatively briefinitial training with extensive classroom followupand coaching and group discussion.
1 1

Special Education
Every effort is made to deal with students'learning problems within the context of theregular classroom, as supplemented by tutors.Tutors evaluate students strengths and weaknessesand develop strategies to teach in the most effec-tive way. Tutors also communicate many effec-tive methods of teaching a student to the class-room teacher. It is felt that this intervention formsan important intermediate step between classroominstruction and referral to special education. As aresult of this process, once referral is considered
appropriate, it is likely to be much more accurate,thus avoiding unnecessary assessments forinfocused referraLs.
Advisory Committee
An advisory committee composed of thebuilding principal, program facilitator, teacherrepresentatives, family support staff, and JohnsHopkins staff meets regularly to review theprogress of the program and to identify and solveany problems that arise.
ProgramVariations
(I) Abbottston Elementary School
Abbottston is the pilot school for Success forAll designed to test (with the project at CitySprings) the short- and long-term effects of aprogram which concentrates significant additionalresources at the early grade levels to ensure thatall children reach the thin:1 grade with adequateskills. The hope is that if we can show substantialand lasting gains, the additional resourcesexpended will be compensated for by significantlyreduced needs for special education, remedialion,and retentions throughout the grades. Also, if wecan establish that all inner-cita children can leamwith adequate resources and effective programs,additional sources of funds may be forthcoming toprovide these resources and programs.
Implementation ef the program began atAbbottston in September, 1987. It is funded byChapter 1 money pl as approximately $400,000 inChapter 2 funds. the Success for All model atAbbouston provides a total of six tutors, an extrateacher to reduce overall class size to 25, an extrapreschool teacher and aide to ensure all four-year-olds access to preschool, extended-day kinder-garten and kindergarten aides, and a social workeras part of a family support team. A second socialworker is provided by the Department of SocialServices and a part-time nurse practitioner isprovided by the State Health Department.
During 1987-88, Abbottston staff imple-mented the Success for All reading program ingrades K-3, Story Telling and Retelling (STaR)and the Peabody Language Development Program
-5-
in pre-K, kindergarten, and first grade, and thefamily support program. The evaluation of thisfirst implementation year was published by Slavinet al. (in press). In 1988-89, the reading programwas expanded to include grades 4-5, andmathematics and writing programs were piloted ingrades 3-5.
(2) City Springs Elementary School
City Springs is the second school imple-menting the fully funded form of Success for All.With more than 95% of its students qualifying forfree lunch, City Springs is among the historicallypoorest and lowest achieving schools in Balti-more. The implementation at City Springs beganin September, 1988.
As at Abbottston, the implementationfocused initially on the reading, STaR, Peabody,and family support programs. The school isreceiving approximately $370,000 per year from aprivate foundation in addition to its usual Clapter1 funds. It is using these funds to hire a total ofnine tutors, a social worker, an attendancemonitor, a full-time counselor, and a full-timeproject facilitator. The school already hadadequate staff for preschool and full-day kinder-garten.
During the 1988-89 school year, tim SuccessFor All reeding program was introduced in gradesK-3. Preschool, kindergarten, and family supportprograms were also introduced.
1 2

(3) Chapter 1-Only Schools
Abbottston and aty Springs will demon-strate what could be achieved in Baltimore CitySchools with enhanced levels of fending. But it isalso important to design and assess thg effects of aprogram which could be replicated under morerealistic funding levels. This is the principal goalof the extension of Success for All to four addi-tional schools in a much less expensive formwhich could be implemented primarily underChapter 1 funds. A dropout prevention grant fromthe U.S. Department of Education provided fortraining, materials (which replace basals in gradesK-1 end reading workbooks in grades 2-3), adistrict program coordinator, and a half-timefacilitator in each school. The original plan wasto serve five additional schools, but only fourwere finally selected because one school that hasapproximately 750 students in gades pre-K to 2,counts as the equivalent of two schools. Thus,while threg of the schools received half-timeassistance from a Johns Hopkins-based facilitator,this one received a full-time facilitator. Exceptfor the facilitators, all other staff involved in theChapter 1-only model are those who would havealready been present in the school, under eitherlocal or Chapter 1 funds.
The fully funded and the Chapter 1-onlyforms of Success for All differ primarily in thenumber of tutors and of family support staff.Abbonston and City Springs have about one tutorfor every 25-30 students in grades 1-3; theChapter 1-only schools have approximately onetutor for every 50-60 students in grades 1-3.Chapter I-only schools receive the same family
Matching
support resources as other Chapter 1 schoolwideprojects, a fuli-time patent liaison and a half-timecounselor (plus a vice principal in the largerschools). The basic ccmponents and curricula ofthe ChaTter 1-only program are the same as thosebeing implemented at Abbottston and CitySprings, with adaptations necessitated by theunique needs of tne various schools.
The full implementadon of Success For Allin the Chapter 1-only schools began in November-December, 1988. During the 1988-89 schoolyear, these schools introduced the readingprogram in grades R-3, the preschool program (mthe two schocls which offered preschool), and thekindergarten program. One school (DallasNicholas Elementary) began as a curriculum-onlyschool (see below), and started implementinj thebeginning reading model kindergarten inFebruary, 1988, continuing into first grade duringthe 1988-89 school year.
(4) Curriculum-Only Study
The curriculum-only study evaluated thebeginning reading cuniculmn, which is introducedin the second semester of kindergarten andcontinued into first grade. (Students in Successfor All go on to "Beyond the Basics" when theyreach tie 2-1 reading level.) The program wasintroduced in kindergartens at two schools inFebruary, 1988. In September, first gradeteachers received the training and maerials andcontinued the program through tire 1988-89school year.
Evaluation Design
Each of the eight Success for All schools wasmatched with a comparison school that wassimilar in the percent of students receiving freelunch, historical achievement level, and otherfactors. Within each matclre school, studentswere individually matched on spring 1988California Achievement Test (CAT) scores. (Theoriginal pilot school, Abbottston Elementary, wasmatched with its comparison school on spring1987 scores.) Abbottston and comparison
-6-
students who lacked 1987 scores were matched onspring 1988 scores.
Measures
At Abbottston and City Springs and theircomparison schools, all students in grades Pre-Kto 4 (Abboeston) and Pre-K to 3 (Caty Springs)were given individually administered tests inspring 1989. All first graders at the curriculum-only schools and their comparison school were
1 3
also individually tested. In the four Chapter 1-onlyschools and their comparison schools, one-third ofall students were randomly selected to be tested.
All measures were the same as those used bySlavin et al. cm press). The California Achieve-ment Tests were routinely administered by theschool district; the individual measures wereadministered by education and psychologystudents fmm a local college. The specificmeasures used were as follows.
Language. Two tests of receptive andexpreWve language were individually adminis-tered to preschool and kindergarten students.
1. Test of Language Development (TOLD;Newcomer & Hanunill, 1988). Individuallyadministered Picture Vocabulary and SentenceImitation Scales from the TOLD were used toassess receptive and expressive languageconcepts, respectively, of preschool and kinder-garten students.
2. Merrill Language Screening Test (Mumrn,Secord, & Dykstra, 1980). The individuallyadministered comprehension scale from theMerrill was used to assess the ability to under-stand complex story structure of preschool andkindergarten students.
Reading. Four individually administeredreading scales were selected from two widely
nationally standardized reading batteries toassess a full range of reading skills: word attack(Woodcock Word Attack), recognition of lettersand key sight words (Woodcock Letter-Word),oral reading fluency (Durrell Oral Reading), andcomprehension (Durrell Oral and Silent Reading).These scales, plus the district-administeredCalifornia Achievement Test, are describedbelow.
1. Woodcock Language Proficiency Battery(Woodcock, 1984). Two Woodcock scales,
-7-I
Letter-Word Identification and Word Attack, wereindividually administered to studems in gradesK-3. The Letter-Word scale was used to assessrecognition of letters and common sight words,while the Word Attack scale assessed phoneticsynthesis eking
2. Durrell Analysis of Reading Difficulty(Durrell and Catterson, 1980). Two Dunellscales, Oral and Silent Reading, were adminis-tered to students in grades 1-3. Oral Readingpresents a series of graded reading passagesfollowed by comprehension questions, whichstudents read aloud. The Silent Reading scalealso uses graded reading passages which studentsread silently. Students are then asked to recall themain elements of the story. Both Oral and SilentReading contain assessments of reading compre-hension, but the Oral Reading scale focuses moreon a decoding focus while Silent Reading hasmore of a comprehension focus.
3. California Achievement Test (CTB/McGraw-Hill, 1985). The group-administeredreading comprehension and reading vocabularyscales from the school district's regular CAT testwere analyzed for students in grades 1-3.
Analyses
Data were analyzed using analyses ofcovariance, with pretests as covariates. Outcomeswere characterized in terms of effect sizes, whichare the differences between experimental andcontrol means divided by the control group'sstandard deviations. All analyses used raw orstandard scores, grade equivalents are reported tofacilitate understanding, but were not used in theanalyses. For each of the analyses of readingachievement in grades 1-3, omparisons weremade between all students at each grade level, andthen separate analyses compared students whosccred in the lowest 25% of their grades on thepretests.
1 4

Results
Prekindergarten
Table 1 presents the comparisons of prekin-derganen Success for All students with theirmatched connterpans in the comparison schools.Significant positive effects were found only on theTOLD Picture Vocabulary Scale at Abbottston,but average effects sizes were positive at Abbott-ston (ES = +.16), City Springs (ES = +.28), and inthe two Chapter 1-only schools that providedprekindergarten programs (ES = +.05). Noconsistent patterns appear in the results, except atendency for more positive effects to be seen onthe Merrill Comprehension scale than on theTOLD scales.
TABLES 1 AND 2 HERE
Kindergarten
Table 2 presents comparisons for thekindergarten students. Effect sizes averaged +.03at Abbottston, +.44 at City Springs, +.50 at DallasNicholas, and +.14 in the four Chapter 1-onlyschools. However, the only significant differ-ences were on Word Attack at City Springs, andMerrill and TOLD scales at Dallas Nicholas. It isnot clear why the positive resufts obtained inAbbottston in the first year were not found in thekindergarten again. One explanation may be thatthe effects for the Story Telling and Retellingprogram occur primarily in the first year ofexposure to the program (the prekindergartenyear).
First Grade
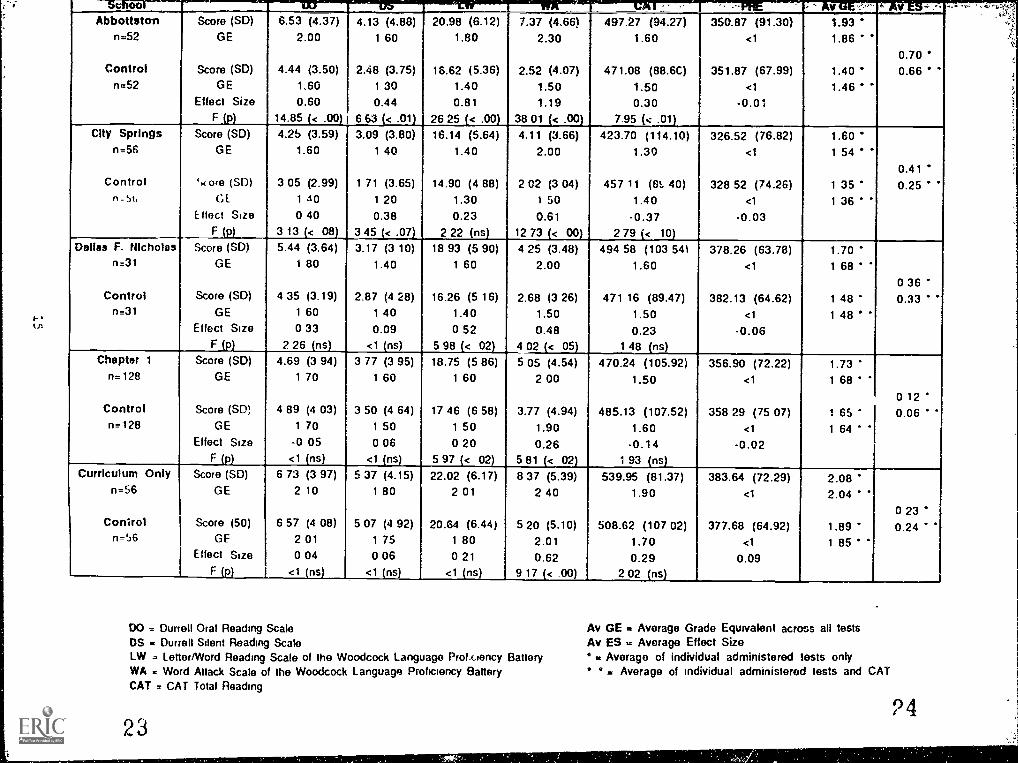
Tables 3 and 4 and Figure 1 summarize theresults in first grade.
TABLES 3 AND 4 AND FIGURE 1 HERE
The results on the individually administeredtests in the fully funded schools -- Abbottston andCity Springs -- strongly supported Success for All.Effect sizes (ES) averaged +.76 at Abbottston,
-8-
with statistically sigilficant positive effects on allfour individually administered tests and the CAT.At aty Springs, significant differences werefound on Word Attack and marginal effects onboth Durrell measures, and effect sizes averagedat + .41.
Effects in the Chapter 1-caly schools werevery small on all measures. Effects were positivefor the curriculum-only schools on the individu-ally administered measures (ES = +.23), primarilydue to a substantial effect on Woodcock WordAttack and for the CAT (ES = +.29).
Effects were also very positive for DallasNicholas Elementary, which had significantlypositive effects on the two Woodcock measures(average ES = +.36) and the CAT (ES = +23).This is the Chapter 1-only school whose firstgraders had been in the reading program since themiddle of kindergarten.
Effects for students who scored in the lowestquarter of their grades at pretest were consistentlypositive and strong Jn the individually adminis-tered tests (Table 4). Low-achieving first gradersat Abbottston who had been in the program sincekindergarten far outscored their matched cotmter-parts, with a mean effect size of +2.37. Effectswere statistically significant on all four measures.Lowest achieving students at Abbottston scorednearly at grade level (G.E.=1.8), while the lowestquarter in the comparison school were barelyreading (G.E.=1.2).
Low achievers at City Springs also substan-tially outscored those at its comparison school(E.S.=+.55), although the differences were statis-tically significant only on the Durrell Oral and(marginally) Durrell Silent measures.
Smaller positive effects for low achieverswere seen in the Chapter 1-only schools(ES=+.28), wiLli significant differences on the twoWoodcock scales.
Finally, substantial differences were found atthe curriculum-only sites, whe:e students hadbeen in the program since mid-kindergarten(ES=+1.27). This difference was primarily due to
15

significant and extraordinary effects on theWoodcock Word Attack scale. Results on theCAT were highly variable and probably have littlesubstantive meaning at these low levels.
The finding of larger effects for thecurriculum-only schools compared to the betterfunded Chapter 1-only schools is probably due tothe length of time the program had been imple-mented in each type of school. The curriculum-only schools began to use the Success for Allbeginning reading program in Febmary, 1988,while Chapter 1-only schools began in Novemberor December, 1988. Thus, students in thecurriculum-only schools had been using theprogram for one and a half years by the time ofposttesting, whereas most of the Chapter I-onlyschools had been using the program for aboutthree quarters of a year.
This difference is also reflected among theChapter 1-only schools. First graders at DallasNicholas Elementary (which originally began as acurriculum-only school) had also been in theprogram for one and a half years at posnesting,and scores for these students were also verypositive.
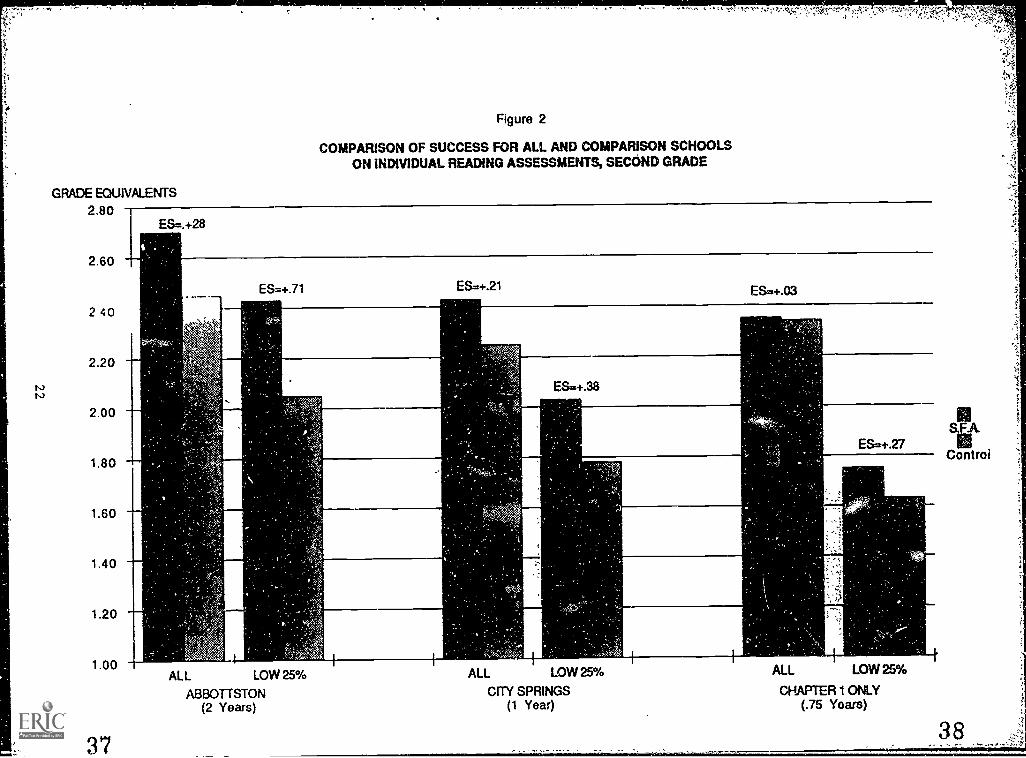
Second Grade
Tables 5 and 6 and Figure 2 summarize theresults for second grade.
TABLES 5 AND 6 AND FIGURE 2 HERE
Effects on the individually administeredmeasures were positive in the second grade atAbbottston (ES = +.28) although significanteffects were found only on Word Attack.
The average effects were similarly positive atCity Springs (ES = +.21) due to a large andsignificant effect on Durrell Oral. There were nodifferences on the CAT at either school, and nosignificant differences on any measure in theChapter 1-only schools.
As in the first grades, tlfects for the lowestachieving second graders were particularlypositive (Tatie 6). Low achievers at Abbottstonscored substantially better than comparisonstudents (ES=+.71) although, due to small n's,
only marginally significant effects were found onDurrell Silent. Positive but non-significant effectswere also found at City Springs (ES=+.38) and inthe Chapter 1-only schools (ES=+.27). However,no differences were found on CAT's.
Third Grade
Tables 7 and 8 and Figure 3 summarize theresults for the third grade.
TABLES 7 and 8 AND FIGURE 3 HERE
In the third grade (Table 7), effects stronglyfavored Success for All at Abbottston on theindividually administered tests (ES = +.38) and onthe CAT (ES = +.53). Differences were signifi-cant on the Woodcock Letter-Word scale and(marginally) on the Word Attack and CAT.However, there were no consistent differences atCity Springs.
In the Chapter 1-only schools, Success forAll students perfonned substantially better thancomparison students on the individually adminis-tered scales (ES = +.52), but not on the CAT.Significant differences were found on both Durrellmeasures and on Woodcock Letter-Word.
Effects for the lowest achieving students onthe individually administered measures (Table 8)were very positive at Abbottston (ES=+1.28),with statistically significant differences on theDurrell Oral and Letter-Word scales and margi-nally significant effects on Word Attack.
Substantial positive effects were also seen inthe Chapter 1-only schools (ES=+.77), withsignificant differences on Durrell Oral andmarginal differences on Durrell Silent, but nodifferences were found at City Springs. Substan-tial but non-significant differences favoringSuccess for All were also found on the CAT's(ES=+.74) for Abbottston.
Fourth Grade
Fourth grade results were assessed only atAbbottston, where effects strongly favoredSuccess for All both on the individually adminis-tered tests (ES = +.38) and on the CAT (ES =
+33). The differences were significant on theWoodcock Letter-Word and CAT scales. Theresults for fourth grade are summarized at the
bottom of Table 7. Effects for the lowest 25% ofstudents could not be computed due to inadequatesample size.
Discussion
Overall, the results of the 1989 tests stronglysupport the effectiveness of Success for All inincreasing student reading performance. Onindividually administered tests, effects of Successfor All were significantly positive in mostcomparisons. As in the first year at AbbottstonElementary (Slavin et al., in press), results wereparticularly positive for students whose pretestsplaced them in the lowest quarter of their grades.
The pattern of results indicated that studentsperfonned better the longer they were in theprogram. First, larger effects were obtained atAbbottston in its second year than in its first yearin the first and second grades, and findings fromthe first year at City Springs resembled those forthe first year at Abbottston. In addition, thehigher performance of first graders in thecurriculum-only schools than that of students inthe Chapter 1-only schools (and the outstandingperformance of first graders at Dallas Nicholas,who had been in the pmgram for 1 112 years)indicate that a longer time in the programproduces significantly better results.
The first grade findings also support aconclusion that should not be surprising: moneymatters. Most of the extra resources given to thefully funded schools provide tutoring for low-achieving first graders. As a result, the outcomesat the fully-funded schools, Abbottston and CitySprings, are especially positive. The substantialpositive effects for low achievers also show theimpact of funding, as the lowest achieversreceived the lion's share of the most expensiveresource, one-to-one tutoring.
However, the results from the curriculum-only schools and from Dallas Nicholas Elemen-tary (all of whose first graders had been in theprogram for 1 1/2 years) additionally show thatgiven a longer implementation period, schoolswithout the extra resources also produce impres-sive results.
-10-
The dramatic effects on the reading achieve-ment of Abbottston first graders who were in thelowest 25% on the pretests provides compellingevidence that the goal of success in reading forevery child may be feasible. On average, tImselow achieving students scored at the 46th percen-tile on the irdividually administered reading tests.Matched low achievers in the comparison schoolaveraged at the 8th percentile. Only 31% of thecomparison school's low achieving first graderscould decode even one of the nonsense words"tiff, hap, nan, mel, or jox" on the WoodcockWoid Attack scale. One hundred percent ofAbbottston students could decode at least two ofthese, and the lowest 25% of Abbottston firstgraders averaged 6.5 words. Only one of the lowachieving students at the comparison school (8%)could comprehend the following passage:
"I have a black dog. He has a little tail. Hecan jump and run."
I contrast, 69% of Abbottston low achieversshowed comprehension of this passage on theDurrell Silent Reading scale, and 31% couldremember at least ten things about a complex,70 word passage at the second grade readinglevel.
What these results imply is that if we startwith children in kindergarten and do whatever isnecessary to see that they are successful the firsttime they are taught, almost every first grader maybe well on the way to reading without recourse tospecial education or retentions. Four of the 48Abbottston first graders who have been in theprogram since kindergarten are not making whatwe consider to be satisfactory progress toward thegoal of grade level reading in the third grade, butwith continued participation in good qualityinstruction, tutoring, and family support services,we are still confident that even these fewremaining students will succeed.
I 7

The findings for the third and fourth gradesat Abbottston primarily show the effectiveness ofthe Beyond the Basics reading program, as thirdand fourth graders receive little tutoring in thefully-funded schools and none in the Chapter1-only schools. The substantial positive effects inthird and fourth grades seen in most schoolsmirPar findings at Abbottston in its first year.
The results indicate a few areas whereadditional efforts are needed. In particular,relatively weak results in second grade (also seenlast year at Abbottston; see Slavin et al., in press)point to a difficulty many teachers have observedin the transition from beginning reading toBeyond the Basics. Many teachers in the Chapter1-only schoo.s also noted the difficulties involvedin starting the beginning mading program after thebeginning of the school year, and this wasreflected in test performance in the first andsecond grades at these schools.
The ultimate goal of Success for All, partici).
larly in its fully funded form, is to bring vittuallyall children to grade level performance in basicskills (especially reading) by the end of the thirdgrade, and to maintain them there through the endof elementary school. This commitment is madefor gudents v began the program in preschooland who continue through third grade, so it is toosoon to assess it. However, there are severalindications that the program is headed in the rightdirection.
First, there is clear evidence that the longerstudents are in the program tiv better they do.Comparing results from Abbottston over twoyears, it is clear that the effects are cumulative.Second, tlx extraordinary performance of lowachieving first graders at Abbottston suggests thepossibility that we may reach our pal of readingsuccess for every child sooner than we hadexpected. Third, the vety positive effects seen inthe third and fourth grades in most schoolsindicate student success can be accelerated evenbeyond the years when tutoring is provided.
1

References
Abell Foundation (1989). A growing inequality: A report on the financial condition of the Baltimore CityPublic Schools. Baltimore,MD: Author.
Karweit, N.L. (1988). Story Telling and Retelling (STaR): Teacher's Manual. The Johns HopkinsUniversity, Center for Research on Elementary and Middle Schools.
Karweit, N.L. (1989a). Preschool programs for students at risk of school failure. In R.E. Slavin, N.L.Karweit, and N.A. Madden (Eds.), Effective Programs for Students at Risk. Boston: Allyn &Bacon.
Karweit, N.L. (1989b). Effective kindergarten programs and practices for students at risk of academicfailure. In RE. Slavin, N.L. Karweit, and N.A. Maiden (Eds.), Effective Programs for Students atRisk. Boston: Allyn & Bacon.
Madden, N.A., Slavin, R.E., Livennon, B.J., Karweit, N.L., & Stevens, R.J. (1987). Success for All:Teacher's Manual for Reading. The Johns Hopkins University, Center for Research on Elementaryand IvEddle Schools.
Murnm, M., Secord, W., and Dykstra, K. (1980). Merrill Language Screening Test. New York: Psycho-logical Corporation.
Newcomer, P.L., and Hammill, D.D. (1988). Test of Language Develop...att-2. Austin, TX: Pro-Ed.
Slavin, R.E. (1987). Ability grouping and student achievement in elementary schools: A best-evidencesynthesis. Review of Educational Research, 57, 293-336.
Slavin, R.E. (1989). Achievement effects of substantial reductions in class size. In R.E. Slavin (ed.),School and classroom organization. Hillsdale, NJ: Erlbaum.
Slavin, R.E., Karweit, N.L., & Madden, N.A. (eds.) (1989). Effective programs for students at risk.Boston: Allyn & Bacon.
Slavin, R.E., Madden, N.A., Karweit, N.L., Livermon, B.J., & Dolan, L. (in press). Success for All:First-year outcomes of a comprehensive plan for reforming urban education. American Educa-tional Research Journal.
Stevens, KJ., Madden, N.A., Slavin, R.E., & Famish, A.M. (1987). Cooperative Integrated Reading andComposition: Two field experiments. Reading Research Quarterly, 22, 433-454.
Woodcock, R. W. (1984). Wooda.,k Language Proficiency Battery. Allen, TX: DLM.
1 9
-12-

SchoolMerrill
Com. ehansionTOLD
PictureTOLD
Sentence ImitationAbbottston Score (SD) 3.57 (1.30) 9.27 (4.61) 6.17 (4.28)
n=30 Percentile 68th %ile 50th %ile 37th %Ile
Control Score (SD) 3.10 (1.75) 7.13 (4.22) 8.06 (6.86)n.30 Percentile 40th %ile 25th %ile 50th %ile
Effect Size 0.26 0.50 -0.29F 3.53 <.07 9.7 <.03 <1 ns
City spring9 Score (SD) 3.00 (1.65) 8.00 (5.42) 6.43 (5.26)n=18 Percsntile 30th %ile 25th %ile 37th %ile
Control Score (SD) 2.06 (1.66) 7.56 (4.42) 6.00 (3.72)n=18 Percentile 7th %ile 25th %ile 37th %ile
Effect Size 0.63 0.11 0.11F 1.52 ns <1 ns <1 ns
Chapter 1 Score (SD) 2.88 (1.81) 8.37 (4.45) 6.50 (4.85)n=77 Percentile 25th %ile 25th %ile 37th %ile
Control Score (SD) 2.52 (1.65) 8.23 (4.96) 6.99 (4.81)n=77 Percentile 25th %ile 25th %ile 37th %ile
Effect Size 0.22 0.03 -0.10F. <1 ns <ins <1 ns

Table 2: Kindergarten Assessment Results
Merrill TOLD TOLD Lotter Word
School Comprehension Picture Sentence Word AttackAbbottston Score (SD) 4.38 (.98) 13.24 (4.81) 6.91 (5.72) 7.28 (6.76)
n=30 GE / Percentile 68% 63% 25% G E <1.0
testControl Score (SD) 3.95 (2.44) 11.76 (4.25) 10.05 (5.61) 6.95 (2.57) not
n = 3 0 GE / Percentile 40% 50% 37% G E <1.0 givenEffect Size 0.18 0.35 -0.56 0.13
F (0) < 1 ns 1.11 ns 3.2 < .08 < 1 ns
City Springs Score (SD) 4.00 (1.38) 9.64 (4.24) 10.42 (6.43) 7.50 (3.66) 1.00 (2.4)
n=18 GE / Percentile 40% 37% 37% G E <1.0 G E 1.2
Control Score (SD) 3.56 (1.59) 9.76 (4.49) 9.53 (5.42) 7.07 (2.49) .24 (.57)
n=18 GE / Percentile 22% 37% 37% GE<1.0 GE<1.0
Effect Size 0.28 0.04 0.17 0.18 1.51
Lia < 1 ns < 1 r(2sL__snr,E)<jjrls) 20.52 is2.11___
Dallas F. Nicholas 4.15 (.98) 13.38 (2.69) 4.92 (3.77)Score (SD) 13.62 (7.28) .69 (1.7)
n=30 GE / Percentile 53% 63% 63% G E <1.0 G E <1.0
Control Score (SD) 3.08 (1.8) 8.08 (5.19) 7.15 (4.74) 7.54 (5.65) .62 (1.3)
n=30 GE / Percentile 22% 25% 25% G E <1.0 G E <1.0
Effect Size 0.59 1.02 1.36 -0.46 0.00
F_fel 5.22 < .01 15.61 < .01 27.75 < .01 3.17 ns < 1 (ns)
Chapter 1 Score (SD) 3.87 (1.42) 10.15 (6.46) 10.15 (6.48) 6.37 (3.84) .62 (1.24)
n=47 GE / Percentile 40% 37% 37% G E <1.0 GE<1.0
Control Score (SD) 3.61 (1.39) 8.30 (5.36) 8.31 (5.37) 8.10 (4.24) .39 (1.14)
n=47 GE / Percentile 22% 25% 25% G E <1.0 G E <1.0
Effect Size 0.19 0.35 0.34 -0.40 0.21F fp) < 1 (ns) 2.87 (ns) 2.72 (tisk 3.76 ( < .07) 1.04 (ns)
21 22
Smoot 0
Abbottston Score (SD) 6.53 (4.37) 4.13 (4.88) 20.98 (6.12) 7.37 (4.66) 497.27 (94.27) 350.87 (91.30) 1.93 'n=52 GE 2.00 1 60 1.80 2.30 1.60 <1 1.86
0.70Control Score (SD) 4.44 (3.50) 2.48 (3.75) 16.62 (5.36) 2.52 (4.07) 471.08 (88.6C) 351.87 (67.99) 1.40 0.66 "
n=52 GE 1.60 1 30 1.40 1.50 1.50 <1 1.46Effect Size 0.60 0.44 0.81 1.19 0.30 -0.01
F 14.85 < .00 6 63 < .01 26 25 < .00 38 01 < .00 7.95 (< D1City Springs Score (SD) 4.2b (3.59) 3.09 (3.80) 16.14 (5.64) 4.11 (3.66) 423.70 (114.10) 326.52 (76.82) 1.60
n=56 GE 1.60 1 40 1.40 2.00 1.30 <1 1 54
0.41Control `kore (SD) 3 05 (2.99) 1 71 (3.65) 14.90 (4 88) 2 02 (3 04) 457 11 (8t. 40) 328 52 (74.26) 1 35 0.25
n -St. GE 1 AO 1 20 1.30 1 50 1.40 <1 1 36Ellect Size 0 40 0.38 0.23 0.61 -0.37 -0.03
F (p) 3 13 (< 08) 3 45 (< .07) 2 22 (ns) 12 73 (< 00) 2 79 (< 10)Dallas F. Nicholas Score (SD) 5.44 (3.64) 3.17 (3 10) 18 93 (5 90) 4 25 (3.48) 494 58 (103 541 378.26 (63.78) 1.70 '
n=31 GE 'I 80 1.40 1 60 2.00 1.60 <1 1 680 36
Control Score (SD) 4 35 (3.19) 2.87 (4 28) 16.26 (5 16) 2.68 (3 26) 471 16 (89.47) 382.13 (64.62) 1 48 0.33n=31 GE 1 60 1 40 1.40 1.50 1.50 <1 1 48
Effect Size 0 33 0.09 0 52 0.48 0.23 -0.06F (13) 2 26 (ns) <1 (ns) 5 98 (< 02) 4 02 (< 05) 1 48 (nS)
Chapter 1 Score (SD) 4.69 (3 94) 3 77 (3 95) 18.75 (5 86) 5 05 (4.54) 470.24 (105.92) 356.90 (72.22) 1.73n=128 GE 1 70 1 60 1 60 2 00 1.50 <1 1 68
0 12Control Score (SD) 4 89 (4 03) 3 50 (4 64) 17 46 (6 58) 3.77 (4.94) 485.13 (107.52) 358 29 (75 07) 1 65 0.06n=128 GE 1 70 1 50 1 50 1.90 1.60 <1 1 64
Effect Size -0 05 0 06 0 20 0.26 -0.14 -0.02F (p) <1 (ns) <1 (ns) 5 97 (< 02) 5 81 (< 02) 1 93 (ns)
Curriculum Only Score (SD) 6 73 (3 97) 5 37 (4.15) 22.02 (6.17) 8 37 (5.39) 539.95 (81.37) 383.64 (72.29) 2.08n=56 GE 2 10 1 80 2 01 2 40 1.90 <1 2.04
0 23Conirol Score (50) 6 57 (4 08) 5 07 (4 92) 20.64 (6.44) 5 20 (5.10) 508.62 (107 02) 377.68 (64.92) 1.89 0.24
n=56 GE 2 01 1 75 1 80 2.01 1.70 <1 1 85Effect Size 0 04 0 06 0 21 0.62 0.29 0.09
F <1 ns <1 ns) <1 ns 9 17 < .00 2 02 ns
DO = Durrell Oral Reading ScaleDS = Durrell Silent Reading ScaleLW = Letter/Word Reading Scale of the Woodcock Language Prof.uency BatteryWA = Word Attack Scale of the Woodcock Language Proficiency BatteryCAT = CAT Total Reading
23
Av GE = Average Grade Equivalent across all testsAv ES = Average Effect Size* = Average of individual administered tests only
= Average of individual administered tests and CAT
24

Table 4: Grade 1 Assessment Results Lowest 25%
School DO DS LW WA CAT PRE Av GE Av ES
Abbottstonn=13
Controln=13
Score (SD)GE
Score (SD)
GE
Effect SizeF
5.46 (2.96)1.80
2.31 (1.6)1.301.97
11.86 < .00
4.46 (4.31)1.70
.61 (2.22)
1.001.73
7.80 < .01
18.38 (4.25)1.60
12.31 (3.86)1.201.57
15.20 < .00
6.50 (3.58)2.20
.85 (1.34)1.304.22
26.79 < 00
459.00 (67.56)1.40
411.15 (85.18)1.200.56
2.49 ns
258.46 (24.07)<1
255.38 (26.26)<1
0.12
1.83 *1.74
1.201.20
1
2.372.01 '
City Springsn=14
Score (SD)GE
2.86 (1.88)1.40
.57 (1 22)1.00
11.36 (4.96)1.10
2.07 (2.13)1 c
324.15 (88.46)0.80
259.71 (24.89)<1
1.251.16
0.55
Control Score (SD) 1 08(1.55) 00 (.00) 11.00 (4.57) 1 00 (2.08) 402.85 (87.07) 260.64 (42.68) 1.10 0.26 ' '
n= 1 4 GE 1.00 1.00 1.10 1.30 1.20 <1 1.12 '
Effect Size 1.14 0.47 0.08 0.51 -0.90 0.02
F (p) 7 18 (<.01) 3.12 (<.09) <1 (ns) 1 74 (ns) 5.74 (<.02)
Chapter 1 Score (SD) 2.10 (3.08) .83 (1.79) 13.97 (5.77) 2.83 (2.94) 372.84 (99.37) 261.12 (54.52) 1.30 '
n=32 GE 1.30 1.00 1.30 1.60 1.00 <1 1.24 '0.28 '
Control Score (SD) 2.09 (2.97) .77 (2.04) 11.91 (5.72) 1.00 (2.40) 405.91 (100.00) 263.94 (65.72) 1.18 0.16 '
n=32 GE 1.30 1.00 1.10 1.30 1.20 <1 1.18 'Effect Size 0.00 0.00 0.36 0.76 -0.33 0.04
F (p) <1 (ns) <1 (ns) 4.93 (< 03) 8 82 (<.00) 2.46 (ns)
Curriculum Only Score (SD) 4.29 (3.22) 4.21 (3.64) 18.57 (5.00) 6.57 (4.60) 490.93 (83.70) 306.93 (40.14) 1 75 '
n=14 GE 1 60 1.60 1.60 2.20 1.60 <1 1 721 27
Control Score (SD) 3.71 (3.41) 2.00 (3,30) 15.71 (3.89) 1.35 (1.50) 401.29 (86.61) 283.22 (46.60) 1.40 1.22
n=14 CE 1.60 1,30 1.40 1.30 1.20 <1 1.36 "Effect Size 0.17 0,67 0.74 3.48 1.03 0.57
F (p) <1 (ns) _2.60 (ns) 1.26 (ns) 12 39 (< 30) 5.01 (< 03)
DO = Durrell Oral Reading ScaleDS = Durrell Silent Reading ScaleLW = Letter/Word Reading Scale of the Woodcock Language Proficiency BatteryWA = Word Attack Scale of the Woodcock Language Proficiency pattpryta.1.7 zt"
Av GE = Average Grade Equivalent across all testsAv ES = Average Effect Size
= Average of individual administered tests only' 'sr Average, .0,1 inglyidual adrajnisterqd ,tes:ts, and ._CAT
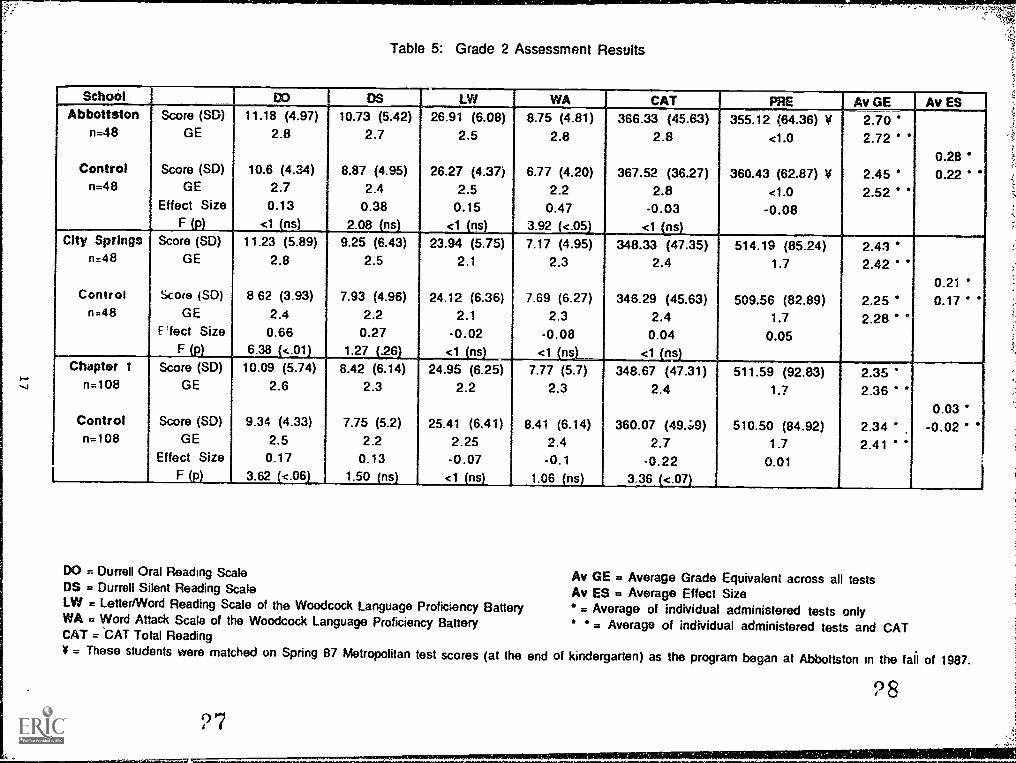
Table 5: Grade 2 Assessment Results
School DO DS LW WA CAT PRE Ay GE Ay ESAbbottston Score (SD) 11.18 (4.97) 10.73 (5.42) 26.91 (6.08) 8.75 (4.81) 366.33 (45.63) 355.12 (64.36) V 2.70
n=48 GE 2.8 2.7 2.5 2.8 2.8 <1.0 2.720.28
Control Score (SD) 10.6 (4.34) 8.87 (4.95) 26.27 (4.37) 6.77 (4.20) 367.52 (36.27) 360.43 (62.87) V 2.45 0.22n=48 GE 2.7 2.4 2.5 2.2 2.8 <1.0 2.52
Effect Size 0.13 0.38 0.15 0.47 -0.03 -0.08F (p) <1 (ns)____ 2.08 (ns) <1 (ns) 3.92 <.051 <1 (ns)
City Springs Score (SD) 11.23 (5.89) 9.25 (6.43) 23.94 (5.75) 7.17 (4.95) 348.33 (47.35) 514.19 (85.24) 2.43n=48 GE 2.8 2.5 2.1 2.3 2.4 1.7 2.42
0.21Control Scoce (SD) 8 62 (3.93) 7.93 (4.96) 24.12 (6.36) 7.69 (6.27) 346.29 (45.63) 509.56 (82.89) 2.25 0.17
n=48 GE 2.4 2.2 2.1 2.3 2.4 1.7 2.28Effect Size 0.66 0.27 -0.02 -0.08 0.04 0.05
F 6.38 4..01 1.27 .26 <1 ns <1 ns <1 nsChapter 1 Score (SD) 10.09 (5.74) 8.42 (6.14) 24.95 (6.25) 7.77 (5.7) 348.67 (47.31) 511.59 (92.83) 2.35 '
n=108 GE 2.6 2.3 2.2 2.3 2.4 1.7 2.360.03 *
Control Score (SD) 9.34 (4.33) 7.75 (5.2) 25.41 (6.41) 8.41 (6.14) 360.07 (49.3.9) 510.50 (84.92) 2.34 -0.02n=108 GE 2.5 2.2 2.25 2.4 2.7 1.7 2.41
Effect Size 0.17 0.13 -0.07 - 0. 1 -0.22 0.01F (p) 3.62 (<.061_ 1.50 (ns) <1 (ns) 1.06 (ns) 3.36 (<.07)
DO = Durrell Oral Reading ScaleDS = Durrell Silent Reading ScaleLW = Letter/Word Reading Scale of the Woodcock Language Proficiency BatteryWA = Word Attack Scale of the Woodcock Language Proficiency BatteryCAT = 'CAT Total ReadingV = These students were matched on Spring 87 Metropolitan test scores (at the end of kindergarten) as the program began at Abbottston in the fall of 1987.
Av GE = Average Grade Equivalent across all testsAv ES = Average Effect Size
= Average of individual administered tests only= Average of individual administered tests and CAT
7 8

OD
Tabie 6: Grade 2 Assessment Lowest 25%
School D3 DS LW WA CAT PRE Av GE Ay ES
Abbottston Score (SD) 10.00 (6.82) 10.00 (8.04) 24.53 (7.41) 7.27 (4.76) 347.30 (53.46) 298.78 (67.78) V 2.43
n=11 GE 2.60 2.60 2.20 2.30 2.40 <1.0 2.420.71
Control Score (SD) 8.36 (3.17) 4.64 (4.25) 23.27 (3.32) 4.45 (4.27) 344.27 (27.01) 296.73 (51.24) V 2.05 0.59
n=11 GE 2.40 1.70 2.10 2.00 2.40 <1.0 2.12
Effect Size 0.52 1.26 0.39 0.66 0.11 0.04
F <1 ns 3.96 <.07 <1 ns <1 ns <1(22)_____
City Springs Score (SD) 7.86 (7.29) 6.86 (7.55) 20.57 (5.76) 5.57 (5.54) 318.14 (46.90) 415.21 (34.75) 2.03
n=14 GE 2.20 2.00 1.80 2.10 1.80 1.20 1.98 '0.38
Controt Score (SO) 5.5 (3.74) 4.64 (4.18) 19.21 (6.41) 4.50 (6.66) 309.21 (45.57) 408.14 (44.80) 1.78 0.35
n=14 GE 1.80 1.70 1.60 2.00 1.70 1.20 1.76
Effect Size 0.63 0.53 0.21 0.16 0.20
F(p) <1 (ns) <1 ns <1 ns <1 ns <1 ns
Chapter 1 Score (SD) 5.64 (3.36) 4.93 (4.11) 19.68 (4.56) 3.71 (2.24) 310.57 (39.09) 404.23 (72.42) 1.75
n=31 GE 1 80 1.70 1.60 1.90 1.80 1.20 1.760.27
Control Score (SD) 5.28 (3.15) 2.75 (3.43) 19.10 (4.87) 3.07 (2.99) 309.03 (42.58) 414.90 (61.47) 1.63 0.22
n=31 GE 1.80 1.30 1.60 1.80 1.70 1.20 1.64
Effect Size 0.11 0.64 0.12 0.21 0.04
F(p) <1 ns 6.81 <.01 1.09 ns 1.64 ns <1 ns
DO = Durrell OW Reading ScaleDS = Durrell Silent Reading ScaleLW = Letter/Word Reading Scale of the Woodcock Language Proficiency Battery
WA = Word Attack Scale of the Woodcock Langt..:..ge Proficiency Battery
Av GE = Average Grade Equivalent across all testsAv ES = Average Effect Size
= Average of individuat administered tests only* = Average of individual administered tests and CAT
CAT = CAT Total ReadingV = These students were matched on Spring 87 Metropolitan test scores (at the end of kindergarten) as the program began at Abbottstcn in the fall of 1987.
29 30
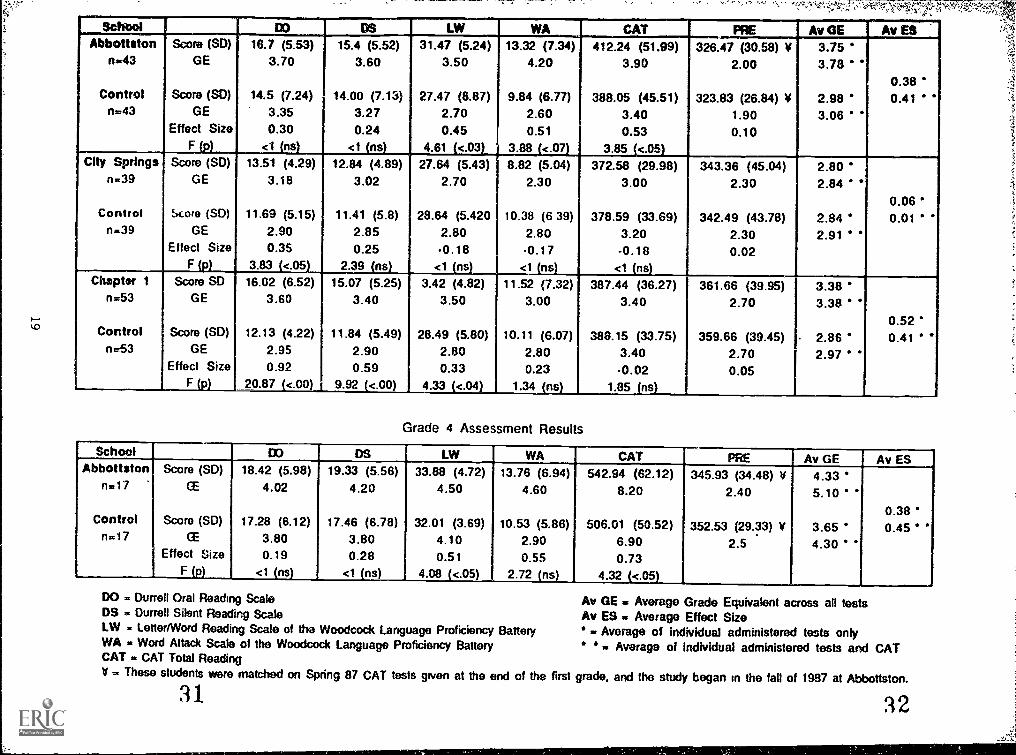
Sett 1701 DO DS LW WA ssir. PRE Av GE Ay ESAbbottiton Score (SD) 16.7 (5.53) 15.4 (5.52) 31.47 (5.24) 13.32 (7.34) 412.24 (51.99) 326.47 (30.58) V 3.75
n=43 GE 3.70 3.60 3.50 4.20 3.90 2.00 3.78 '0.38 '
Control Score (SD) 14,5 (7.24) ' 14.00 (7.13) 27.47 (8.87) 9.84 (6.77) 388.05 (45.51) 323.83 (26.84) V 2.98 0.41n=43 GE 3.35 3.27 2.70 2.60 3.40 1.90 3.06
Effect Size 0.30 0.24 0.45 0.51 0.53 0.10F <1 ns <1 ns 4.61 <.03 3.88 <.07 3.85 <.05
City Springs Score (SD) 13.51 (4.29) 12.84 (4.89) 27.64 (5.43) 8.82 (5.04) 372.58 (29.98) 343.36 (45.04) 2.80n.39 GE 3.18 3.02 2.70 2.30 3.00 2.30 2.84
0.06Control Score (SD) 11.69 (5.15) 11.41 (5.8) 28.64 (5.420 10.38 (6 39) 378.59 (33.69) 342.49 (43.78) 2.84 0.01
n=39 GE 2.90 2.85 2.80 2.80 3.20 2.30 2.91Effect Size 0.35 0.25 -0.18 -0.17 -0.18 0.02
F (p) 3.83 (<.05) 2.39 (ns) <1 (ns) <1 (ns) <1 (ns)Chapter 1 Score SD 16.02 (6.52) 15.07 (5.25) 3.42 (4.82) 11.52 (7.32) 387.44 (36.27) 361.66 (39.95) 3.38
n=53 GE 3.60 3.40 3.50 3.00 3.40 2.70 3.380.52
Control Score (SD) 12.13 (4.22) 11.84 (5.49) 28.49 (5.80) 10.11 (6.07) 388.15 (33.75) 359.66 (39.45) . 2.86 0.41n=53 GE 2.95 2.90 2.80 2.80 3.40 2.70 2.97
Effect Size 0.92 0.59 0.33 0.23 -0.02 0.05F (p) 20.87 (<.00) j 9.92 (<.00) 4.33 (<.04) 1.34 (ns) 1.85 (ns)
Grade 4 Assessment Results
School DO DS LW WA T CAT PRE Av GE Av ESAbbottston Score (SD) 18.42 (5.98) 19.33 (5.56) 33.88 (4.72) 13.76 (6.94) 542.94 (62.12) 345.93 (34.48) V 4.33 *
n=17 CE 4.02 4.20 4.50 4.60 8.20 2.40 5.10 "0.38
Control Score (SD) 17.28 (6.12) 17.46 (6.78) 32.01 (3.69) 10.53 (5.86) 506.01 (50.52) 352.53 (29.33) V 3.65 0.45n=17 CE 3.80 3.80 4.10 2.90 6.90 2.5 4.30
Effect Size 0.19 0.28 0.51 0.55 0.73F (p) <1 (ns) <1 (ns) 4.08 _(<.05) 2,72 (ns) 4.32 (<.05)
DO Durrell Oral Reading ScaleDS = Durrell Silent Reading ScaleLW - Letter/Word Reading Scale of the Woodcock Language Proficiency BatteryWA = Word Attack Scale of the Woodcock Language Proficiency BatteryCAT CAT Total ReadingV = These students were matched on Spring 87 CAT tests given at the end of the
31
Av GE - Average Grade Equivalent across an testsAv ES Average Effect Size
= Average of individual administered tests only° = Average of individual administered tests and CAT
first grade, and the study began in the fall of 1987 at Abbottston.
32

Taole 8: Grade 3 Assessment - Lowest 25%
School DO DS LW WA CAT PRE Av GE Av ES
Abhottston Score (SD) 12.30 (3.89) 11.50 (3.87) 25.82 (3.16) 7.18(5.22) 361.18 (43.39 297.11 (15.92) V 2.60
n=11 GE 3.00 2.80 2.30 2.30 2.70 1.60 2.62 °
1.29
Control Score (SD) 6.64 (3.04) 8.0 (4.58) 16.55 (8.45 3.45 (2.62) 343.50 (23.75) 295 90 (20.02) V 1.90 1.18 'n=11 GE 2.00 2.30 1.40 1.90 2.30 1.60 1.98 '
Effect Size 1.86 0.76 1.10 1.42 0.74 0.06
F (p) 10 54 (<.00) , 1.33 ns 7.07 <.02 2.12 ns <1 ns
City Springs Score (SD) 10.18 (3.16) 9.18 (4.17) 24.27 (5.62) 5.09 (4.70) 346.18 (26.21) 294.91 (25.01) 2.30
n.11 GE 2.60 2.40 2.10 2.10 2.40 1.61 2.32-0.13
Control tx_wo (SD) 10.00 (3.85) 9.18 (4.38) 24.91 (5.09) 7.09 (4.46) 374.91 (25.52) 295.36 (19.24) 2.38 -0.33 "
n=i i GE 2.60 2.40 2.20 2.30 3.10 1.60 2.52 °
Effect Size 0.05 0.00 -0.13 -0.43 -1.13 -0.02
F (p) <1 (ns) <1 ns <1 ns 1.31 tisl 5.72 i sgiChapter 1 Score SD 12.00 (3.86) 13.06 (4.19) 28.00 (3.38) 7.53 (5.20) 379.75 (37.41) 330.84 (16.73) 2.78
n.19 GE 2.90 3.10 2.80 2.30 3.20 2.10 2.86 '0.62 *
Control Score (SD) 9.83 (307) 8.83 (3.47) 26.11 (5.38) 8.53 (5.27) 379.17 (18.10) 328.37 (26.40) 2.43 0.50
n.19 GE 2.50 2.30 2.50 2.40 3.20 2.00 2.58
Effect Size 0.71 1.22 0.35 0.18 0.03 0.09
F (p) 3 27 (< 08) 10 16 (<00) 1 53 (ns) <1 (ns) <1 (ns)
DO = Durrell Oral Reading ScaleDS = Durrell Silent Reading ScaleLW = Letter/Word Reading Scale of the Woodcock Language Proficiency Battery
WA = Word Attack Scale of the Woodcock Language Proficiency Battery
CAT = CAT Total ReadingV = These students were matched on Spnng 87 CAT tests given at the end of the first grade, and the study began in the fall of 1987 at Abbott"ston
Av GE u Average Grade Equivalent across all testsAv ES = Average Effect Size
= Average cs :ndividual administered tests only= Average of Individual administered tests and CAT
34

GRADE EQUIVALENTS
2.20
2 00
1.80
1.60
1.40
1.20
1 .00
F ig u re 1
COMPARISON OF SUCCESS FOR ALL AND COMPARISON SCHOOLSOH INDWIDUAL READING ASSESSMENTS, FIRST GRADE
5
ALL Lon ALL WW ALL25% 25% DALLAS
ABBOTTSTON CITY SPRINGS NICHOLAS(2 Years) (1 Year) (1.5 Years)
ALL LOW25%
CHAPTER 1ONLY (.75 Years)
LOW25%
CURRICUWMONLY (1.5 Years)
SAMPLE SIZE INADEQUATE TOCOMPUTE LOW 25%
S.F.&
Control
3 6
GRADE EQUIVALENTS
2.80
2.60
2 4 0
2.20
2.00
1.80
1.60
1.40
1 .20
1 .00
Figure 2
COMPARISON OF SUCCESS FOR ALL AND COMPARISON SCHOOLSON INDIVIDUAL READING ASSESSMENTS, SECOND GRADE
ALL LOW 25%
ABBOTTSTON(2 Years)
ALL LOW 25%
CITY SPRINGS(1 Year)
ALL LOW 25%
CHAPTER 1 ONLY(.75 Years)
Control
3 8

GRADE EQUIVALENTS
4.00 -1----ES=+.38
3 SO
3.00
2.50
2.00
1 .50
1.00
39
Figure 3
COMPARISON OF SUCCESS FOR ALL AND COMPARISON SCHOOLSON INDIVIDUAL READING ASSESSMENTS, THIRD GRADE
ALL LOW 25%
ABBOTTSTON(2 Years)
ALL LOW 25% ALL LOW 25%
CITY SPRINGS(1 Year)
CHAPTER 1 ONtY(.75 Yews)
40
S.FA
Control
71: