issues to address - Çankaya Üniversitesimse125.cankaya.edu.tr/uploads/files/mse 125_chapter...
TRANSCRIPT
Chapter 9 - 1
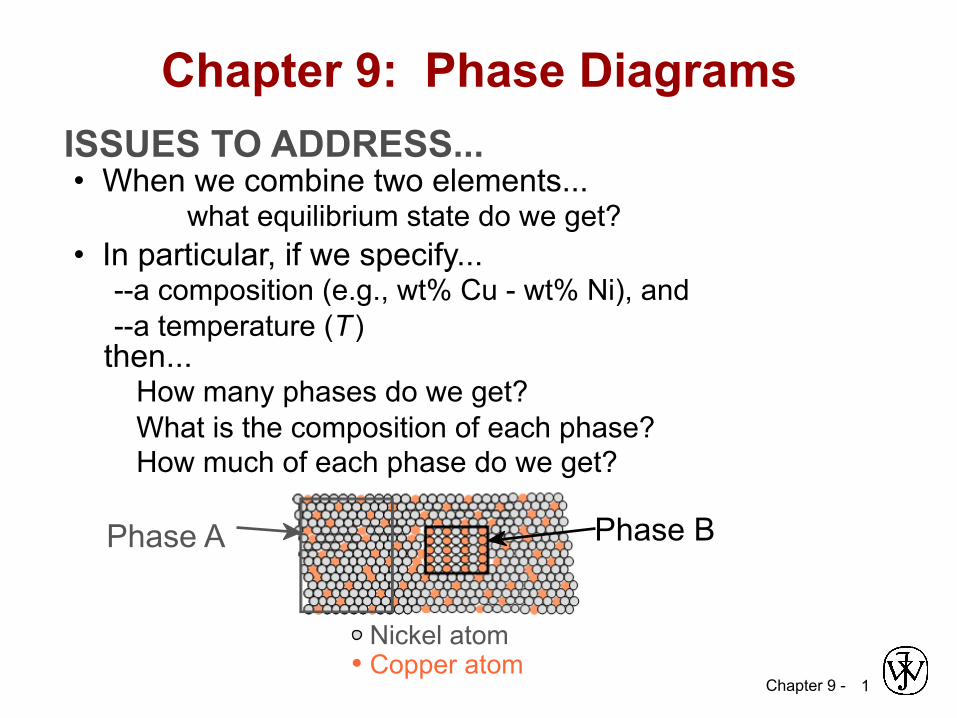
ISSUES TO ADDRESS... • When we combine two elements... what equilibrium state do we get? • In particular, if we specify... --a composition (e.g., wt% Cu - wt% Ni), and --a temperature (T )
then... How many phases do we get? What is the composition of each phase? How much of each phase do we get?
Chapter 9: Phase Diagrams
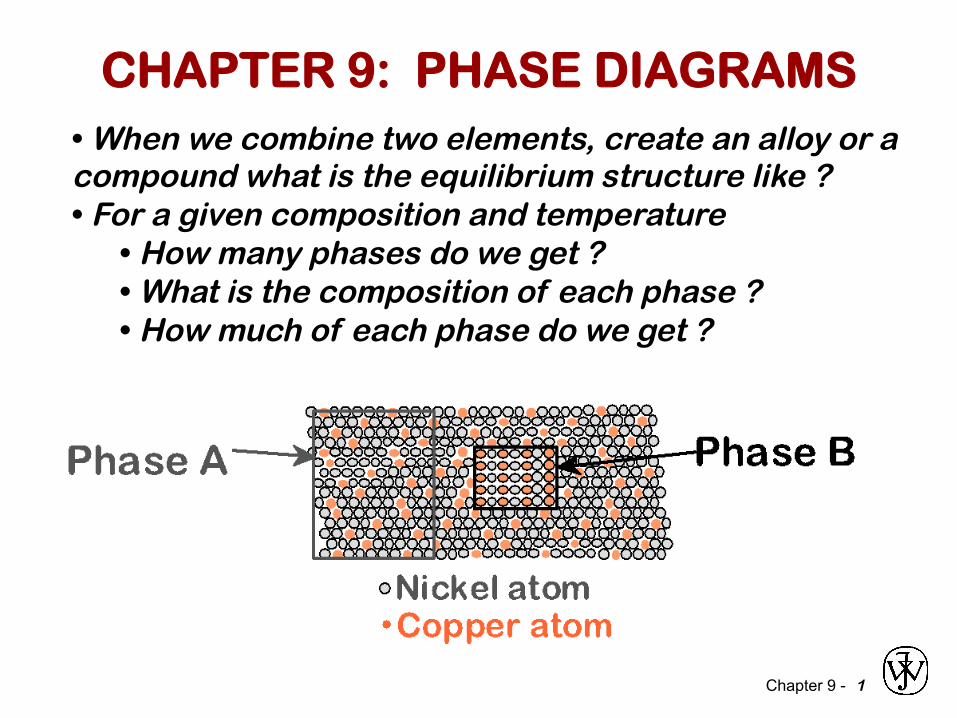
Phase B Phase A
Nickel atom Copper atom

Chapter 9 - 2
Assist. Prof. Dr. İlkay KALAY
Phase Diagrams
Phase diagrams display the state of a substance at various pressures and temperatures and the places where equilibria exist between phases.
Chapter 9 - 3
Assist. Prof. Dr. İlkay KALAY
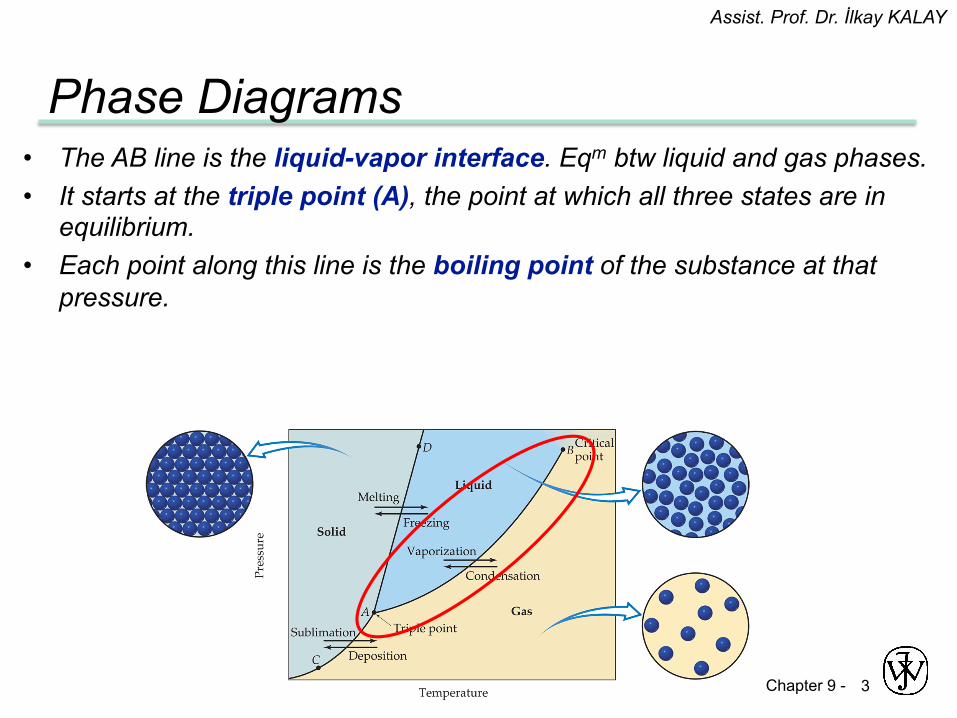
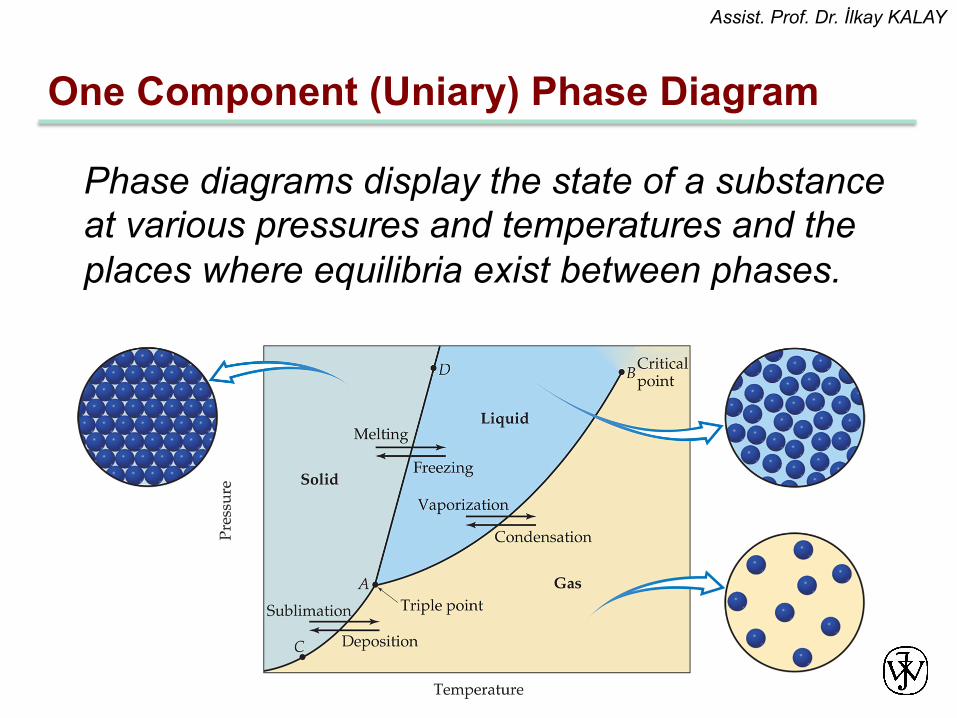
Phase Diagrams • The AB line is the liquid-vapor interface. Eqm btw liquid and gas phases. • It starts at the triple point (A), the point at which all three states are in
equilibrium. • Each point along this line is the boiling point of the substance at that
pressure.

Chapter 9 - 4
Assist. Prof. Dr. İlkay KALAY
Phase Diagrams • The AD line is the interface between liquid and solid. • An increase in pressure usually favors the more compact solid
phase, thus, higher temperatures are required to melt the solid at higher pressures.
• The melting point at each pressure can be found along this line.
Chapter 9 - 5
Assist. Prof. Dr. İlkay KALAY
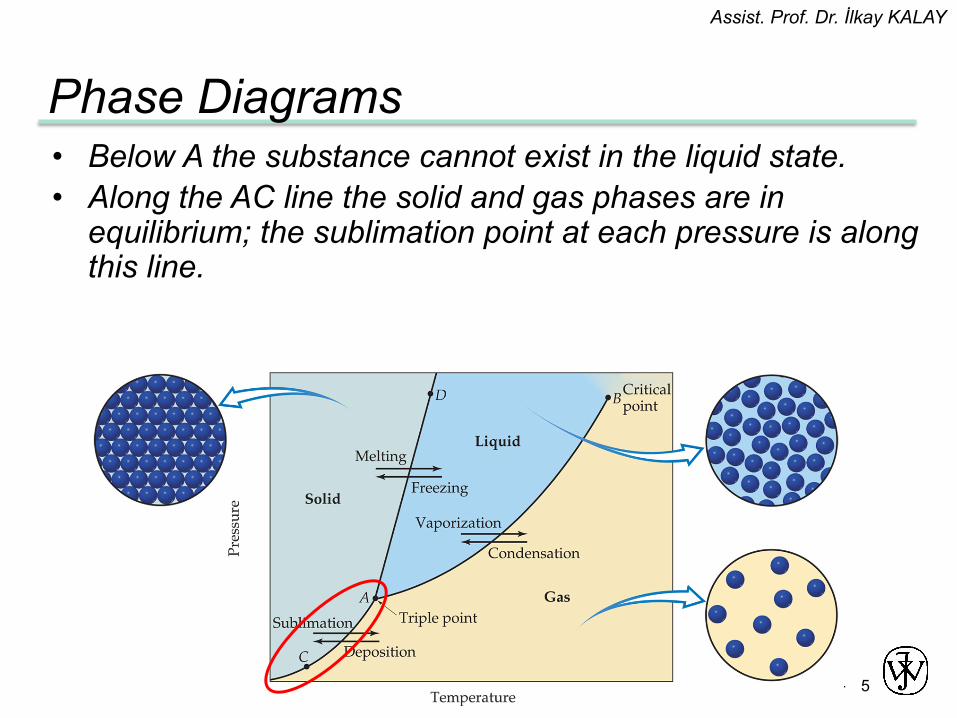
Phase Diagrams • Below A the substance cannot exist in the liquid state. • Along the AC line the solid and gas phases are in
equilibrium; the sublimation point at each pressure is along this line.
Chapter 9 - 6
Phase Equilibria: Solubility Limit Introduction
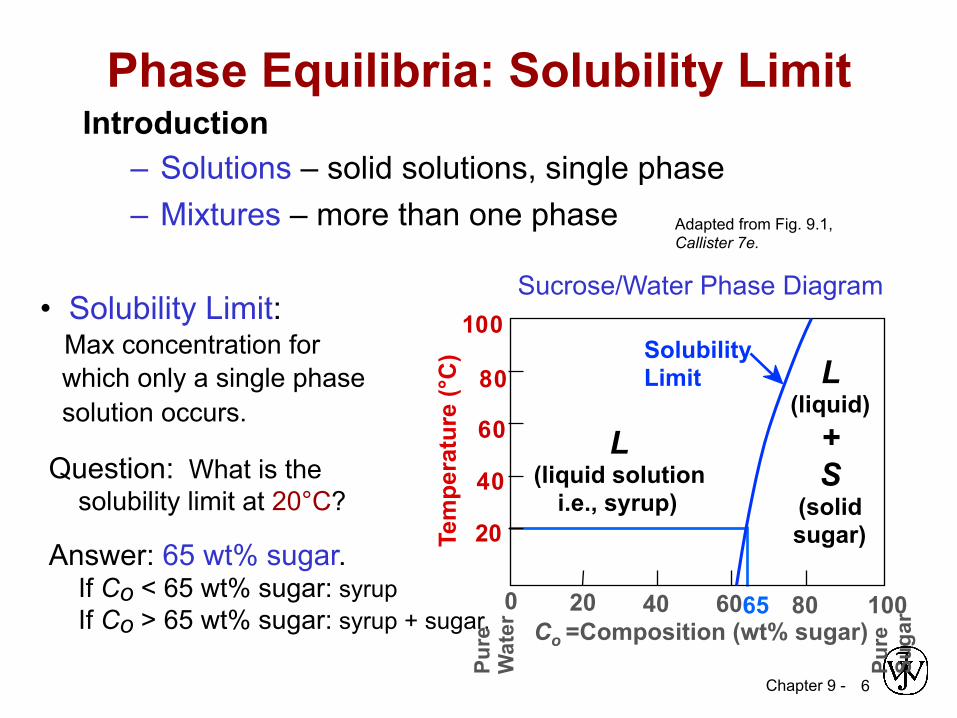
– Solutions – solid solutions, single phase – Mixtures – more than one phase
• Solubility Limit: Max concentration for which only a single phase solution occurs.
Question: What is the solubility limit at 20°C?
Answer: 65 wt% sugar. If Co < 65 wt% sugar: syrup If Co > 65 wt% sugar: syrup + sugar. 65
Sucrose/Water Phase Diagram
Pure
Su
gar
Tem
pera
ture
(°C
)
0 20 40 60 80 100 Co =Composition (wt% sugar)
L (liquid solution
i.e., syrup)
Solubility Limit L
(liquid) + S
(solid sugar) 20
4 0 6 0 8 0
10 0
Pure
W
ater
Adapted from Fig. 9.1, Callister 7e.

Chapter 9 - 7
• Components: The elements or compounds which are present in the mixture (e.g., Al and Cu) • Phases: The physically and chemically distinct material regions that result (e.g., α and β).
Aluminum- Copper Alloy
Components and Phases
α (darker phase)
β (lighter phase)
Adapted from chapter-opening photograph, Chapter 9, Callister 3e.

Chapter 9 -
Nomenclature / Definitions / Basic Concepts (III)
• A system is at equilibrium if at constant temperature, pressure and composition the system is chemically and structurally stable, not changing with time.
• Equilibrium is the state that is achieved given sufficient time. But sometimes it will take too much time to achieve equilibrium due the kinetics. This is called a meta-stable state.
• In thermodynamics the equilibrium is described as the state of system that corresponds to the minimum of thermodynamic function called the free energy. – Thermodynamics tells us that
• under conditions of a constant temperature and pressure and composition, the direction of any spontaneous change is toward a lower free energy.
• the state of stable thermodynamic equilibrium is the one with minimum free energy.
• a system at a metastable state is trapped in a local minimum of free energy that is not the global one.

Chapter 9 -
Free
Ene
rgy
Metastable
Stable
Unstable
Chapter 9 - 10
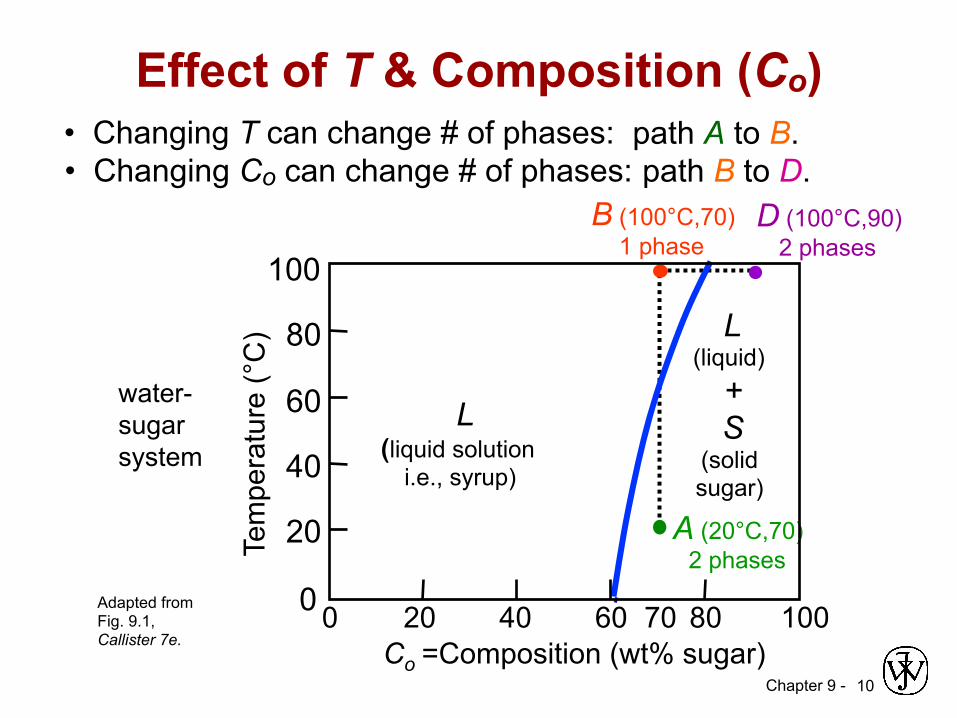
Effect of T & Composition (Co) • Changing T can change # of phases:
Adapted from Fig. 9.1, Callister 7e.
D (100°C,90) 2 phases
B (100°C,70) 1 phase
path A to B. • Changing Co can change # of phases: path B to D.
A (20°C,70) 2 phases
70 80 100 60 40 20 0
Tem
pera
ture
(°C
)
Co =Composition (wt% sugar)
L ( liquid solution
i.e., syrup)
20
100
40
60
80
0
L (liquid)
+ S
(solid sugar)
water- sugar system
Chapter 9 - 11
Assist. Prof. Dr. İlkay KALAY
One Component (Uniary) Phase Diagram
Phase diagrams display the state of a substance at various pressures and temperatures and the places where equilibria exist between phases.
Chapter 9 - 12
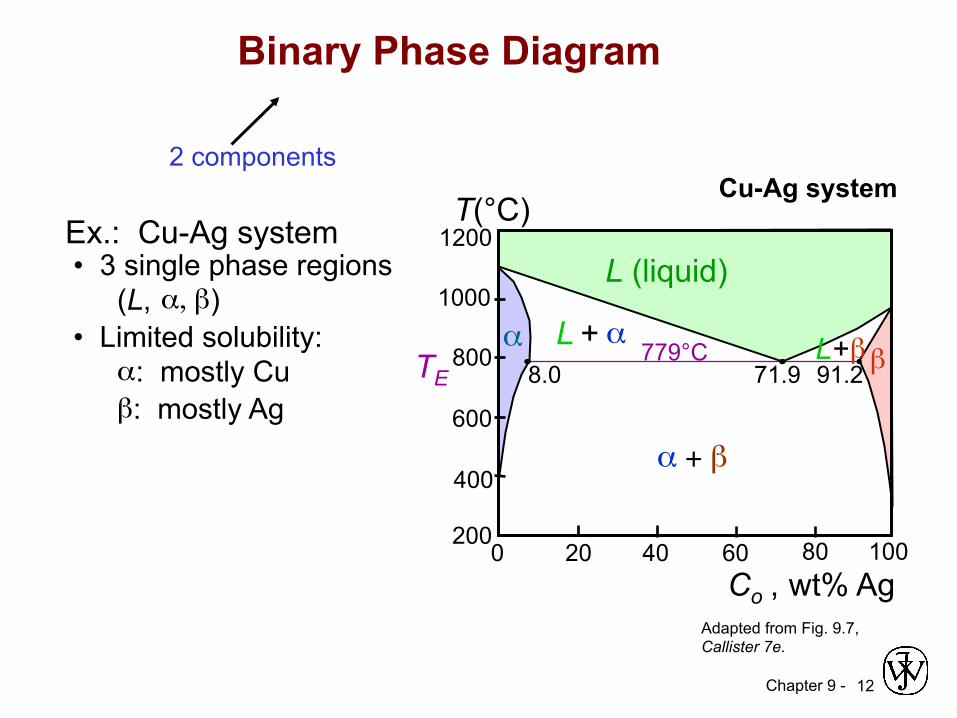
2 components
Adapted from Fig. 9.7, Callister 7e.
• 3 single phase regions (L, α, β ) • Limited solubility: α : mostly Cu β : mostly Ag
Ex.: Cu-Ag system Cu-Ag system
L (liquid)
α L + α L + β β
α + β
Co , wt% Ag 20 40 60 80 100 0 200
1200 T(°C)
400
600
800
1000
TE 8.0 71.9 91.2 779°C
Binary Phase Diagram
Chapter 9 - 13
Phase Equilibria
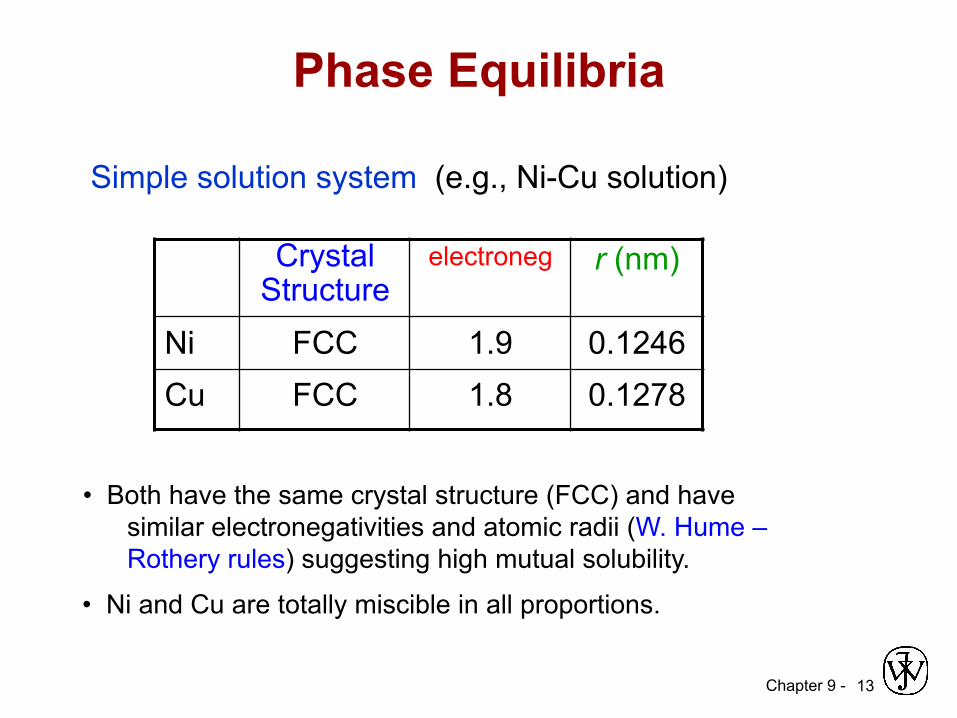
Crystal Structure
electroneg r (nm)
Ni FCC 1.9 0.1246 Cu FCC 1.8 0.1278
• Both have the same crystal structure (FCC) and have similar electronegativities and atomic radii (W. Hume – Rothery rules) suggesting high mutual solubility.
Simple solution system (e.g., Ni-Cu solution)
• Ni and Cu are totally miscible in all proportions.
Chapter 9 -
• When we combine two elements, create an alloy or a compound what is the equilibrium structure like ? • For a given composition and temperature
• How many phases do we get ? • What is the composition of each phase ? • How much of each phase do we get ?
1
CHAPTER 9: PHASE DIAGRAMS

Chapter 9 - 15
Phase Diagrams • Indicate phases as function of T, Co, and P. • For this course: -binary systems: just 2 components. -independent variables: T and Co (P = 1 atm is almost always used).
• Phase Diagram for Cu-Ni system
Adapted from Fig. 9.3(a), Callister 7e. (Fig. 9.3(a) is adapted from Phase Diagrams of Binary Nickel Alloys, P. Nash (Ed.), ASM International, Materials Park, OH (1991).
• 2 phases: L (liquid) α (FCC solid solution)
• 3 phase fields: L L + α α
wt% Ni 20 40 60 80 100 0 1000
1100
1200
1300
1400
1500
1600 T(°C)
L (liquid)
α (FCC solid solution)
Chapter 9 -
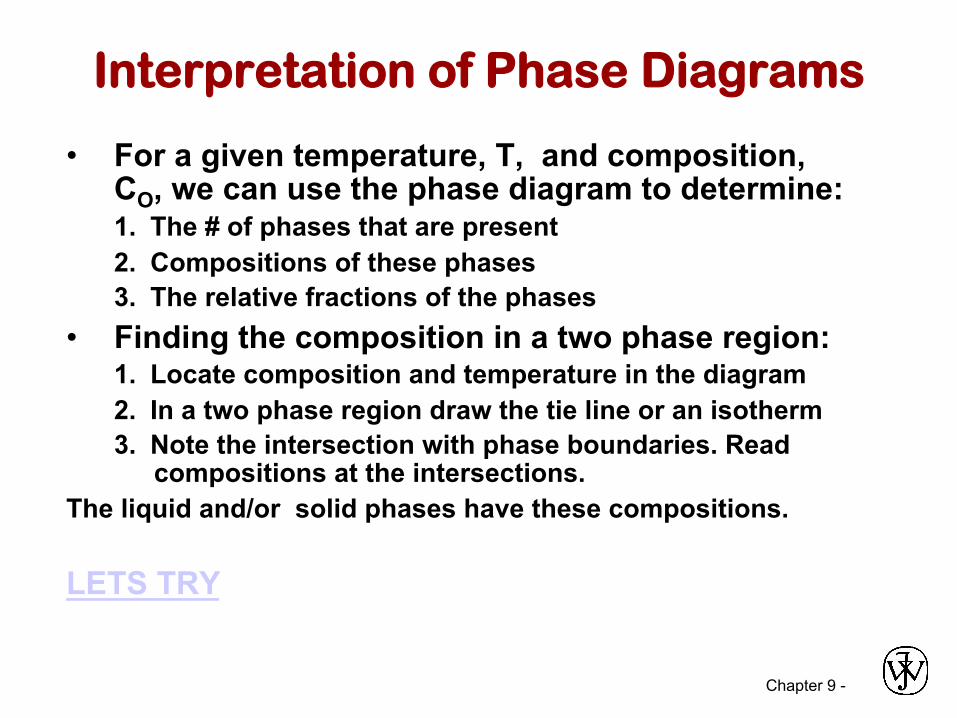
Interpretation of Phase Diagrams
• For a given temperature, T, and composition, CO, we can use the phase diagram to determine: 1. The # of phases that are present 2. Compositions of these phases 3. The relative fractions of the phases
• Finding the composition in a two phase region: 1. Locate composition and temperature in the diagram 2. In a two phase region draw the tie line or an isotherm 3. Note the intersection with phase boundaries. Read
compositions at the intersections. The liquid and/or solid phases have these compositions. LETS TRY
Chapter 9 - 17
wt% Ni 20 40 60 80 100 0 1000
1100
1200
1300
1400
1500
1600 T(°C)
L (liquid)
α (FCC solid solution)
Cu-Ni phase
diagram
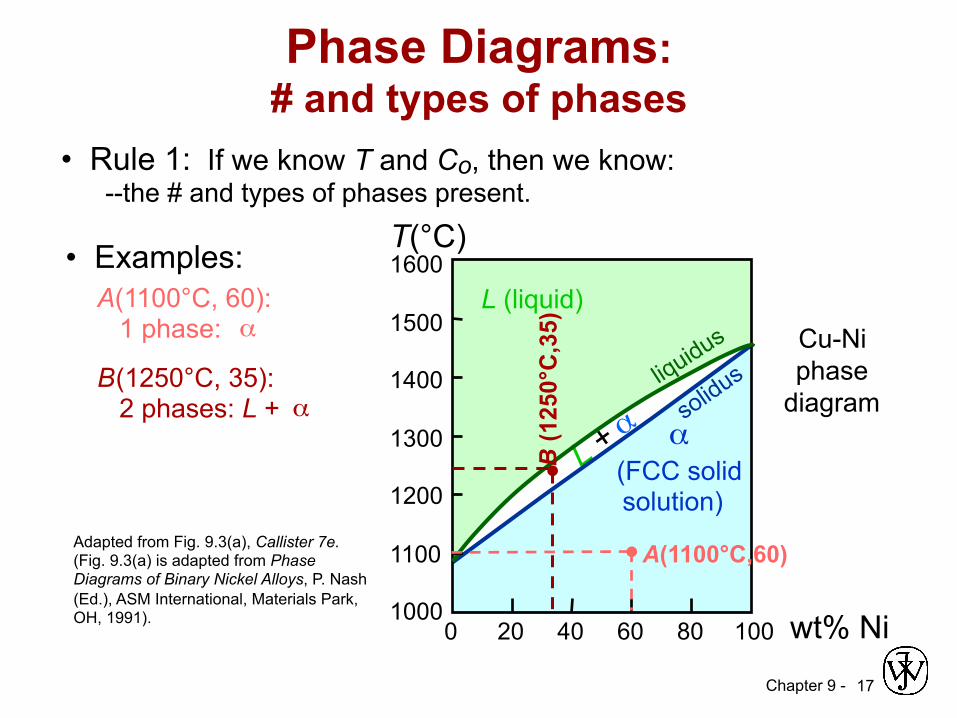
Phase Diagrams: # and types of phases
• Rule 1: If we know T and Co, then we know: --the # and types of phases present.
• Examples: A(1100°C, 60): 1 phase: α B (1250°C, 35): 2 phases: L + α
Adapted from Fig. 9.3(a), Callister 7e. (Fig. 9.3(a) is adapted from Phase Diagrams of Binary Nickel Alloys, P. Nash (Ed.), ASM International, Materials Park, OH, 1991).
B (1
250°
C,3
5)
A(1100°C,60)
Chapter 9 - 18
wt% Ni 20
1200
1300
T(°C)
L (liquid)
α (solid)
30 40 50
Cu-Ni system
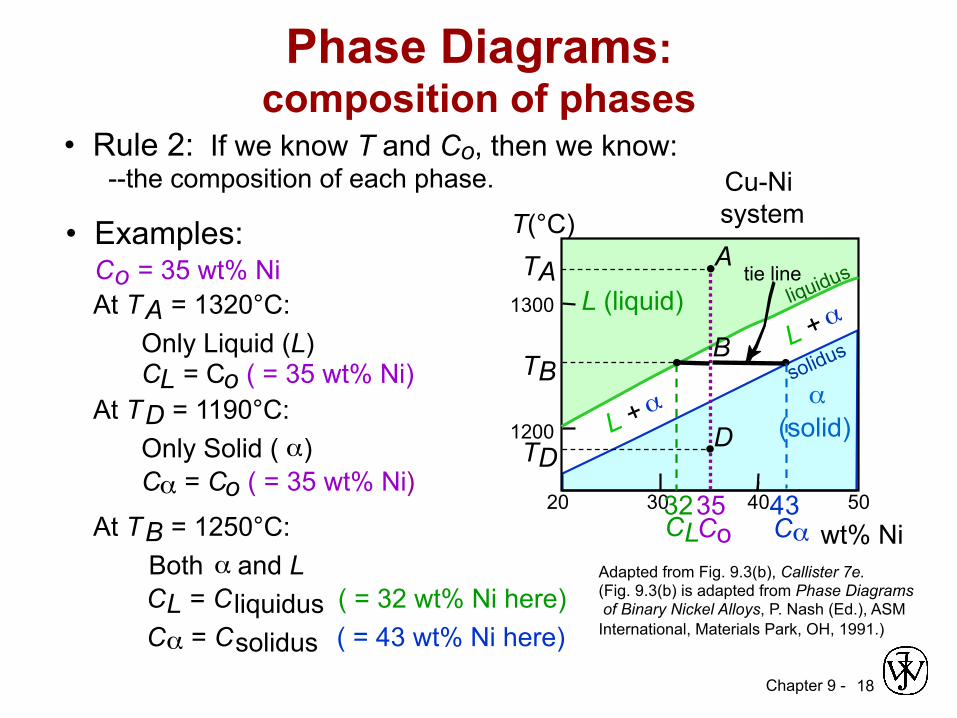
Phase Diagrams: composition of phases
• Rule 2: If we know T and Co, then we know: --the composition of each phase.
• Examples: T A A
35 C o
32 C L
At T A = 1320°C: Only Liquid (L) C L = C o ( = 35 wt% Ni)
At T B = 1250°C: Both α and L C L = C liquidus ( = 32 wt% Ni here) C α = C solidus ( = 43 wt% Ni here)
At T D = 1190°C: Only Solid ( α ) C α = C o ( = 35 wt% Ni )
C o = 35 wt% Ni
Adapted from Fig. 9.3(b), Callister 7e. (Fig. 9.3(b) is adapted from Phase Diagrams of Binary Nickel Alloys, P. Nash (Ed.), ASM International, Materials Park, OH, 1991.)
B T B
D T D
tie line
4 C α 3
Chapter 9 - 19
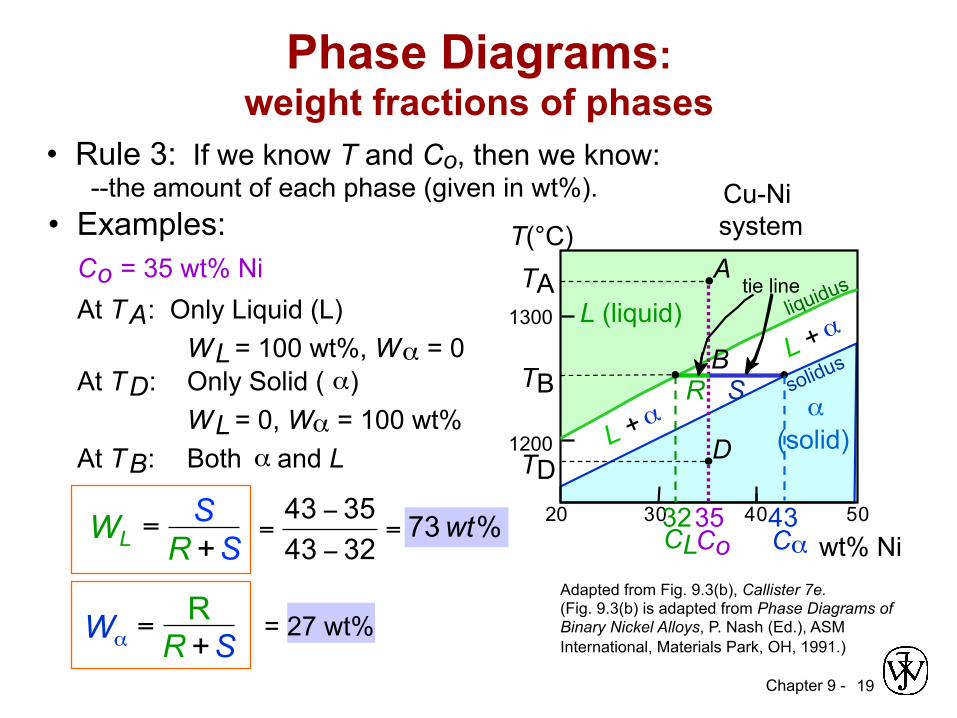
• Rule 3: If we know T and Co, then we know: --the amount of each phase (given in wt%). • Examples:
At T A : Only Liquid (L) W L = 100 wt%, W α = 0
At T D : Only Solid ( α ) W L = 0, W α = 100 wt%
C o = 35 wt% Ni
Adapted from Fig. 9.3(b), Callister 7e. (Fig. 9.3(b) is adapted from Phase Diagrams of Binary Nickel Alloys, P. Nash (Ed.), ASM International, Materials Park, OH, 1991.)
Phase Diagrams: weight fractions of phases
wt% Ni 20
1200
1300
T(°C)
L (liquid)
α (solid)
3 0 4 0 5 0
Cu-Ni system
T A A
35 C o
32 C L
B T B
D T D
tie line
4 C α 3
R S
At T B : Both α and L
% 7332433543 wt=
!
!=
= 27 wt%
WL = S
R + S
Wα = R
R + S
Chapter 9 -
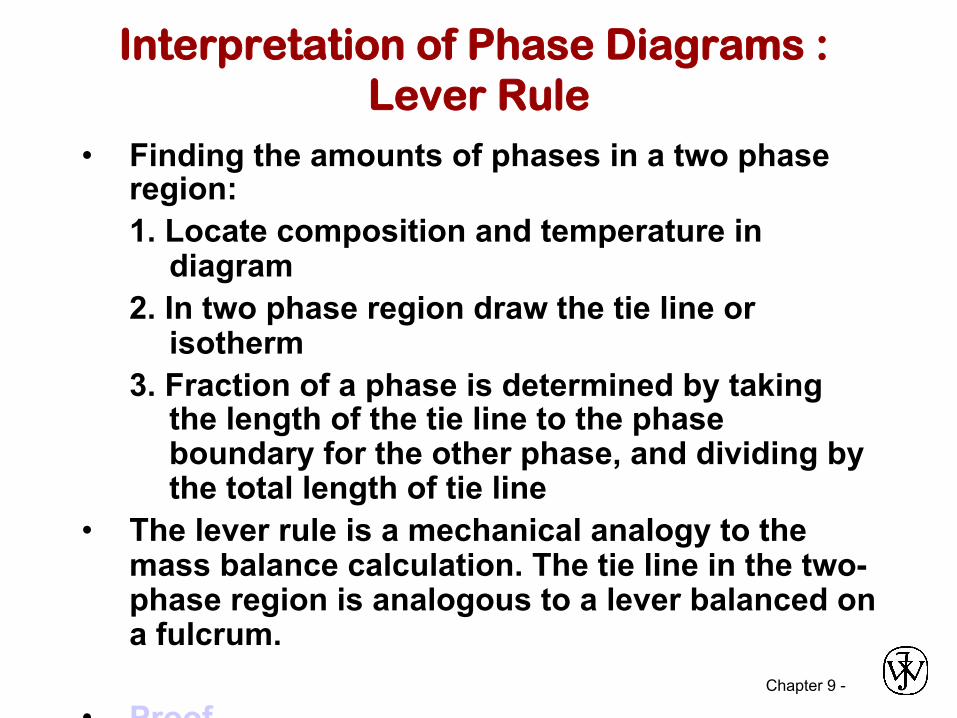
Interpretation of Phase Diagrams : Lever Rule
• Finding the amounts of phases in a two phase region: 1. Locate composition and temperature in
diagram 2. In two phase region draw the tie line or
isotherm 3. Fraction of a phase is determined by taking
the length of the tie line to the phase boundary for the other phase, and dividing by the total length of tie line
• The lever rule is a mechanical analogy to the mass balance calculation. The tie line in the two-phase region is analogous to a lever balanced on a fulcrum.
• Proof
Chapter 9 -
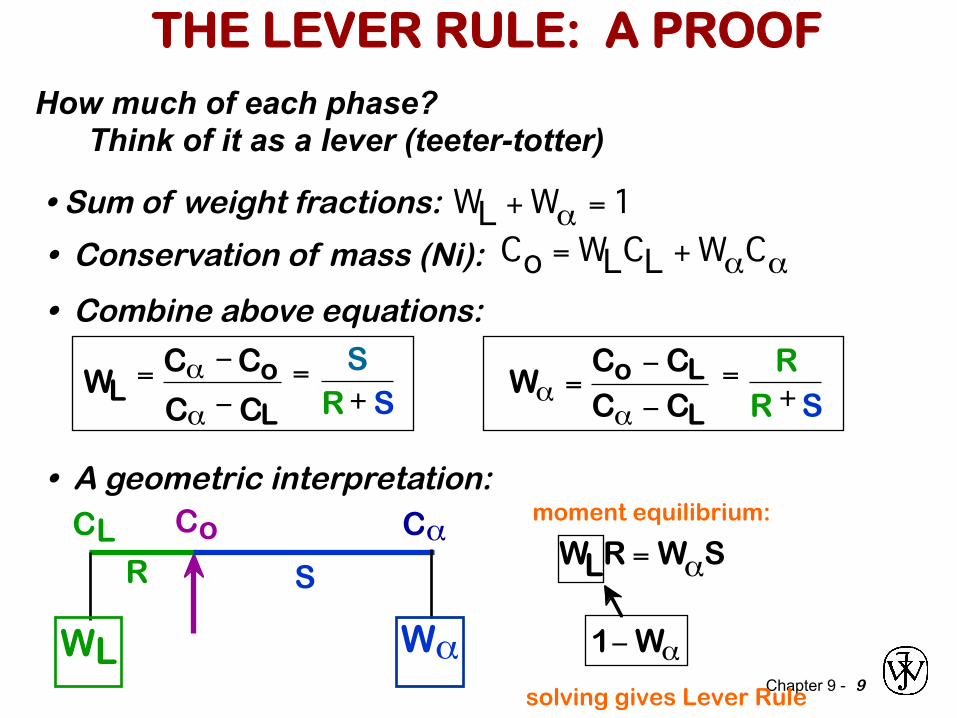
• Sum of weight fractions:
9
• Conservation of mass (Ni):
• Combine above equations:
WL +W! = 1 Co = WLCL +W!C!
= RR +S
W! =Co "CLC! "CL
= SR+ S
WL= C! "Co
C! "CL
• A geometric interpretation: Co
R S
W!WL
CL C!moment equilibrium:
1!W"
solving gives Lever Rule
WLR = W"S
THE LEVER RULE: A PROOF How much of each phase? Think of it as a lever (teeter-totter)
Chapter 9 -
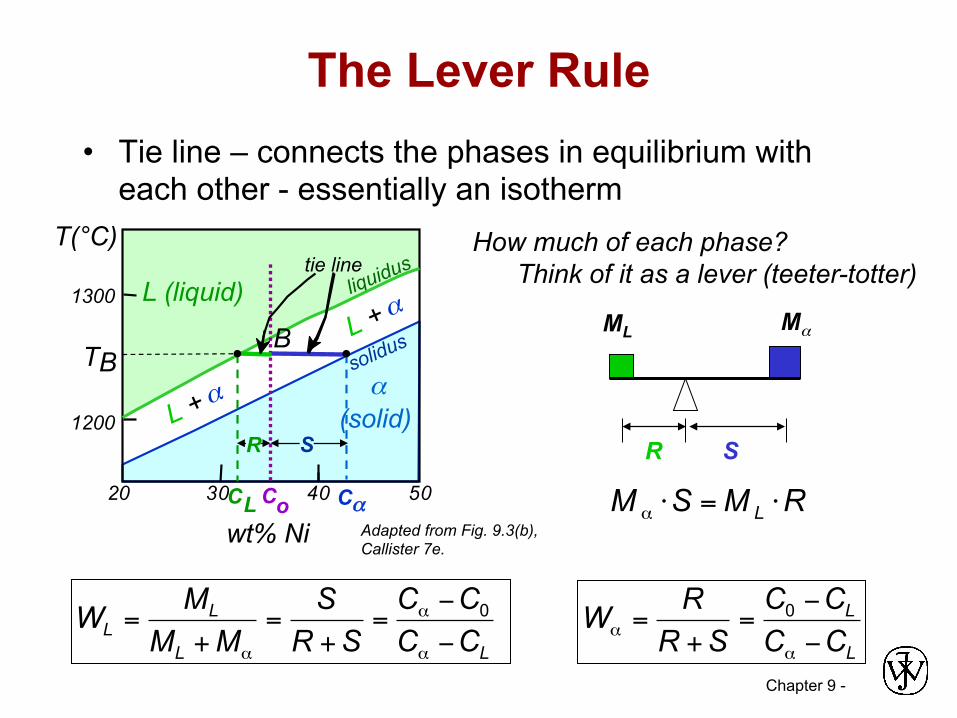
• Tie line – connects the phases in equilibrium with each other - essentially an isotherm
The Lever Rule
How much of each phase? Think of it as a lever (teeter-totter)
ML Mα
R S
RMSM L ⋅=⋅α
L
L
LL
LL CC
CCSR
RWCCCC
SRS
MMMW
−
−=
+=
−
−=
+=
+=
αα
α
α
α
00
wt% Ni 20
1200
1300
T(°C)
L (liquid)
α (solid)
3 0 4 0 5 0
B T B
tie line
C o C L C α
S R
Adapted from Fig. 9.3(b), Callister 7e.
Chapter 9 - 23
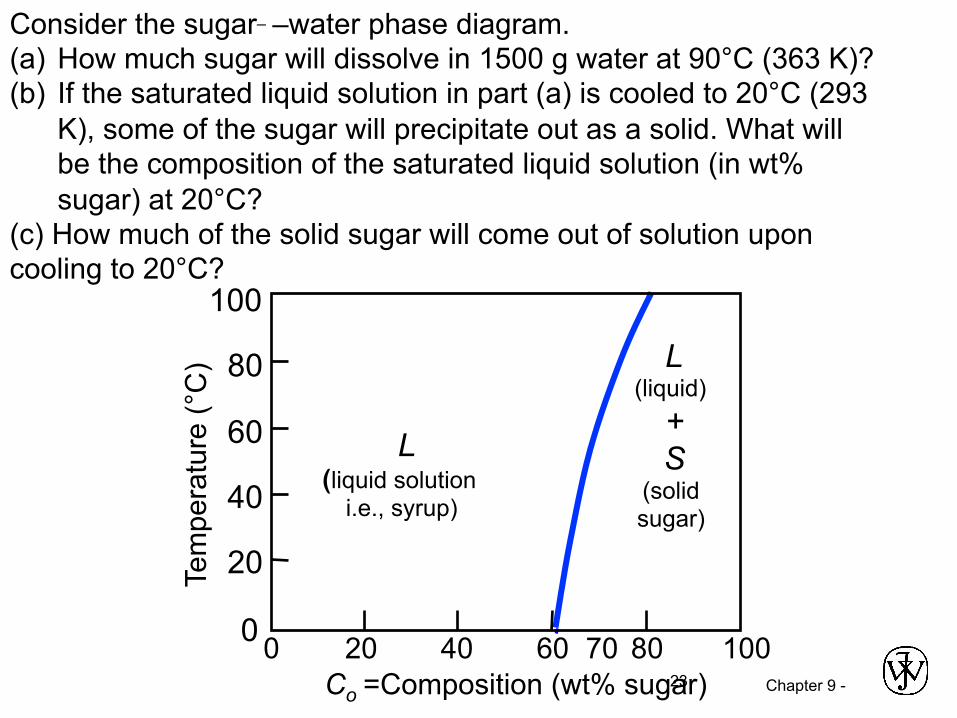
Consider the sugar�–water phase diagram. (a) How much sugar will dissolve in 1500 g water at 90°C (363 K)? (b) If the saturated liquid solution in part (a) is cooled to 20°C (293
K), some of the sugar will precipitate out as a solid. What will be the composition of the saturated liquid solution (in wt% sugar) at 20°C?
(c) How much of the solid sugar will come out of solution upon cooling to 20°C?
70 80 100 60 40 20 0
Tem
pera
ture
(°C
)
Co =Composition (wt% sugar)
L ( liquid solution
i.e., syrup)
20
100
40
60
80
0
L (liquid)
+ S
(solid sugar)

Chapter 9 -
Consider the sugar�–water phase diagram. (a) How much sugar will dissolve in 1500 g water at 90°C (363 K)?
80 100 60 40 20 0
Tem
pera
ture
(°C
)
Co =Composition (wt% sugar)
L ( liquid solution
i.e., syrup)
20
100
40
60
80
0
L (liquid)
+ S
(solid sugar)
D (90°C)
Chapter 9 -
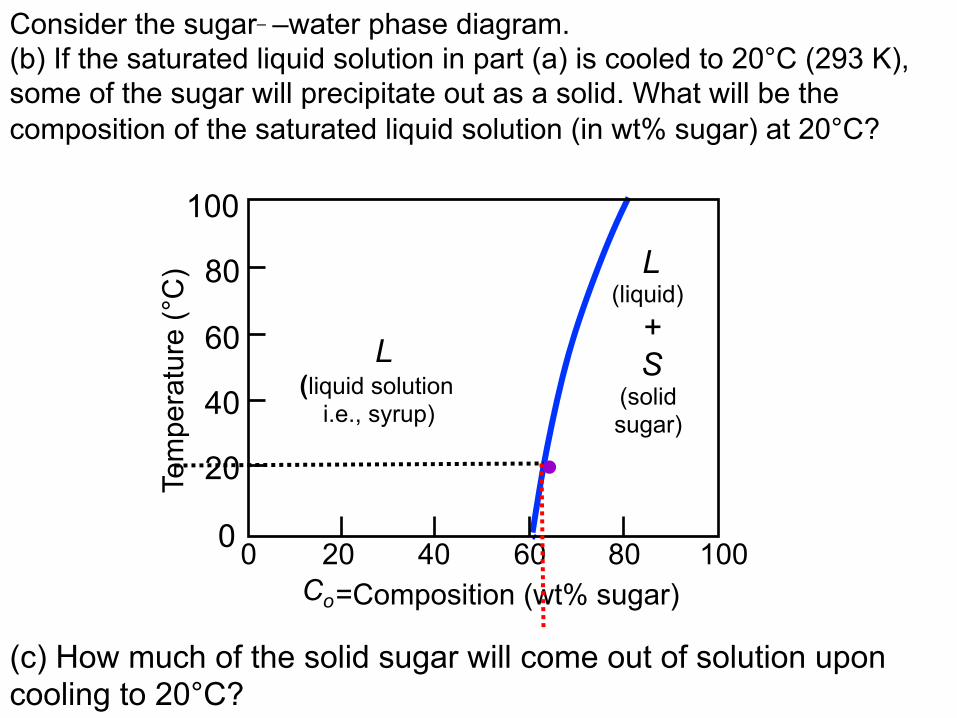
Consider the sugar�–water phase diagram. (b) If the saturated liquid solution in part (a) is cooled to 20°C (293 K), some of the sugar will precipitate out as a solid. What will be the composition of the saturated liquid solution (in wt% sugar) at 20°C?
80 100 60 40 20 0
Tem
pera
ture
(°C
)
Co =Composition (wt% sugar)
L ( liquid solution
i.e., syrup)
20
100
40
60
80
0
L (liquid)
+ S
(solid sugar)
(c) How much of the solid sugar will come out of solution upon cooling to 20°C?
Chapter 9 - 26
wt% Ni 20
120 0
130 0
3 0 4 0 5 0 110 0
L (liquid)
α (solid)
T(°C)
A
35 C o
L: 35wt%Ni Cu-Ni
system
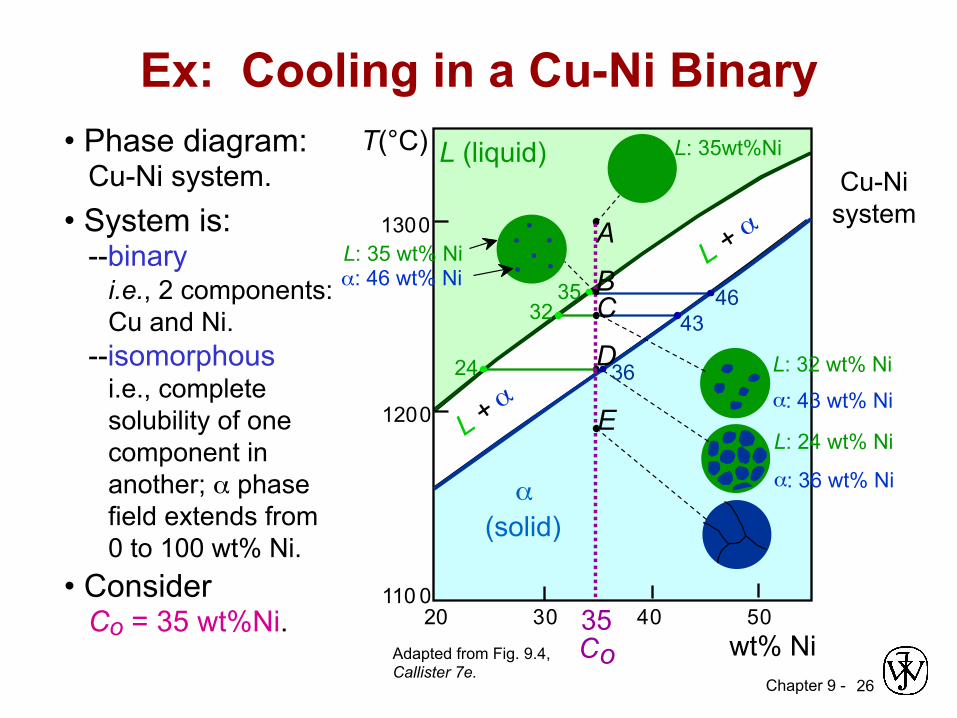
• Phase diagram: Cu-Ni system. • System is: --binary i.e., 2 components: Cu and Ni. --isomorphous i.e., complete solubility of one component in another; α phase field extends from 0 to 100 wt% Ni.
Adapted from Fig. 9.4, Callister 7e.
• Consider Co = 35 wt%Ni.
Ex: Cooling in a Cu-Ni Binary
46 35 43 32
α : 43 wt% Ni L: 32 wt% Ni
L: 24 wt% Ni α : 36 wt% Ni
B α: 46 wt% Ni L: 35 wt% Ni
C D
E
24 36

Chapter 9 -
SUMMARY • Development of microstructure in isomorphous alloys during
equilibrium (very slow) cooling 1. Solidification in the solid + liquid phase occurs
gradually upon cooling from the liquidus line. 2. The composition of the solid and the liquid change
gradually during cooling (as can be determined by the tie-line method.) => DIFFUSION !
3. Nuclei of the solid phase form and they grow to consume all the liquid at the solidus line.

Chapter 9 -
• Phase diagram: Cu-Ni system.
• System is: --binary i.e., 2 components: Cu and Ni. --isomorphous i.e., complete solubility of one component in another; α phase field extends from 0 to 100wt% Ni.
Adapted from Fig. 9.3, Callister 6e.
• Consider Co = 35wt%Ni & fast cooling
Development of microstructure in isomorphous alloys
Non-equilibrium (fast) cooling
Chapter 9 -
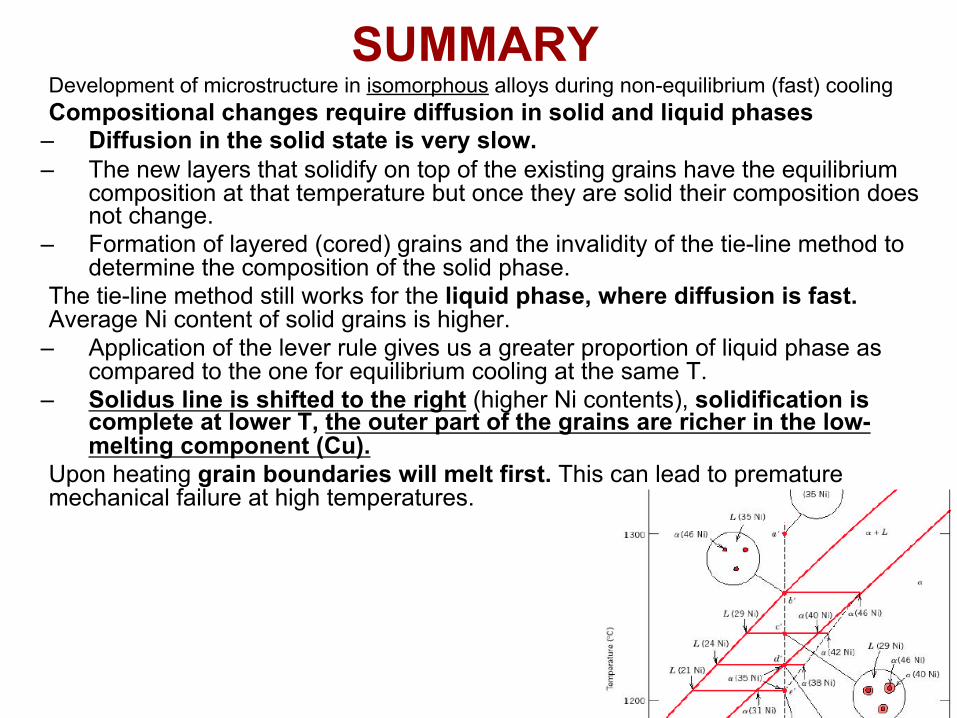
SUMMARY • Development of microstructure in isomorphous alloys during non-equilibrium (fast) cooling • Compositional changes require diffusion in solid and liquid phases
– Diffusion in the solid state is very slow. – The new layers that solidify on top of the existing grains have the equilibrium
composition at that temperature but once they are solid their composition does not change.
– Formation of layered (cored) grains and the invalidity of the tie-line method to determine the composition of the solid phase.
• The tie-line method still works for the liquid phase, where diffusion is fast. Average Ni content of solid grains is higher.
– Application of the lever rule gives us a greater proportion of liquid phase as compared to the one for equilibrium cooling at the same T.
– Solidus line is shifted to the right (higher Ni contents), solidification is complete at lower T, the outer part of the grains are richer in the low-melting component (Cu).
• Upon heating grain boundaries will melt first. This can lead to premature mechanical failure at high temperatures.
Chapter 9 - 30
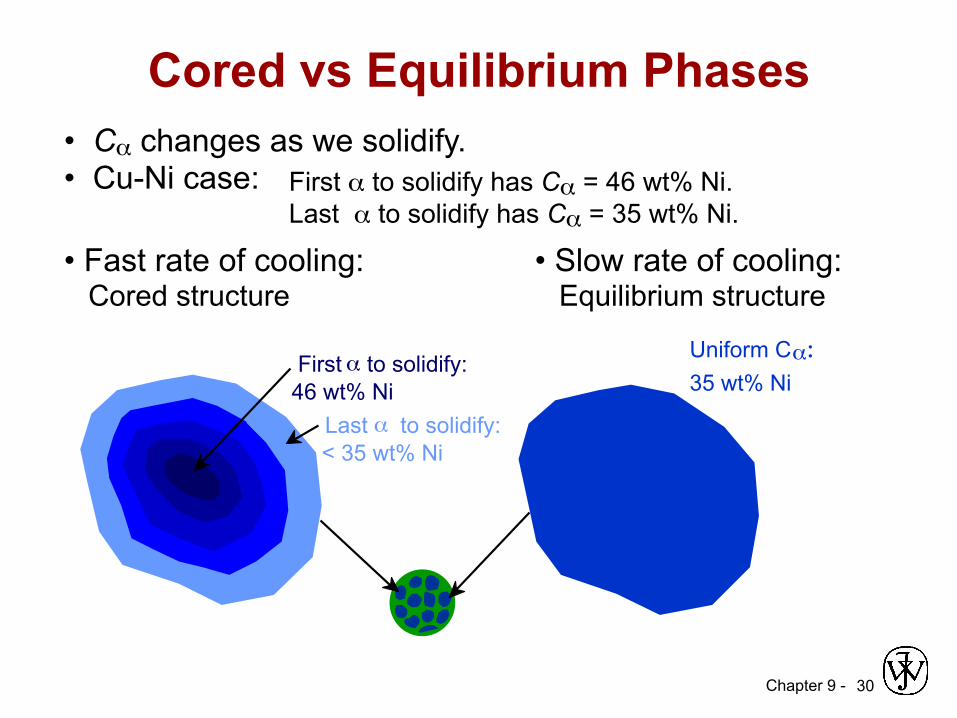
• Cα changes as we solidify. • Cu-Ni case:
• Fast rate of cooling: Cored structure
• Slow rate of cooling: Equilibrium structure
First α to solidify has Cα = 46 wt% Ni. Last α to solidify has Cα = 35 wt% Ni.
Cored vs Equilibrium Phases
First α to solidify: 46 wt% Ni
Uniform C α : 35 wt% Ni
Last α to solidify: < 35 wt% Ni

Chapter 9 - 31
Mechanical Properties: Cu-Ni System • Effect of solid solution strengthening on:
--Tensile strength (TS) --Ductility (%EL,%AR)
--Peak as a function of Co --Min. as a function of Co
Adapted from Fig. 9.6(a), Callister 7e. Adapted from Fig. 9.6(b), Callister 7e.
Tens
ile S
treng
th (M
Pa)
Composition, wt% Ni Cu Ni 0 20 40 60 80 100 200
300
400 TS for pure Ni
TS for pure Cu
Elo
ngat
ion
(%E
L)
Composition, wt% Ni Cu Ni 0 20 40 60 80 100 20
30
40
50
60 %EL for pure Ni
%EL for pure Cu
Chapter 9 - 32
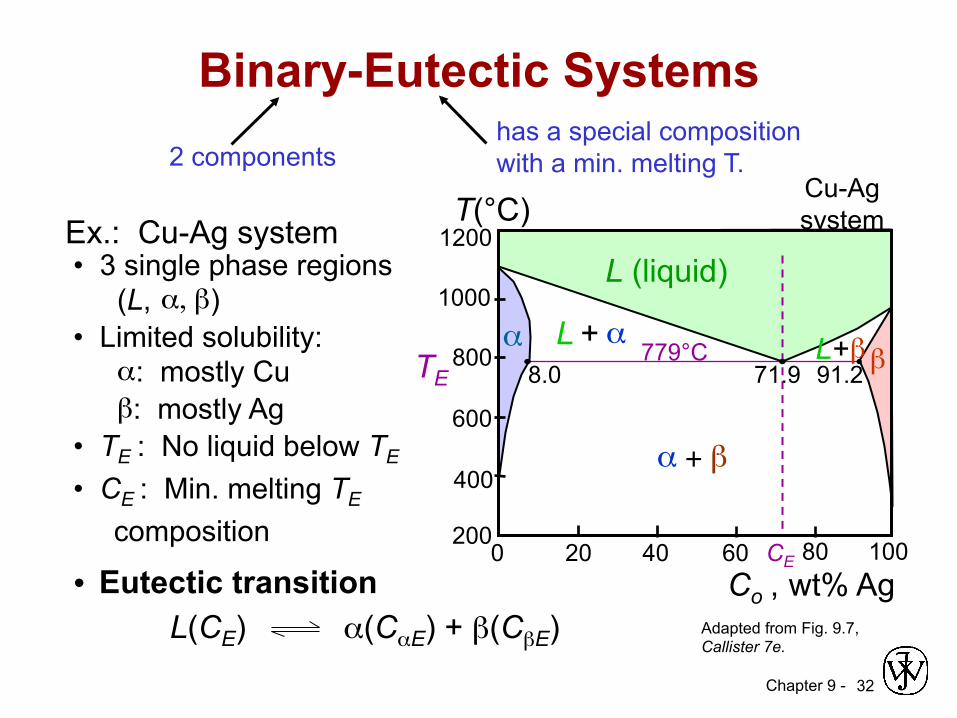
: Min. melting TE
2 components has a special composition with a min. melting T.
Adapted from Fig. 9.7, Callister 7e.
Binary-Eutectic Systems
• Eutectic transition L(CE) α(CαE) + β(CβE)
• 3 single phase regions (L, α, β ) • Limited solubility: α : mostly Cu β : mostly Ag • TE : No liquid below TE • CE composition
Ex.: Cu-Ag system Cu-Ag system
L (liquid)
α L + α L + β β
α + β
Co , wt% Ag 20 40 60 80 100 0 200
1200 T(°C)
400
600
800
1000
CE
TE 8.0 71.9 91.2 779°C

Chapter 9 -
More Information on Eutectic Systems (I)
Eutectic isotherm
3 phases are in eqm
Chapter 9 -
More Information on Eutectic Systems (II)
• Eutectic reaction – transition between liquid and mixture of two solid phases, α + β, at eutectic concentration CE. – The melting point of the eutectic alloy is lower than
that of the components (eutectic = easy to melt in Greek).
• At most two phases can be in equilibrium within a phase field. Three phases (L, α, β) may be in equilibrium only at a few points along the eutectic isotherm.
• Single phase regions are separated by 2-phase regions.
Chapter 9 - 35
L + α L + β
α + β
200
T(°C)
18.3
C, wt% Sn 20 60 80 100 0
300
100
L (liquid)
α 183°C 61.9 97.8
β
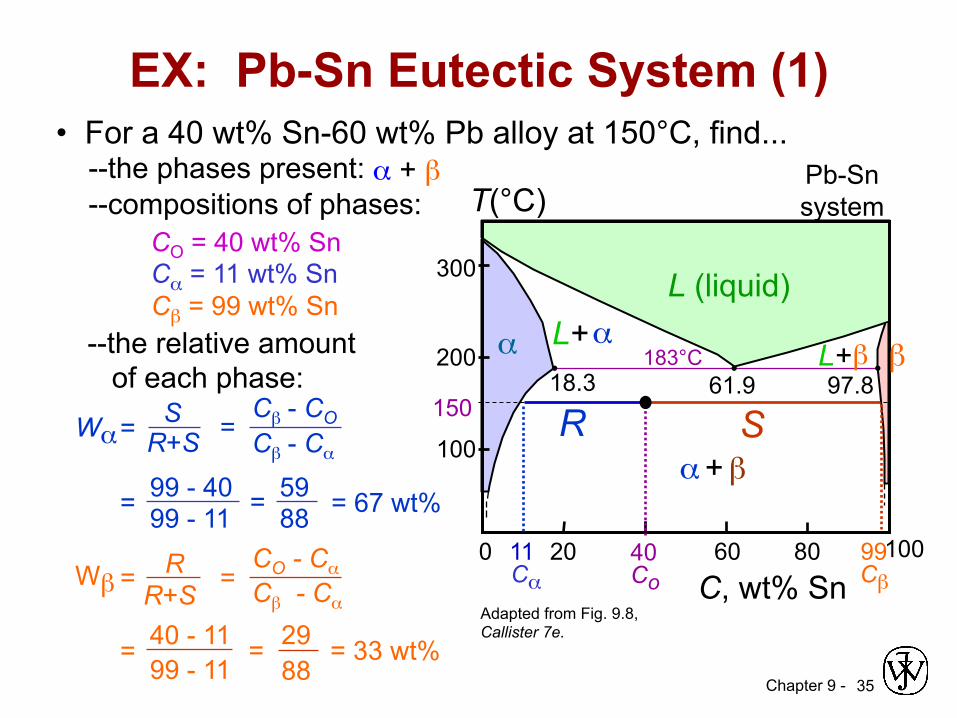
• For a 40 wt% Sn-60 wt% Pb alloy at 150°C, find... --the phases present: Pb-Sn
system
EX: Pb-Sn Eutectic System (1)
α + β --compositions of phases:
CO = 40 wt% Sn
--the relative amount of each phase:
150
40 Co
11 Cα
99 Cβ
S R
Cα = 11 wt% Sn Cβ = 99 wt% Sn
W α = Cβ - CO Cβ - Cα
= 99 - 40 99 - 11
= 59 88
= 67 wt%
S R+S
=
W β = CO - Cα Cβ - Cα
= R R+S
= 29 88
= 33 wt% = 40 - 11 99 - 11
Adapted from Fig. 9.8, Callister 7e.
Chapter 9 - 36
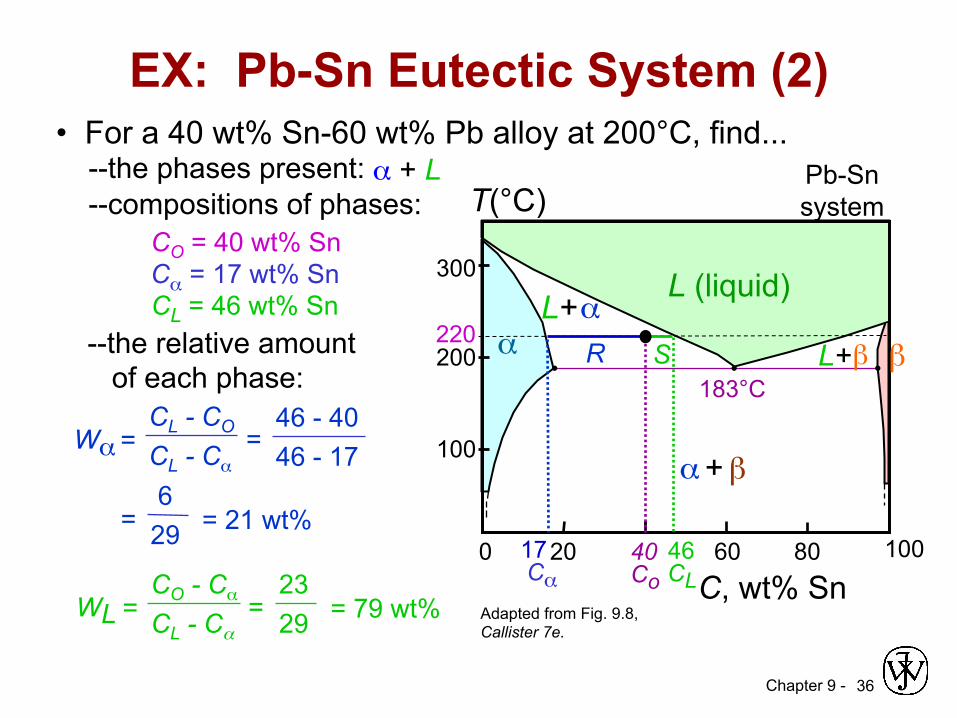
L + β
α + β
200
T(°C)
C, wt% Sn 20 60 80 100 0
300
100
L (liquid)
α β
L + α
183°C
• For a 40 wt% Sn-60 wt% Pb alloy at 200°C, find... --the phases present: Pb-Sn
system
Adapted from Fig. 9.8, Callister 7e.
EX: Pb-Sn Eutectic System (2)
α + L --compositions of phases:
CO = 40 wt% Sn
--the relative amount of each phase:
W α = CL - CO CL - Cα
= 46 - 40 46 - 17
= 6 29
= 21 wt%
W L = CO - Cα CL - Cα
= 23 29
= 79 wt%
40 Co
46 CL
17 Cα
220 S R
Cα = 17 wt% Sn CL = 46 wt% Sn
Chapter 9 - 37
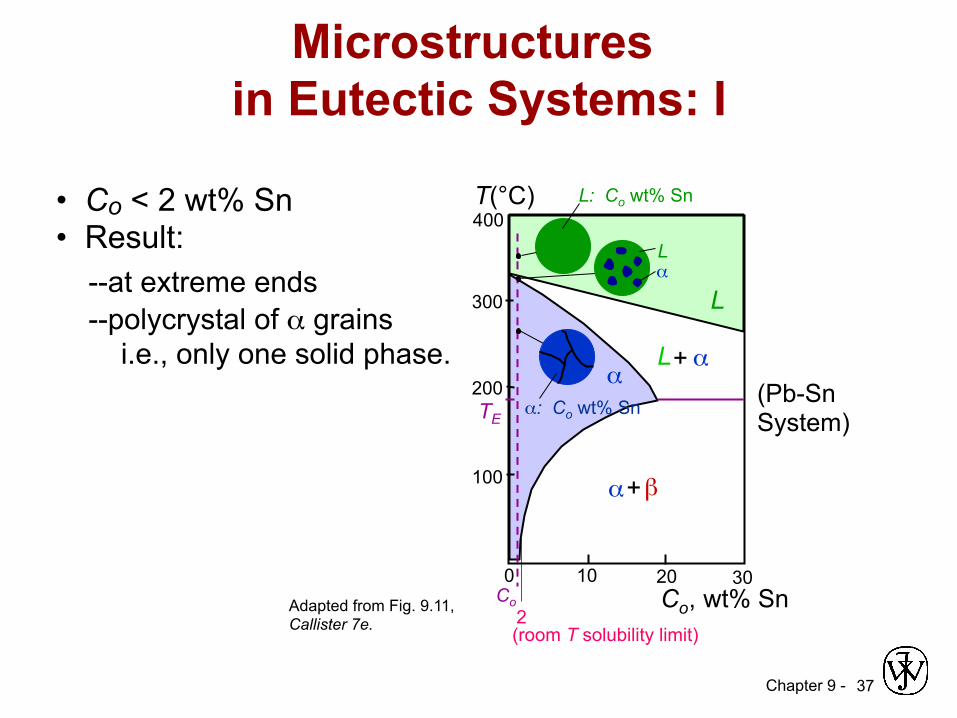
• Co < 2 wt% Sn • Result: --at extreme ends --polycrystal of α grains i.e., only one solid phase.
Adapted from Fig. 9.11, Callister 7e.
Microstructures in Eutectic Systems: I
0
L + α 200
T(°C)
Co , wt% Sn 10
2 20
Co
300
100
L
α
30
α + β
400
(room T solubility limit)
TE (Pb-Sn System)
α L
L: Co wt% Sn
α: Co wt% Sn
Chapter 9 - 38
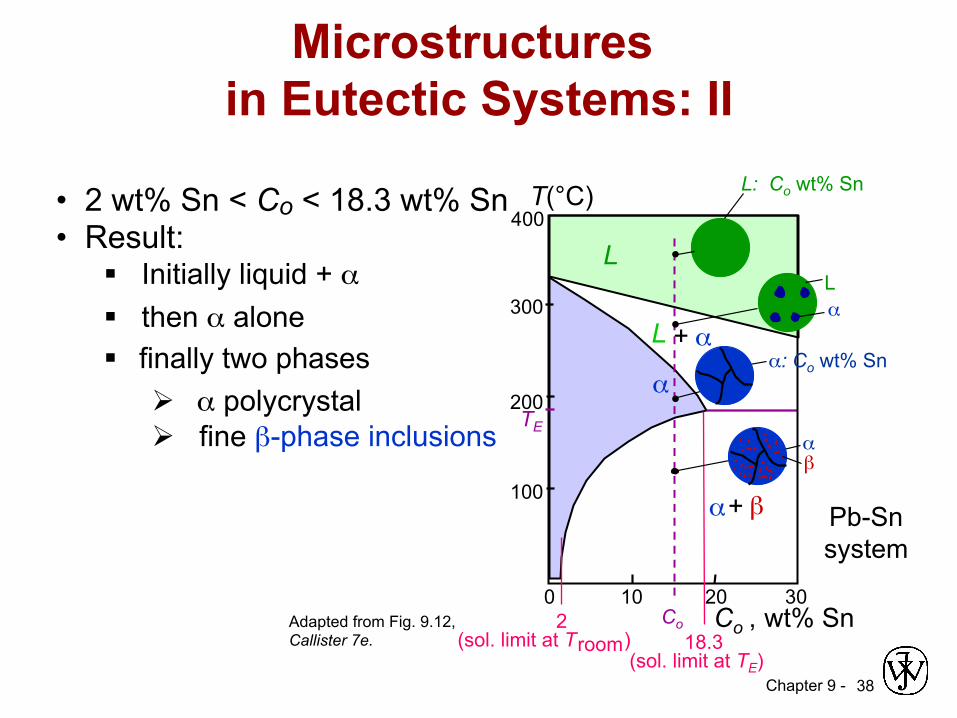
• 2 wt% Sn < Co < 18.3 wt% Sn • Result:
§ Initially liquid + α § then α alone § finally two phases
Ø α polycrystal Ø fine β-phase inclusions
Adapted from Fig. 9.12, Callister 7e.
Microstructures in Eutectic Systems: II
Pb-Sn system
L + α
200
T(°C)
Co , wt% Sn 10
18.3 20 0
Co
300
100
L
α
30
α + β
400
(sol. limit at TE)
TE
2 (sol. limit at T room )
L α
L: Co wt% Sn
α β
α: Co wt% Sn
Chapter 9 - 39
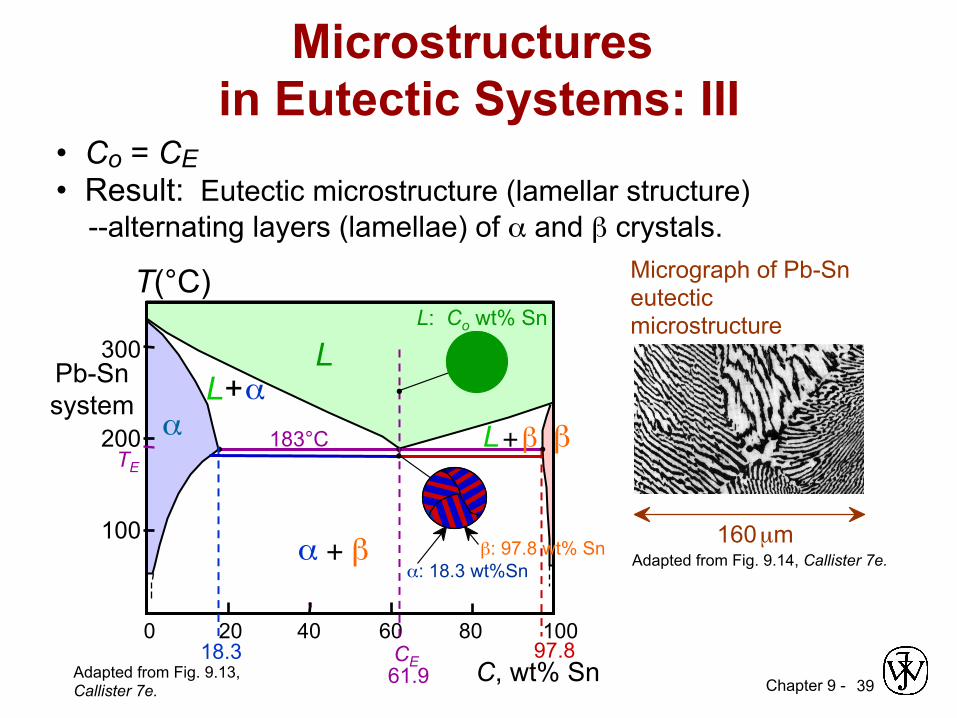
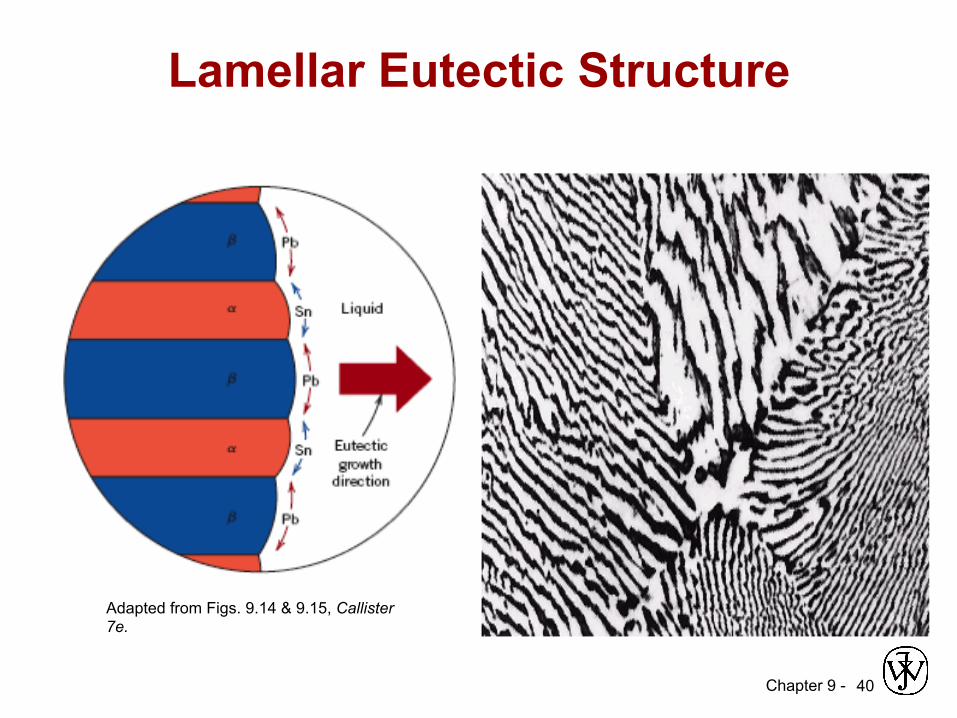
• Co = CE • Result: Eutectic microstructure (lamellar structure) --alternating layers (lamellae) of α and β crystals.
Adapted from Fig. 9.13, Callister 7e.
Microstructures in Eutectic Systems: III
Adapted from Fig. 9.14, Callister 7e. 160 µm
Micrograph of Pb-Sn eutectic microstructure
Pb-Sn system
L + β
α + β
200
T(°C)
C, wt% Sn 20 60 80 100 0
300
100
L
α β
L + α 183°C
40
TE
18.3
α: 18.3 wt%Sn
97.8
β: 97.8 wt% Sn
CE 61.9
L: Co wt% Sn
Chapter 9 - 40
Lamellar Eutectic Structure
Adapted from Figs. 9.14 & 9.15, Callister 7e.

Chapter 9 - 41
• 18.3 wt% Sn < Co < 61.9 wt% Sn • Result: α crystals and a eutectic microstructure
Microstructures in Eutectic Systems: IV
18.3 61.9
S R
97.8
S R
primary α eutectic α
eutectic β
WL = (1- W α ) = 50 wt%
C α = 18.3 wt% Sn CL = 61.9 wt% Sn
S R + S W α = = 50 wt%
• Just above TE :
• Just below TE : C α = 18.3 wt% Sn C β = 97.8 wt% Sn
S R + S
W α = = 73 wt% W β = 27 wt%
Adapted from Fig. 9.16, Callister 7e.
Pb-Sn system
L + β 200
T(°C)
Co, wt% Sn
20 60 80 100 0
300
100
L
α β L + α
40
α + β
TE
L: Co wt% Sn L α L α
Chapter 9 - 42
L + α L + β
α + β
200
Co, wt% Sn 20 60 80 100 0
300
100
L
α β
TE
40
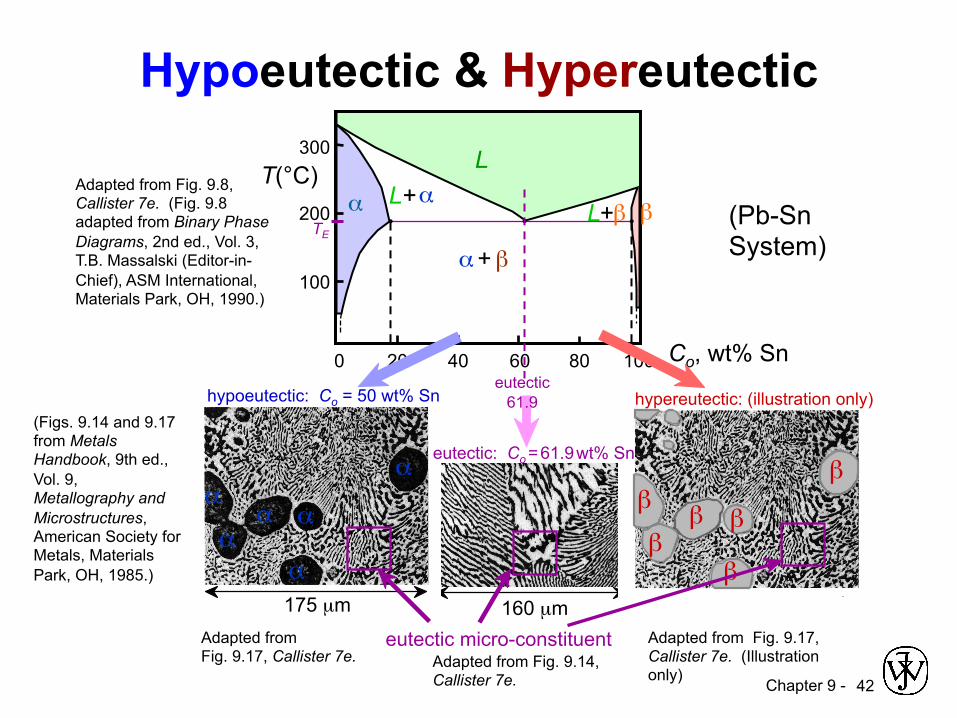
(Pb-Sn System)
Hypoeutectic & Hypereutectic
Adapted from Fig. 9.8, Callister 7e. (Fig. 9.8 adapted from Binary Phase Diagrams, 2nd ed., Vol. 3, T.B. Massalski (Editor-in-Chief), ASM International, Materials Park, OH, 1990.)
160 µm eutectic micro-constituent
Adapted from Fig. 9.14, Callister 7e.
hypereutectic: (illustration only)
β β β
β β β
Adapted from Fig. 9.17, Callister 7e. (Illustration only)
(Figs. 9.14 and 9.17 from Metals Handbook, 9th ed., Vol. 9, Metallography and Microstructures, American Society for Metals, Materials Park, OH, 1985.)
175 µm
α α
α
α α α
hypoeutectic: Co = 50 wt% Sn
Adapted from Fig. 9.17, Callister 7e.
T(°C)
61.9 eutectic
eutectic: Co = 61.9 wt% Sn
Chapter 9 - 43
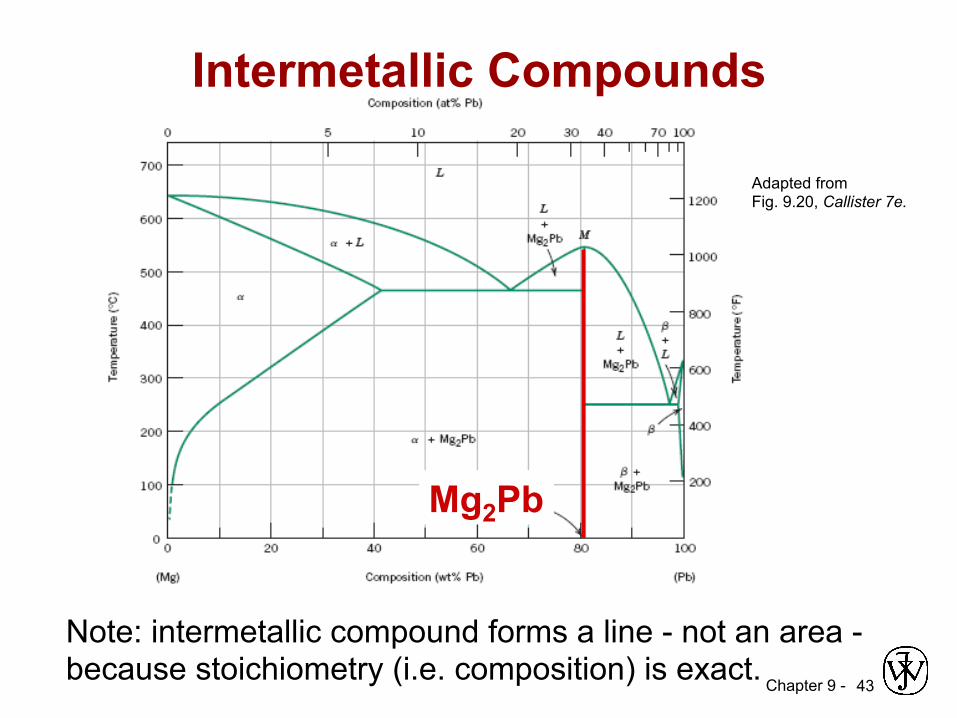
Intermetallic Compounds
Mg2Pb
Note: intermetallic compound forms a line - not an area - because stoichiometry (i.e. composition) is exact.
Adapted from Fig. 9.20, Callister 7e.
Chapter 9 - 44
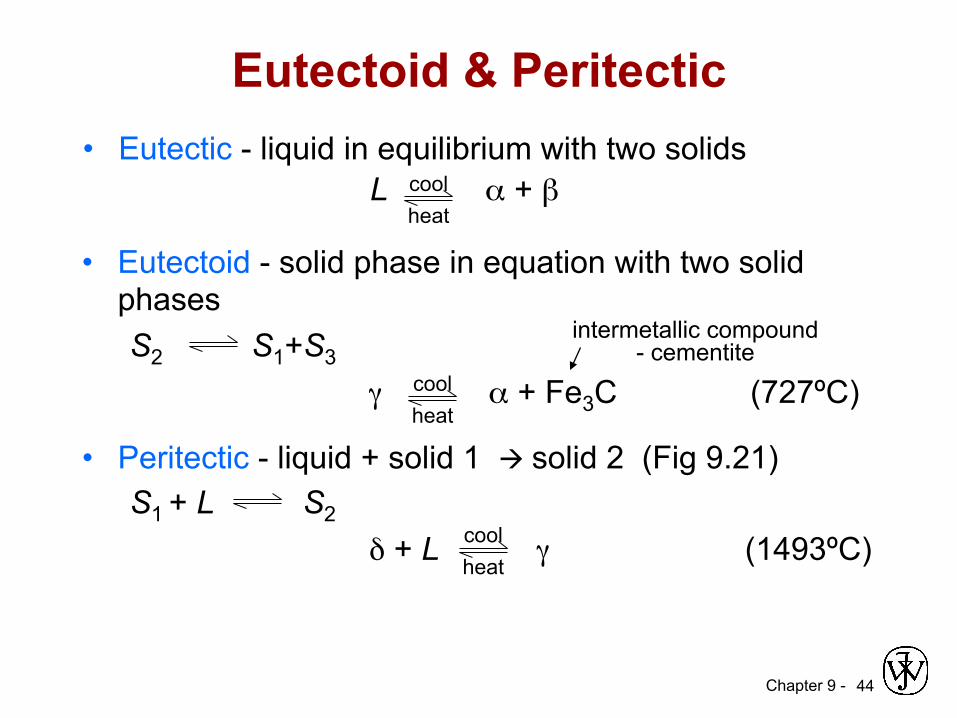
Eutectoid & Peritectic • Eutectic - liquid in equilibrium with two solids
L α + β
cool heat
intermetallic compound - cementite
cool heat
• Eutectoid - solid phase in equation with two solid phases S2 S1+S3
γ α + Fe3C (727ºC)
cool heat
• Peritectic - liquid + solid 1 à solid 2 (Fig 9.21) S1 + L S2
δ + L γ (1493ºC)

Chapter 9 - 45
Eutectoid & Peritectic Cu-Zn Phase diagram
Adapted from Fig. 9.21, Callister 7e.
Eutectoid transition δ γ + ε
Peritectic transition γ + L δ
Chapter 9 - 46
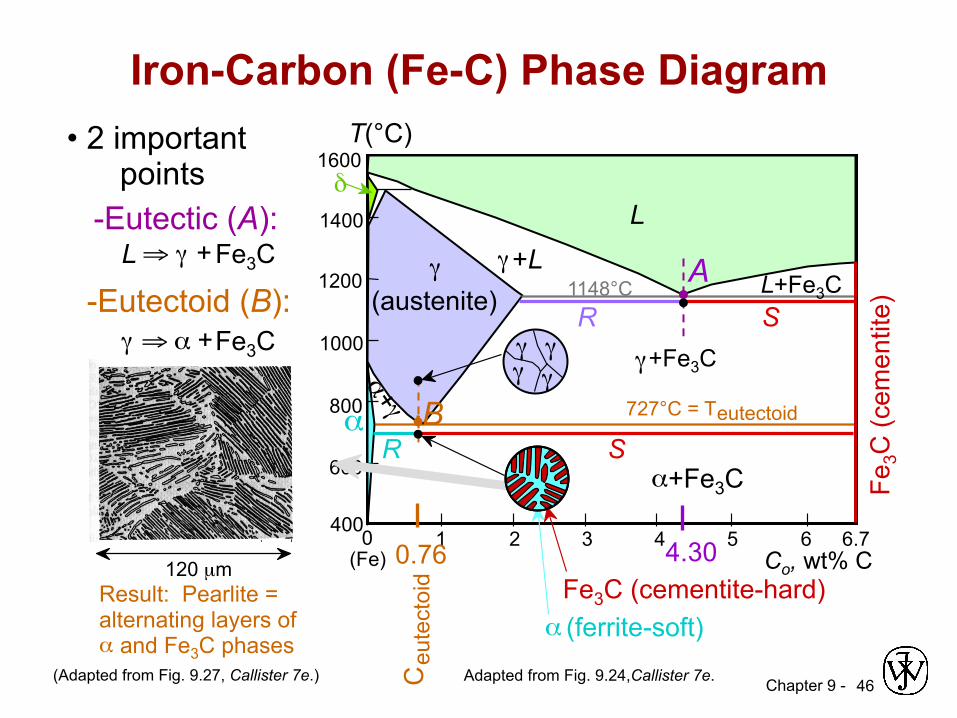
Iron-Carbon (Fe-C) Phase Diagram • 2 important points
-Eutectoid (B): γ ⇒ α + Fe3C
-Eutectic (A): L ⇒ γ + Fe3C
Adapted from Fig. 9.24,Callister 7e.
Fe3C
(cem
entit
e)
1600
1400
1200
1000
800
600
400 0 1 2 3 4 5 6 6.7
L γ
(austenite) γ +L
γ +Fe3C
α +Fe3C
L+Fe3C
δ
(Fe) Co, wt% C
1148°C
T(°C)
α 727°C = T eutectoid
A S R
4.30 Result: Pearlite = alternating layers of α and Fe3C phases
120 µm
(Adapted from Fig. 9.27, Callister 7e.)
γ γ γ γ
R S
0.76
C eu
tect
oid
B
Fe3C (cementite-hard) α (ferrite-soft)
Chapter 9 - 47
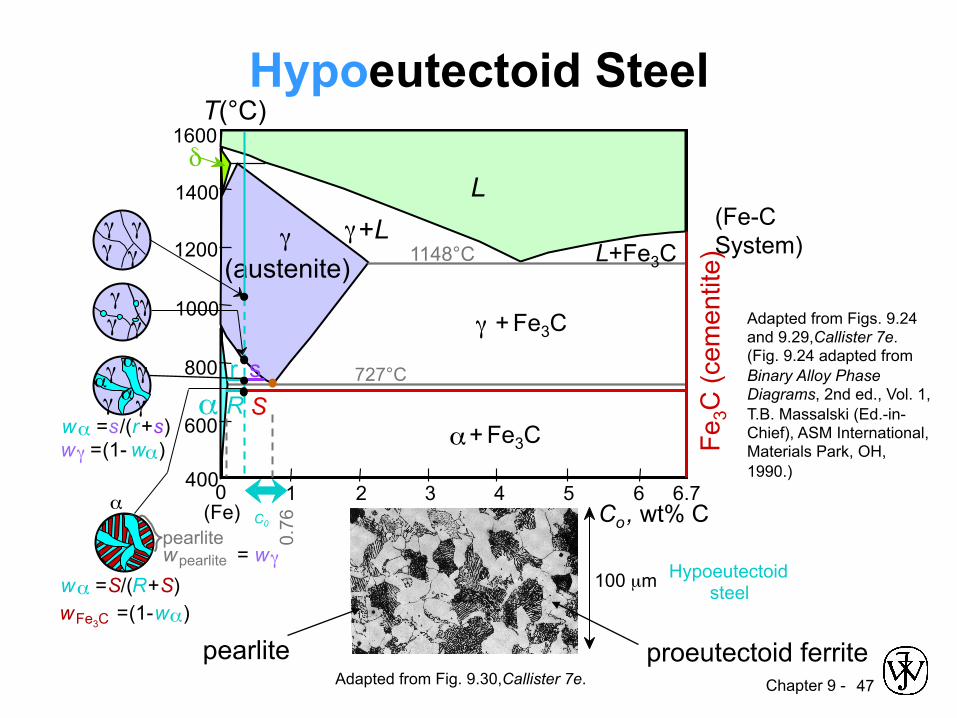
Hypoeutectoid Steel
Adapted from Figs. 9.24 and 9.29,Callister 7e. (Fig. 9.24 adapted from Binary Alloy Phase Diagrams, 2nd ed., Vol. 1, T.B. Massalski (Ed.-in-Chief), ASM International, Materials Park, OH, 1990.)
Fe3C
(cem
entit
e)
1600
1400
1200
1000
800
600
400 0 1 2 3 4 5 6 6.7
L γ
(austenite) γ +L
γ + Fe3C
α + Fe3C
L+Fe3C
δ
(Fe) Co , wt% C
1148°C
T(°C)
α 727°C
(Fe-C System)
C0
0.76
Adapted from Fig. 9.30,Callister 7e. proeutectoid ferrite pearlite
100 µm Hypoeutectoid steel
R S
α
w α = S /( R + S ) w Fe3C = (1- w α )
w pearlite = w γ pearlite
r s
w α = s /( r + s ) w γ = (1- w α )
γ γ γ
γ α α α
γ γ γ γ
γ γ γ γ

Chapter 9 - 48
Hypereutectoid Steel
Fe3C
(cem
entit
e)
1600
1400
1200
1000
800
600
400 0 1 2 3 4 5 6 6.7
L γ
(austenite) γ +L
γ +Fe3C
α +Fe3C
L+Fe3C
δ
(Fe) Co , wt%C
1148°C
T(°C)
α
Adapted from Figs. 9.24 and 9.32,Callister 7e. (Fig. 9.24 adapted from Binary Alloy Phase Diagrams, 2nd ed., Vol. 1, T.B. Massalski (Ed.-in-Chief), ASM International, Materials Park, OH, 1990.)
(Fe-C System)
0.76
Co
Adapted from Fig. 9.33,Callister 7e.
proeutectoid Fe3C
60 µm Hypereutectoid steel
pearlite
R S
w α = S /( R + S ) w Fe3C = (1- w α )
w pearlite = w γ pearlite
s r
w Fe3C = r /( r + s ) w γ =(1- w Fe3C )
Fe3C
γ γ γ γ γ γ
γ γ γ γ
γ γ

Chapter 9 - 49
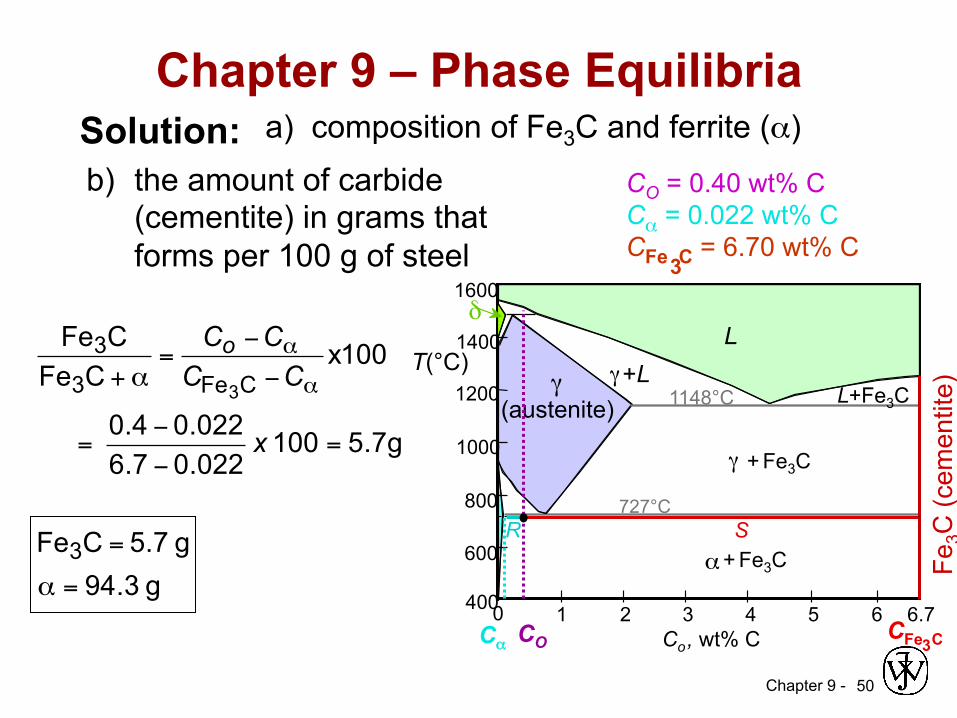
Example: Phase Equilibria For a 99.6 wt% Fe-0.40 wt% C at a temperature
just below the eutectoid, determine the following
a) composition of Fe3C and ferrite (α) b) the amount of carbide (cementite) in grams
that forms per 100 g of steel c) the amount of pearlite and proeutectoid
ferrite (α)
Chapter 9 - 50
Chapter 9 – Phase Equilibria Solution:
g 3.94g 5.7 CFe
g7.5100 022.07.6022.04.0
100xCFe
CFe
3
CFe3
3
3
=!
=
="
"=
"
"=
!+ !
!
x
CCCCo
b) the amount of carbide (cementite) in grams that forms per 100 g of steel
a) composition of Fe3C and ferrite (α)
CO = 0.40 wt% C Cα = 0.022 wt% C CFe C = 6.70 wt% C
3
Fe3C
(cem
entit
e)
1600 1400 1200
1000
800 600 400 0 1 2 3 4 5 6 6.7
L
γ (austenite)
γ +L
γ + Fe3C
α + Fe3C
L+Fe3C
δ
Co , wt% C
1148°C T(°C)
727°C
CO
R S
CFe C 3 Cα
Chapter 9 - 51
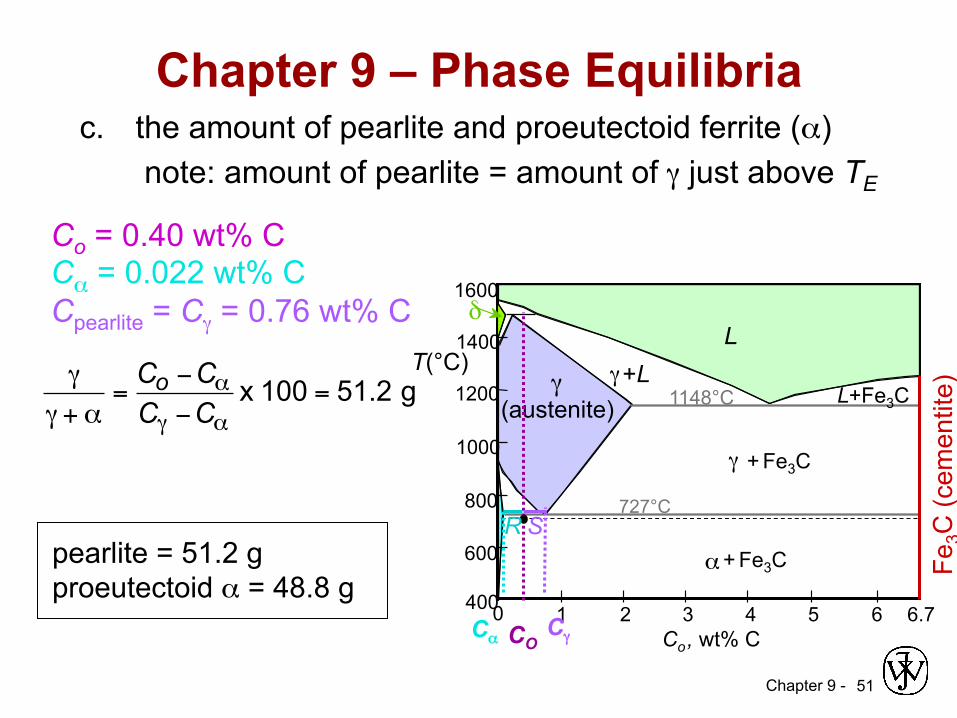
Chapter 9 – Phase Equilibria c. the amount of pearlite and proeutectoid ferrite (α)
note: amount of pearlite = amount of γ just above TE
Co = 0.40 wt% C Cα = 0.022 wt% C Cpearlite = Cγ = 0.76 wt% C
!
"" + #
=Co $C#C" $C#
x 100 = 51.2 g
pearlite = 51.2 g proeutectoid α = 48.8 g
Fe3C
(cem
entit
e)
1600 1400 1200
1000
800 600 400 0 1 2 3 4 5 6 6.7
L
γ (austenite)
γ +L
γ + Fe3C
α + Fe3C
L+Fe3C
δ
Co , wt% C
1148°C T(°C)
727°C
CO
R S
Cγ Cα
Chapter 9 - 52
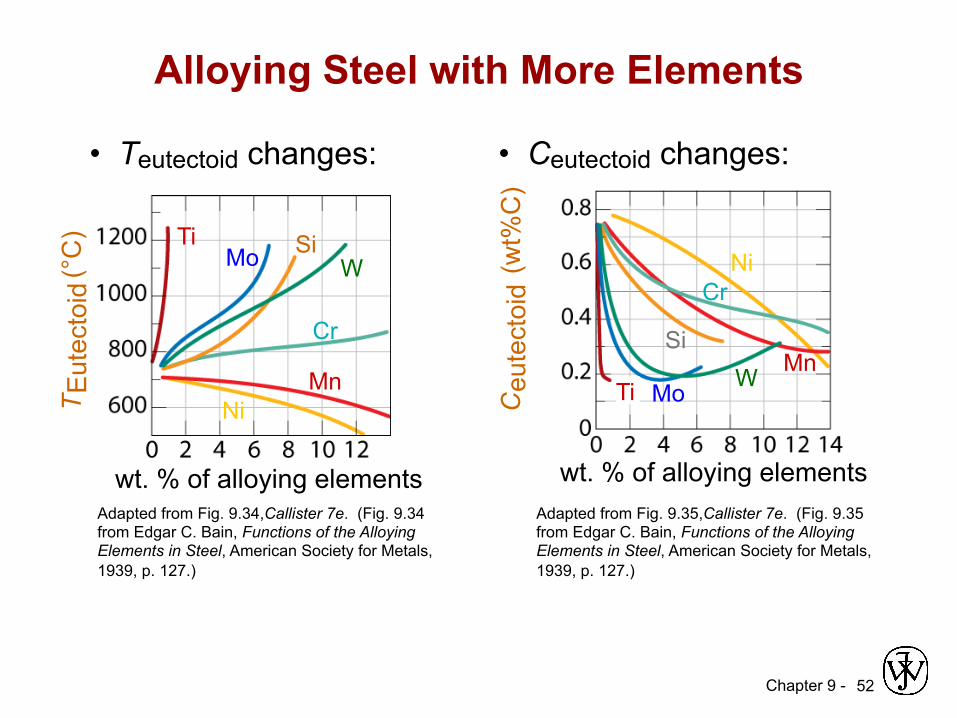
Alloying Steel with More Elements
• Teutectoid changes: • Ceutectoid changes:
Adapted from Fig. 9.34,Callister 7e. (Fig. 9.34 from Edgar C. Bain, Functions of the Alloying Elements in Steel, American Society for Metals, 1939, p. 127.)
Adapted from Fig. 9.35,Callister 7e. (Fig. 9.35 from Edgar C. Bain, Functions of the Alloying Elements in Steel, American Society for Metals, 1939, p. 127.)
T Eut
ecto
id (°
C)
wt. % of alloying elements
Ti
Ni
Mo Si W
Cr Mn
wt. % of alloying elements C
eute
ctoi
d (w
t%C
)
Ni
Ti
Cr Si
Mn W Mo

Chapter 9 - 53
• Phase diagrams are useful tools to determine: --the number and types of phases, --the wt% of each phase, --and the composition of each phase for a given T and composition of the system.
• Alloying to produce a solid solution usually --increases the tensile strength (TS) --decreases the ductility.
• Binary eutectics and binary eutectoids allow for a range of microstructures.
Summary
Chapter 9 - 54
Core Problems:
Self-help Problems:
ANNOUNCEMENTS Reading: