issues in modelling the australian dairy industry: joint...
TRANSCRIPT

Issues in Modelling the Australian Dairy Industry: Joint Products, Market Power
and Deregulation
by
T.G. MacAulay, K.M. Owen and C.J. O’Donnell
Department of Agricultural Economics The University of Sydney, NSW, 2006
and Department of Econometrics University of New England,
Armidale, NSW, 2351
Contributed paper presented to the 43rd Annual Conference of the
Australian Agricultural and Resource Economics Society Christchurch, New Zealand
20-22nd January 1999

Issues in Modelling the Australian Dairy Industry: Joint Products, Market Power
and Deregulation*
T.G. MacAulay, K.M. Owen and C.J. O’Donnell Department of Agricultural Economics The University of Sydney, NSW, 2006
and Department of Econometrics University of New England
Abstract
Keywords: spatial equilibrium models, joint production, market power, dairy This paper reports on an expanded and revised version of the spatial equilibrium model of the Australian dairy industry developed by MacAulay (1997). In the expanded version there is demand for five manufactured products. The transformation from bulk milk to final product is modelled by considering milk and dairy products in terms of their primary components, milk fat and protein. For market milk, a variable element was added to the margin to replicate the effects of market power in the processor to retail chain. Some implications for the deregulation of the Australian dairy industry are noted.
The dairy industry in Australia, like a number of industries, is subject to the requirements of the Hilmer reforms or National Competition Policy (Hilmer, Rayner and Taperell 1993). These reforms have required the review of legislation which restricts competition in various ways. Hilmer, et al (1993, pp 143-4 and p. 206) recommended that ‘There should be no regulatory restrictions on competition unless clearly demonstrated to be in the public interest’. As it is stated by the Industry Commission (1997):
Legislation (including Acts, Regulations, or Ordinances) should not restrict competition unless it can be demonstrated that:
* The financial assistance of the Dairy Research and Development Corporation is gratefully acknowledged as is the helpful advice of the members of the Steering Committee for the project of John O’Connor (chair), Helen Dornom, Peter Gallagher, Selywn Heilbron, John McQueen, and Chris Phillips. Helpful comments from Alistair Watson on the full report are also much appreciated.
2
2
(a) the benefits of the restriction to the community as a whole outweigh the costs; and (b) the objectives of the legislation can only be achieved by restricting competition.’
It is important to note that the test is seen as the overall public benefit. As Scales (1998) indicates, reforms in the Australian economy bring benefits to agriculture and reforms in agriculture bring benefits to the rest of the economy. He suggests that it is critical to “... get the institutional arrangements that guide the use of resources right.” In this context it is therefore important to assess the effects on the industries themselves of regulatory reform and also the benefits that flow from reforms in one industry to others. It is also likely that the sequence with which reforms are undertaken can influence the outcome and that where there is an imbalance of market power in one sector of the economy that there may be somewhat unexpected consequences. The work in this paper is about the first issue of the effects of reforms to dairy industry policies on the dairy industry. However, the dairy industry is not independent of other industries and, in particular, issues relating to the processing and retail sector are important. Some progress is reported in this area. The dairy industry is a complex industry with a diverse range of products, a wide range of technological requirements and a complex web of state and federal marketing and quality controls. The industry has had a long history of complex regulation. An excellent review of the policy environment for the Australian dairy industry can be found in Daniel and Bardsley (1993). Broadly, there are three main policy mechanisms from the point of view of determining market prices in the various states. These are price pooling for market milk and milk used for manufacturing purposes (Victoria, South Australia and Tasmania) and market milk quotas (New South Wales, part of Queensland, and Western Australia) which are transferable in varying degrees in the different states and retail price fixing. The third mechanism of price determination, particularly for market milk, is implemented through control of the supply of milk by regulatory authorities in each state. Some deregulation of retail price controls has taken place and is continuing. At the national level the current arrangements involve a Domestic Market Support Scheme (Australian Dairy Corporation 1997). This involves the collection of a levy of about 1.9 cents per litre (1997/98) on milk consumed domestically as drinking milk and a levy of about 3.8 cents per litre paid by manufacturers on the milk used in the production of manufactured products. Milk used for products exported is exempt from the levy. The levies are actually calculated on the fat and protein contents of the milk used. The money raised from the levies is then paid as a domestic market support payment to farmers who supply milk for manufacturing purposes at a rate of about 1.7 cents per litre for 1997/98. This scheme is scheduled to terminate by June 2000. Given this context, it is important for the industry to determine, as far as possible, both the nature and extent of the effects of deregulation on its members. This is particularly necessary if it is to have on hand sufficient information to arrive at informed decisions on

3
3
regulatory change. This paper is about the details of the construction of a spatial equilibrium system for examining the effects of removing the regulations indicated above. Dairy Industry Deregulation Process Under the National Competition Policy reforms the dairy industry de-regulation is being considered on a state by state basis. This is, in part, because the major regulatory mechanisms for the dairy industry still in need of reform are under state legislation. The process in each state varies but essentially some form of enquiry process is used to carry out an examination of the net benefit test with recommendations being made to state governments. The state governments then decide on whether or not deregulation is carried out or the regulation continued for a period of time. Reviews have been completed in New South Wales and Queensland and the New South Wales government has decided to continue the farm level regulation of the industry. Retail level deregulation in New South Wales was implemented on July 1998. Reviews in Tasmania and Western Australia are under way with the Tasmanian government having indicated that it will not deregulate. In Victoria consultants are in the process of being chosen to carry out a review and a report is expected in May 1999. There are indications that processors in Victoria are in favour of deregulation and also possibly producers (Story 1998). In 1997 Victoria had about 90 per cent of its production was used for manufacturing purposes while in New South Wales it was over 50 per cent. These differences are likely to influence views about reforms. Effects of deregulation Although it is difficult to untangle the cause and effect, there are now studies and casual observations that when the retail end of the regulatory chain is deregulated for market milk, at least in the near term, retail prices stay the same or rise rather than fall as would be expected. Work by O’Donnell and Coelli (1997) and O’Donnell (1999) reflect this result in econometric work. In Victoria, retail prices for market milk increased from $1.10 pre deregulation to $1.35 post deregulation (Richards 1997). In the more recent case of New South Wales and the July 1 1998 deregulation a one litre milk carton (branded) went from $1.16 to $1.19 per litre (Story 1998). Similar results are reported to have occurred in other countries also. These observations could have a variety of causes but one real possibility is that the processing and retail sectors are sufficiently concentrated that through the use of market power the potential beneficial effects of competition are negated. An alternative view might be taken that a new and different set of services is being attached to market milk in the deregulated environment and that consumers are willing to pay for this added value. A third possibility is that with regulation, the retail and processing sectors were not fully compensated for the goods and services actually provided and were therefore cross-subsidising consumers who purchased market milk. Adjustment and compensation Following on from the possibility that full deregulation of the Australian dairy industry will occur over the next few years there is the important question of how the industry will

4
4
adjust to such changes? Rapid change can be expensive and particularly where assets become redundant. From a survey of dairy farmers in New South Wales, NSW Dairy Farmers’ Association (1997, pp. 3-4) suggests that for a 10 cent/litre fall in the price there would be a 10 percent fall in production with 29 per cent of farmers leaving dairying. Amongst the recorded responses were reduced reliance on purchased feed, increased production, reduction of labour and other costs, reduction of production levels, exit from the industry and changing the seasonal pattern of production. Such a survey can only record intentions and may be subject to a number of biases. What is reflected is that there will be a considerable range of responses to a significant price fall and it is clear that some of the responses will take time to implement. Compensation for change is, in effect, about the equity of sharing the cost of change. Various welfare criteria involve the notion of compensation in reaching Pareto optimal states. However, compensation is not easily dealt with in standard economic theory. Issues of compensation for the required adjustments on deregulation are being discussed within the dairy industry. In the case of an immediate removal of regulation in the quota states there will be a loss of the value of the quota as an asset that is either tradeable or included in the value of other fixed assets. There is also the loss income that is likely from the reduction in the farm level price of market milk. These changes can be directly attributable to the deregulation. However, it is also possible to argue that producers have been the beneficiary of higher income streams and a greater asset value than others who are not the beneficiaries of such regulation. Equity of treatment is a difficult issue and made more difficult when it is recognised that people have different preference systems and value monetary compensation in different ways (Baumol 1982). The issue of compensation is not dealt with in this study other than to note that the modelling work described below can contribute to an assessment of the effects on the industry of deregulation and thereby act as an input into discussions and debate on compensation Market Power Although, as indicated above, the expression of market power may not be the only possible reason for the failure of retail prices to fall when deregulation takes place it is worthwhile exploring the hypothesis and testing the effects within a modelling system. Holloway (1991) has examined the farm-retail price spread in the context of an imperfectly competitive food industry. He uses the idea of conjectural variations (Kamien and Schwartz 1983). Varian (1984, p.102) shows how conjectural variations is a generalisation of three different types of oligopoly. Consider an industry of n firms facing a demand of (1) Y = D(p, Z1) and a milk input supply function of (2) Y = S(w, Z2)

5
5
where Y denotes the quantity demanded and supplied of a product such as market milk, p
is the output price, w the input price, and Zi a set of shifter variables. The industry output
of Y is made up of the contributions of the output, yi, of the n firms, so
(3) Y = i yi (i = 1, ..., n) . Each firm forms a conjecture about the relationship between the aggregate industry output and its own output level, thus
(4) Y = Ki(yi) . The elasticity of industry output conjectured by firm i can be expressed as:
(5) i = (Y/yi) (yi/Y) Consider a firm which buys milk from producers and then markets the milk at retail so that
the volume purchased is the same as the volume sold, Y. Thus the profit, i, for the oligopolistic firm with market power on both the output and input markets is (modified from Varian 1984):
(6) i = p(Y) yi - w(Y) yi - Ci (yi ) where p is the industry output price that is a function of industry output (an inverse demand function), w the input price, also a function of industry output (an inverse supply
function) because of the special case of milk, and Ci(.) the firm’s cost function.
Taking the derivative with respect to yi and dropping the functional notation on prices then the first-order condition for profit maximisation is:
(7) p + yi p/Y (dY/dyi) - w - w w/Y (dY/dyi) - Ci’(yi) = 0 or
(8) p + yi p/Y (dY/dyi)(p/p)(Y/Y) - w - w w/Y (dY/dyi)(w/w)(Y/Y) - Ci’(yi) = 0 or
(9) p (1 + i/) - w (1 + i/) - Ci’(yi) = 0
where i is the conjectural variation elasticity of (dY/dyi)(yi/Y), C’(yi) the marginal cost, is the elasticity of demand and the elasticity of the factor supply function faced by the market milk processing firm. Equation (9) is the marginal revenue equals marginal cost condition for the firm modified by the conjectural variation elasticity and is similar to the form of equation used by Holloway (1991). It is worth noting that the same conjectural parameter applies both on the output and the milk input for the firm. Equation (7) can be rearranged to represent a price spread equation by using the demand and supply function slopes:

6
6
(10) p - w = Ci’(yi) - iY/(Y/p) iY/(Y/w) where the terms, p - w, on the left of the equation is the price spread for market milk, and the demand slope is Y/p, and supply slope is Y/w. O’Donnell (1999), using a similar but more general form of equation (10), estimated sets of coefficients under regulated and deregulated situations with historical data covering both regulated and deregulated time periods in the different states. Using these coefficients it was possible to estimate the shift in the price spread that would be expected under deregulation. In carrying out the analysis, O’Donnell (1999) also determined that the there was little in the way of expression of market power in the price spreads for manufactured products but that there was expression of market power in the case of retailer carton milk sales to consumers. In addition, he found that the carton-milk processors also possessed market power in the sale of market milk to retailers and in the purchase from farmers. Joint Products and Price Spread Estimation Having obtained an estimate of the possible effects of deregulation on the price spread between the farm-level price and the retail price it was necessary for the purposes of model building to have a consistent set of price spreads and physical transformation coefficients between bulk milk at the farm level and the retail/wholesale products. A number of alternatives to obtaining the price spreads were investigated including an economic engineering approach, a survey approach and further econometric estimation using a somewhat differently specified product set and time periods. The economic engineering approach and the survey approaches seemed that they would be expensive in terms of time and volumes of data needed and would not necessarily reflect the outcomes as measured in the published statistical data on the industry. Further, significant confidentiality problems were expected with the survey approach. The econometric approach would allow historical data to be used but posed significant technical challenges with estimation in obtaining solutions for the system of equations built into the spatial equilibrium model. Finally, it was recognised that a set of simultaneous equations could be constructed which would allow the simultaneous determination of the necessary price spreads based on the market prices and the product compositions used in the modelling work. This approach also allowed for inclusion of the effects of joint products produced from the various manufacturing processes. Within the dairy industry there are four main manufacturing processes of butter/skim milk, butter/casein, wholemilk powder and the cheddar process. Each process produces products jointly with reasonably stable product compositions. The basic components of the products are fat, protein and other solids (note that solids non fat includes protein). The product compositions are illustrated for New South Wales in Figure 1. Within spatial equilibrium models there is a set of ‘arbitrage conditions’ or price relationship which match with the physical flows of the goods. From the revised dairy spatial equilibrium model developed in this work a set of nine equations with nine unknowns describes the set of price relationships for milk and dairy products within each state. These equations are based on the fat and protein contents of the products.

7
7
Figure 1 Product compositions, price spreads and prices for New South Wales, 1996-97 Illustrated below is the set of equations for New South Wales. Equation (11) requires the weighted price of the fat, APFAT, and protein, APROT, inputs to equal the retail price of market milk, ADP. The prices for fat and protein are internal prices to the model and therefore must also be derived in the solution of the simultaneous equations. Equation (12) links the weighted fat and protein prices to the farm level demand price, CDP, and the price spread, MM, for market milk, including the milk levy and the shadow price on the market milk quota, QP. Equation (13) equates the farm level bulk milk price, CDP, to the sum of the domestic market support payment, DMSP, and the weighted prices of market milk fat and protein (APFAT and APROT). Equations (14) to (17) specify the relationships between price spreads for butter, skim milk powder, wholemilk powder and cheese (BM, SM, WM and CM) plus the levies for these products (BLEVY, SLEVY, WLEVY, HLEVY), and the weighted prices for manufacturing fat, BPFAT, and protein BPROT and the retail/wholesale prices (BDP, SDP, WDP, HDP). As well, the shadow value of the by-product constraint, BYPRD is included. This constraint requires that butter, which is produced in each of the four manufacturing processes is in a given ratio to the other products. When this constraint is effective then

8
8
BYPRD has a value. For the purposes of a solution to this system of equations it was not set as binding but assumed to be at least satisfied in the historical data. Equations (18) and (19) specify that the market milk fat price, APFAT, and the manufacturing milk fat price, BPFAT, are set by processors at 35 per cent of the value of the milk. The 35/65 ratio is essentially a rule-of-thumb in the dairy industry based on a general assessment of the value of fat and protein in the various products. A check against prices paid to producers in New South Wales and Victoria indicated that it was a reasonable rule to impose (Personal communication with staff of the Australian Dairy Corporation). This rule was required in order for the fat and protein prices to be separately determined. (11) ADP - 0.032*APFAT - 0.032*APROT = 0, (12) – QP + 0.032*APFAT + 0.032*APROT + (0.0398-0.038)*BPFAT = CDP + MM + MLEVY, (13) DMSP + 0.0398*BPFAT + 0.032*BPROT = CDP, (14) BDP – BYPRD - 0.805*BPFAT - 0.007*BPROT = BM + BLEVY, (15) SDP + 0.50633*BYPRD - 0.01*BPFAT - 0.36*BPROT = SM + SLEVY, (16) WDP + 0.06942*BYPRD - 0.26*BPFAT - 0.27*BPROT = WM + WLEVY, (17) HDP + 0.03106*BYPRD - 0.33*BPFAT - 0.25*BPROT = CM + HLEVY, (18) 0.0398*APFAT = 0.35*(CDP + MM + MLEVY), (19) 0.0398*BPFAT = 0.35*CDP The full set of equations was solved using Mathematica (Wolfram 1996) to determine the price spreads for New South Wales and the implicit prices for milk fat and protein inputs for market milk and for manufacturing milk (solution variables are shown in bold).

9
9
Table 1
Parameter and Solution Values for the Price Spread Equations, New South Wales, 1996-97
Label Variable Setting or solution
Parameter values ADP Market milk price ($/litre) 1.15 CDP Bulk milk price ($/litre) 0.24 BDP Butter price ($/kg) 3.68 SDP Skim milk powder price ($/kg) 2.61 WDP Wholemilk powder price ($/kg) 6.20 HDP Cheese price ($/kg) 7.66 BYPRD By-product constraint 0 MLEVY Market milk levy ($/litre) 0.0180 BLEVY Butter levy ($/kg) 0.2699 SLEVY Skim milk powder levy ($/kg) 0.2838 WLEVY Wholemilk powder levy ($/kg) 0.2958 HLEVY Cheese levy ($/kg) 0.3032 QP Quota imputed price ($/litre) 0.267 DMSP Domestic market support payment ($/litre) 0.017 S Pooling subsidy (for pooling states) 0.00 T Pooling tax (for pooling states) 0.00
Solution values APFAT Imputed price of market milk fat ($/kg) 7.80 APROT Imputed price of market milk protein ($/kg) 26.68 BPFAT Imputed price of manufacturing milk fat ($/kg) 2.14 BPROT Imputed price of manufacturing milk protein ($/kg) 4.40 MM Market milk price spread ($/litre) 0.63 BM Butter price spread ($/kg) 1.66 SM Skim milk powder price spread ($/kg) 0.72 WM Wholemilk powder price spread ($/kg) 4.16 CM Cheese price spread ($/kg) 5.55 Results similar to those in Table 1 were generated for each state and the values for the price spreads used within the spatial equilibrium model. This technique, based on the structure of the price relationships in the spatial equilibrium model has allowed a set of price spreads to be derived which are consistent with the historical data and the product composition coefficients used within the model. The construction has involved the use of implied fat and protein prices which are not readily available in the historical data and not consistently available across states. The use of the implicit prices and the associated quantities has made modelling the system of joint products much simpler than using the milk equivalent of the manufactured products. Modelling Structure The nature of Version II of the spatial equilibrium model of the Australian dairy industry is outlined much more fully in a forthcoming technical report being published by the

10
10
Australian Dairy Research and Development Corporation. Some of the following sections are abstracted from the report. Detail on some of the techniques used in Version I of the model were documented in MacAulay and Richards (1998) and particularly the formulation of quota systems, price pooling and the all-milk levy and domestic market support payment. Details of the formulation of spatial equilibrium models was also given in the paper. An overview will be provided in this section. The basic structure of the spatial equilibrium model of the Australian dairy industry can be envisaged as a network of product flows in bulk milk, market milk and manufactured products. The direction and volume of these flows is determined by the incentives to trade at various points throughout the system; the most basic of these being the trade in market and manufacturing milk between the producers and processors or manufacturers. For the purposes of modelling, the industry is considered to comprise seven regions: New South Wales (including ACT), Victoria, Queensland (including Northern Territory), South Australia, Western Australia, Tasmania and ‘Rest of the World’. Within each region there are producer, processor, and manufacturing sectors and demand for seven products: bulk and market milk, butter, skim milk and buttermilk powder (SMP/BMP), wholemilk powder (WMP), cheese and ‘other milk fat and protein’1. The model has bulk and market milk trade between states but trade in manufactured products is explicit only with the rest of the world as imports or exports (an approach required because there is no interstate trade data for manufactured products). Thus, the model is essentially a six-product model with one raw material and five final products processed from the raw material. Figure 1 is a graphical depiction of the model which illustrates the flow and conversion of bulk milk to the five products. Also depicted are the Domestic Market Support Payment Scheme (DMS), levies and payments that applied over 1996/97. Underlying the model are a number of assumptions as to the behaviour of producers, consumers and processors or manufactures. The more important of these are: 1. Linear supply and demand functions are taken as a reasonable approximation for
representing the decision-making behaviour of producers and consumers when prices and quantities of products change.
2. The production and consumption of milk and dairy products is concentrated at one
point within a state. These points are of little interest other than that they determine the size of the transfer cost between states.
1 Because of data restrictions, by-products such as whey powder and casein and other forms of milk processing (icecream, yoghurt, etc) are not made explicit in the model. They are identified as demand for ‘other’ products. For similar reasons, UHT milk is included in market milk.

11
11
Figure 2 A diagrammatic representation of the dairy model: Version II

12
12
3. There are sufficient players in the market for milk and dairy products to ensure that, if and when trade is free between the states, the difference between the prices between states that trade with each other will be equal to the transfer costs (transfer costs include transport costs plus the logistical, handling and information costs involved in the transfer of products).
4. Market milk and manufacturing milk substitute perfectly for each other so that when
market milk regulations are removed such milk may be freely used in either manufacturing or market milk end-uses. Also, the milk of one state is a perfect substitute for the milk of another state, that is the products are perfectly homogeneous and thus can be readily traded between regions;
5. It is sufficient for the processing, distribution and retail sectors to be treated as one
sector and represented by a single price spread for each state; 6. The price spreads for dairy products are assumed to stay the same for all policy
scenarios, except for market milk. Market milk price spreads have an added component under deregulation to reflect the presence of market power in the processing to retail sectors. The component was calculated according to econometric work completed by O’Donnell (1998) and is discussed later in the report.
The specification of supply and demand The supply and demand elasticities used in the model are outlined in Table 2. They are based on the evidence of various studies including Lembitt and Hall (1987), Davidson et al (1989), and Daniel and Bardsley (1993) who provide an extensive review of elasticity estimates, and represent the medium term responses (2-3 years) that are expected to apply under deregulation. Estimates for market milk were from Daniel and Bardsley (1993) and for butter and cheese for New South Wales, Victoria and Queensland were from Davidson et al (1989). Estimates for bulk milk supply were revised downwards from the value of 1.5 used by Daniel and Bardsley (1993) following discussions with industry specialists. For the other products and states, estimates were also made following consultation with various specialists. Further work is desirable to better establish the magnitude of the demand elasticities, particularly those for dairy products at state level. However, small adjustments in their level did not significantly change the outcomes from the model. The reason is that the elasticities largely determine the slopes of the functions around the price and quantity points. For export demands, an elasticity of -10.0 was assumed for each of the manufactured products given the relatively small size of Australia in the world dairy market. Higher values have little effect on the solution. The supply and demand functions for input to the model were derived using the indicated elasticities and prices and quantities as observed for 1996/97 (see Table 2). Farm gate to retail price spreads The farm gate to retail price spreads were separated into two components with the first component representing the costs and profits implied in the price relationships between products over 1996/97. This component remained fixed for all policy scenarios. The second component designated as a variable component to reflect the effects of market power was added to the fixed price spread when a state was deregulated.

13
13
Table 2
Elasticities, Price and Quantitya Points and Derived Supply and Demand
Equations, 1996/97 NSW Vic Qld SA WA TasElasticities Market milk demand -0.15 -0.15 -0.15 -0.15 -0.15 -0.15
Butter demand -0.77 -1.20 -2.38 -0.80 -0.80 -0.80
Skim milk powder demand -0.20 -0.20 -0.20 -0.20 -0.20 -0.20
Wholemilk powder demand -0.40 -0.40 -0.40 -0.40 -0.40 -0.40
Cheese demand -0.57 -0.49 -0.78 -0.50 -0.50 -0.50
Bulk milk supply 0.80 0.90 0.80 1.30 0.80 1.00
Price points (retail except where indicated) Market milk demand ($/l) 1.15 1.28 1.15 1.17 1.27 1.23
Butter demand ($/kg) 3.68 4.04 3.50 3.30 3.90 4.22
Skim milk powder demand (whsle, $/kg) 2.61 2.48 2.49 2.29 1.89 2.39
Wholemilk powder demand ($/kg)b 6.20 6.60 6.80 6.56 6.80 7.41
Cheese demand ($/kg) 7.66 7.08 7.04 6.40 6.12 6.54
Bulk milk supply (farm level $/l) 0.26 0.24 0.24 0.22 0.24 0.21
Quantity points Market milk demand (+UHT) (mill l) 640.46 458.51 382.38 177.79 206.37 51.39
Butter demand (000 t) 3.70 23.86 3.91 0.19 2.69 4.21
Skim milk powder demand (000 t) c 4.55 25.89 0.15 0.02 2.53 2.32
Wholemilk powder demand (000 t) 0.64 25.18 0.23 0.24 0.00 0.53
Cheese demand (000 t) 21.98 113.57 26.37 16.81 8.69 9.43
Bulk milk supply (mill l)d 930.84 5299.68 759.52 460.74 293.54 457.21
Bulk milk supply (mill l) 1192.00 5633.90 797.00 535.00 349.00 529.00
Un-accounted milk use (mill l) 261.16 334.22 37.48 74.26 55.46 71.79
Intercepts Market milk demand 8.82 9.80 8.82 8.97 9.70 9.39
Butter demand 8.46 7.41 4.97 7.43 8.78 9.50
Skim milk powder demand 15.66 14.88 14.94 13.74 11.34 14.34
Wholemilk powder demand 21.70 23.10 23.80 22.96 23.80 25.94
Cheese demand 21.10 21.53 16.07 19.20 18.36 19.62
Bulk milk supply -0.07 -0.03 -0.06 0.05 -0.06 0.00
Slopes (zero quantities give zero slopes)
Market milk demand -0.01 -0.02 -0.02 -0.04 -0.04 -0.16
Butter demand -1.29 -0.14 -0.38 -21.94 -1.82 -1.25
Skim milk powder demand -2.87 -0.48 -82.45 -673.53 -3.74 -5.16
Wholemilk powder demand -24.22 -0.66 -75.56 -67.77 -5666.67 -34.95
Cheese demand -0.61 -0.13 -0.34 -0.76 -1.41 -1.39
Bulk milk supply 0.0002 0.000005 0.0003 0.0004 0.0008 0.0004 aQuantities were adjusted from Australian Dairy Corporation data to ensure balancing of totals and stocks.
State data for manufactured products were estimated by proportionate allocation of national consumption estimates. Under- and over-estimates occur due to a lack of information on interstate trade. bFor wholemilk powder, Queensland and South Australia have assumed prices of $6.80/kg.
cFor skim milk powder in South Australia 0.017 000t was assumed.
dAdjusted for unaccounted product.
Sources: Prices for market milk are from data provided by the Australian Dairy Corporation and a report by the Centre for International Economics, 1998; prices for manufacturing milk are from the Dairy Compendium, 1997.

14
14
The two components are indicated as Mij (fixed margin for each region i and product j) and VM (the variable margin). The fixed component of the price spreads was estimated using equations (11) to (19) for each state. The source for the values of the variable component was the work completed by O’Donnell (1999) who used the following more general form of equation (10):
(20) mj = aj + [k1
K
cjkzkt ] + [jQjt] + [j1DtQ1t/w1t] + [m 2
5
jmQmt/wmt ] + vjt j = 1, ... , 5.
(1) (2) (3) (4) Where the key elements or terms in the equation are: mj = margin (price spread), j refers to the product, k to the non-dairy inputs and m to products other than bulk milk. In the case of perfect competition j , j1 and jm would all
equal zero and the margin would equal term (1). Term (1) = the sum of the prices of processing and/or marketing inputs. Term (2) = the contribution to the price spread of market power in the output market in a
regulated state. Term (3) = the change in the price spread when the processor-farm gate market is
deregulated (Dt = 1). Term (4) = the sum of the prices of all dairy inputs to the process other than bulk milk,
including the possibility of market power in the purchase of an input (jm =
jm xjm, where 0≤ xjm≤1 and is an index of the level of market power
in the purchase of the input with zero reflecting perfect competition and a value of 1.0 monoposony).
Equations for all five dairy products were estimated using Australian Bureau of Statistics and Australian Dairy Corporation data from September 1986 to June 1997. Of the five dairy products examined by O’Donnell, only in the case of the market milk equations were there indications of the presence of market power, both in the retail sale of milk to consumers term (2) and in the purchase of bulk milk by processors, term (3). The element of interest for the spatial model in determining the price spread change in moving from a regulated to a deregulated state is term (3). The remainder of the equation was not used because the method for calculating the fixed spreads that was outlined above provided a simpler, more direct method for the calculation of the state-based price spreads. Using the results for term (3) (O’Donnell 1999, Table 3) the variable component is:
(2) VM = 4.3917*Q1/w1

15
15
where Q1 is the quarterly quantity of bulk milk and w1 is the price of bulk milk and VM is in cents/litre. Under the regulated scenario, term (3) in equation (1) is zero. When the farm prices are deregulated, term (3) in equation (1) comes into play since (see Table A.2). Since Victoria had deregulated the retail milk pricing the variable margin for Victoria was set to zero and in the case of New South Wales $0.27 per litre was high relative to the other states and so for the reported scenarios half the value was used. Experiments were carried out with the full value. Adjustment for exporting costs The final element of the model that is affected by the price spreads is exports to the rest of the world. It was assumed that for the rest of the world (region 7) the exports were in manufactured products and that the export demand was at the same market level as the product in Australia. Thus, the positioning of the export demand for the rest of the world was based on the price for manufactured products in Victoria plus 2.0 cents/litre for exporting costs. Interstate and international trade in milk and dairy products For the purposes of modelling it was assumed that trade in milk is confined to interstate movements of bulk and packaged milk (regions 1-6). No rest of the world trade in either bulk or market milk was specified. It is, however, recognised that small quantities of UHT milk are exported but these were ignored. In Table A.3, estimates of milk production, use and trade (including UHT) are outlined for 1996/97. Victoria is the largest exporter followed by South Australia. Although it is possible that the figures underestimate the actual level of trade, particularly in UHT, these were taken as indicative of current interstate trade.
Trade in manufactured products was modelled only between the particular state and the rest of the world. The reason for this is that data on interstate trade for manufactured products are not available. The implication of confining trade in this manner is that a state can only consume its own manufactured production, export, or import products from the rest of the world (or implicitly from other states). Imports of manufactured products were not included in the calculations of the use of manufacturing milk and therefore existing imports were not assumed to change or play a role under deregulation. However, allowance was made for the possibility of imports from the rest of the world if it was economic to import in addition to the existing imports. Transport and transfer costs The transport costs used in the model are reported in Tables A.4 and A.5. Transport costs for bulk milk were based on the estimates by the NSW Dairy Farmers’ Association (MacAulay 1997). Transport costs for refrigerated dairy products were assumed to be identical to those for packaged milk. This assumption is based on the similar conversion rate for liquid milk (bulk) to milk weight (1.0297) and on discussions with industry members. Estimates for the cost of refrigerated and dry dairy products were provided by Refrigerated Roadways and adjusted to provide a per kilogram/litre rate.

16
16
The rest of the world region was considered to be 'delivered to port' in Victoria. This implied that shipment costs to export were higher in all other states by the amount of the price differences in the manufacturing price in the particular state compared to Victoria. A small amount of 2.0 cents/litre was added to this set of data to account for the extra costs involved in exporting (Table A.5). Exports were represented as being at the retail/wholesale level as in the rest of the model. Policy parameters: levies and quotas In those states where there is price pooling the producer price is determined in the model by applying implicit subsidies or taxes at rates that allow the average producer price to be calculated (MacAulay and Richards 1998). These rates are determined within the model. In those states using quotas the supply response is determined by the manufacturing milk price as the marginal price to which producers respond. Victoria, South Australia, and Tasmania are all states that have employed price pooling so that the average producer price is weighted according to the shares of production used for market milk and manufacturing milk. It is assumed that producers in the pooling states respond at the margin to the pooled price. When there is only a quota and no pooling of returns, as in New South Wales, Queensland and Western Australia, producers are assumed to produce any additional milk at the manufacturing price. However, they also gain additional revenue from the higher priced market milk, as well as the benefit of an asset in the form of tradeable quota rights where quotas are tradeable (this value is reflected in the shadow value of the quota). Where quotas are not tradeable then the value will be reflected in the value of the fixed assets. In the model, the market milk producer price is largely determined by quota levels in New South Wales, Queensland and Western Australia while, in Victoria, South Australia, and Tasmania prices are the calculated pooled price. The data provided in Table A.6 give the structure of the price relationships represented in the model, including the effect of the Domestic Market Support levies and payments.
Supply Response under Deregulation Since deregulation is likely to change the nature of the supply response of producers such change also needs to be incorporated into the experiments that are carried out with the model. The nature of supply response changes under deregulation is clearly complex and not easy to predict. However, there are some effects that will be apparent. These are summarised from MacAulay and Richards (1998). With deregulation of the market milk sector in states with tradeable market milk quotas, such as New South Wales, removal of these quotas immediately implies the loss of a tradeable asset. This asset when sold implies an economic return at the time of sale of the quota. This return can conceptually be considered as equivalent to an annual income flow that would be needed to produce the equivalent of the value of the quota asset. If there is a perfect tradeable quota market then the extra annual returns generated for farmers as a result of quotas on the market milk market, compounded for the expected life of the quota,

17
17
will be the value of the quota. If the asset loses its value as the result of deregulation then that implicit income stream is lost. A second, and more direct effect, of deregulation in quota markets is the effect from changing the average returns received by farmers. Under regulation in quota states the average return per litre of milk is raised above the marginal return. This is because there is a payment for market milk that is above the price at which the industry sells additional units of milk which is, in effect, the manufacturing milk price. Given that the milk produced by a farmer is perfectly substitutable between use for market milk or manufacturing purposes there is no way to physically separate the two end uses. With removal of the market milk restrictions there is no longer a technical distinction between market milk and manufacturing milk so that the return paid to producers will be the average for all milk used. However, this may include premiums for off-season or secured supply market milk. This return will also be the marginal return on which producers base their supply response decisions. With a fall in the average return as a consequence of deregulation, producers who have average variable costs above the new average market return will no longer find it profitable to stay in dairy production or will need to reduce their costs. This may be through a more seasonal pattern of production or other cost or efficiency adjustments but the most likely effect will be a reduction in aggregate production. Thus, in the quota states there is likely to be a shift to the left of the supply function (more detail is given in MacAulay 1997). In the pooling states, the situation is different since a price pooling system is used to average the returns from the market milk market with those from the manufacturing milk. A producer's share of the returns from the two markets is proportional to the aggregate requirements for market milk and manufacturing milk. Under deregulation it is uncertain as to how the supply response curve may shift. If the value of the most fixed of the assets, land, falls it may be that there will be a slight expansion of the industry as land is a little cheaper. On the other hand, the fall in producer returns may make dairy overall less attractive relative to other enterprises and lead to a decline in production. However, it is likely that the response will be gradual and take some time. Thus, in the pooling states in the short term it is likely that there will be little shift in the supply response. Given the position of a particular supply response function then the solution from the model will be positioned at some point on that supply function. The model does not have the capacity to internally determine changes in the number of producers but changes in production can imply changes in the number of producers and/or production per farm. The equivalent of a change in producer numbers is effected in the model by shifting the supply functions for each state by an appropriate amount. The estimated shifts used in the scenarios were based on farmer surveys conducted by consultants, Steve Spencer of Whitehall Associates and Rosemary Richards of Bowman, Richards and Associates for the various state dairy authorities over 1997/98. To construct the deregulation scenarios it was assumed that in Victoria and Tasmania the existing supply function position would be retained in the short to medium term. The removal of regulations would imply simply moving up or down the existing supply function in response to a price change with little change in the number of producers. Among the states with quotas, and for South Australia, producer response was modelled by a shift in the quantity positioning point for the supply functions. The assumption in

18
18
this case was that a number of farmers would leave the industry because the average returns will no longer be high enough to stay in dairying. In New South Wales, the production point was assumed to move to the left by 9 per cent, in Queensland by 4 per cent2, in Western Australia by 15 per cent, and in South Australia 5 per cent. These reductions represent the net response of farmers in a state to a price drop in market milk of 10 cents in New South Wales and of 5 cents in Western Australia and Queensland. The 5 per cent shift to the left in South Australia was used because of the high proportion of market milk in the production of that state compared to Victoria and Tasmania. Policy Scenarios Three broad sets of policy scenarios were modelled to determine the likely impact on the dairy industry of different sequences of deregulation, and under different industry conditions post-deregulation. These are discussed in greater detail later and include the effects on policy outcomes of: 1. Different sequences of deregulation, commencing with:
• removal of Victorian state regulation only; • removal of state regulation in all pooling states (Victoria, Tasmania and South
Australia); • removal of state regulation in all pooling states and removal of the DMS scheme; • removal of all state regulations; and • removal of all state regulations and the DMS scheme.
2. A premium on market milk remains subsequent to full deregulation. 3. A 5 per cent increase or decrease in international prices for manufactured products. The scenarios included:
• removal of all state regulations; and • removal of all state regulations and the DMS scheme.
In interpreting the results, the emphasis is on the direction and relative changes across outcomes and between states. The model is a stylised and static depiction of the dairy industry and, as such, cannot capture the dynamics of industry change. The base case The base case scenario is a representation of the industry as it was in 1996/97 (see Tables 3 and 4). It is the reference point for analysing the policy scenarios. The base scenario includes all the policy interventions that applied in each state including quota restrictions, price pooling, the all-milk levy and the domestic market support payment. Validation and verification of mathematical programming models is difficult as in most cases there will be only a limited number of variables against which the performance of the model can be tested. A review of the results (Tables 3 and 4) against the data tables
2 In the surveys the shift was 5 per cent but using this in the model resulted in negative quantities of unaccounted milk use.

19
19
(parts of Tables 2 and A.3) reflects close agreement for most variables between the results from the model and the historical data on which it was based. Extensive testing was carried out in the construction phase of the modelling work to ensure the model functioned in appropriate ways and gave results reasonably close to the historical data. Despite slight differences in absolute magnitude, the relative quantities for bulk milk and market milk consumed are virtually identical. The greatest difference in relative contribution is in Victoria where milk consumed is slightly higher, resulting in a decrease in manufacturing contribution from 72 to 69 per cent. The difference between the original and base scenario in prices is due to the effects of approximations in transport costs and the size of the imputed farmgate-to-retail price spread in each state. Trade from both New South Wales and Queensland has forced the price in Victoria down to some extent. This has resulted because of their lower processing to retail spreads in New South Wales and Queensland and the asymmetry in transport costs that favours these states. From consideration of a number of solutions it is also clear that there is an interaction between the price spread and the transfer cost. With large differences in the price spreads then it may become worthwhile to transfer the bulk milk to a low-cost processing state (that is a low price spread) and ship the market milk back as a processed product. Changes to the processing/manufacturing price spreads, as indicated above, can change the location of the market milk processing. For manufactured products there is only the possibility of importing or exporting. Thus, shifts in the direction of trade are not so dramatic as the price spread is changed. However, states can change from importing to exporting as the price spreads are changed. In working with the model it is clear that the results are very sensitive to certain transfer cost rates and also to the price spreads included in the model. Since there is considerable uncertainty about the actual costs and profits made in the processing of market milk and manufactured products this is an area in need of further work. If very similar technologies are used in each of the states then it is likely that the price spreads will also be eventually fairly similar. If, however, monopoly profits can be obtained then the price spreads may differ significantly between the various states depending on the concentration of the processing sector. Also, with processing operations becoming national in scope there may also be further complications in the interactions between the price spreads and the trade in products.

20
20
Table 3
Base Case Results for Product Production and Trade Quantities NSW Vic Qld SA WA Tas Aust
Milk production (mill l) 1323.1 4927.2 776.4 474.6 476.4 541.9 8520
Market milk sales and trade
From/To
NSW 589.6 4.9 595
Vic 518.7 519
Qld 1.8 375.6 0.8 378
SA 173.5 174
WA 0.5 192.5 193
Tas 0.0 59.0 59
Total 590 525 376 175 192 59 1917
Net market milk trade (exports+/ imports-) 5 -7 3 -1 1
0 0
Bulk milk supply and trade
From/To
NSW 1323.1 1323.1
Vic 4927.2 4927.2
Qld 776.4 776.4
SA 474.6 474.6
WA 476.4 476.4
Tas 541.9 541.9
Total 1323.1 4927.2 776.4 474.6 476.4 541.9 8519.6
Net bulk milk trade (exports+/ imports-) 0 0 0 0 0
0 0
Manufacture milk (mill l) 728.5 4408.5 398.3 301.0 283.4 482.9 6603.0Butter consumed ('000 t) 3.7 25.4 3.3 0.2 2.5 4.2 39.3SMP consumed ('000 t) 4.5 25.7 0.2 0.0 2.5 2.2 35.2WMP consumed ('000 t) 0.6 25.2 0.2 0.2 0.0 0.6 26.9Cheese consumed ('000 t) 22.5 114.2 26.8 16.1 8.1 9.2 196.8
Table 4
Base Scenario Results for Product Prices
NSW Vic Qld SA WA Tas
Butter price ($/kg) BDPi 3.74 3.82 3.71 3.94 4.16 4.23
SMP price ($/kg) SDPi 2.70 2.58 2.49 2.68 2.76 2.76
WMP price ($/kg) WDPi 6.50 6.56 6.68 6.61 6.70 6.69
Cheese price ($/kg) HDPi 7.34 7.00 6.90 6.95 6.95 6.88
Market milk price ($/l) ADPi 1.21 1.17 1.20 1.11 1.29 1.23
Weighted average per unit return for producers ($/l)
0.41 0.23 0.40 0.38 0.40 0.29
Bulk milk price excluding quota value, marginal price ($/l) CSPi 0.28 0.22 0.21
0.32
0.32 0.26
Sequenced state deregulation In this set of scenarios the outcomes of different assumptions about the extent of deregulation are compared. The scenarios were constructed by removing the policy

21
21
arrangements from a selection of states and leaving all other arrangements in place, including the national all-milk levy and the domestic market support payments schemes. In constructing the deregulation cases the supply function in the quota states has been adjusted on the basis that as the average return approaches the marginal return a number of high cost producers will leave dairying for other activities or seek to produce at a lower average cost. The supply functions were shifted left in terms of the quantity points. The shifts should be seen as only one of many possible supply shifts. By adjusting the price-quantity points for the supply functions in this way a new equilibrium solution of the model will be established which is not necessarily close to the price-quantity points used to position the supply function in the base case. The effect of changes in supply falls principally on ‘other’ products. This result probably hinges on the fact that there is no network of trade linkages specified for the ‘other’ products. This means that there are no compensating changes required in other regions should there be a need to change the quantity or price so that there is less implicit cost in making such changes. This is clearly a limitation of the model and a result of the limited data available in this area. A summary of key producer and market milk results is presented in Table 5. 1. Deregulation in Victoria only (Scenario 1) The effect on producer revenue of removal of the pooling system in Victoria is negligible for all states except Victoria. Victoria experiences a 6.05 per cent ($64.9 million) fall in producer revenue which is a consequence of a 6.10 per cent fall in the price of bulk milk and a less than compensating increase in bulk milk supply (0.06 per cent). The effects on manufactured products are negligible with changes in prices and quantities of less than one per cent across the states. The primary impact of deregulation in Victoria is on the value of market restrictions in New South Wales and Queensland. In New South Wales the average per unit return to producers falls by 8.95 per cent (four cents per litre) and in Queensland by 6.4 per cent (3 cents per litre). Other states remain relatively unaffected. While the volume and direction of trade in manufactured products changes little under this scenario, inter-state trade in market milk ceases in New South Wales, Queensland and Tasmania but small volumes are now exported by Victoria to New South Wales, South Australia and Tasmania.

22
22
Table 5 Summary Results for Sequenced State and DMS Deregulation
Base New
Victoria dereg-ulate
s
Pooling states
deregulate but DMS retained
Pooling states
deregulate and DMS removed
All states deregulate
All states deregulate and DMS removed
Full dereg-ulati
on but market milk
premium
Victoria dereg-ulate
s (%change)
Pooling states deregulate but DMS retained
(% change)
Pooling states deregulate and DMS removed
(% change)
All states deregulate (% change)
All states deregulate and DMS removed
(% change)
Full dereg-ulati
on but market milk
premium (% change)
Scenario 1 2 3 4 5 6 1/base 2/base 3/base 4/base 5/base 6/base Producer revenue excluding the value of market restrictions ($m) CXi*CSPi NSW 365.23 365.57 365.78 342.66 330.80 309.68 309.81 0.09 0.15 -6.18 -9.43 -15.21 -15.17 Vic 1072.84 1007.98 1008.88 921.48 1015.43 927.08 927.73 -6.05 -5.96 -14.11 -5.35 -13.59 -13.53 Qld 166.13 166.32 166.44 152.96 160.64 147.34 147.43 0.11 0.18 -7.93 -3.30 -11.31 -11.26 SA 152.99 153.16 118.52 108.46 119.19 109.08 109.16 0.11 -22.53 -29.11 -22.09 -28.70 -28.65 WA 151.07 151.19 151.27 142.36 135.17 131.15 131.83 0.08 0.13 -5.77 -10.52 -13.19 -12.74 Tas 140.81 139.67 123.67 113.70 124.47 114.37 114.45 -0.81 -12.17 -19.25 -11.61 -18.77 -18.72Average per unit return for producers ($/l) ((CDPi+PQi)*CAi + CDPi*CBi)/CXi (i=1,3,5) or CDPi (i=2,4,6) NSW 0.41 0.37 0.36 0.36 0.28 0.27 0.27 -8.95 -10.77 -12.54 -32.46 -34.87 -34.85 Vic 0.22 0.20 0.20 0.19 0.21 0.20 0.20 -6.10 -6.06 -10.47 -5.74 -10.18 -10.15 Qld 0.40 0.37 0.37 0.38 0.21 0.20 0.20 -6.41 -6.41 -3.91 -45.74 -48.30 -48.28 SA 0.32 0.32 0.26 0.25 0.26 0.25 0.25 0.04 -18.75 -21.77 -18.55 -21.57 -21.55 WA 0.40 0.39 0.38 0.37 0.33 0.32 0.32 -2.29 -6.63 -8.51 -18.91 -20.22 -20.00 Tas 0.26 0.26 0.23 0.22 0.23 0.22 0.22 -0.87 -12.26 -15.87 -11.98 -15.63 -15.59Bulk milk price excluding the value of quota, marginal price ($/l) CSPi NSW 0.28 0.28 0.28 0.27 0.28 0.27 0.27 0.05 0.08 -3.45 -0.26 -3.81 -3.79 Vic 0.22 0.20 0.20 0.19 0.21 0.20 0.20 -6.10 -6.06 -10.47 -5.74 -10.18 -10.15 Qld 0.21 0.21 0.21 0.20 0.21 0.20 0.20 0.06 0.10 -4.51 0.40 -4.33 -4.29 SA 0.32 0.32 0.26 0.25 0.26 0.25 0.25 0.04 -18.75 -21.77 -18.55 -21.57 -21.55 WA 0.32 0.32 0.32 0.31 0.33 0.32 0.32 0.04 0.07 -3.16 2.81 1.14 1.43 Tas 0.26 0.26 0.23 0.22 0.23 0.22 0.22 -0.87 -12.26 -15.87 -11.98 -15.63 -15.59Bulk milk supply (Ml) NSW 1323.05 1323.60 1323.95 1285.65 1201.41 1166.31 1166.53 0.04 0.07 -2.83 -9.19 -11.85 -11.83 Vic 4927.18 4930.23 4932.19 4727.00 4947.30 4740.38 4742.02 0.06 0.10 -4.06 0.41 -3.79 -3.76 Qld 776.43 776.82 777.06 748.61 747.77 719.75 719.95 0.05 0.08 -3.58 -3.69 -7.30 -7.27 SA 474.56 474.88 452.46 430.01 453.92 431.43 431.61 0.07 -4.66 -9.39 -4.35 -9.09 -9.05 WA 476.45 476.62 476.73 463.61 414.68 408.94 409.91 0.04 0.06 -2.69 -12.96 -14.17 -13.97 Tas 541.93 542.27 542.49 520.17 544.23 521.70 521.89 0.06 0.10 -4.01 0.43 -3.73 -3.70

23
23
Table 5 (continued) Summary Results for Sequenced State and DMS Deregulation Base
New Victoria
dereg-ulates
Pooling states
deregulate but DMS retained
Pooling states
deregulate and DMS removed
All states deregulate
All states deregulate and DMS removed
Full dereg-ulati
on but market milk
premium
Victoria dereg-ulate
s (%change)
Pooling states deregulate but DMS retained
(% change)
Pooling states deregulate and DMS removed
(% change)
All states deregulate (% change)
All states deregulate and DMS removed
(% change)
Full dereg-ulation + market
milk premium
(% change)Scenario 1 2 3 4 5 6 1/base 2/base 3/base 4/base 5/base 6/base Market milk price ($/l) ADPi NSW 1.21 1.13 1.12 1.09 1.06 1.03 0.98 -6.70 -8.07 -10.34 -12.69 -14.96 -18.95 Vic 1.17 1.04 1.04 1.01 1.04 1.01 0.97 -10.91 -10.91 -13.27 -10.85 -13.23 -17.29 Qld 1.20 1.15 1.15 1.15 1.02 0.99 0.95 -4.33 -4.33 -4.33 -15.39 -17.66 -21.33 SA 1.11 1.11 1.01 0.99 1.02 0.99 0.93 0.02 -8.79 -11.27 -8.77 -11.22 -16.36 WA 1.29 1.27 1.22 1.19 1.19 1.18 1.13 -1.77 -5.13 -7.27 -7.24 -8.69 -11.93 Tas 1.23 1.21 0.96 0.93 0.96 0.94 0.89 -1.77 -21.58 -23.98 -21.53 -23.93 -27.54Market milk use (Ml) NSW 589.64 595.95 597.23 599.37 601.58 603.72 607.47 1.07 1.29 1.65 2.02 2.39 3.02 Vic 525.44 533.20 533.20 534.88 533.16 534.84 537.73 1.48 1.48 1.80 1.47 1.79 2.34 Qld 375.58 378.15 378.15 378.15 384.71 386.05 388.23 0.68 0.68 0.68 2.43 2.79 3.37 SA 174.79 174.78 176.96 177.58 176.96 177.56 178.84 0.00 1.24 1.60 1.24 1.59 2.32 WA 192.48 193.00 193.99 194.62 194.61 195.04 195.99 0.27 0.79 1.11 1.11 1.33 1.83 Tas 58.97 59.12 60.88 61.10 60.88 61.09 61.41 0.27 3.25 3.61 3.24 3.60 4.15Manufacturing milk use (Ml) NSW 728.52 729.07 729.42 691.12 599.83 562.60 559.06 0.08 0.12 -5.13 -17.67 -22.78 -23.26 Vic 4408.47 4394.21 4399.00 4192.12 4414.14 4205.54 4204.29 -0.32 -0.21 -4.91 0.13 -4.60 -4.63 Qld 398.28 398.67 398.91 370.46 363.06 333.70 331.72 0.10 0.16 -6.99 -8.84 -16.21 -16.71 SA 301.05 301.37 271.81 245.97 276.97 253.87 252.77 0.11 -9.71 -18.29 -8.00 -15.67 -16.04 WA 283.45 283.62 283.73 270.61 220.07 213.90 213.92 0.06 0.10 -4.53 -22.36 -24.54 -24.53 Tas 482.93 483.27 481.61 459.07 483.35 460.61 460.47 0.07 -0.27 -4.94 0.09 -4.62 -4.65

24
24
2. Deregulation in the pooling states, with the DMS retained (Scenario 2) The state most affected by deregulation in the pooling states is South Australia which experiences a substantial decline in producer revenue. One source of this decline is producers exiting the industry. However, the principal cause is the fall of 10 cents in the retail price of milk coupled with a 7 cent increase in the processor-retail price spread, resulting in an overall decline in producer revenue of 22.5 per cent and in the average per unit return of 18.8 per cent. Tasmania also experiences substantial falls in revenue but for different reasons. With deregulation in the pooling states there is a sharp drop in the price of market milk in Tasmania (21.6 per cent) but only a small increase in the volume of milk demanded (3.3 per cent). Since, few producers are assumed to leave the industry (no shift in the supply function), there is no compensating reduction in available supply and producer revenue falls by 12.2 per cent. There is little difference in the position of Victoria relative to the first scenario. However, because of Victoria’s high farmgate-retailer spread, South Australia takes over as the exporter of market milk, exporting small volumes to both New South Wales and Western Australia. In the quota states there is a fall in retail prices for market milk that results in losses in the value of their market restrictions. In New South Wales the average per unit return for producers drops by 5 cents (10.8 per cent) to 36 cents and in Queensland and Western Australia by around 6 per cent to 37 and 39 cents respectively. 3. Deregulation of the pooling states and removal of the DMS (Scenario 3) When the DMS is removed (scenario 3 in Table 5), producer revenue falls a further 7 to 8 per cent (that is the percentage difference between scenarios 2 and 3) in the pooling states and by 5 to 8 per cent in the quota states. In Victoria, the total decline in revenue from the base scenario amounts to $151.4 million, most of which is the loss in the value of market restrictions (10 per cent of a total 14 per cent decline). The effect on market milk prices of the removal of the DMS is a drop of 2 to 3 per cent across all states and on bulk milk prices 3 to 4 per cent. There is also a small but general decline in the price of manufactured products, particularly the price of butter in the eastern states. However, these are accompanied by similar increases in the quantities demanded. With the decline in bulk milk prices, producers reduce their production of milk by 2 to 4 per cent in most states. In South Australia the reduction is 9 per cent relative to the base but only 4 per cent as a result of the DMS removal. Changes are also apparent in the manufacturing sector under this scenario. The lower prices of dairy products prompts an increase in domestic consumption but also a decline in the manufacturing milk use. These, in turn, influence the level of international trade. Victoria reduces exports of butter and SMP by around 20 per cent. Butter exports are halved in New South Wales and Queensland, and South Australia reduces its exports of cheese by 29 per cent. 4. All states deregulate but DMS remains (Scenario 4)

25
25
When compared to scenario 2, the only significant changes in producer revenue are in the quota states. New South Wales and Western Australia experience drops of 9.4 and 10.5 per cent respectively, while Queensland is less affected with a drop of only 3.3 per cent (scenario 4 in Table 5). However, when the value of the market restriction is considered both Queensland and New South Wales show substantial falls in average per unit returns to producers. In New South Wales the fall is 32.5 per cent from 41 to 28 cents per litre. In Queensland, the fall is 45.7 per cent from 40 to 21 cents, which reflects its lower farmgate-to-retail price spread. The decline in revenue in the quota states is driven by two factors, the fall in market milk prices due to the loss of quota and the shift in the supply function implying exit of higher cost producers from the industry. The falls in market milk prices are only partially offset by increases in consumption, which results in an overall reduction in market milk expenditure and downward pressure on the bulk milk price. With the shift of producers out of the industry the milk supply falls. In the model, this reduction has its greatest impact on ‘other’ products in the manufacturing sector and in a reduction of butter exports in New South Wales and Queensland (33.5 and 20.5 per cent respectively). In Western Australia, surplus milk fat causes a fall in its imputed price of 60 per cent but at the same time the imputed protein price increases by 29 per cent, due to the still relatively high price of milk. This induces manufacturers to switch from cheese to butter production, which reduces exports of cheese and also imports of butter. When the effects of state regulations are removed, South Australian producers face the most significant losses of all states, and Queensland and Victoria the least (measured in percentage change in revenue). In Victoria’s case, this may be partly attributed to the fact that it has the same supply function as under regulation. For Queensland, it is its lower farmgate-to-retail margin and the limited exit of producers, which preserves the bulk milk price and reduces the impact on supply. However, the quota states in general had lower falls in the bulk milk price. This is because the bulk milk price in the base case and the first scenario is the price that is essentially linked to the world price in these states (that is, the manufacturing price). In South Australia, Victoria and Tasmania the fall is larger since the bulk milk price was the pooled price. Removal of pooling caused a fall in the bulk milk price to an export-based equivalent so that the average or pooled return was no longer the price to which producers responded. 5. All states deregulate and the DMS is removed (Scenario 5) In the pooling states, the effect of the removal of the DMS on the industry is virtually identical to scenario 3 (Table 5). Compared to scenario 4 (all states deregulate) producer revenue falls about a further 0.2 per cent in Victoria and by 6 to 7 per cent in the other pooling states. For market milk, prices fall 2 to 3 per cent more across all states and bulk milk prices by 3 to 4 per cent. Overall, the effect of removing the DMS for producers is a uniform one cent reduction in the per unit return for bulk milk. There is also a general drop in retail/wholesale prices (Table 10, scenarios 4 and 5). This gives an increase in the consumption of market milk

26
26
and a reduction in the use of manufacturing milk (Table 11). The net effect is a reduction in the bulk milk supply in the quota states and a small increase in the pooling states. Market milk premium and full deregulation An aspect of interest to producers in the dairy industry is the effect on post deregulation producer returns of a seasonal or ongoing premium for the supply of market milk. It is the view of some producers that these premiums will serve to reduce the full impact of state deregulation. However, if a premium is offered to raise winter milk production because of the higher costs involved in feeding cows over the winter period then this effectively means that the overall annual average price is raised. In the model, producers' production decisions are based on the marginal return for an additional litre of milk, and bulk milk is assumed to be a homogeneous product. That is, the destination for the milk is irrelevant to the producers’ production decisions. The price of bulk milk is determined, in large part, by the demand for milk by processors. This, in turn, is dependent on the demand they face for their various products, together with the costs and profits within the farmgate-to-retail chain. Thus, the price received by producers for bulk milk is a weighted average of the returns from all these products. This might be referred to as ‘product pooling’ as opposed to ‘price pooling’ (the effects are similar). If processors pay a premium on the market milk price they have various choices as to how they treat this additional cost. The cost can be passed on to the consumer (given sufficient market power), absorbed into existing margins (weak market power), or it can be recovered during the summer in the purchase price of milk for manufacturing (annual average the same). Regardless, the average price paid for bulk milk over a year will be dependent on the combined output of dairy products and the returns from them given that bulk milk is reasonably assumed to be a perfect substitute in the various end uses. To effect a premium on market milk in the model the market milk price spreads were reduced by the equivalent of 10 per cent of the bulk milk price. The base scenario in this case was the full deregulation (scenario 5). The results are outlined in Table 5 as scenario 6. The implementation of this scenario is such that the effect of reducing the price spread for market milk is to pass most of this benefit along to consumers through a lower market milk price (3 to 5 per cent comparing scenarios 5 and 6 for a 10 per cent change in the market milk price spread) and for the bulk milk price to change very little. The reason for this is basic to the structure of the model and the industry. The demand for market milk is very price inelastic while the farm level price (particularly in Victoria) is basically determined by the highly elastic world market (Australia is small in terms of the world market). This means that if the price spread is changed, the farm price will change very little because the very large world market largely determines the bulk milk price. The result is thus simply to pass a major part of the price spread reduction along to consumers (the weak market power case). Another way to look at the argument about seasonal premia for market milk is that the processing factories might offer a seasonal premium to obtain a more stable supply of milk across the year. In doing so, they will bring forth a greater supply of milk overall than they really require because they have offered an incentive for winter production,

27
27
supposedly without offering a disincentive for summer production. To obtain the ‘right’ supply it would seem that a disincentive for summer production would be needed to compensate for the incentive provided in winter. If this is the case, then the distribution of prices through the year has been changed but the average price for the year will have changed little to obtain the necessary seasonal pattern of production. In making this argument, it is noted that the incentive needed for winter production may be greater than the disincentive needed in summer because of the higher farm costs. The net outcome of this logic is that if the farm price is raised above the ‘product pooled’ value then excess supply will be generated. This excess supply must be sold by the processors either as market milk, thus lowering the market milk price, or processed into manufacturing products and effectively sold onto the world market at world prices. It is therefore unlikely that price premia will persist for market milk over and above the ‘product pooled’ bulk milk value and any seasonal premia and discounts designed to bring forth the appropriate supply. International market price changes International prices are a major determinant of local demand for processed dairy products and will be increasingly significant in the future. Of particular interest is the effect of changes in international prices relative to the presence or absence of the DMS and state support schemes. To simulate the effect of changes in international product demands in the model, product prices for the rest of the world were increased or decreased by 5 per cent so that the price-point positioning of the excess demand functions for the rest of the world were shifted up or down. A summary of the results is provided in Table 6. An upward shift of 5 per cent in the international price point for manufactured products completely compensates in revenue terms for the negative effects of state deregulation and, for New South Wales, Victoria, Queensland and Western Australia, results in a net increase in revenue of between 15 to 23 per cent (scenario 7). A similar, but reduced effect, occurs where the DMS has been also removed (scenario 5). In this case, the net increases are between 4 to 6 per cent (1 to 2 cents) in the average per unit return (scenario 9 versus 5). The exception to this improvement is South Australia. As would be expected, a reduction in the price point has a negative impact on domestic prices and a flow-on effect to producer returns. For both state-only and full deregulation producer revenue falls by a further 10 to 18 per cent in most states but in New South Wales the fall is only around 2.3 per cent and Western Australia is virtually unaffected by the change in prices. Increased consumption of ‘other’ products increases demand for manufacturing milk which offsets the 2 to 3 cent drop in the bulk milk price. In terms of average per unit return, there is little difference in the change across states with most experiencing a drop of between 8 to 9 per cent (around 2 cents). This is also the case for market milk prices. The lower prices result in relatively small reductions in expenditure on market milk and dairy products. The exception is Queensland where expenditure is increased as a result of a relatively elastic demand for butter. However, this effect is less evident when the price decrease is in conjunction with full deregulation.

28
28
International trade is less attractive to exporters with the 5 per cent price point decrease. Under deregulation of state controls, Victoria essentially ceases exports of wholemilk powder and reduces cheese exports by 34 per cent to around 61,250 tonnes. With removal of the DMS exports of cheese are increased slightly (74,630 tonnes) but exports of butter decline further to 55,640 tonnes.

29
29
Table 6 Summary Results for Changes in International Prices Base New All states
deregulate All states deregulate and a 5%
increase in ROW prices
All states deregulate and a 5% decrease in ROW prices
Total deregulation
(state and DMS)
Total deregulation base and a
5% increase in ROW prices
Total deregulation
base and a 5% decrease in ROW prices
Effect of state deregulation (% change)
Effect of state
deregulation and a 5%
increase in ROW prices(% change)
Effect of state
deregulation and a 5%
decrease in ROW prices (% change)
Effect of state and
DMS deregulation (% change)
Effect of total
deregulation and a 5%
increase in ROW prices (% change)
Effect of total
deregulation effect and a 5% decrease
in ROW prices
(% change) Scenario 4 7 8 5 9 10 4/base 7/4 8/4 5/base 9/5 10/5
Producer revenue excluding the value of market restrictions($m) CXi*CSPi NSW 365.23 330.80 406.09 323.14 309.68 385.30 301.90 -9.43 22.76 -2.32 -15.21 24.42 -2.51
Vic 1,072.84 1,015.43 1,171.67 841.67 927.08 1,091.42 760.28 -5.35 15.39 -17.11 -13.59 17.73 -17.99
Qld 166.13 160.64 188.87 144.15 147.34 176.60 137.29 -3.30 17.57 -10.27 -11.31 19.86 -6.82
SA 152.99 119.19 143.04 104.78 109.08 133.82 95.19 -22.09 20.01 -12.09 -28.70 22.67 -12.73
WA 151.07 135.17 165.54 136.00 131.15 157.55 127.41 -10.52 22.47 0.61 -13.19 20.13 -2.85
Tas 140.81 124.47 143.22 103.62 114.37 134.14 94.29 -11.61 15.07 -16.75 -18.77 17.28 -17.56
Average per unit return for producers ($/l) ((CDPi+PQi)*CAi + CDPi*CBi)/CXi (i=1,3,5) or CDPi (i=2,4,6) NSW 0.41 0.28 0.29 0.26 0.27 0.28 0.25 -32.46 6.26 -6.28 -34.87 7.07 -6.41
Vic 0.22 0.21 0.22 0.19 0.20 0.21 0.18 -5.74 7.87 -9.50 -10.18 9.04 -10.04
Qld 0.40 0.21 0.23 0.20 0.20 0.22 0.19 -45.74 6.95 -8.00 -48.30 8.14 -6.06
SA 0.32 0.26 0.28 0.24 0.25 0.27 0.23 -18.55 5.80 -7.37 -21.57 6.76 -7.60
WA 0.40 0.33 0.33 0.30 0.32 0.32 0.29 -18.91 2.18 -8.10 -20.22 1.13 -9.84
Tas 0.26 0.23 0.25 0.21 0.22 0.24 0.20 -11.98 7.27 -8.76 -15.63 8.30 -9.20
Bulk milk price excluding the value of quota, marginal price ($/l) CSPi
NSW 0.28 0.28 0.29 0.26 0.27 0.28 0.25 -0.26 6.26 -6.28 -3.81 7.07 -6.41
Vic 0.22 0.21 0.22 0.19 0.20 0.21 0.18 -5.74 7.87 -9.50 -10.18 9.04 -10.04
Qld 0.21 0.21 0.23 0.20 0.20 0.22 0.19 0.40 6.95 -8.00 -4.33 8.14 -6.06
SA 0.32 0.26 0.28 0.24 0.25 0.27 0.23 -18.55 5.80 -7.37 -21.57 6.76 -7.60
WA 0.32 0.33 0.33 0.30 0.32 0.32 0.29 2.81 2.18 -8.10 1.14 1.13 -9.84
Tas 0.26 0.23 0.25 0.21 0.22 0.24 0.20 -11.98 7.27 -8.76 -15.63 8.30 -9.20
Bulk milk supply (Ml) NSW 1,323.05 1,201.41 1,387.97 1,252.27 1,166.31 1,355.36 1,214.84 -9.19 15.53 4.23 -11.85 16.21 4.16 Vic 4,927.18 4,947.30 5,292.07 4,530.95 4,740.38 5,118.03 4,321.26 0.41 6.97 -8.42 -3.79 7.97 -8.84 Qld 776.43 747.77 822.00 729.33 719.75 797.78 713.95 -3.69 9.93 -2.47 -7.30 10.84 -0.81 SA 474.56 453.92 514.86 430.79 431.43 495.73 407.46 -4.35 13.43 -5.10 -9.09 14.90 -5.56 WA 476.45 414.68 496.99 453.99 408.94 485.76 440.63 -12.96 19.85 9.48 -14.17 18.79 7.75 Tas 541.93 544.23 583.80 496.56 521.70 564.97 473.68 0.43 7.27 -8.76 -3.73 8.29 -9.20

30
30
Table 6 (continued) Summary Results for Changes in International Prices Base New All states
deregulate All states deregulate and a 5%
increase in ROW prices
All states deregulate and a 5% decrease in ROW prices
Total deregulation
(state and DMS)
Total deregulation base and a
5% increase in ROW prices
Total deregulation
base and a 5% decrease in ROW prices
Effect of state deregulation (% change)
Effect of state
deregulation and a 5%
increase in ROW prices(% change)
Effect of state
deregulation effect and a 5% decrease
in ROW prices
(% change)
Effect of state and
DMS deregulation (% change)
Effect of total
deregulation effect and a
5% increase in ROW prices (% change)
Effect of total
deregulation effect and a 5% decrease
in ROW prices
(% change) Scenario 4 7 8 5 9 10 4/base 7/4 8/4 5/base 9/5 10/5
Market milk price ($/l) ADPi NSW 1.21 1.06 1.07 1.04 1.03 1.04 1.01 -12.69 1.04 -2.02 -14.96 1.22 -2.04
Vic 1.17 1.04 1.05 1.02 1.01 1.03 1.00 -10.85 1.37 -1.67 -13.23 1.56 -1.73
Qld 1.20 1.02 1.03 1.00 0.99 1.01 0.98 -15.39 1.42 -1.84 -17.66 1.59 -1.30
SA 1.11 1.02 1.03 1.00 0.99 1.00 0.97 -8.77 1.09 -1.83 -11.22 1.46 -1.75
WA 1.29 1.19 1.19 1.16 1.18 1.16 1.13 -7.24 -0.39 -2.92 -8.69 -1.23 -3.95
Tas 1.23 0.96 0.98 0.95 0.94 0.95 0.92 -21.53 1.50 -1.83 -23.93 1.68 -1.87
Market milk use (Ml)
NSW 589.64 601.58 600.73 603.24 603.72 602.74 605.35 2.02 -0.14 0.28 2.39 -0.16 0.27
Vic 525.44 533.16 532.29 534.22 534.84 533.88 535.91 1.47 -0.16 0.20 1.79 -0.18 0.20
Qld 375.58 384.71 384.00 385.63 386.05 385.27 386.68 2.43 -0.18 0.24 2.79 -0.20 0.16
SA 174.79 176.96 176.71 177.37 177.56 177.24 177.95 1.24 -0.14 0.23 1.59 -0.18 0.22
WA 192.48 194.61 194.72 195.41 195.04 195.37 196.10 1.11 0.05 0.41 1.33 0.17 0.54
Tas 58.97 60.88 60.78 61.01 61.09 60.98 61.22 3.24 -0.17 0.21 3.60 -0.19 0.21
Manufacturing milk use (Ml)
NSW 728.52 599.83 787.24 649.03 562.60 752.62 609.50 -17.67 31.24 8.20 -22.78 33.78 8.34
Vic 4,408.47 4,414.14 4,759.78 3,996.73 4,205.54 4,584.14 3,785.35 0.13 7.83 -9.46 -4.60 9.00 -9.99
Qld 398.28 363.06 438.00 343.70 333.70 412.50 327.27 -8.84 20.64 -5.33 -16.21 23.61 -1.93
SA 301.05 276.97 338.15 253.42 253.87 318.48 229.51 -8.00 22.09 -8.50 -15.67 25.45 -9.59
WA 283.45 220.07 302.28 258.58 213.90 290.39 244.53 -22.36 37.36 17.50 -24.54 35.76 14.32
Tas 482.93 483.35 523.03 435.55 460.61 503.99 412.46 0.09 8.21 -9.89 -4.62 9.42 -10.45

31
Concluding Comments Using a multi-product spatial equilibrium model it has been possible to examine a set of scenarios in relation to deregulation of the Australian dairy industry. Before this particular version of the model could be constructed a number of modelling issues had to be resolved. These involved the question of what is the impact that a concentrated retail sector will have on the way that the benefits of deregulation are passed along to consumers or producers. Thus the work on price spreads was carried out requiring the application of oligopoly theory in the rather special case where the input and output of a firm are measured in the same units. The structuring of the model to include the major manufactured products also required that protein and fat become core parts of the model. This was achieved with the available data but then required work on an approach to estimating consistent price spreads where products were made up of different mixes of fat and protein. It also allowed for the proper specification of the effects of standardising the fat content of market milk and the flow through of this to manufactured products. The Australian dairy industry faces an inelastic demand for market milk, a more elastic demand for manufactured products and a supply response that takes time to adjust. As well, Australia is a small country in terms of international dairy trade and therefore faces a highly elastic demand on the world market. These fundamental relationships for the industry determine the nature of responses when policy parameters are changed. The industry also has a significant set of government interventions which involve quotas, price pooling at the farm level and retail level price fixing as well as a levy/payment system which transfers funds to manufacturing milk. With the deregulation of these interventions there will be a number of adjustments resulting from the fall in farm level prices. Various scenarios have been examined and shown to affect states and parts of the dairy industry in various ways. Key factors in determining the outcomes are the different retail to farm price spreads and the different transport costs. These two factors can interact to have a significant impact on where dairy products are processed and to what extent they are transported. Another feature of the results from the model is the fact that the whole system is in a form of equilibrium so that there can be a degree of substitution between milk used for manufacturing purposes and market milk and that the balancing of the system is buffered by international trade. It is also worth noting that trade in manufactured products between states (although not explicitly modelled) is likely to substitute for trade in packaged milk between states. This is reflected in the changes in imports and exports for a state. As well, the model allows the consequences of a change in the valuation of protein or fat to be reflected in the outcomes in that an expansion in the demand for cheese exports, for example, will have a different effect to an expansion in the demand for skim milk powder. A key results from the examination of the various scenarios considered in this paper is that changes in the international market can have very significant effects on the industry, so much so, that a 5 per cent rise in the world price faced by Australia for manufactured

32
products will more than compensate for the farm level losses in deregulation. The reverse is also true for a price fall. Thus, the timing in a global context for deregulation is of considerable significance. Clearly, there are many areas of refinement and further development. One of the more challenging and more interesting with the current deregulation debate is the introduction of a dynamic supply response into the system so that it is simulated through time. This would allow for adjustment paths to be simulated and probably a more careful examination of the consequences of various systems of compensation for the cost side of deregulation and investigating the possibilities of the gainers compensating the losers. In addition, the possible effects of a gradual expansion of the quota quantities in the quota states as a means of adjusting to the deregulation and the changes in the costs and benefits to various players in this process could then be investigated. Additional regional disaggregation could also assist in this direction. References Australian Dairy Corporation (1997), Dairy Compendium, 1997, Australian dairy
Corporation, Melbourne. Baumol, W.J. (1982), ‘Applied fairness theory and rationing policy’, American Economic
Review 72(4), 639-51. Davidson, B., MacAulay, G. and Powell, R. (1989), The Estimation of the Demand for
Market Milk, Cheese and Butter in New South Wales, Victoria and Queensland, Dairy Economics Research Report No. 2, Department of Agricultural Economics, University of new England, Armidale.
Daniel, P. and Bardsley P. (1993), The Effect of Statutory Marketing Arrangements on
the Australian Dairy Industry, Research Report Series No 139, Department of Agriculture, East Melbourne.
Hilmer, F.G., Rayner, M. and Taperell, G. (1993), National Competition Policy: Report
by the Independent Committee of Inquiry, Australian Government Publishing Service, Canberra.
Holloway, G.J. (1991), ‘The farm-retail price spread in an imperfectly competitive food
industry’, American Journal of Agricultural Economics 73(4), 879-989. Industry Commission (1997), Regulation and its Review, Australian Government
Publishing Service, Canberra. Kamien, M.I. and Schwartz, N.L. (1983), ‘Conjectural variations’, Canadian Journal of
Economics 16, 191-211.

33
Lembitt, M. and Hall, N. (1987), ‘Supply response on Australian dairy farms’, paper presented to the 31st Annual Conference of the Australian Agricultural Economics Society, Adelaide, 10-12 February.
MacAulay, T.G. (1997), A Spatial Equilibrium Model of the Australian Dairy Industry:
A Technical Report, an unpublished report prepared for the NSW Dairy Farmers’ Association and the Queensland Dairy Farmers’ Association, Sydney.
MacAulay, T.G. and Richards, R. (1998), Nonlinear regulatory mechanisms in a spatial
trading system, Contributed paper presented to the annual conference of the Australian Agricultural and Resource Economics Society, Armidale, January.
NSW Dairy Farmers’ Association (1997), Maintaining the Momentum, A submission
from the NSW Dairy Farmers’ Association Ltd to the Review of the Dairy Industry Act 1979 under National Competition Policy, NSW Dairy Farmers’ Association, Sydney.
O’Donnell, C. and Coelli, T. (1997), ‘Marketing margins for Australian dairy products’
Appendix 1 in Maintaining the Momentum, A submission from the NSW Dairy Farmers’ Association to the Review of the Dairy Industry Act 1979 under National Competition Policy, NSW Dairy Farmers’ Association, Sydney.
O’Donnell, C.J. (1999), Marketing margins and market power in the Australian dairy
processing and retailing sectors, Contributed paper presented to the annual conference of the Australian Agricultural and Resource Economics Society, Christchurch, New Zealand, January.
Richards, R. (1997), ‘Summary Report: Approach and Findings’ in Maintaining the
Momentum, A submission from the NSW Dairy Farmers’ Association Ltd to the Review of the Dairy Industry Act 1979 under National Competition Policy, NSW Dairy Farmers’ Association, Sydney.
Scales, W. (1998), ‘Accelerating and broadening Australia’s microeconomic reform
agenda’, Invited paper presented to the annual conference of the Australian Agricultural and Resource Economics Society, University of New England, Armidale, NSW, January.
Story, D. (1998), ‘States split over dairy deregulation’, Australian Farm Journal,
December 1998, 23-24. Varian, H.R. (1984), Microeconomic Analysis, 2nd edn, W.W. Norton, New York. Wolfram, S. (1996), The Mathematica Book, 3rd edn, Wolfram Media/Cambridge
University Press, Champaign/Cambridge.

34
Appendix A
Detailed Data Tables
Table A.1
Milk Yields and Product Compositions for Milk fat and Protein, 1996/97 Item NSW Vic Qld SA WA Tas ROW Milk contents per mill litres Fat (000 t) 0.040 0.042 0.039 0.041 0.040 0.044 0.042 Protein (000 t) 0.032 0.032 0.031 0.032 0.031 0.033 0.032 Product Composition (000 tonnes/000 tonnes of product) Market milk (mill litres) Fat standardised to 3.2 % (000 t)a 0.032 0.032 0.032 0.032 0.032 0.032 0.032 Protein (000 t) 0.032 0.032 0.031 0.032 0.031 0.033 0.032 Butterb Fat (000 t) 0.805 0.886 0.886 0.805 0.805 0.805 0.805 Protein (000 t) 0.007 0.007 0.007 0.007 0.007 0.007 0.007 SMP+BMP Fat (000 t) 0.010 0.010 0.010 0.010 0.010 0.010 0.010 Protein (000 t) 0.360 0.360 0.360 0.360 0.360 0.360 0.360 WMP Fat (000 t) 0.260 0.260 0.260 0.260 0.260 0.260 0.260 Protein (000 t) 0.270 0.270 0.270 0.270 0.270 0.270 0.270 Cheese Fat (000 t) 0.330 0.330 0.330 0.330 0.330 0.330 0.330 Protein (000 t) 0.250 0.250 0.250 0.250 0.250 0.250 0.250 aMarket milk assumed to be standardised to an average of 3.2 per cent fat. bButter fat content in Victoria and Queensland was increased by 10% because of ghee production. Source: Australian Dairy Corporation (1997), Dairy Compendium, 1997.

35
Table A.2
Dairy Product Input Prices, DMS Levies, and Processing to
Retail Spreads, 1996/97 NSW Vic Qld SA WA Tas Input prices ($ltr/kg) Liquid milk 0.24 0.24 0.22 0.28 0.22 0.22 Milk fat 2.14 1.98 1.98 2.47 1.93 1.77 Protein 4.40 3.59 4.03 2.40 4.08 2.76 Levy Rates ($ltr/kg) Market milk
Fat levy (15.75 ¢/kg of fat) 0.01 0.01 0.01 0.01 0.01 0.01 Protein levy (38.39 ¢/kg of protein) 0.01 0.01 0.01 0.01 0.01 0.01
Butter Fat levy (32.86 ¢/kg of fat) 0.26 0.29 0.29 0.26 0.26 0.26 Protein levy (77.92 ¢/kg of protein) 0.01 0.01 0.01 0.01 0.01 0.01
SMP+BMP Fat levy (32.86 ¢/kg of fat) 0.00 0.00 0.00 0.00 0.00 0.00 Protein levy (77.92 ¢/kg of protein) 0.28 0.28 0.28 0.28 0.28 0.28
WMP Fat levy (32.86 ¢/kg of fat) 0.09 0.09 0.09 0.09 0.09 0.09 Protein levy (77.92 ¢/kg of protein) 0.21 0.21 0.21 0.21 0.21 0.21
Cheese Fat levy (32.86 ¢/kg of fat) 0.11 0.11 0.11 0.11 0.11 0.11 Protein levy (77.92 ¢/kg of protein) 0.19 0.19 0.19 0.19 0.19 0.19
Processing to retail price spreads ($ltr/kg) a Market milk (fixed)b 0.64 0.83 0.60 0.69 0.76 0.71
Variable componentc 0.27 0.24 0.19 0.07 0.10 0.03
Total 0.91 1.07 0.79 0.76 0.86 0.74 Butter/butter oil 1.66 2.15 1.61 1.02 2.05 2.50 SMP/BMP (to wholesale) 0.72 0.88 0.73 1.12 1.12 1.09 WMP 4.16 4.82 4.90 4.97 4.90 5.91 Cheese 5.55 5.23 5.08 4.68 4.16 4.96 aSpreads estimated in Mathematica (see Appendix F) bThe variable component of the levy was operational only for deregulation scenarios, and not for Victoria. CThe formula is VM = (4.3917*Q/P)/100 where the coefficient for the quantity, Q, is divided by 4 to allow
for the original estimates being quarterly and P is the price of bulk milk. Thus, VM = 0.01097925 *Q/P. The coefficients are from O’Donnell (1998), reproduced in Appendix G.
Source: Australian Dairy Corporation, Dairy Compendium, 1997.
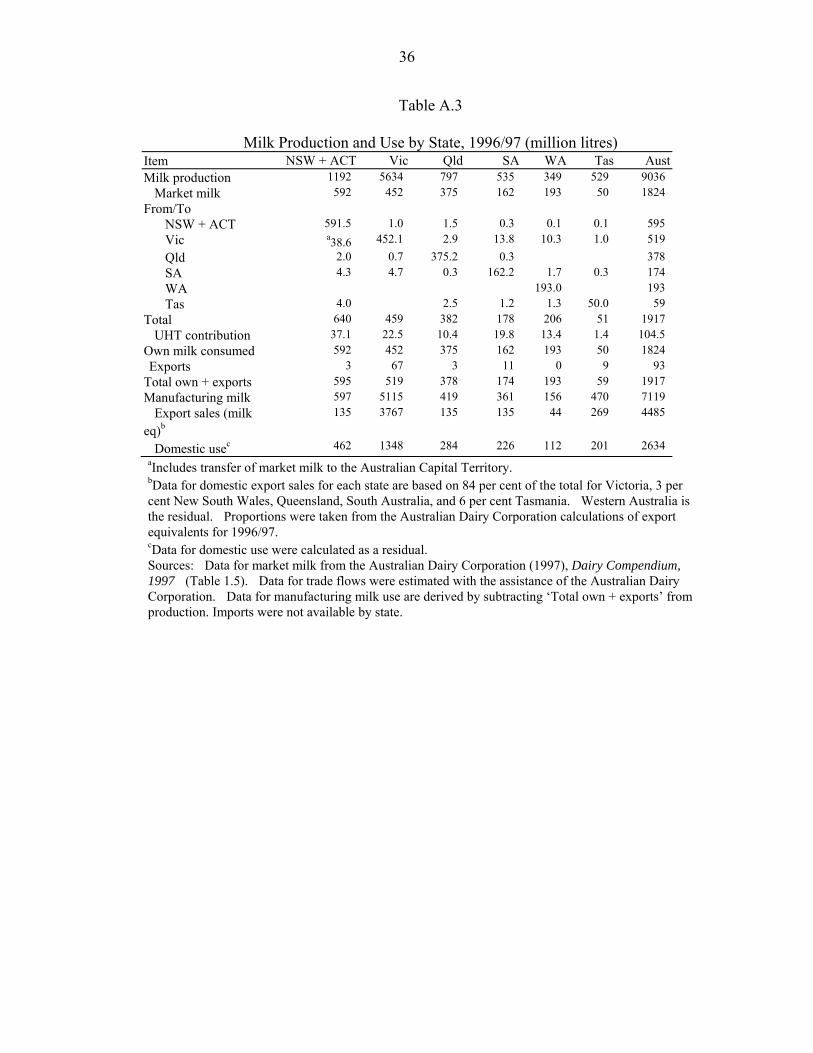
36
Table A.3
Milk Production and Use by State, 1996/97 (million litres) Item NSW + ACT Vic Qld SA WA Tas AustMilk production 1192 5634 797 535 349 529 9036
Market milk 592 452 375 162 193 50 1824
From/To
NSW + ACT 591.5 1.0 1.5 0.3 0.1 0.1 595
Vic a38.6 452.1 2.9 13.8 10.3 1.0 519
Qld 2.0 0.7 375.2 0.3 378
SA 4.3 4.7 0.3 162.2 1.7 0.3 174
WA 193.0 193
Tas 4.0 2.5 1.2 1.3 50.0 59
Total 640 459 382 178 206 51 1917
UHT contribution 37.1 22.5 10.4 19.8 13.4 1.4 104.5
Own milk consumed 592 452 375 162 193 50 1824
Exports 3 67 3 11 0 9 93
Total own + exports 595 519 378 174 193 59 1917
Manufacturing milk 597 5115 419 361 156 470 7119
Export sales (milk eq)b
135 3767 135 135 44 269 4485
Domestic usec 462 1348 284 226 112 201 2634 aIncludes transfer of market milk to the Australian Capital Territory. bData for domestic export sales for each state are based on 84 per cent of the total for Victoria, 3 per cent New South Wales, Queensland, South Australia, and 6 per cent Tasmania. Western Australia is the residual. Proportions were taken from the Australian Dairy Corporation calculations of export equivalents for 1996/97. cData for domestic use were calculated as a residual. Sources: Data for market milk from the Australian Dairy Corporation (1997), Dairy Compendium, 1997 (Table 1.5). Data for trade flows were estimated with the assistance of the Australian Dairy Corporation. Data for manufacturing milk use are derived by subtracting ‘Total own + exports’ from production. Imports were not available by state.

37
Table A.4
Milk Products: Transfer Costs Consisting of Freight, Pickup and Handling Costs Between Capital Cities in Each State, 1996/97
From/To NSW Vic Qld SAa WA Tasb Distances (km)
NSW 0 875 1000 1400 2870 1300 Vic 875 0 1800 726 2200 400 Qld 1000 1800 0 2200 3466 2300 SA 1400 726 2200 0 1466 1100 WA 2870 2200 3466 1466 0 2500 Tas 1300 400 2300 1100 2500 0
Bulk milk costs (¢/l) NSW 9.00 10.00 17.20 24.96 12.40 Vic 9.00 16.40 11.808 19.60 10.40 Qld 10.00 16.40 19.60 29.728 20.40 SAa 17.20 11.808 19.60 13.728 12.80 WA 24.96 19.60 29.728 13.728 22.00 Tasb 12.40 10.40 20.40 12.80 22.00 ROW 1.14 0.282 5.835 6.775 9.344 2.984
aAn amount of 4.0 cents/litre was added to all rates in and out of South Australia since trade with the other states seemed unlikely but was occurring in the base runs. bThe rate from Tasmania to Victoria and the reverse rate were doubled because of the short distance used and the cost of shipping by sea. Source: Based on data provided by the NSW Dairy Farmers' Association.

38
Table A.5
Packaged Dairy Products: Transfer Costs Consisting of Freight, Pickup and Handling Costs Between Capital Cities in Each State, 1996/97a
From/To NSW Vic Qld SA WA Tasb
Refrigerated dairy product costs (¢/kg/litre)c NSW 5.70 9.17 10.48 27.22 20.26 Vic 9.17 14.39 8.30 25.48 16.78 Qld 7.00 10.48 12.22 30.26 25.04 SA 10.04 5.48 18.52 20.70 20.26 WA 10.70 9.83 17.22 6.57 28.09
Tasb 19.65 12.48 24.87 18.78 35.96
Dry dairy product costs (¢/kg)d NSW 5.60 7.19 8.15 17.38 17.38 Vic 7.19 11.62 5.08 17.38 13.15 Qld 6.04 8.92 10.85 21.23 21.23 SA 8.15 5.08 13.54 13.54 16.23 WA 8.92 8.35 15.46 5.85 21.23
Tasb 16.46 11.27 20.88 14.35 26.65 ROW 7.60 2.0 10.92 7.08 7.08 13.27
aBackloading factors have been used and are particularly marked with Western Australia.
bTasmanian outward costs based on an estimate of $3600 less equalisation assistance of $1,190 (12.2 metre container). cAll costs based on 23 tonne payloads. dAll costs based on 26 tonne payloads. Source: Refrigerated Roadways and the Department of Workplace Relations and Small Business, Tasmania.

39
Table A.6
The Structure of Price Relationships under Existing Regulations ($/litre) NSWa Vicb Qlda SAb WAa Tasb
Retail market milk demand price (ADPj and ASPi)
1.150 1.278 1.150 1.170 1.265 1.225
-Levy A (fat and protein adjusted) 0.018 0.018 0.018 0.018 0.018 0.018
-Price spread 0.626 0.821 0.586 0.680 0.749 0.702
-Quota value or pooling tax (PQi/ Ti) 0.267 0.209 0.328 0.192 0.283 0.292
=Bulk milk demand price (CDPi) 0.243 0.237 0.221 0.286 0.218 0.222
Market milk, producer price 0.529 0.467 0.568 0.497 0.520 0.533
-Producer Levy A (at 1.9 ¢/l)c 0.019 0.019 0.019 0.019 0.019 0.019
=Producer price less levy A (P1) 0.510 0.446 0.549 0.478 0.501 0.514
Manufacturing milk producer price 0.264 0.237 0.242 0.215 0.239 0.206
- Producer Levy B (at 3.8 ¢/l)c 0.038 0.038 0.038 0.038 0.038 0.038
+ DMS payment (at 1.7 ¢/l) 0.017 0.017 0.017 0.017 0.017 0.017
= Producer price net of levies (P2) 0.243 0.216 0.221 0.194 0.218 0.185
Implicit quota value (P1-P2) 0.267 0.230 0.328 0.285 0.283 0.329
Market milk volume (mill litres) (=M1) 594 519 378 173 193 59
Manufacturing milk volume(Ml) (=M2) 597 5115 419 361 156 470
Total milk volume (Ml) (=M) 1192 5634 797 535 349 529
Pooled price ((P1*M1+P2*M2)/M) 0.376 0.237 0.376 0.286 0.374 0.222 aQuota states. bPooling states. cLevy rates set at 15.75 cents/kg of fat and 38.39 cents/kg of protein. Levy rates from the Australian Dairy Corporation (1997), Dairy Compendium, 1997

40
Table A.7
Absolute Changes in Producer Returns and Bulk Milk Prices and Quantities State
Base
Victoria deregulates
Pooling states deregulate
All states deregulate
States and DMS deregulate
States and DMS deregulate but 5% increase in ROW
prices Scenario 1 2 4 5 7 Change from the base in producer revenue excluding the value of market restrictions ($m)
NSW 365.23 0.34 0.55 -34.43 -55.55 20.07 Vic 1072.84 -64.86 -63.96 -57.41 -145.76 18.58 Qld 166.13 0.19 0.31 -5.49 -18.79 10.47 SA 152.99 0.17 -34.47 -33.80 -43.91 -19.17 WA 151.07 0.12 0.20 -15.90 -19.92 6.48 Tas 140.81 -1.14 -17.14 -16.34 -26.44 -6.67 Change from the base in average per unit return for producers ($/l)
NSW 0.41 -0.04 -0.05 -0.13 -0.14 -0.13 Vic 0.22 -0.02 -0.02 -0.01 -0.02 -0.01 Qld 0.40 -0.03 -0.03 -0.19 -0.20 -0.18 SA 0.32 0.00 -0.06 -0.06 -0.07 -0.05 WA 0.40 -0.01 -0.02 -0.07 -0.08 -0.08 Tas 0.26 0.00 -0.03 -0.03 -0.04 -0.02 Change from the base in bulk milk price excluding the value of quota, marginal price ($/l)
NSW 0.28 0.00 0.00 0.00 -0.01 0.00 Vic 0.22 -0.02 -0.02 -0.01 -0.02 -0.01 Qld 0.21 0.00 0.00 0.00 -0.01 0.01 SA 0.32 0.00 -0.06 -0.06 -0.07 -0.05 WA 0.32 0.00 0.00 0.01 0.00 0.00 Tas 0.26 0.00 -0.03 -0.03 -0.04 -0.02 Change from the base in bulk milk supply (Ml)
NSW 1323.05 0.55 0.90 -121.64 -156.74 32.31 Vic 4927.18 3.05 5.01 20.12 -186.80 190.85 Qld 776.43 0.39 0.63 -28.66 -56.68 21.35 SA 474.56 0.32 -22.10 -20.64 -43.13 21.17 WA 476.45 0.17 0.28 -61.77 -67.51 9.31 Tas 541.93 0.34 0.56 2.30 -20.23 23.04