issues and trends on sustainable transportation: the case
TRANSCRIPT

Brazilian Journal of Operations & Production ManagementVolume 10, Number 2, pp. 43-56.http://dx.doi.org/xxx.xxxxxx.xxx
Received: August, 2013 | Accepted: November, 2013. 43
Marcelo Sampaio Dias MacielProfessor CEFET/RJ
Av. Maracanã 229, Maracanãzip code 20.110-110/ Rio de Janeiro – RJ Brazil
phone: [email protected]
[email protected] Planning PhD (Coppe / UFRJ). Master of Business
Administration (IBMEC-RJ). MBA in Strategic Information Management ( UFRJ ). Graduated in Economics from UERJ.
Advised on strategic planning for industries in the oil and gas. He served as Commercial Manager and Technical TNCs in PDVSA, Citgo Petroleum Corporation and Chevron. He is
currently Professor of Engineering programs and Industrial Administration Cefet RJ, where is responsible of Economic
Theory and Environmental Sciences. Currently is the the Knowledge Management and Innovation research group
leader. He is also the Chief Strategy Officer at CEFET - RJ.
Úrsula Gomes Rosa MaruyamaProfessor CEFET/RJ
Av. Maracanã 229, Maracanã zip code 20.110-110/ Rio de Janeiro – RJ Brazil
phone: [email protected]
Master degree in Science, Technology and Education (PPCTE/CEFET-RJ), scientific internship advisor in Innovation
studies in Technological Education. Bachelor in Industrial Administration CEFET-RJ. MBA Project Management, MBA Public Management, and specialization in Human Resources
and English Language. She had worked at CEPEL / Eletrobras and multinationals such as ABB, Lanxess, Royal Dutch Shell
and Praxair. She lived, studied and worked in Washington DC (2003-2005). Visiting professor CEFET-RJ English Language
courses for Administration and Industrial Engineering and GIS (Management Information Systems). Currently teaches
Management 101, Entrepreneurship, SOM, Quality and OTN. Thus, she also teaches Quality Management and Marketing II
in Business Administration (CEFET-RJ).
Antonio Mauricio Castanheira das NevesProfessor CEFET/RJ
Av. Maracanã 229, Maracanã zip code 20.110-110/ Rio de Janeiro – RJ Brazil
phone: [email protected]
Associate Professor in Social Psychology Institutional UGF in 1992. Master in Social Psychology from UFRJ. Specialist in Social Psychiatry by ENSP-FIOCRUZ (1984). Specialist
in Social Psychology by the Psychology Federal Council. Psychologist, bachelor’s in Psychology and Social Sciences.
He is currently Associate Professor (CEFET-RJ). Former Professor in the Master of Education at the Catholic University
of Petrópolis (2002-2011), Assistant Professor in UNISUAM Master in Local Development psychology (2010). 40 book chapters, five books published. Works in Philosophy with an emphasis in Ethics and Technology in Education, with
emphasis on knowledge and innovation. Ad hoc is currently evaluating of undergraduate MEC.
Issues and trends on sustainable transportation: the case of Brazilian cities (2003-2010)
Abstract
Brazilian transport system accounts for negative externalities in terms of energy consumption, carbon dioxide, local pollution emissions, social costs and infrastructure expenditures. These elements results on unsustainable mobility system. Resources usage is considerable and trend lines depict growing concerns in the following years. Brazilian cities continuous expan-sion increasing passenger mobility demand as well as social improvements (including C social level group) combined with public transportation low quality causes exponential increments on external transport system costs. For methodological means, the Brazilian cities case study was based on documental and literature research within public administration in Brazil. Therefore, this paper purpose is to present external costs and urban transpor-tation tendencies in Brazil. Research data states significant growth in public infrastructure expenditures provoked by exaggerated energy consumption in the last years. In conclusion, based on literature and the aforementioned data basis, it can be inferred that sustainable transport system relies on pub-lic transportation. Pursuing such scenario will lead Brazilian cities to save relevant amount of financial and natural resources.
Keywords: Brazilian cities; Greenhouse Gas Emission & local pollution; Energy; Social costs; Sustainable transportation.

44
Brazilian Journal of Operations & Production ManagementVolume 10, Number 2, pp. 43-56.
Issues and trends on sustainable transportation: the case of Brazilian cities (2003-2010)
1 Introduction
Urbanization is increasing the world popu-
lation share living in cities. Thus, urban mobil-
ity issues have significantly impacted on goods
supply of these urban agglomerations. Passenger
and freight transportation generates over 23% of
greenhouse gas emissions worldwide and accounts
for at least 26% of the planet’s fuel use (Kahn,
2007; AEO, 2008; EIA, 2007; BP, 2007; IEA,
2008; IPCC, 2007;OPEC, 2007; WBSCD, 2004).
The transportation sector answers for 25%
and 60% of land occupation in major cities
(Litman and Burwell, 2006; Vasconcellos, 2000;
Litman, 1995), and the time wasted in traffic con-
gestion to economic losses ranging from 1% to
3% of GDP in many countries (Gwilliam, 2002).
Furthermore, over a million people die and 3
million are injured every year in road traffic acci-
dents worldwide (WHO, 2004; Granados, 1998;
Quinet, 1994), resulting in economic expenditures
of approximately 5% of GDP in some of these
countries (Vasconcellos, 2008).
In emerging economies, for instance, Brazil
have adopted transportation systems repeating
errors already committed by industrialized coun-
tries including individual motorized transporta-
tion stimulus as standard model. Such behavior
has not proved to be the optimal solution (Pucher
et al., 2005; Rosa, 2003).
In addition, poverty origins research in cities
marginal areas, in both developed and emerging
countries point to a lack of public transportation
as one of the main social concerns (World Bank,
2002). Therefore, economies suffered significant
losses in adequate urban transportation policies
absence. Promoting sustainable transportation
options contributes to cities environmental, eco-
nomic and social development (Gwilliam, 2002).
In this sense, the Brazilian government regu-
larly proclaims its overriding commitment to both
efficient public resources utilization and popula-
tion living standards enhancement. However,
Brazilian cities still need a currently unsustainable
transportation system overhaul.
Therefore, Brazilian transportation system
resource consumption and atmospheric emissions
accurate calculation in the last years is the key fac-
tor for ensuring adequate management of public
policies towards higher social benefits.
2 Research methodology
This Systematic Review research method
(Thomas et al, 2004) presents motorized passen-
ger transportation external costs in Brazilian ma-
jor urban areas. Considering the aforementioned
methodology, it also uses a simple equation to cal-
culate the input-output ratio or its transportation
system efficiency. In the first section, it is present-
ed the sustainable transportation concept.
In the second section Brazilian urban ar-
eas passenger transportation data is analyzed,
particularly those related to energy emissions,
infrastructure and social costs. Based on this in-
formation, a comparative study is presented con-
sidering Brazilian urban transportation efficien-
cy. Finally, the last section includes final remarks
of this research.
3 Sustainable transport definition
According to sustainable development con-
cept, one should use available resources to meet
present requirements only to the extent which
such use does not prejudice sustainability, in other
words, the capacity to satisfy future generation
needs (WCED, 1987). Therefore, according to the
European Foundation for the Improvement of

45
Brazilian Journal of Operations & Production ManagementVolume 10, Number 2, pp. 43-56.
Maciel, M.S.D.; Maruyama, Ú.G.R; Neves, A.M.C.
Living and Working Conditions, sustainable de-
velopment is a continuous economic development
that does not threaten the environment or natural
resources (Litman and Burwell, 2006).
In general, sustainability may be defined as
the capacity to impart long-term continuity to our
present actions. Litman and Burwell (2006) note
that sustainability reflects on the ethics of conser-
vation, where production and consumption stan-
dards are framed to minimize the resources usage
and waste of materials.
Putting this concept into practice requires
significant changes in economy and public policies
that have historically rewarded production and
consumption inefficiency. In this way, how does
this sustainability view apply to a transportation
system?
For Litman and Burwell (2006), the main
sustainable transportation tenet is governments
must address environmental, economic and social
factors in their transportation agenda. This idea is
firmly endorsed by Feitelson (2002), while other
authors (e.g. Gudmundsson and Höjer, 1996) ar-
gue there are four key elements to transportation
sustainable development concept: natural resourc-
es protection, intergenerational productive capital
maintenance, quality of life’s enhancement and
fair distribution.
In addition, Black (2010), Buehler and Pucher
(2011) states that sustainable transportation sys-
tem is one which provides transportation and
mobility from renewable energy sources, thereby
minimizing local and global emissions, preventing
avoidable casualties and injuries from road traffic
accidents. Henceforth, economic productivity loss
due to traffic congestion is mitigated.
The transportation systems actual scenario
remains far removed from the ideals visualized in
academic theories and urban planners offices. As a
matter of fact, individual motorized transportation
usage expansion, particularly those of motor private
car deploys transportation systems deteriorating
drastically worldwide (Bouf and Hensher, 2007).
Large-scale private cars usage for urban jour-
neys results in energy and social inefficiency, as
well as environmental unsustainability (Wright
and Egan, 2000; Anable, 2005). Based on Tolley
and Turton (1995), figure 1 depicts private trans-
portation inefficiency in comparison to public
transportation modes.
Figure 1 also presents
cars as the most inefficient
urban transport type in
terms of capacity (from
1,000 to 3,000 passengers
per hour). On the other
hand, it has excellent speed
ratio. No doubt urban
transit mode is better fit-
ted to mass transportation
but it shows less flexibility
in terms services frequency
and transport system entry
points.
Schipper (2011), Parry
et al (2007), Schipper and
Figure 1: Transportation capacity and speed: Public Transportation X Cars*Considering the scarcity of available data in recent years.Source: Tolley and Turton (1995)

46
Brazilian Journal of Operations & Production ManagementVolume 10, Number 2, pp. 43-56.
Issues and trends on sustainable transportation: the case of Brazilian cities (2003-2010)
Eriksson (1995) illustrate the negative impacts of
motor car utilization in city transportation sys-
tems. Then, eight cardinal sins of such use are list-
ed: accidents, atmospheric pollution, urban space
inefficient use, congestion, noise pollution, energy
waste, greenhouse gases emission and cargo inef-
ficient distribution.
The more a transportation system relies on
individual motorized vehicles, the more unsus-
tainable the system becomes. As a result, Table 1
depicts the main individual motorized transporta-
tion impacts on sustainability.
In addition, current trend points representing
unsustainability increase (Chapman, 2007), such
as car production and vehicle utilization within
cities is growing rapidly. This feature is supported
by industry productivity growth, cost production
reduction and broaden the open access to world
population financial resources.
In consonance with Sperling and Gordon
(2008), IMT (individual motorized transporta-
tion) usage will become serious problem in the fol-
lowing decade. These authors also states although
the number of individual motorized vehicles is not
increasing significantly in industrialized (devel-
oped) countries, the number of vehicles in devel-
oping countries, such as China and India increases
8% per year. Actually, OECD countries car pas-
senger amount is forecasted to achieve an increase
of 119 million cars by 2030, while in developing
countries it will surpass 430 million cars over the
same period (WOO, 2010).
In Brazil, the number of motor cars grows
8% per year, while motorcycles 14% per year
(DENATRAN, 2010). These rates may increase
due to positive income effects on Brazilian econ-
omy. Between 2003 and 2009, income per capita
increased annually from R$ 9,511 (approximate-
ly USD 5,705) to approximately R$ 17,467 (ap-
proximately USD 10,481) (IBGE, 2011).
Moreover, current vehicles owners increase the
use of their cars travelling longer distances cross-
ing over the town, commuting daily and making
the use of vehicles increasingly inefficient on traf-
fic congestion (MMA, 2011). In this sense, Table
2 depicts sustainability, sustainable transporta-
tion, its objectives and possible solutions for the
aforementioned questions.
4 External costs and changes on urban transportation in Brazil
This section presents environmental, energy
and social (considering health and mobility) costs
related to passenger transportation in Brazilian
urban areas with over 60,000 inhabitants (ANTP,
2009). Available data analysis indicates Brazilian
transportation system wastes social, financial,
and natural resources to a degree that is incom-
patible with the country social, economic and en-
vironmental conditions (Elvik, 2006). Therefore,
unsustainable transportation system leads to pub-
lic resources waste in Brazil.
Henceforth, these waste of resources results
in social costs, as the society has to deal with indi-
vidual motorized vehicles negative consequences,
which are not fully covered by Government taxes
Table 1: Individual motorized transportation impacts on society
Economic Social Environmental
Congestion Unequal distribution of impacts
Water and air pollution
Barriers to mobility Inequality in terms of mobility Loss of habitats
Accidents Impact on human health Hydrological impact
Infrastructure costs Community interaction DNRR
Others Habitability
DNRR Aesthetics
Note: DNRR - Depletion of non-renewable resourcesSource: Litman and Burwell (2006).
Table 2: Sustainability and sustainable transportation issues
Sustainability Transportation
Goal Objective Objective Solution
Ecological integrity
Reduce climate change Reduce climate change emissions CAFE standards, emission taxes, TDM, alternative fuels
Preserve wildlife habitat Reduce impervious surface
Reduce parking and road capacity standards, TDM, parking management, design roads to minimize habitat impacts,
encourage higher-density infill development
Reduce pollution Reduce harmful vehicle air and water emissions Emission standards, TDM, I/M programs
Human health
Reduce injuries Reduce traffic accidents Crash prevention, crash protection, TDM
Reduce pollution exposure Criteria emission controls Emission standards, I/M programs, alternative fuels, TDM
Increase exercise Increase active transport Improve walking and cycling conditions, traffic calming, encourage non-motorized transport, TDM
Economic welfare
Consumer’s mobilityInsure adequate transport services, provide mobility choices, reduce traffic congestion and barriers
Adequate road capacity, transit services, TDM, walking and cycling improvement, lovable communities, delivery services
Business productivity Freight mobility and affordability, facility siting options
Adequate road/rail/air freight capacity, efficient land use, freight priority, TDM
Public investment productivity/tax
reductions
Transportation facility and service efficiency
Planning and management for efficiency, efficient pricing, TDM
Equity
Horizontal equity User pay principle Cost-based pricing, internalize externalities, reduce externalities
Vertical equityProgressive pricing Low prices/taxes for basic driving
Mobility for non-drivers Provide adequate walking, cycling, rideshare, transit services; multi-modal community/land use
Social welfare Community cohesion and livability
Improve mobility within neighborhoods
Neotraditional street planning, traffic calming, pedestrian/cycle planning, mixed land use
Enhance the public realm through street improvements
Traffic calming, pedestrian planning, livable community design features
Notes: CAFE - Corporate average fleet efficiency, a standard based on the overall average fuel efficiency of all vehicles sold by each manufacturer; I/M – Inspection and maintenance; TDM - Transportation demand management.Source: Litman and Burwell (2006)

47
Brazilian Journal of Operations & Production ManagementVolume 10, Number 2, pp. 43-56.
Maciel, M.S.D.; Maruyama, Ú.G.R; Neves, A.M.C.
(Gwilliam, 2008). Passenger transport evolution
data and its calculated demand by ANTP (2011)
in billions of passengers versus kilometers/year be-
tween 2003 and 2010 are shown in table 3.
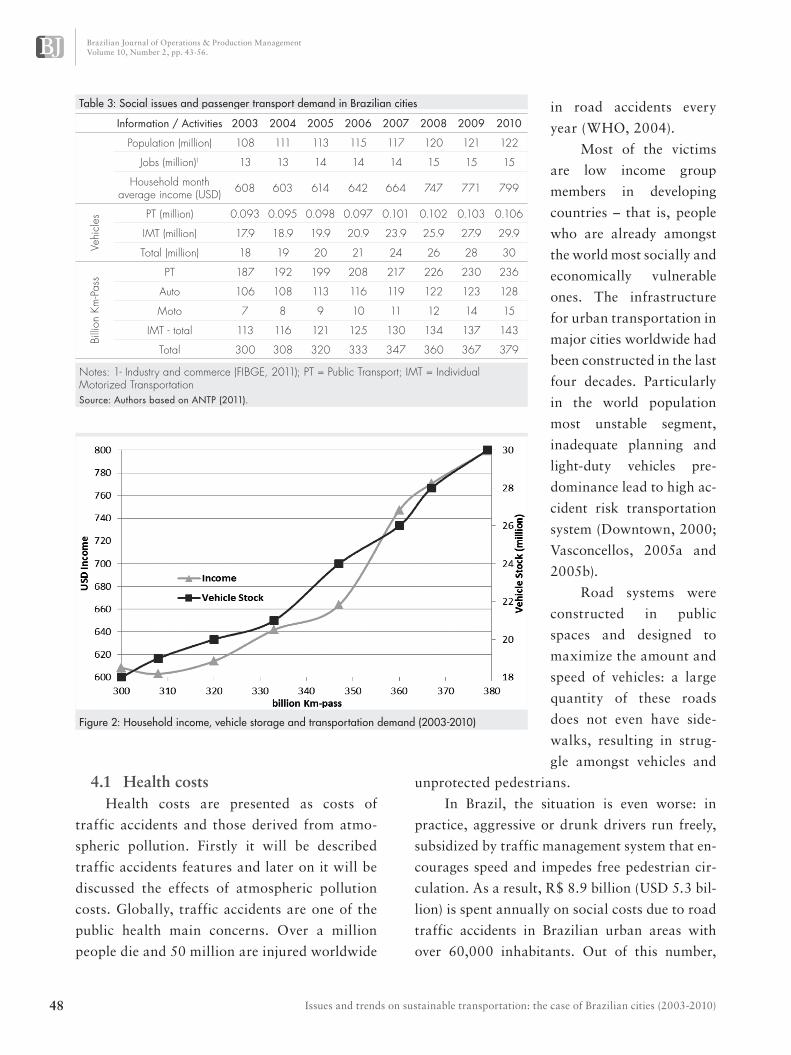
One can see that there is a direct correlation
between demand transportation, individual mo-
torized transportation storage and use, population
growth and income increasing.
Figure 2 depicts a strong correlation among
transportation demand, household income and ve-
hicle storage in Brazilian cities. For each demand
the term ‘km-passenger’ needs features provided
by Government such as energy, atmosphere, infra-
structure and health care. Depending on transpor-
tation mode, the demand will consume a higher
amount of natural and financial resources. For in-
stance, one can see that motorcycle usage is grow-
ing faster. Although motorcycles are more efficient
than automobiles in terms of energy consumption
and CO2 emissions, this type of transportation
causes more accidents and pollution emissions per
capita than automobiles. Furthermore, it brings
more damage and harm, as well as stimulates in-
dividual rather than public transportation. The
aforementioned growth rate is pressuring health
costs and local pollution emissions.
senger amount is forecasted to achieve an increase
of 119 million cars by 2030, while in developing
countries it will surpass 430 million cars over the
same period (WOO, 2010).
In Brazil, the number of motor cars grows
8% per year, while motorcycles 14% per year
(DENATRAN, 2010). These rates may increase
due to positive income effects on Brazilian econ-
omy. Between 2003 and 2009, income per capita
increased annually from R$ 9,511 (approximate-
ly USD 5,705) to approximately R$ 17,467 (ap-
proximately USD 10,481) (IBGE, 2011).
Moreover, current vehicles owners increase the
use of their cars travelling longer distances cross-
ing over the town, commuting daily and making
the use of vehicles increasingly inefficient on traf-
fic congestion (MMA, 2011). In this sense, Table
2 depicts sustainability, sustainable transporta-
tion, its objectives and possible solutions for the
aforementioned questions.
4 External costs and changes on urban transportation in Brazil
This section presents environmental, energy
and social (considering health and mobility) costs
related to passenger transportation in Brazilian
urban areas with over 60,000 inhabitants (ANTP,
2009). Available data analysis indicates Brazilian
transportation system wastes social, financial,
and natural resources to a degree that is incom-
patible with the country social, economic and en-
vironmental conditions (Elvik, 2006). Therefore,
unsustainable transportation system leads to pub-
lic resources waste in Brazil.
Henceforth, these waste of resources results
in social costs, as the society has to deal with indi-
vidual motorized vehicles negative consequences,
which are not fully covered by Government taxes
Table 2: Sustainability and sustainable transportation issues
Sustainability Transportation
Goal Objective Objective Solution
Ecological integrity
Reduce climate change Reduce climate change emissions CAFE standards, emission taxes, TDM, alternative fuels
Preserve wildlife habitat Reduce impervious surface
Reduce parking and road capacity standards, TDM, parking management, design roads to minimize habitat impacts,
encourage higher-density infill development
Reduce pollution Reduce harmful vehicle air and water emissions Emission standards, TDM, I/M programs
Human health
Reduce injuries Reduce traffic accidents Crash prevention, crash protection, TDM
Reduce pollution exposure Criteria emission controls Emission standards, I/M programs, alternative fuels, TDM
Increase exercise Increase active transport Improve walking and cycling conditions, traffic calming, encourage non-motorized transport, TDM
Economic welfare
Consumer’s mobilityInsure adequate transport services, provide mobility choices, reduce traffic congestion and barriers
Adequate road capacity, transit services, TDM, walking and cycling improvement, lovable communities, delivery services
Business productivity Freight mobility and affordability, facility siting options
Adequate road/rail/air freight capacity, efficient land use, freight priority, TDM
Public investment productivity/tax
reductions
Transportation facility and service efficiency
Planning and management for efficiency, efficient pricing, TDM
Equity
Horizontal equity User pay principle Cost-based pricing, internalize externalities, reduce externalities
Vertical equityProgressive pricing Low prices/taxes for basic driving
Mobility for non-drivers Provide adequate walking, cycling, rideshare, transit services; multi-modal community/land use
Social welfare Community cohesion and livability
Improve mobility within neighborhoods
Neotraditional street planning, traffic calming, pedestrian/cycle planning, mixed land use
Enhance the public realm through street improvements
Traffic calming, pedestrian planning, livable community design features
Notes: CAFE - Corporate average fleet efficiency, a standard based on the overall average fuel efficiency of all vehicles sold by each manufacturer; I/M – Inspection and maintenance; TDM - Transportation demand management.Source: Litman and Burwell (2006)
48
Brazilian Journal of Operations & Production ManagementVolume 10, Number 2, pp. 43-56.
Issues and trends on sustainable transportation: the case of Brazilian cities (2003-2010)
4.1 Health costsHealth costs are presented as costs of
traffic accidents and those derived from atmo-
spheric pollution. Firstly it will be described
traffic accidents features and later on it will be
discussed the effects of atmospheric pollution
costs. Globally, traffic accidents are one of the
public health main concerns. Over a million
people die and 50 million are injured worldwide
in road accidents every
year (WHO, 2004).
Most of the victims
are low income group
members in developing
countries – that is, people
who are already amongst
the world most socially and
economically vulnerable
ones. The infrastructure
for urban transportation in
major cities worldwide had
been constructed in the last
four decades. Particularly
in the world population
most unstable segment,
inadequate planning and
light-duty vehicles pre-
dominance lead to high ac-
cident risk transportation
system (Downtown, 2000;
Vasconcellos, 2005a and
2005b).
Road systems were
constructed in public
spaces and designed to
maximize the amount and
speed of vehicles: a large
quantity of these roads
does not even have side-
walks, resulting in strug-
gle amongst vehicles and
unprotected pedestrians.
In Brazil, the situation is even worse: in
practice, aggressive or drunk drivers run freely,
subsidized by traffic management system that en-
courages speed and impedes free pedestrian cir-
culation. As a result, R$ 8.9 billion (USD 5.3 bil-
lion) is spent annually on social costs due to road
traffic accidents in Brazilian urban areas with
over 60,000 inhabitants. Out of this number,
Table 3: Social issues and passenger transport demand in Brazilian cities
Information / Activities 2003 2004 2005 2006 2007 2008 2009 2010
Population (million) 108 111 113 115 117 120 121 122
Jobs (million)1 13 13 14 14 14 15 15 15
Household month average income (USD) 608 603 614 642 664 747 771 799
Vehi
cles PT (million) 0.093 0.095 0.098 0.097 0.101 0.102 0.103 0.106
IMT (million) 17.9 18.9 19.9 20.9 23.9 25.9 27.9 29.9
Total (million) 18 19 20 21 24 26 28 30
Billi
on K
m-P
ass PT 187 192 199 208 217 226 230 236
Auto 106 108 113 116 119 122 123 128
Moto 7 8 9 10 11 12 14 15
IMT - total 113 116 121 125 130 134 137 143
Total 300 308 320 333 347 360 367 379
Notes: 1- Industry and commerce (FIBGE, 2011); PT = Public Transport; IMT = Individual Motorized Transportation Source: Authors based on ANTP (2011).
Figure 2: Household income, vehicle storage and transportation demand (2003-2010)

49
Brazilian Journal of Operations & Production ManagementVolume 10, Number 2, pp. 43-56.
Maciel, M.S.D.; Maruyama, Ú.G.R; Neves, A.M.C.
R$ 7.7 billion (USD 4.6 billion) is attributable to
damage caused by individual motorized vehicles.
Additionally, atmospheric pollution costs
include human health harm and environment
damage. Pollution may arise directly from ve-
hicles emissions or indirectly from the transpor-
tation system infrastructure maintenance: oil
& gas upstream and downstream procedures,
roads construction and maintenance, vehicles
production (Litman, 2009). Motor vehicles are
the dynamic pollution source, once vehicles op-
erate in close proximity to people (vehicle us-
ers and pedestrians), and imprints direct impact
over society.
In Brazil, there has been a significant effort
to reduce motor vehicles pollutants. Although
considerable advances have been made (MMA,
2010), the total ammount of pollutants emitted
by the passenger transportation sector is still sub-
stantial. Yet, individual motorized transportation
(IMT) is responsible for 83% transportation sec-
tor CO2 emitted (public transport generates only
2%). IMT also generates 23% CO2 sector emis-
sion, opposed to less than half its ratio of mass
transportation (11%). Table 3 deploys both types
(IMT and mass transportation) representing al-
most the same number of passengers per year (cir-
ca 17 billion) in Brazil.
Out of the 28.1 million ton pollutants gen-
erated in 2008 by passenger transportation in
Brazil, 18.3 million were produced by IMT (17.1
million ton by motor cars). Mass transport emit-
ted 9.8 million tons. As a result, IMT accounts for
65% total pollutant emissions in Brazilian cities.
In computing accident costs and pollutant costs –
total of USD 55.0 billion (in the last 7 years) - USD
40.1 billion was generated by IMT and only USD
10.7 billion from mass transport (ANTP, 2010).
Moreover, public transportation deployed more
than 2,338 billion km-passengers in 7 years while
IMT produced 2,266 billion. Figure 3 shows
transportation health costs evolution.
4.2 Energy Costs The transportation system requires large
petroleum products amounts both in the system
construction and then in its infrastructure man-
agement (Brand and Preston, 2010). The energy
usage intensity in the transportation sector in-
creases substantially in societies that chose an
automobile-centered system.
Although Brazil has fewer motor vehicles
per thousand inhabitants compared to other
countries, a significant upward trend can be seen
in this index since 2003, as shown in Figure 4.
Considering data in others emerging countries is
possible to check the tendencies: Latin America
and Caribbean have 118 cars per thousand in-
habitants (2003); Chile has 109 cars per thousand
inhabitants (2009); Paraguay has 39cars per thou-
sand inhabitants (2008); Venezuela has 107 cars
Table 3: Passengers transported (public x individual), local pollutants and greenhouse gases emissions
Emissions 2008/2009 Public Transport Individual Transport
Passengers/year 16.8 billion 17.0 billion
CO (2%) 34,000 ton (83%) 1,500,000 ton
NOx (14%) 147,000 ton (9%) 94,500 ton
CO2 (11%) 18,700,000 ton (23%) 39,100,100 ton
Source: MMA (2010).
Figure 3: Passenger Transport Health costs

50
Brazilian Journal of Operations & Production ManagementVolume 10, Number 2, pp. 43-56.
Issues and trends on sustainable transportation: the case of Brazilian cities (2003-2010)
per thousand inhabitants and Uruguay has 151
cars per thousand inhabitants.
Data in developing countries depicts the
consolidated major numbers: USA has 451 cars
per thousand inhabitants; United Kingdom has
463 cars per thousand inhabitants; Switzerland
has 522 cars per thousand inhabitants; and
France has 495 cars per thousand inhabitants
in 2009 (Denatran, 2010; World Bank, 2011).
Nowadays, Brazilian cities with over 60,000 in-
habitants consume around 80 million tones in
their journeys between 2003 and 2009. Motor
cars alone consume almost 73% of this total
energy, while public transportation consumes
24.65% (figure 5).
The situation is worsened in cities with over
a million inhabitants. Due to the massive IMT us-
age large cities deploys eight times more energy
per inhabitant than smaller cities.
Figure 6 presents large cities with more than a
million inhabitants. Approximately 634 petroleum
equivalent grams (PEG) are consumed per person
per day, while in small cities (less than 100,000 in-
habitants) this ratio is only 78 PEG (ANTP, 2009).Figure 4: Cars per thousand inhabitants in BrazilSource: DENATRAN ( 2010).
Figure 5: Consumption of final energy in Brazilian cities (cars X overall consumption)
Figure 6: Energy consumed per inhabitant per day by transport type (Petroleum Equivalent Grams) - 2009Key: CT – Public Transport; IT – Individual TransportSource: MMA, 2010.

51
Brazilian Journal of Operations & Production ManagementVolume 10, Number 2, pp. 43-56.
Maciel, M.S.D.; Maruyama, Ú.G.R; Neves, A.M.C.
4.3 Infrastructure costs The transportation infrastructure manage-
ment cost in Brazil includes public expenditures
on transportation system maintenance. It sums
R$ 11.1 billion (approximately USD 6.66 bil-
lion) per year: R$ 10.4 billion (USD 6.2 billion)
are IMT mobility promotion-oriented, and only
R$ 0.7 billion (approximately USD 0.4 billion)
is mass transport-oriented (ANTP, 2009).
Considering the value of assets (e.g. land,
constructions, etc.) allocated in urban transpor-
tation, it amounts up to R$ 1.65 trillion (USD
1.00 trillion). Figure 7 presents that out of this
total, R$ 1.44 trillion (USD 0.86 trillion) is al-
located to IMT and R$ 0.21 trillion (USD 0.12
trillion) is allocated to mass transport.
4.4 The use of public space Modal transportation is related to urban
space usage of transportation and also with its
geographical availability. Figure 8 depicts spa-
tial, speed and performance features of some
urban transportation modes. Performance index
represents the speed over space consumption ra-
tio. Public transportation accounts for 10 times
less space than individual
motorized transportation.
In individual motorized
transportation oriented-
cities a large amount of
space must be used in or-
der to urban mobility than
those mass transportation
oriented-cities.
Taking the bus
(mass transportation) as
a benchmark, Figure 8
illustrates a flagrant dis-
proportionality in the us-
age of Brazilian cities road
space. For instance, cars
occupy 21 m², buses 54 m², and motorcycles 8
m², average. However, cars represent less than
2 people per vehicle (Brazilian statistics average
1.5 person per vehicle) and motorcycles carry
1.1 person per vehicle. On the other hand, buses
transport 30 passengers per vehicle average in
Brazil (ANTP, 2009).
Figure 7: Infrastructure costs, 2009 (Million USD)Key: CT – Public Transport; IT – Individual TransportSource: MMA (2010).
Figure 8: Performance of transport modesSource: Tolley and Turton (1995).

52
Brazilian Journal of Operations & Production ManagementVolume 10, Number 2, pp. 43-56.
Issues and trends on sustainable transportation: the case of Brazilian cities (2003-2010)
Quinet (1994) argues the road system ex-
pansion is socially justified. According to him,
the region real estate value where road system
expansion occurs is increased. Litman (1995),
however, states this view ignores time expendi-
ture, money and manpower required to accom-
modate a system based on light-duty vehicle,
which is greater than to boost other means of
transportation.
Litman (1995) also notes that the land desig-
nation for road construction results in a scale dis-
economy due to the providing services costs, such
as electricity, water, and garbage collection, to a
sparsely populated area.
This transportation system model also has
an expansionist effect in urban areas, in some
cases leading to unregulated expansion, and cre-
ates independent or isolated zones within the city.
This can lead to further public expenses, includ-
ing passage of vehicles infrastructure duplication,
public and private services doubled efforts, and
expanded areas for parking and private garages
(Kelbaugh, 1992).
5 Comparative performance model
A simple comparative model was developed
in order to illustrate the inefficiency conflict be-
tween IMT and PT (public transportation) mode.
Firstly demand data and its costs will be presented
(table 4). Secondly a comparative model will be
shown to demonstrate the efficiency discrepancy
between IMT and PT mode (table 5).
The numerical simulation of efficiency was
obtained thought this simple equation:
Efficiency = input / output ratio = costs/ km-passengers
The aforementioned equation means trans-
portation system efficiency equals system gener-
ated costs divide by passengers amount times
considered distance. Besides, table 5 provides in-
formation related to the comparative efficiency
model where CT (collective transport) is 4.5 times
more efficient than IMT (avoiding health costs)
and around 17 times more efficient (avoiding in-
frastructure costs). Considering greenhouse gas
emissions, CT is almost 3 times more efficient
than cars and almost 2
times than motorcycles. In
the case of pollution emis-
sions, CT is 9.7 times more
efficient than cars and 16.2
times than motorcycles. In
terms of energy consump-
tion CT is 5.3 times more
efficient than cars and 2.16
times more efficient than
motorcycles.
A new scenario could
be estimated, considering
a more restricted potential
situation. If it is possible to
substitute the whole trans-
portation demand pro-
Figure 9: Relative consumption and impact of the use of buses, motorcycles and cars in Brazilian cities Key: CT – Public TransportSource: ANTP (2009).

53
Brazilian Journal of Operations & Production ManagementVolume 10, Number 2, pp. 43-56.
Maciel, M.S.D.; Maruyama, Ú.G.R; Neves, A.M.C.
Table 4: External costs from realized demand – Brazilian Cities
Year 2003 2004 2005 2006 2007 2008 2009 Sum
Billion Km-pass
Moto 7 8 9 10 11 12 14 71
Cars 106 108 113 116 119 122 123 807
CT 187 192 199 208 217 226 230 1459
Total 300 308 321 334 347 360 367 2337
Energy Millions TOE
Moto 0.2 0.2 0.3 0.3 0.3 0.4 0.4 2.1
Cars 7.6 7.8 8.1 8.3 8.6 8.8 8.9 58.1
CT 2.6 2.7 2.8 2.8 2.9 2.9 3.0 19.7
Total 10.4 10.7 11.2 11.4 11.8 12.1 12.3 79.9
Pollution Thousand Tones
Moto 176 175 176 175 175 176 179 1,232
Cars 1,160 1,172 1,100 1,146 1,200 1,237 1,272 8,287
CT 255 230 226 218 214 212 208 1,563
Total 1,591 1,577 1,502 1,539 1,589 1,625 1,659 11,082
CO2 Thousand Tones
Moto 602 653 712 788 890 1,005 1,107 5,757
Cars 13,813 14,167 14,716 15,129 15,559 15,909 16,118 105,411
CT 8,720 9,093 9,376 9,281 9,386 9,604 9,617 65,077
Total 23,135 23,913 24,804 25,198 25,835 26,518 26,842 176,245
Health Costs Billion USD
TI 4.22 4.61 5.06 5.39 6.17 6.94 7.67 40.1
CT 1.22 1.33 1.39 1.44 1.61 1.78 1.89 10.7
Total 5.90 6.45 6.99 7.41 8.43 9.46 10.36 55.0
Infrastructure Billion USD
TI 4.06 4.44 4.72 4.94 5.28 5.78 6.11 35.3
CT 0.28 0.33 0.33 0.33 0.39 0.39 0.44 2.5
Total 4.70 5.18 5.48 5.72 6.14 6.69 7.11 41.0
Table 5: Comparative Efficiency Model
Input/output Year 2003 2004 2005 2006 2007 2008 2009 Sum/Av
Billion Km-pass
Moto 7 8 9 10 11 12 14 71
Cars 106 108 113 116 119 122 123 807
CT 187 192 199 208 217 226 230 1459
Total 300 308 321 334 347 360 367 2337
Energy Efficiency Millions TOE/bi
km-pass
Moto 0.03 0.03 0.03 0.03 0.03 0.03 0.03 0.03
Cars 0.07 0.07 0.07 0.07 0.07 0.07 0.07 0.07
CT 0.01 0.01 0.01 0.01 0.01 0.01 0.01 0.01
Average 0.04 0.04 0.04 0.04 0.04 0.04 0.04 0.04
Pollution Efficiency Thousand Tones/
bi Km-pass
Moto 25.14 21.88 19.56 17.50 15.91 14.67 12.79 18.20
Cars 10.94 10.85 9.73 9.88 10.08 10.14 10.34 10.28
CT 1.36 1.20 1.14 1.05 0.99 0.94 0.90 1.08
Average 12.48 11.31 10.14 9.48 8.99 8.58 8.01 9.86
CO2 Efficiency Thousand Tones/
bi km-pass
Moto 86.00 81.63 79.11 78.80 80.91 83.75 79.07 81.32
Cars 130.31 131.18 130.23 130.42 130.75 130.40 131.04 130.62
CT 46.63 47.36 47.12 44.62 43.25 42.50 41.81 44.76
Average 87.65 86.72 85.49 84.61 84.97 85.55 83.98 85.57
Health Costs Efficiency bi USD/
bi km-pass
TI 0.037 0.040 0.041 0.043 0.047 0.052 0.056 0.045
CT 0.007 0.007 0.007 0.007 0.007 0.008 0.008 0.007
Average 0.022 0.023 0.024 0.025 0.027 0.030 0.032 0.026
Infrastructure Efficiency bi USD/
bi km-pass
TI 0.036 0.038 0.039 0.039 0.041 0.043 0.045 0.040
CT 0.001 0.002 0.002 0.002 0.002 0.002 0.002 0.002
Average 0.019 0.020 0.020 0.020 0.021 0.022 0.023 0.021

54
Brazilian Journal of Operations & Production ManagementVolume 10, Number 2, pp. 43-56.
Issues and trends on sustainable transportation: the case of Brazilian cities (2003-2010)
duced in IMT mode by CT mode, what should be
the results in terms of energy consumption, gases
emissions and social costs? We can do this simula-
tion using the ratio I/O’s (input output ratio). The
new costs chart is shown on table 6.
6 Conclusions
This study demonstrated the Brazilian cities
case, which struggles facing the absence of ade-
quate and urgent public policies. Unless the real
individual motorized transportation expenditure
is calculated, a shortage of roads and highways
space will remain. Growing amount demanded for
public transportation space is lesser than those of
public administration infrastructure supply. The
shortage appears in the form of road congestion,
increasing energy consumption, pollutant emis-
sions and financial costs.
By calculating the impacts of keeping un-
changed the current urban transportation system
in Brazilian cities, we found negative externali-
ties at high levels in Brazilian cities which tend to
increase rapidly in the next years. CO2 emissions
from passenger transportation in Brazil are esti-
mated to be responsible for 44% (approximately
59 million tons in 2009) of total transportation
sector, out of this rate, 65% is caused by cars and
motorcycles.
Thus, it can be inferred that it provides a
significant negative effect on Brazilian efforts to
curb such emissions. Currently, the individual mo-
torized vehicles growth and their increasingly use
Table 6: Comparative analysis
Input/output Year 2003 2004 2005 2006 2007 2008 2009 Sum Saved
Billion Km-pass
Moto 0 0 0 0 0 0 0 0
Cars 0 0 0 0 0 0 0 0
CT 300 308 321 334 347 360 367 2337
Total 300 308 321 334 347 360 367 2337
Energy Millions TOE
Moto 0.0 0.0 0.0 0.0 0.0 0.0 0.0 0.0
Cars 0.0 0.0 0.0 0.0 0.0 0.0 0.0 0.0
CT 4.2 4.3 4.5 4.5 4.6 4.6 4.8 31.6
Total 4.2 4.3 4.5 4.5 4.6 4.6 4.8 31.6 48.3
Pollution Thousand
Tones
Moto 0 0 0 0 0 0 0 0
Cars 0 0 0 0 0 0 0 0.0
CT 409 369 365 350 342 338 332 2,504
Total 409 369 365 350 342 338 332 2,504 8,578
CO2 Thousand Tones
Moto 0 0 0 0 0 0 0 0
Cars 0 0 0 0 0 0 0 0
CT 13989 14587 15124 14903 15009 15298 15345 104,256
Total 13,989 14,587 15,124 14,903 15,009 15,298 15,345 104,256 71,989
Health Costs Billion USD
TI 0.00 0.00 0.00 0.00 0.00 0.00 0.00 0.0
CT 1.96 2.14 2.24 2.32 2.58 2.83 3.01 17.1
Total 1.96 2.14 2.24 2.32 2.58 2.83 3.01 17.1 37.92
Infrastructure Billion USD
TI 0.00 0.00 0.00 0.00 0.00 0.00 0.00 0.00
CT 0.45 0.53 0.54 0.54 0.62 0.62 0.71 4.0
Total 0.45 0.53 0.54 0.54 0.62 0.62 0.71 4.0 37.02

55
Brazilian Journal of Operations & Production ManagementVolume 10, Number 2, pp. 43-56.
Maciel, M.S.D.; Maruyama, Ú.G.R; Neves, A.M.C.
in Brazil more than offset the advances in motor
vehicles fuel efficiency. In addition, social costs
related to road accidents and hospital costs rise
progressively estimating to reach USD 19 billion
in 2020. Similarly, infrastructure costs will exceed
USD 154 billion (ANTP, 2010).
The limited investment on road infrastruc-
ture should constrain the car usage in large
Brazilian cities at the end of the under analysis
period. Based on our findings, we recommend
that Brazil implement an emergency State Policy
requiring new planning to expand public trans-
portation modes, as well as restraining the use of
private cars and motorcycles in cities. This policy
should consider investments in public transpor-
tation modes cost-benefit analysis, including the
avoided external costs estimated in this study.
Given the lack of public revenues, the market
volatility and the short-term alternatives focus, it
is common in emerging economies to prioritize
expenditures on infrastructure for road transpor-
tation, especially for private cars. This emphasis
does not account for the external costs which were
identified in this paper.
References AEO, (2008) Anual Energy Outlook, Washington, EIA.
Anable, J. (2005) Complacent Car Addicts or Aspiring Environmentalists? Identifying travel behaviour segments using attitude theory. Transport Policy, 12, pp. 65-78.
ANTP (2009) ANTP, accessed on 26 Jan 2010, available at www.antp.org.br: http://portal1.antp.net/site/default.aspx
ANTP (2011) Http://portal1.antp.net/site/simob/default.aspx.Accessed on 9 jan 2012, available at www.antp.org.br/: www.antp.org.br/.
ANTT (2011). www.antt.gov.br. Acessed on 11 jul 2011, available at www.antt.gov.br.
BACEN (2011) BACEN, accessed on 19 may 2011, available at http://www.bcb.gov.br/.
Black, W. (2010) Sustainable Transportation: problems and solutions, Guilford Press, NY.
Bouf, D. and Hensher, D. (2007) The dark side of making transit irresistible: The example of France, Transport Policy,14, pp. 523-532.
BP(2007) BP Statistical Review of World Energy 2007, BP, London.
Brand, C. and Preston, J.M. (2010) ‘60-20 emission’— The unequal distribution of greenhouse gas emissions from personal, non-business travel in the UK, Transport Policy, 17 (1), pp. 9-19.
Buehler, R.and Pucher, J. (2011) Making public transport financially sustainable, Transport Policy, 18, pp. 126-138.
Chapman, L. (2007) Transport and climate change: a review, Journal of Transport Geography, 15 (5), pp. 354-367.
DENATRAN. (2011) DENATRAN, Accessed on 25 Feb 2011, available at www.denatran.gov.br: http://www.denatran.gov.br/frota.htm.
EIA (2007) Anual energy outlook 2007.DOE/EIA.
Feitelson, E. (2002) Introducing environmental equity dimensions into the sustainable transport discourse: issues and pitfalls, Transportation Research Part D, 7, pp. 99-118.
Elvik, R. (2006) Are individual preferences always a legitimate basis for evaluating the costs and benefits of public policy? The case of road traffic law enforcement, Transport Policy,13 (5), pp. 379-385.
Granados, J., (1998) Reducing automobile traffic: an urgent policy for health promotion, Rev Panam Salud Publica, pp. 227-241.
Gudmundsson, H., and Höjer, M. (1996) Sustainable development principles and their implications for transport, Ecological Economics, 19 (3), pp. 269-282.
Gwilliam, K.(2002) Cities on the move : a World Bank urban transport strategy review, World Bank, Washington D.C.
Gwilliam, K. (2008) A review of issues in transit economics, Research in Transportation Economics, 23 (1), pp. 4-22.
Han, J. and Hayashi, Y. (2008) A system dynamics model of CO2 mitigation in China’s inter-city passenger transport, Transportation Research Part D,13 (5), pp. 298-305.
IEA. (2002) Bus systems for the future: Achieving Sustainable Transport Worldwide, OECD/IEA, Paris.
IEA.(2008) CO2 Emissions From Fuels Combustions, OECD/IEA, Paris.
IPCC (2007) Summary for policy makers, Working group I contribution to the Intergovernmental Panel on Climate Change Fourth Assessment Report: climate change 2007—The physical science basis, Paris.

56
Brazilian Journal of Operations & Production ManagementVolume 10, Number 2, pp. 43-56.
Issues and trends on sustainable transportation: the case of Brazilian cities (2003-2010)
Kahn et al, S. (2007) 2007: Transport and its infrastructure. In: B. E. Metz. Climate Change 2007: Mitigation. Contribution of Working Group III to the Fourth, Cambridge University Press, NY.
Litman, T. (1995) Land use impact costs of transportation, World Transport Policy and Practice, 9-16.
Litman, T. (2009) VTPI. Accessed on 26 Sept 2009, available at www.vtpi.org: http://www.vtpi.org/future.pdf.
Litman, T., and Burwell, D. (2006) Issues in sustainable transportation, Int. J. Global Environmental Issues, 6, pp. 331-347.
MMA. (2010) MMA, Accessed on 3 July 2010, available at www.mma.gov.br
OPEC. (2007)World Oil Outlook 2007,OPEC, Vienna.
Parry, I., Walls, M., and Harrington, W. (2007) Automobile Externalities and Policies, Journal of Economic Literature, XLV, 374-400.
Pucher, J. et al. (2005) Urban transport crisis in India, Transport Policy, 12, pp. 185-198.
Quinet, E. (1994) The social costs of transport: evaluation and links with internalization policies. In: Button, K. Internalizing the Social Costs of Transport, OECD, Paris.
Rosa, L. P. (2003) Climate changes and gases emissions in the energy system:contributions from transport sector In: S. E. KAHN, Transportation and climate change (pp. 7-10), COPPE, Rio de Janeiro.
Schipper, L., and Eriksson, G. (1995) Taxation Policies Affecting Automobile Characteristics and Use in Western Europe, Japan and the United States. In: D. Sperling, and S. Shahen, Transportation and Energy: Strategies for a Sustainable Transportation System (pp. 217-242), America Council for an Energy Efficient Economy, Washington.
Schipper, L. (2011). Automobile use, fuel economy and CO2 emissions in industrialized countries: Encouraging trends through 2008?, Transport Policy, 18 (2), pp. 358-372.
Sperling, D., and Gordon, D. (2008) Two Billion Cars.TR News, 259, pp. 2-9.
Thomas, J. et al. (2004). Integrating qualitative research with trials in systematic reviews. British Medical Journal, vol. 328, n. 7446, pp. 1010–2.
Tolley, R. and Turton, B. (1995) Transport systems, policy and planning: a geographical approach. New York: Longman.
Vasconcellos, E. (2000) Transporte urbano nos países em desenvolvimento, Anablume, São Paulo.
Vasconcellos, E. (2005a) Transport metabolism, social diversity and equity: The case of São Paulo, Brazil, Journal of Transport Geography, pp. 329-339.
Vasconcellos, E. (2005b) Urban change, mobility and transport in São Paulo: three decades, three cities, Transport Policy, 12 (2), pp. 91-104.
Vasconcellos, E. (2008) Transporte e meio ambiente: conceitos e informações para análise de impactos, Anablume, São Paulo.
WBSCD. (2004) Mobility 2030: Meeting the challenges to sustainability, World Business Council for Sustainable Development, Geneva.
WHO (2004) World Report on Road Traffic Injury prevention, World Health Organization, Geneva.
WOO (2010) Organization of the Petroleum Exporting Countries, OPEC Secretariat, Vienna.
World Bank (2002) Cities on the Move: A World Bank Urban Transport Strategy Review, The International Bank for Reconstruction and Development, Washington.
World Bank (2011) World Bank, Accessed on 31 May 2011, available at http://data.worldbank.org/indicator.
Wright, C. and Egan, J. (2000) De-marketing the car, Transport Policy, 7 (4), pp. 287-294.