issue review - iowa
TRANSCRIPT
ISSUE REVIEW Fiscal Services Division
January 5, 2017
Iowa Road Funding
ISSUE This Issue Review examines road funding revenue in Iowa from FY 2011 to FY 2015. Road construction, maintenance, and supervision in Iowa is administered by the Iowa Department of Transportation (DOT), county, and city governments. Data discussed in this Issue Review is collected and reported by the DOT. AFFECTED AGENCIES Iowa Department of Transportation (DOT), Iowa counties and cities
CODE AUTHORITY Iowa Code chapters 306, 312, and 312A Iowa Constitution Article VII, section 8
BACKGROUND and FUNDING JURISDICTION
The outline of jurisdiction over roadways began to take shape in the 1920s, and remains similar today. In 1925, the Primary Road Law gave the Iowa Highway Commission (now Department of Transportation) jurisdiction over the Primary Road System (1925 Iowa Acts, chapter 114). Four years later, the General Assembly defined secondary roads and established county jurisdiction over these roads, and cities received jurisdiction over municipal roads shortly thereafter (1929 Iowa Acts Chapter 20).
Iowa Code section 306.4 (Jurisdiction of Systems) specifies the jurisdiction of Iowa roads between cities, counties, and the State. Jurisdictions are defined as follows (Iowa Code section 306.3): • Municipal Streets: streets within municipalities that are not primary roads or secondary
roads under city jurisdiction. • Farm-to-Market Roads: roads under county jurisdiction that “serve principal traffic
generating areas and connect such areas to other farm-to-market roads and primary roads”. Farm-to-Market roads may be intra-county and inter-county.
• Secondary Roads: roads under county jurisdiction. • Primary Roads: roads and streets within and outside municipalities that are under the
jurisdiction of the DOT.
County maps displaying the primary, secondary and farm-market systems can be found here.
Jurisdictions City and County Funding In addition to receiving State and federal funds, local governments also rely on local revenues and bonding to fund road construction and maintenance. Cities report these revenues annually to the DOT. Counties annually report to the Iowa County Engineers Association and the DOT. Unlike revenues collected by State government, funds collected by local governments are not

ISSUE REVIEW 2 January 5, 2017 restricted for road use.1 Road funding decisions by local sources, such as property tax and bond revenue, are considered in the normal budgeting and decision-making process of either the county board of supervisors or city council, and thus compete with other budget priorities. Specific revenue streams will be discussed in a later section.
State Funding Road funding collected by the State is deposited in two funds, the Road Use Tax Fund (RUTF) and the TIME-21 Fund.2 The RUTF was established in 1949 by the 53rd Iowa General Assembly to fund investment in the State's primary, secondary, and municipal roadway systems (1949 Iowa Acts Chapter 122). The RUTF provides the majority of State road funding. Vehicle registration fees and motor fuel taxes provide most of the RUTF revenues. The RUTF moneys are distributed by formula and fund the construction and maintenance of roads and bridges on the State’s Primary Road System, the county secondary system and farm-to-market system, and city municipal streets. Before the revenues are distributed, various allocations and appropriations are made from the RUTF per Iowa Code section 312.2 and the Iowa Acts. The net revenues from the RUTF are distributed as follows: 47.5% for the Primary Road Fund, 24.5% for county secondary road funds, 8.0% percent for farm-to-market fund, and 20.0% for city street construction funds.
In 2007, the General Assembly established the TIME-21 Fund to provide additional road funding revenue (2007 Iowa Acts chapter 200). Revenues to the Fund include annual vehicle registration fees in excess of $392.0 million, title and salvage fees, and trailer registration fees. Revenues from the TIME-21 Fund are distributed according to a formula of 60.0% to the Primary Road Fund, 20.0% to the Secondary Road Fund, and 20.0% for the city street construction fund. The DOT forecast for State road funding in FY 2016 is displayed in Attachment A.
Federal Road Funding The U.S. Highway Trust Fund (HTF) was established in 1956 to fund the interstate highway system and enable long-term planning.3 The Fund reimburses State transportation agencies for federal-aid construction projects in addition to supporting federal mass transit programs and the federal Leaking Underground Storage Tank Fund. The HTF was authorized for a 13-year period from FFY 1957 to FFY 1969, but has been extended many times. To maintain HTF activities, Congress must periodically extend the authorization to collect and expend HTF revenues. In recent years, several short-term extensions have been authorized. For more than 10 years, congressional appropriations from the HTF have exceeded federal HTF revenue. Congress used the existing HTF balance to maintain appropriations without increasing HTF revenue, but in 2008 the balance was depleted. Since 2008, Congress has transferred General Fund revenue to the HTF to sustain funding levels. In December of 2015, Congress enacted the Fixing America’s Surface Transportation Act (FAST Act). The FAST Act authorizes HTF activities through Federal Fiscal Year (FFY) 2020.
ROAD FUNDING Revenue from local governments reflected in this Issue Review is reported to the Iowa DOT each year. Revenue collected by the State of Iowa is reported by the Legislative Services Agency (LSA) based on records from the State Treasurer. Federal funding is reported by the Iowa DOT.
1 The RUTF and TIME-21 funding transferred to cities and counties is restricted for road use only. For the purposes of this review they are considered part of the State share of road funding. 2 Transportation Investment Moves the Economy in the 21st Century 3 The Federal Excise Tax on Gasoline and the Highway Trust Fund: A Short History, http://fas.org/sgp/crs/misc/RL30304.pdf, 9/7/2012.

ISSUE REVIEW 3 January 5, 2017
Cities In Iowa, 946 cities report financial information to the Iowa DOT. These city governments maintain 14,965 miles of roads or 13.1% of all roads in Iowa. Of the total, 1,336 city road miles, about 8.9% are unpaved. Mileage data for the entire transportation system can be found here. Cities also maintain 1,132 bridges, about 4.6% of all bridges in Iowa. Unlike State sources of road funding, local road budgets are discretionary and may fluctuate based on other priorities. Municipal governments are required to adopt and submit a budget for the next fiscal year, (beginning July 1) to the Iowa Department of Management (DOM) and county auditor by March 15 each year. The budgeting process requires cities to provide public notice, budget copies, and a public hearing prior to adoption. Table 1 displays city-controlled revenue sources used for the construction and maintenance of municipal roads and bridges in Iowa. Table 1 displays revenues collected by city governments and does not reflect State or federal revenues that are allocated to local governments for road construction. Individual city reports are published by the Iowa DOT and can be downloaded individually. Funding displayed in these reports includes revenue used specifically for roads and revenue allocated to service bonds associated with the road construction. Total road funding receipts peaked in FY 2015 at $663.7 million. The peak was driven by additional debt service and road construction from bonds and loans and an increase in property tax revenues. Funding from property tax peaked in FY 2015 at $231.7 million. A drop in bond revenue in FY 2013 and FY 2014 was partially offset by increases in property tax and State funding. Attachment B displays all funding that cities used for road construction in the five-year period.
Table 1 – City Road Revenue
(in millions)
Counties County road and bridge construction information is reported to the Iowa County Engineers Association (ICEA) each year. Counties maintain nearly 90,000 miles of roads that represent 78.2% of all roads in Iowa. Of the total, 70,746 (78.8%) of county roads are unpaved and mostly gravel. The county system includes 19,004 bridges, approximately 77.1% of all bridges in Iowa. An interactive map displaying all city, county, and State bridges within Iowa is maintained here. The board of supervisors for each county is required to finalize a budget by March 15 for the next fiscal year. Like municipal governments, counties have no single protected source for road funds, and revenues allocated to road construction can fluctuate. However, the Iowa Code does provide maximum and minimum dollar amounts for counties to transfer to the secondary road fund (SRF).4 Adopted budgets are submitted to the county auditor and the Department of management. Counties are required to provide public notice and hold a hearing.
4 Transfers to the SRF from the General Fund may not exceed 16.875 cents per $1,000 of assessed value. For the Rural Fund the limitation is $3.004 per $1,000 assessed value. Annual transfers to the SRF for each county must be at least 75.0% of the sum of the limitation described above.
FY 2011 FY 2012 FY 2013 FY 2014 FY 2015
CITY FUNDINGProperty Tax 188.83$ 178.47$ 205.89$ 222.57$ 231.71$ Bonds Sold, Notes And Loans 265.21 303.79 200.35 199.78 260.17 Sales Tax / Local Option 48.74 60.82 61.49 54.67 60.79 Tax Increment Financing 23.41 24.96 22.62 20.10 25.26 General Fund Transfers 12.23 9.28 15.93 18.84 12.32 Miscellaneous 51.16 62.32 61.52 53.70 73.44
Total Revenue Levied By Cities 589.57$ 639.63$ 567.78$ 569.66$ 663.69$
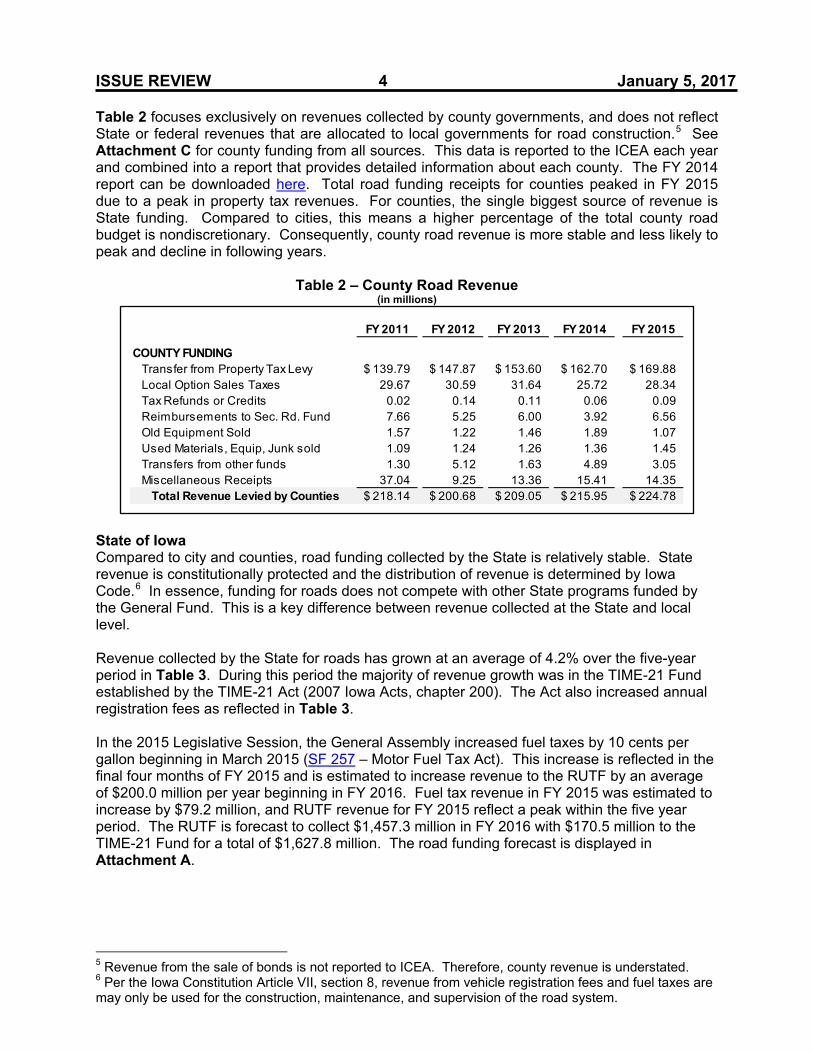
ISSUE REVIEW 4 January 5, 2017 Table 2 focuses exclusively on revenues collected by county governments, and does not reflect State or federal revenues that are allocated to local governments for road construction.5 See Attachment C for county funding from all sources. This data is reported to the ICEA each year and combined into a report that provides detailed information about each county. The FY 2014 report can be downloaded here. Total road funding receipts for counties peaked in FY 2015 due to a peak in property tax revenues. For counties, the single biggest source of revenue is State funding. Compared to cities, this means a higher percentage of the total county road budget is nondiscretionary. Consequently, county road revenue is more stable and less likely to peak and decline in following years.
Table 2 – County Road Revenue (in millions)
State of Iowa Compared to city and counties, road funding collected by the State is relatively stable. State revenue is constitutionally protected and the distribution of revenue is determined by Iowa Code.6 In essence, funding for roads does not compete with other State programs funded by the General Fund. This is a key difference between revenue collected at the State and local level. Revenue collected by the State for roads has grown at an average of 4.2% over the five-year period in Table 3. During this period the majority of revenue growth was in the TIME-21 Fund established by the TIME-21 Act (2007 Iowa Acts, chapter 200). The Act also increased annual registration fees as reflected in Table 3. In the 2015 Legislative Session, the General Assembly increased fuel taxes by 10 cents per gallon beginning in March 2015 (SF 257 – Motor Fuel Tax Act). This increase is reflected in the final four months of FY 2015 and is estimated to increase revenue to the RUTF by an average of $200.0 million per year beginning in FY 2016. Fuel tax revenue in FY 2015 was estimated to increase by $79.2 million, and RUTF revenue for FY 2015 reflect a peak within the five year period. The RUTF is forecast to collect $1,457.3 million in FY 2016 with $170.5 million to the TIME-21 Fund for a total of $1,627.8 million. The road funding forecast is displayed in Attachment A.
5 Revenue from the sale of bonds is not reported to ICEA. Therefore, county revenue is understated. 6 Per the Iowa Constitution Article VII, section 8, revenue from vehicle registration fees and fuel taxes are may only be used for the construction, maintenance, and supervision of the road system.
FY 2011 FY 2012 FY 2013 FY 2014 FY 2015
Transfer from Property Tax Levy 139.79$ 147.87$ 153.60$ 162.70$ 169.88$ Local Option Sales Taxes 29.67 30.59 31.64 25.72 28.34 Tax Refunds or Credits 0.02 0.14 0.11 0.06 0.09 Reimbursements to Sec. Rd. Fund 7.66 5.25 6.00 3.92 6.56 Old Equipment Sold 1.57 1.22 1.46 1.89 1.07 Used Materials, Equip, Junk sold 1.09 1.24 1.26 1.36 1.45 Transfers from other funds 1.30 5.12 1.63 4.89 3.05 Miscellaneous Receipts 37.04 9.25 13.36 15.41 14.35
Total Revenue Levied by Counties 218.14$ 200.68$ 209.05$ 215.95$ 224.78$
COUNTY FUNDING

ISSUE REVIEW 5 January 5, 2017
Table 3 – Road Use Tax Fund Revenue (in millions)
Federal Federal road funding is determined by two Congressional actions. A federal highway authorization act is required for the U.S. DOT to continue operation. Authorization acts expire at varying intervals, both long and short-term, and create specific programs for aspects of the highway system. Program funding to states, or apportionments, are determined by formula and make funds available for states to obligate for projects. States are reimbursed for project expenditures once the project is completed and as a result apportioned funds may not be paid to states in the apportionment year. The following major programs were funded in Moving Ahead for Progress in the 21st Century Act (MAP-21), the 2012 authorization. The FAST Act continued these programs, and created the National Highway Freight Program (NHFP).7 • The National Highway Performance Program (NHPP) provides “support for the condition
and performance of the National Highway System (NHS), for the construction of new facilities on the NHS, and to ensure that investments of federal-aid funds in highway construction are directed to support progress toward the achievement of performance targets established in a state's asset management plan for the NHS.”8
• The Surface Transportation Program (STP) “provides flexible funding that may be used by states and localities for projects to preserve and improve the conditions and performance on any federal-aid highway, bridge and tunnel projects on any public road, pedestrian and bicycle infrastructure, and transit capital projects, including intercity bus terminals”.9 The STP was renamed the Surface Transportation Program Block Grant under the FAST Act.
• MAP-21 continues the Highway Safety Improvement Program (HSIP) to “achieve a significant reduction in traffic fatalities and serious injuries on all public roads, including non-state-owned public roads and roads on tribal lands. The HSIP requires a data-driven, strategic approach to improving highway safety at all public roads that focuses on performance”.10
• The Railway-Highway Crossings Program “funds safety improvements intended to reduce the number of fatalities, injuries, and crashes at public grade crossings.”11
7 Iowa is expected to receive an apportionment of approximataley $2.0 million per year from the NHFP). 8 National Highway Performance Program, http://www.fhwa.dot.gov/map21/factsheets/nhpp.cfm. 9 Surface Transportation Program, http://www.fhwa.dot.gov/map21/factsheets/stp.cfm. 10 Highway Safety Improvement Program, http://safety.fhwa.dot.gov/hsip/. 11 Railway-Highway Crossings Program, http://www.fhwa.dot.gov/map21/factsheets/rhc.cfm.
FY 2011 FY 2012 FY 2013 FY 2014 FY 2015
ROAD USE TAX FUNDMotor Fuel Tax 435.8$ 430.4$ 430.7$ 451.3$ 501.2$ Registration and Title Fees 392.0 392.0 392.3 391.7 392.0 Fee for New Registration 267.0 285.8 301.5 315.6 338.3 Interest 1.5 1.7 2.0 2.0 2.5 Underground Storage Tank Fees 17.7 24.9 20.8 21.3 21.5 Other 11.8 10.0 11.4 9.5 13.6 Statutory Allocations Fund 21.3 21.0 26.9 35.1 33.8
Total RUTF Revenue 1,147.2$ 1,165.9$ 1,185.6$ 1,226.6$ 1,303.0$
TIME-21Registration and Title Fees 101.3$ 123.6$ 141.6$ 152.4$ 167.7$
Total TIME-21 Revenue 101.3$ 123.6$ 141.6$ 152.4$ 167.7$
Total Road Funding Receipts 1,248.5$ 1,289.5$ 1,327.3$ 1,379.0$ 1,470.6$

ISSUE REVIEW 6 January 5, 2017 • The Congestion Mitigation and Air Quality Improvement Program (CMAQ) “is continued
in MAP-21 to provide a flexible funding source to state and local governments for transportation projects and programs to help meet the requirements of the Clean Air Act. Funding is available to reduce congestion and improve air quality for areas that do not meet the National Ambient Air Quality Standards for ozone, carbon monoxide, or particulate matter (nonattainment areas) and for former nonattainment areas that are now in compliance (maintenance areas).”12
• The Metropolitan Planning “process establishes a cooperative, continuous, and comprehensive framework for making transportation investment decisions in metropolitan areas. Program oversight is a joint Federal Highway Administration Federal Transit Administration responsibility.”13
A second congressional action limits the total amount of funding that states can obligate within an individual year, usually referred to as obligation authority. This is necessary because apportionments are authorized ahead of time in the highway authorization act. This limitation ensures that federal funds are not obligated too quickly and that funding will not be depleted.
Table 4 shows federal apportionment and obligation authority provided by the DOT and the Federal Highway Administration (FHWA) for each federal fiscal year (FFY).14 Note that this does not reflect actual receipts received by the Iowa DOT. Prior to MAP-21, highway funding was operating under a prior highway authorization (SAFETEA-LU), and these numbers are noted under the prior authorization in Table 4. Program details for SAFETEA-LU are available but not discussed in this document. Generally SAFETEA-LU programs are consolidated within MAP-21 programs. The total amount apportioned to Iowa varies based on authorization. Iowa’s obligation authority ranged between $441.35 and $462.13 million during this time period.
Table 4 – Iowa Federal Apportionments and Obligations15 (in millions)
12 Congestion Mitigation and Air Quality Improvement Program, http://www.fhwa.dot.gov/map21/factsheets/cmaq.cfm. 13 Metropolitan Planning, http://www.fhwa.dot.gov/map21/factsheets/mp.cfm. 14 Apportionments from FFY 2011-FFY 2015 are supplied by the FHWA and the total obligation authority is supplied by the Iowa DOT. 15 Enacted federal authorizations or apportionments typically exceed available funding, and Congress limits the total funds that a state may obligate in a given year. This table does not include the redistribution of certain funds. These funds are typically between $1.0 and $2.0 million per year.
FFY 2011 FFY 2012 FFY 2013 FFY 2014 FFY 2015Prior Apportionment 499.34$ 466.17$ -$ -$ -$
MAP-21 Apportionment National Highway Performance Program $ - $ - $ 287.37 $293.75 $293.75 Surface Transportation Program - - 132.17 135.11 135.11Highway Safety Improvement Program - - 26.37 27.05 27.05Railway-Highway Crossings Program - - 5.20 5.23 5.23Congestion Mitigation & Air Quality Improvement - - 11.04 11.28 11.28Metropolitan Planning Program - - 1.88 1.92 1.92
Total Apportioned $ 499.34 $ 466.17 $ 464.04 $474.35 $474.35
Total Obligation Authority 462.13$ 441.35$ 444.81$ 450.47$ 455.60$
ISSUE REVIEW 7 January 5, 2017
OTHER STATES This section reviews additional features of road funding systems in use by other states. This is not a comprehensive list, but a few key features found in other states will be discussed below. The National Conference of State Legislatures (NCSL) published an extensive list of road funding options in Surface Transportation Fund: Options for States. • Mileage-Based User Fees (MBUF) - Fees are levied to drivers for total miles travelled on
the road system. Currently, MBUF programs are being studied or tested in California, Colorado, Florida, Indiana, Minnesota, New York City, Nevada, Oregon, Texas and Washington. The University of Iowa also conducted a national MBUF study. The programs utilize an on-board computer, smart phone, odometer or GPS device to track the mileage of users. To date, Oregon has developed the largest pilot program. The Oregon pilot is accepting 5,000 volunteer drivers that will pay 1.5 cents per mile travelled. No states have implemented a statewide MBUF program. A MBUF system may also allow for additional innovations such as congestion pricing that would charge motorists variable rates on certain routes during periods of heavy traffic.
• Bond Issuance – The State of Iowa repealed Iowa Code chapters that authorized the issuance of bonds for the construction of primary roads in 1949.16 Since 1949, the State has relied on normal road revenues to fund annual road construction activities. Cities and counties still rely on bond issuance to support construction on the municipal and secondary systems. Most other states are servicing debt related to primary highways including, Minnesota, Wisconsin, Illinois, and Kansas. A complete list of state indebtedness related to highways is published by the FHWA (State Obligations For Highways – 2013).
• Transportation Improvement District – A defined geographic area that may raise funding through taxes or bond measures to fund transportation improvements within an area. The creation of these districts is authorized by a state legislature and typically requires voter approval. Missouri prominently uses districts called Transportation Development Districts that may impose property taxes, sales taxes, collect tolls or fees, and issue bonds.
• Road Tolling – This is not currently used to fund road construction in Iowa. Currently 31 other states use road tolls to support highway construction and maintenance activities. Nearby states that report toll revenue to the FHWA include Kansas and Illinois. A complete list of state governments that use tolls to fund highway activities is published by the FHWA (Disposition Of State Highway-User Revenues – 2013).
• Road Privatization – Various states have privatized state-owned transportation assets. State DOTs may sell or lease an asset to private companies that are then responsible for the operating and maintenance of the asset. Typically, eligible road assets are high usage segments such as the Chicago Skyway in Illinois.
• Public Private Partnerships (PPP) – Currently 33 states have passed legislation authorizing the use of PPPs in road and bridge construction. These partnerships are agreements between public agencies and private sector entities that allow the involvement of a private entity in a transportation project. The private company may be responsible for the renovation, construction, operation and maintenance of the asset. However, PPPs can take many different forms. The use of PPPs is not currently authorized in Iowa. A map displaying the use of PPPs for transportation is provided by the NCSL (Public Private Partnerships for Transportation).
16 Chapter 130 1949 Iowa Acts

ISSUE REVIEW 8 January 5, 2017 SUMMARY Table 5 shows all reported revenue that was used to fund roads in Iowa from FY 2011 through FY 2015. County and city funding reflect only revenues collected by local governments and do not include disbursements from the RUTF. City road revenues, not including RUTF or federal funding, peaked in FY 2016 due to an increases in the sale of bonds related to the construction and maintenance of roads and property tax revenues. County road revenues, not including RUTF or federal funding, peaked in FY 2015 due to an increase in property tax receipts. State funding, the single largest source of road funds in Iowa, continued to grow steadily. The total for FY 2015 reflects the largest year for RUTF receipts in the time frame reviewed. Note that SF 257 (Motor Fuel Tax Act) will increase RUTF receipts. Therefore, FY 2015 receipts will be eclipsed in FY 2016. For federal funding, the largest obligation amount available occurred in FY 2015.
Table 5 – Total Iowa Road Funding (in millions)
Chart 1 – Total Iowa Road Funding
Note: May not total 100.0% due to rounding.
STAFF CONTACT: Adam Broich (515-281-8223) [email protected]
City County State+ Federal* TotalFY 2011 589.6 218.1 1,248.5 462.1 2,518.3 FY 2012 639.6 200.7 1,289.5 441.4 2,571.2 FY 2013 567.8 209.1 1,327.3 444.8 2,548.9 FY 2014 569.7 216.0 1,379.0 450.5 2,615.1 FY 2015 663.7 224.8 1,470.6 455.6 2,814.7
+Includes RUTF and TIME-21 Fund.
Local
*Reflects federal f iscal years. The federal f iscal year begins on October 1.

ATTACHMENT A
FY 2016 FY 2017 FY 2018 FY 2019 FY 2020Motor Vehicle Registration Fees 476.19$ 485.08$ 494.14$ 503.37$ 512.77$ Motor Carrier Registration Fees & Prorate 65.59 65.92 66.25 66.58 66.91 Total Motor Vehicle and Carrier Registration Fees $ 541.78 $ 551.00 $ 560.39 $ 579.68 569.95 $
Motor Vehicle Fuel Tax 669.41$ 663.81$ 656.30$ 648.04$ 639.50$ Fee for New Registration 328.18 330.80 332.46 334.12 335.79 Interest 4.01 5.11 6.51 8.30 10.57 Underground Storage Tank Fees 21.59 21.44 21.22 20.98 20.73 Other* 14.94 16.71 15.34 17.10 15.72 Transfer from Statutory Allocations Fund 27.12 22.96 20.88 27.18 30.19
Total Receipts 1,607.03$ 1,611.83$ 1,613.10$ 1,625.67$ 1,632.18$ Transfer to TIME-21 Fund (Veh. Reg. Fees)** -149.78 -159.00 -168.39 -177.95 -187.68
Net Receipts 1,457.25$ 1,452.83$ 1,444.71$ 1,447.72$ 1,444.50$
FY 2016 FY 2017 FY 2018 FY 2019 FY 2020Trailer Reg. Fee Increase 10.90$ 11.19$ 11.48$ 11.79$ 12.01$ Title & Salvage Title Fee Increase 9.85 9.80 9.80 9.80 9.80Motor Vehicle Registration Fees 149.78 159.00 168.39 177.95 187.68Interest 0.01 0.01 0.01 0.01 0.01
170.54$ 180.00$ 189.68$ 199.55$ 209.50$
FY 2016 FY 2017 FY 2018 FY 2019 FY 2020Road Use Tax Fund 1,457.25$ 1,452.83$ 1,444.71$ 1,447.72$ 1,444.50$ TIME-21 Fund 170.54 180.00 189.68 199.55 209.50
Total State Road Fund Receipts 1,627.79$ 1,632.83$ 1,634.39$ 1,647.27$ 1,654.00$
* Includes miscellaneous licenses, permits, and fees, motor carrier fines, special license revenues, and any adjustments.**Motor vehicle and carrier registration fees in excess of $392.0 million.NOTE: Numbers may not equal totals due to rounding.
Source: Iowa Department of Transportation and Legislative Services Agency December 2015
(All Tables in Millions)
TIME-21 FundESTIMATED RECEIPTS AND ALLOCATIONS
ROAD USE TAX FUNDESTIMATED RECEIPTS, ALLOCATIONS, AND DISTRIBUTIONS
(All Tables in Millions)
(All Tables in Millions)
STATE ROAD FUNDS ESTIMATED RECEIPTS

Source: Street Finance Reports and Legislative Services Agency
Attachment B
Funding Allocated to City Road Construction
FHWA = Federal Highway Administration
FY 2011 FY 2012 FY 2013 FY 2014 FY 2015
Balance Brought Forward 260.25$ 302.84$ 366.69$ 354.52$ 388.76$
FEDERAL FUNDINGFederal Government (Misc.) 20.23$ 23.24$ 9.24$ 29.56$ 22.25$ FHWA Participation 46.42 14.48 10.91 9.26 11.25 Fed. Emergency Mgmt. Admin. 2.00 0.35 1.99 1.45 0.71 Comm Develop Block Grant 0.57 1.73 4.33 0.20 0.00 Miscellaneous 1.48 0.48 0.13 0.45 1.02
Total Federal Revenue To Cities 70.71$ 40.28$ 26.59$ 40.91$ 35.23$
STATE FUNDINGRoad Use Tax Fund 211.48$ 226.10$ 228.37$ 237.68$ 248.05$ Iowa Dot 10.10 11.16 5.98 18.31 52.63 Various State Grants 4.38 6.09 9.60 7.09 11.00 Miscellaneous 18.23 19.28 13.59 9.57 12.25 Total State Revenue To Cities 244.19$ 262.63$ 257.55$ 272.66$ 323.93$
CITY FUNDINGProperty Tax 188.83$ 178.47$ 205.89$ 222.57$ 231.71$ Bonds Sold, Notes And Loans 265.21 303.79 200.35 199.78 260.17 Sales Tax / Local Option 48.74 60.82 61.49 54.67 60.79 Tax Increment Financing 23.41 24.96 22.62 20.10 25.26 General Fund Transfers 12.23 9.28 15.93 18.84 12.32 Miscellaneous 51.16 62.32 61.52 53.70 73.44
Total Revenue Levied By Cities 589.57$ 639.63$ 567.78$ 569.66$ 663.69$
904.47$ 942.54$ 851.93$ 883.23$ 1,022.85$
1,164.72$ 1,245.38$ 1,218.61$ 1,237.75$ 1,411.61$ TOTAL FUNDS AVAILABLE
Total Receipts

Source: ICEA Annual Report and Legislative Services Agency
Attachment C
Funding Allocated to County Road Construction
FY 2011 FY 2012 FY 2013 FY 2014 FY 2015
154.29$ 169.58$ 183.56$ 197.40$ 206.86$
Bridge Replacement Funds (BROS) 7.01$ 13.39$ 11.85$ 10.12$ 11.99$ Disaster Aid received 16.96 9.70 7.43 12.42 14.96
Total Federal Revenue to Counties 23.96$ 23.09$ 19.27$ 22.53$ 26.95$
Road Use Tax 259.06$ 269.08$ 251.69$ 268.35$ 283.35$ Transfer of Jurisdiction Revenue 7.33 5.98 5.38 - - Farm-to-Market (FM) Transfer revenue 1.97 2.04 2.28 2.41 2.57 TIME-21 Funds 14.25 20.67 33.37 31.49 32.21 RISE Funds 0.02 - 0.58 1.24 2.16 Transfers from FM Fund 0.18 0.97 0.53 0.07 0.30
Total State Revenue to Counties 282.82$ 298.74$ 293.82$ 303.56$ 320.60$
Transfer from Property Tax Levy 139.79$ 147.87$ 153.60$ 162.70$ 169.88$ Local Option Sales Taxes 29.67 30.59 31.64 25.72 28.34 Tax Refunds or Credits 0.02 0.14 0.11 0.06 0.09 Reimbursements to Sec. Rd. Fund 7.66 5.25 6.00 3.92 6.56 Old Equipment Sold 1.57 1.22 1.46 1.89 1.07 Used Materials, Equip, Junk sold 1.09 1.24 1.26 1.36 1.45 Transfers from other funds 1.30 5.12 1.63 4.89 3.05 Miscellaneous Receipts 37.04 9.25 13.36 15.41 14.35
Total Revenue Levied by Counties 218.14$ 200.68$ 209.05$ 215.95$ 224.78$
524.92$ 522.51$ 522.15$ 542.04$ 572.32$
679.21$ 692.09$ 705.71$ 739.44$ 779.18$ TOTAL FUNDS AVAILABLE
FEDERAL FUNDING
STATE FUNDING
COUNTY FUNDING
Total Receipts
Balance Brought Forward