issue 2/2009 highlights - nda.agric.za globefi sh highlights july 2009 shrimp wholesale prices...
TRANSCRIPT

HIGHLIGHTSA quarterly update based on the GLOBEFISH databank
Shrimp markets very slowThe economic crisis continues to influence the world shrimp market. Generally, because of their relatively high price, sales of shrimp products suffer
because of loss of purchasing power.shrimp prices are low at the moment. p. 1
Prices moving upStarting in mid May 2009 tuna prices in all major catching areas began to rise because of fears that upcoming tuna fishing bans in these areas will
squeeze global supply for the canning industry. p. 7
Economic crisis overshadows groundfish marketPrices of all groundfish species declined sharply in the first half of 2009. The main reason was less buying interest by
institutional clients. In addition, cheap cultured fish create strong competition in the market. p. 12
Economic crisis impacts cephalopod marketThe world squid market is in a very difficult situation. Supply is sharply down in the Southwest Atlantic,
which normally would lead to a substantial price hike, especially after the extremely low prices of the previous two years. p. 15
Prices going up for fishmealTotal fishmeal production in the first quarter of 2009 was 433 000 tonnes, some 25% less than last year. Peruvian production in the first quarter
of the year was extremely low. p. 19
Lower supply of fish oilFish oil production declined in the opening months of 2009, in line with overall fishmeal pro-duction. However, because of higher oil content than last year, the decline was relatively lower.
Fish oil prices usually follow quite closely the change in fuel prices. p. 21
15/07/2009
Tilapia: a good product in the present crisisTilapia is a product with a strong growth rate. China is by far the main producer, but many other Asian countries are also expanding their tilapia outputs. p. 22
Outlook positive for pangasiusDuring the first months of 2009 pangasius was under pressure, as Russia and Egypt banned imports. In addition, negative press coverage in
Italy and Germany scared consumers away from buying of pangasius. p. 24 Disastrous situation for Nile perch
Nile perch resources are under stress and production is going down. The three producing countries report lower exports of fillets to the EU, the main
market for this product. p. 26
The European market for bass and bream is sur-prisingly good at present
Supplies of bream are lower than previously expected and prices are stable. This is unusual for the season because
in most years, when new supplies come to market in June and July prices fall as a result. p. 27
Atlantic SalmonWorld markets for Atlantic salmon are firm with tight supplies and high prices. Lack of Atlantic salmon from Chile
is diverting large quantities of Norwegian salmon to the US market and as a consequence prices have risen also in Europe. p. 31
Mixed fortunes for small pelagics in first quarter The first quarter of the year is neither a main producing nor consuming period for small pelagic fish. Production in the
northern hemisphere only gets into full swing during the second quarter of the year. p. 36
Issue 2/2009
Food and Agriculture Organization of the United Nations
Fish Products and Industry DivisionViale delle Terme di Caracalla
00153 Rome, ItalyTel.: +39 06 5705 6313Fax: +39 06 5705 5188
www.globefish.org
About GLOBEFISH
GLOBEFISH forms part of the Fish Utilization and Marketing Service of the FAO Fisheries and Aquaculture Department and is part of the FISH INFOnetwork (see below). It collects information from the main market areas in developed countries. Part of its services is an electronic databank and the distribution of information through the GLOBEFISH European Fish Price Report, the GLOBEFISH Highlights, the GLOBEFISH Research Programme and the GLOBEFISH Commodity Updates.
The GLOBEFISH Highlights are based on information available in the databank, supplemented by market information from six regional services which form the FISH INFOnetwork: INFOFISH (Asia and the Pacific), INFOPESCA (Latin America and the Caribbean), INFOPECHE (Africa), INFOSAMAK (Arab countries), EUROFISH (Central and Eastern Europe) and INFOYU (China).
GLOBEFISH Highlights are distributed to the subscribers of: INFOFISH Trade News, INFOPESCA Noticias Comerciales, INFOPECHE Nouvelles Commerciales, through EUROFISH and INFOYU. GLOBEFISH Highlights are also available in electronic form.
For subscription details please contact:GLOBEFISH, FIIU/FAO Tel: (39-06) 5705 6313
Viale delle Terme di Caracalla Fax: (39-06) 5705 518800153 Rome, Italy
Email: [email protected]: www.globefish.org
All rights reserved. Reproduction and dissemination of material in this information product for educational or other non-commercial purposes are authorized without any prior written permission from the copyright holders provided the source is fully acknowledged. Reproduction of material in this information product for resale or other commercial purposes is prohibited without written permission of the copyright holders. Applications for such permission should be addressed to the Chief, Electronic Publishing Policy and Support Branch, Communication Division, FAO, Viale delle Terme di Caracalla, 00153 Rome, Italy or by e-mail to [email protected] © FAO GLOBEFISH 2009
Bibliographic reference:
GLOBEFISH Highlights
2009
FAO/GLOBEFISH Highlights
(2/2009): p. 38
A quarterly update based on the GLOBEFISH databank
1Globefi sh Highlights July 2009
Shrimp markets very slow
The economic crisis continues to infl uence the world shrimp market. Generally,
because of their relatively high price, sales of shrimp products suffer because of loss of
purchasing power. This means that fewer consumers eat out at restaurants, the main
outlets for shrimp purchases in the major shrimp consuming countries. Prices are low
at the moment, and there is little hope of price increases later this year. Availability is
generally very good from shrimp supplying countries but shrinking demand is creating
a serious problem for the whole sector and particularly to producers, who see their
costs increasing and their income being dramatically reduced.
SHRIMP
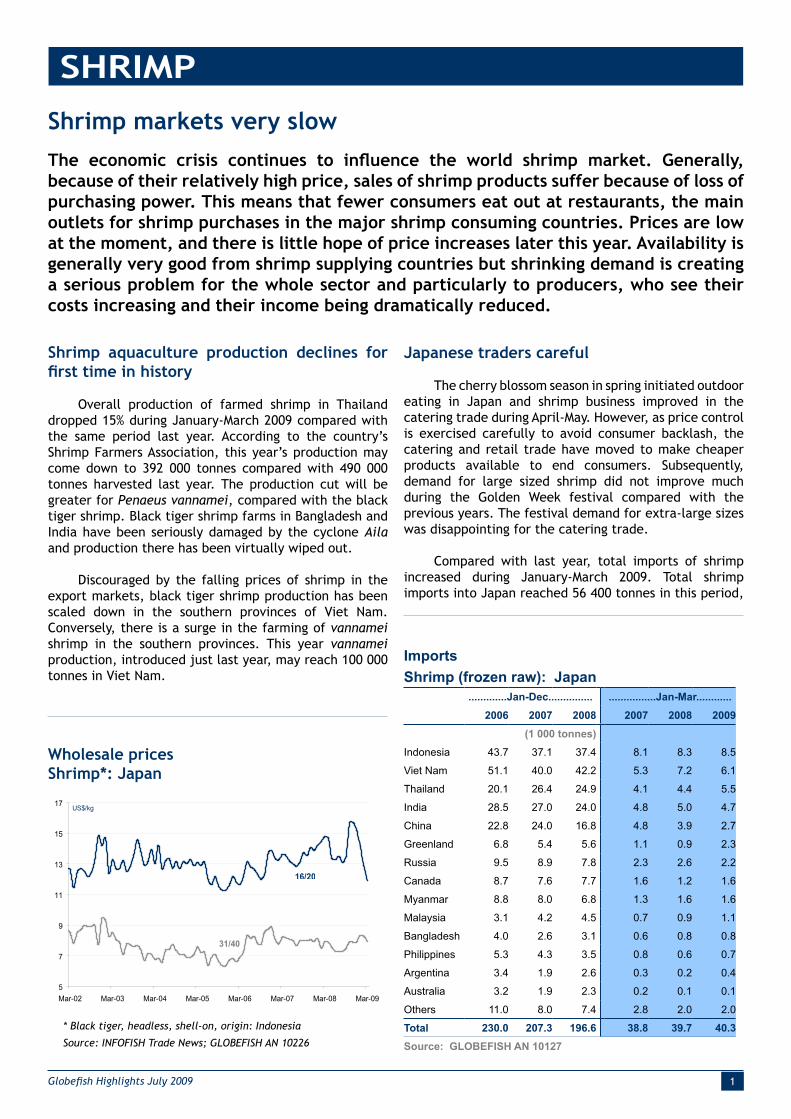
Wholesale prices
Shrimp*: Japan
Source: INFOFISH Trade News; GLOBEFISH AN 10226
* Black tiger, headless, shell-on, origin: Indonesia
Shrimp aquaculture production declines for
fi rst time in history
Overall production of farmed shrimp in Thailand
dropped 15% during January-March 2009 compared with
the same period last year. According to the country’s
Shrimp Farmers Association, this year’s production may
come down to 392 000 tonnes compared with 490 000
tonnes harvested last year. The production cut will be
greater for Penaeus vannamei, compared with the black
tiger shrimp. Black tiger shrimp farms in Bangladesh and
India have been seriously damaged by the cyclone Aila
and production there has been virtually wiped out.
Discouraged by the falling prices of shrimp in the
export markets, black tiger shrimp production has been
scaled down in the southern provinces of Viet Nam.
Conversely, there is a surge in the farming of vannamei
shrimp in the southern provinces. This year vannamei
production, introduced just last year, may reach 100 000
tonnes in Viet Nam.
Japanese traders careful
The cherry blossom season in spring initiated outdoor
eating in Japan and shrimp business improved in the
catering trade during April-May. However, as price control
is exercised carefully to avoid consumer backlash, the
catering and retail trade have moved to make cheaper
products available to end consumers. Subsequently,
demand for large sized shrimp did not improve much
during the Golden Week festival compared with the
previous years. The festival demand for extra-large sizes
was disappointing for the catering trade.
Compared with last year, total imports of shrimp
increased during January-March 2009. Total shrimp
imports into Japan reached 56 400 tonnes in this period,
Imports
Shrimp (frozen raw): Japan
.............Jan-Dec............... ................Jan-Mar............
2006 2007 2008 2007 2008 2009
(1 000 tonnes)
Indonesia 43.7 37.1 37.4 8.1 8.3 8.5
Viet Nam 51.1 40.0 42.2 5.3 7.2 6.1
Thailand 20.1 26.4 24.9 4.1 4.4 5.5
India 28.5 27.0 24.0 4.8 5.0 4.7
China 22.8 24.0 16.8 4.8 3.9 2.7
Greenland 6.8 5.4 5.6 1.1 0.9 2.3
Russia 9.5 8.9 7.8 2.3 2.6 2.2
Canada 8.7 7.6 7.7 1.6 1.2 1.6
Myanmar 8.8 8.0 6.8 1.3 1.6 1.6
Malaysia 3.1 4.2 4.5 0.7 0.9 1.1
Bangladesh 4.0 2.6 3.1 0.6 0.8 0.8
Philippines 5.3 4.3 3.5 0.8 0.6 0.7
Argentina 3.4 1.9 2.6 0.3 0.2 0.4
Australia 3.2 1.9 2.3 0.2 0.1 0.1
Others 11.0 8.0 7.4 2.8 2.0 2.0
Total 230.0 207.3 196.6 38.8 39.7 40.3
Source: GLOBEFISH AN 10127
5
7
9
11
13
15
17
Mar-02 Mar-03 Mar-04 Mar-05 Mar-06 Mar-07 Mar-08 Mar-09
US$/kg
31/40
16/20

2 Globefi sh Highlights July 2009
SHRIMP
Wholesale prices
Shrimp*: USA, Japan
Source: INFOFISH Trade News; GLOBEFISH AN 10205, 10206
* Frozen, headless, shell-on, 16-20 count
which compares with 54 800 tonnes last year. The main
product group was frozen raw shrimp with about 40 000
tonnes. The main suppliers of this product are Indonesia,
Viet Nam and Thailand. Viet Nam reported substantial
declines in shipments, while Indonesia and Thailand
managed to increase their frozen shrimp exports to the
Japanese market in the fi rst quarter of 2009.
For home cooking, young consumers prefer semi-
processed and processed shrimp, Western style; they
even prefer cooked shrimp over tempura shrimp. The
older generation still likes the traditional shell-on shrimp
but in easy-to-prepare and ready-to-cook preparations.
Demand for tray-pack shrimp, of all types, has been very
slow in the retail trade.
The H1N1 fl u alarm has created mixed trends in
the market. Because of the health scare, people are
avoiding going out, which is hurting the already weak
restaurant trade. Many schools have cancelled the
outdoor programmes that normally take place in summer.
Overall, shrimp consumption is low in Japan during the
current summer months, a normal feature for this time
of the year.
Low demand for shrimp in the USA continues
The negative economic environment in the USA has
affected consumer habits. One of the most signifi cant
changes is an increase in savings rate, as a reaction to the
uncertainty in the labour market. This implies a reduction
in consumption as consumers are becoming more price-
sensitive. As a reaction to fewer customers, restaurants
are increasingly offering value-oriented items on their
Imports
Shrimp: USA
.................................Jan-March...................................
2004 2005 2006 2007 2008 2009
(1000 tonnes)
Thailand 49.1 31.6 34.1 39.7 35.0 35.5
Indonesia 6.6 12.8 17.1 12.5 20.7 20.6
Ecuador 11.5 12.0 15.9 17.2 15.7 16.1
China 25.6 9.9 12.8 17.7 12.9 7.3
Viet Nam 14.2 10.5 8.3 5.9 8.6 6.4
Malaysia 0.3 2.9 4.4 4.6 7.1 2.9
Mexico 4.4 4.9 4.9 6.9 6.5 8.0
India 15.2 8.0 7.3 4.1 2.9 4.6
Bangladesh 1.1 2.0 3.4 3.1 2.8 2.6
Guyana 2.7 2.0 2.4 2.6 2.5 2.4
Venezuela 4.4 3.9 2.6 3.0 2.1 0.9
Peru 0.6 1.0 1.1 1.5 1.7 2.6
Others 13.6 10.8 10.3 7.3 5.3 5.0
Total 149.3 112.4 124.6 126.2 123.8 114.8
Source: NMFS
Imports
Shrimp: USA
Jan-March
2008 2009
tonnes 1000 USD tonnes 1000 USD
Peeled frozen 39 985 286 311 37 285 261 794
Other frozen 19 257 139 498 21 497 160 202
Breaded 10 538 49 613 7 791 42 508
Other preparations 329 1 632 302 1 446
Headless shell-on frozen
All sizes 52 287 373 230 46 517 315 543
< 15 5 708 72 061 4 651 53 035
15/20 3 908 39 571 3 793 34 600
21/25 6 011 52 851 6 311 50 738
26/30 7 964 56 330 7 015 46 307
31/40 8 967 53 734 9 807 58 651
41/50 7 190 38 849 5 698 29 341
51/60 6 476 32 770 4 806 23 352
61/70 3 831 17 767 2 375 10 779
> 70 2 229 9 293 2 059 8 740
Other products 1 402 11 631 1 456 13 694
Total 123 799 861 918 114 848 795 188
Source: NMFS
menus, in order to attract guests. Many restaurants are
offering smaller sized menus, often based on shrimp, in
order to reduce costs and therefore prices.
Low demand for shrimp, in conjunction with high
cold storage holdings, has impacted both prices and
imports. Sales of larger sizes have been dramatically
affected by the change in consumer buying patterns.
Prices of US domestic shrimp are signifi cantly lower than
4
5
6
7
8
Mar-02 Mar-03 Mar-04 Mar-05 Mar-06 Mar-07 Mar-08 Mar-09
USD/lb
Gulf brown, New York
Indian white, Tokyo

3Globefi sh Highlights July 2009
SHRIMP
a year ago, and the same trend, although less severe, can
be observed with imported shrimp.
US imports of shrimp in the fi rst quarter of 2009
totalled 115 000 tonnes worth USD 795.2 million. These
fi gures represent a 7% and 8% drop in total imports in
terms of volume and value respectively compared with the
same period in 2008. The main supplier, Thailand, which
accounted for 31% of total imported volume, managed
to gain market share. However, Thai exporters expressed
their concern about the effect that the strengthening baht
could have on shrimp exports. Exports from Indonesia
remained unchanged while purchases from Ecuador and
Mexico increased.
There was little incentive to fi sh for pink shrimp
on the US West coast, as both fi shermen and packers
were disappointed by current wholesale prices. The few
landings were totally taken up by the local fresh seafood
market. In addition, there still are substantial stocks
of frozen shrimp from the 2008 season. As for the Gulf
of Mexico area, the white shrimp season in Louisiana
started on 18 May 2009. Preliminary data showed a higher
percentage of larger sizes.
The EU shrimp market is worsening
During the fi rst quarter of 2009, all major key
markets in Europe continued to see their shrimp imports
decrease further and total import fi gures were down
3% compared with the same period last year to 154 500
tonnes. Demand has decreased on the various European
markets although prices are steady at a fairly low level
and therefore more affordable.
The new economic outlook released by OECD in June
this year shows that the euro area is in a deep recession,
“with external demand collapsing and domestic demand
being weakened by tight fi nancial conditions, rising
unemployment and heightened uncertainty”.
In general, because of their relatively high price,
sales of shrimp products suffer during an economic
crisis because consumers have lower purchasing power
and they tend to be more careful regarding the quality
of the product. Aware of this, advertisers in the retail
sector develop product labels referring to quality and
sustainability: “So organic”, “be good to yourself”,
“reduced fat”, “Omega 3”, “best ever prawns”, etc....
Even with the diffi cult situation on the European
market, during the fi rst quarter of 2009 India noticeably
increased its market share in this region with a 24%
growth rate compared with last year fi gures. With 15 200
tonnes of shrimp exported to Europe during the period
January-March 2009, India is presently the largest shrimp
supplier to EU. However, this leading position may not
last, as EU inspectors have found unauthorized residues
in some products imported from India. Crustaceans of
this origin will now enter the European Union only on
presentation of negative results for nitrofurans and other
unauthorized residues.
Greenland’s export fi gures to Europe were also
relatively good during the period under review with 14 700
tonnes corresponding to a 23% increase compared with
2008. Greenland is the second major shrimp supplier to
Europe and the number one supplier of coldwater shrimp.
Almost all the production goes to Denmark through a
large state-controlled group and then is re-exported to
other countries. In June, the new Greenland government
provided help for the group which is presently facing
severe fi nancial diffi culties.
The situation is diffi cult for most shrimp suppliers.
Ecuador, after years of constant expansion on the
European market, is showing signs of weakness. It is
the third shrimp exporter to Europe with 11 900 tonnes
but lost 11% on last years’ shrimp exports. However, it
remains by far the main supplier to the French and Italian
markets thanks to its low-cost products.
Imports
Shrimp: UK
................Jan-Dec............ ..............Jan-Mar..............
2006 2007 2008 2007 2008 2009
(1 000 tonnes)
Shell-on Coldwater
Denmark 2.8 2.4 2.2 0.6 0.6 0.6
Others 1.4 1.3 1.9 0.3 0.3 0.2
Total 4.6 4.8 4.1 0.9 0.9 0.8
Shell-on Warmwater
India 11.3 10.5 7.6 2.7 1.6 1.5
Indonesia 5.2 6.3 5.9 1.1 1.6 1.4
Bangladesh 6.2 5.7 4.6 1.0 1.1 1.2
Thailand 1.2 4.1 4.8 0.5 1.1 0.8
Viet Nam * * 2.4 0.1 0.4 0.4
Ecuador 3.3 3.3 2.0 0.7 0.7 0.4
Denmark * 1.0 1.1 0.2 0.2 0.4
Honduras 1.2 1.3 1.7 0.2 0.2 0.3
Others 7.4 5.4 5.4 1.1 1.2 0.8
Total 38.0 38.7 35.5 7.6 8.1 7.2
Cooked & Peeled
Iceland 16.9 15.3 13.4 2.0 1.9 1.8
Denmark 6.6 6.9 6.3 1.4 1.3 1.4
Thailand 3.9 5.2 4.9 0.7 0.6 1.2
Indonesia 3.1 2.6 2.8 0.7 0.5 0.7
Norway 3.5 2.7 3.2 0.3 0.6 0.5
Canada 4.5 3.9 2.6 0.3 0.2 0.3
Others 4.7 4.7 7.4 1.7 1.8 1.2
Total 46.6 44.0 40.6 7.1 6.9 7.1
Gr. Total 89.2 87.5 80.2 15.6 15.9 15.1
Source: GLOBEFISH AN 010141

4 Globefi sh Highlights July 2009
SHRIMP
Argentina reported very good landings of Pleoticus
muelleri, but had to sell at discounted prices due to
diminished demand. During the fi rst quarter of 2009
Canada experienced an 11% decrease in exports to the
EU with only 8 700 tonnes. Coldwater shrimp processors
are shutting down in Newfoundland as a consequence of
the decreasing demand and a strong Canadian dollar.
Bangladesh registered a very positive result at the
beginning of 2009 on the UK market, with a 26% increase
of its exports. Unfortunately, the future is very uncertain
for this country after the cyclone Aila destroyed thousands
of shrimp enclosures and ponds on 25 May and also as a
re-sult of the voluntary six-month suspension of exports
following the detection by the EU of harmful veterinary
drug residues in shrimp from Bangladesh.
OECD reports that the fi nancial crisis in the UK is
severely restraining business and household spending.
Latest UK statistics indicate that during the fi rst quarter
of 2009, total shrimp imports decreased by 5% in volume
compared with the same period in 2008, though in
terms of value imports increased by 20% compared with
2008. However, the decrease in import volume did not
affect all products. The average unit value for shrimp
products entering the UK market was GBP 1.00/kg higher
than during the fi rst quarter of 2008. The devaluation
of the British Pound is the main cause and the situation
should change somewhat in the coming months as the UK
currency slowly recovered in the second quarter. While
imports of frozen shrimp products continued to decline
owing to the economic crisis, losing 13% compared with
last year fi gures, volumes of prepared and preserved
shrimp increased notably (+5% compared with 2008). This
is because of increased volumes in processed products
coming from Asia (mainly Thailand and Indonesia). The
proportion of coldwater shrimp imported by the UK market
continued to shrink and now represents only 35% of total
imports in the fi rst quarter of 2009. In contrast, imports
of warmwater shrimp have been stable for the past four
years, including 2009 in spite of present diffi culties.
Total Danish shrimp imports continue to follow the
downward trend of previous years. Imports during the fi rst
quarter of 2009 amounted to 22 800 tonnes corresponding
to a total of DKK 608 million, a 10% decrease in volume
and a 22% decrease in value compared with the same
period of 2008. Denmark imports essentially coldwater
shrimp (95% in the fi rst quarter of 2009). This does not
come as a surprise, as Denmark is mainly a re-exporter
and processor of coldwater shrimp. Greenland, by far the
number one supplier to Denmark, saw its exports to this
country increase by 23% in volume and by 20% in value
compared with the fi rst quarter of 2008. In contrast, during
the fi rst quarter of 2009, due to problemas expereinced
with low shrimp catches, Canada suffered a 41% decrease
in volume and a 49% decrease in value compared with the
same period last year.
Imports
Shrimp: Denmark
..............................Jan-March.......................
2005 2006 2007 2008 2009
(1000 tonnes)
Greenland 15.3 18.3 12.1 11.9 14.6
Canada 8.4 7.6 10.1 7.5 4.4
Faroe Islands 0.8 0.8 0.1 0.8 1.0
UK 0.6 0.7 1.0 0.4 0.5
Netherlands 1.2 0.7 1.4 0.5 0.4
Iceland 0.7 0.7 0.6 1.4 0.3
Thailand 0.0 0.1 0.2 0.3 0.2
Vietnam 0.1 0.1 0.2 0.2 0.2
India 0.1 0.1 0.2 0.2 0.2
Norway 1.3 1.0 0.8 0.6 0.2
China 0.0 0.1 0.1 0.4 0.2
Others 1.8 1.4 2.1 1.2 0.6
Total 30.2 31.7 28.8 25.3 22.8
Source: GLOBEFISH
Spain registered the largest drop ever in shrimp
imports during the fi rst quarter of 2009. With 22 000
tonnes imported at a value of EUR 104 million, Spainish
imports decreased by 15% in volume and 14% in value
compared with the previous year. Chinese and Ecuadorian
shrimp imports, which together represent 35% of total
imports, dropped drastically. On the other hand,
Argentina supplied large quantities of Pleoticus muelleri
(almost double the volume of last year) to the Spanish
market as a consequence of very good landings.
Imports
Shrimp: Spain
......................................Jan-March..............................
2004 2005 2006 2007 2008 2009
(1000 tonnes)
China 0.3 4.3 6.9 7.8 6.6 4.7
Ecuador 1.5 1.5 3.3 4.5 4.2 3.0
Argentina 4.1 0.8 1.1 3.8 1.6 2.7
Morocco 1.6 2.0 1.5 1.6 1.7 1.5
Nicaragua 0.4 0.5 1.0 1.0 0.7 1.2
Colombia 0.9 1.2 1.0 1.2 1.1 0.9
Belgium 0.6 0.7 0.6 1.0 0.8 0.8
Netherlands 0.9 1.1 1.0 1.1 0.7 0.7
Cuba 0.2 0.2 0.9 1.1 0.8 0.6
Others 16.7 11.8 12.4 11.3 7.9 5.9
Total 27.3 24.0 29.7 34.3 26.0 22.0
Source: GLOBEFISH AN 010150

5Globefi sh Highlights July 2009
SHRIMP
Shrimp volumes imported by France during the fi rst
quarter of 2009 were 11% lower in volume and 3% lower
in value compared with the same period last year, thus
increasing the unit value. THis was mainly due to a change
in the composition of shrimp suppliers to the French
market. Demand continues to be mainly for frozen whole
tropical shrimp while coldwater imports represent only
about 15% of the market. Almost all top exporting countries
have seen their volumes to France decrease substantially.
Only Asian countries (India, Thailand and Viet Nam) are
gaining market shares on the French market. India, in
particular, registered a constant expansion on the French
market in the past fi ve years and, notwithstanding the
economic crisis, increased its volumes to France, at the
beginning of this year, by more than 40% compared with
last year’s fi gures.
Imports
Shrimp: France
..................................Jan-March....................................
2005 2006 2007 2008 2009
(1000 tonnes)
Ecuador 1.4 2.3 2.9 4.7 3.7
India 1.2 1.9 2.0 2.1 3.0
Colombia 0.7 0.7 1.1 1.8 1.5
Netherlands 2.2 1.4 1.4 1.5 1.4
Brazil 5.1 3.2 3.3 1.9 1.3
Madagascar 1.6 1.3 1.3 1.9 1.2
Thailand 0.5 0.5 1.0 0.8 1.1
Vietnam 0.7 0.7 0.9 0.8 0.8
Indonesia 1.2 1.6 0.8 0.9 0.7
Belgium 1.0 1.3 1.1 1.1 0.7
Spain na na 0.5 0.3 0.7
Denmark 0.9 1.0 1.0 0.6 0.7
Venezuela 0.1 0.2 0.4 0.8 0.6
Bangladesh 0.2 0.1 0.1 0.8 0.6
Others 3.8 3.5 3.5 3.4 3.0
Total 20.6 19.8 21.4 23.5 21.0
Source: GLOBEFISH
In Italy, total shrimp imports for the fi rst quarter
of 2009 decreased by 10% in volume and by 3% in value
compared with the same period last year. Consequently
the average unit value increased by EUR 0.40/kilo
compared with 2008, making shrimp less affordable in
a market where revenues are badly hit by recession.
OECD indicates that the Italian economy is in a strong
recession, mainly because of external developments
linked to the global fi nancial crisis. Unemployment and
budget defi cit are expected to increase further with
negative consequences for household consumption and
subsequently for more expensive food commodities such
as shrimp.
Germany is the only country in Europe to register
a positive shrimp import fi gure in 2009. The increase
is particularly apparent for frozen whole products of
Asian origin. Shrimp demand in Germany has continued
to expand during the past 10 years. The majority of
imports are in whole frozen form but the proportion of
processed products is signifi cant and growing. Products
of Asian origin dominate the German market and imports
from Thailand, Viet Nam, India and Bangladesh (top four
suppliers) represent 60% of total imports.
Imports
Shrimp: Italy
.............................Jan-March.........................
2005 2006 2007 2008 2009
(1000 tonnes)
Ecuador 3.4 3.5 4.5 3.9 3.9
Spain 0.6 0.8 1.2 1.0 1.0
India 1.0 1.0 1.0 1.4 0.9
Denmark 1.4 1.5 1.6 1.3 0.8
Argentina 0.2 0.4 0.7 0.5 0.8
China 0.5 0.4 1.0 0.4 0.7
Netherlands 0.6 0.8 0.8 0.6 0.6
Thailand 0.2 0.2 0.2 0.3 0.5
UK 0.8 0.7 0.6 0.4 0.4
Indonesia 0.3 0.3 0.2 0.2 0.4
Malaysia 0.8 0.7 0.7 0.4 0.0
Others 2.9 3.1 2.8 2.5 1.6
Total 12.7 13.4 15.3 12.8 11.6
Source: GLOBEFISH AN 010148
Imports
Shrimp: Germany
.............Jan-Dec.............. ................Jan-Mar............
2006 2007 2008 2007 2008 2009
(1 000 tonnes)
Thailand 4.0 8.9 9.3 1.3 2.0 2.2
Viet Nam 4.0 5.7 8.1 1.0 1.5 1.9
India 5.3 6.4 5.7 1.8 1.3 1.5
Bangladesh 3.0 3.1 3.5 0.4 0.6 1.3
Netherlands 4.1 5.7 3.9 1.7 1.3 0.7
Denmark 1.5 2.6 2.7 0.3 0.8 0.6
UK 3.1 2.5 1.6 0.8 0.5 0.6
Belgium 2.8 2.6 2.0 0.7 0.7 0.5
Greenland na 2.6 2.3 0.6 0.6 0.5
Indonesia na 2.1 2.0 0.5 0.4 0.3
Others 12.1 11.4 7.3 1.6 1.2 1.4
Total 39.9 48.8 48.4 10.7 10.9 11.5
Source: GLOBEFISH AN 010146
6 Globefi sh Highlights July 2009
SHRIMP
SHRIMP NEWS
ASIA: ‘BIG FOUR’ SHRIMP PRODUCERS JOIN FORCES
The world’s four largest shrimp-producing nations are joining
forces to ride out the economic downturn. Trade associations
from Thailand, Viet Nam, Indonesia and China in mid May 2009
signed a multilateral cooperation agreement to develop and
maintain a healthy farmed shrimp industry in all four countries
by encouraging socially and environmentally responsible
shrimp-farming practices and weeding out harmful ones.
The groups include the Thai Shrimp Association, Viet Nam
Association of Seafood Exporters and Processors, Indonesian
Shrimp Board of Commodity and Chinese Aquatic Products
Processing and Marketing Association. Source: SEAFOODSOURCE
USA: NEW CHITOSAN BASED COATING CAN REPAIR PRODUCT
SCRATCHES AND BLEMISHES WHEN ACTIVATED BY UV LIGHT
A new coating has the power to self-heal, potentially erasing
scratches and blemishes. The coating is made by fusing
microscopic polyurethane rings with a protein derived from
shrimp and crab shells that is sensitive to ultraviolet light.
When the coating gets scratched, the polyurethane rings break
open, creating two reactive ends. Exposure to UV in sunlight
activates the protein, called chitosan, which binds with the
broken rings to repair the scratch. In addition to electronics,
the coating could be applied to cars, clothing, even furniture,
Urban added. There’s a catch, however: The coating can heal
only once at a particular spot. Source: PRODUCTS FINISHING
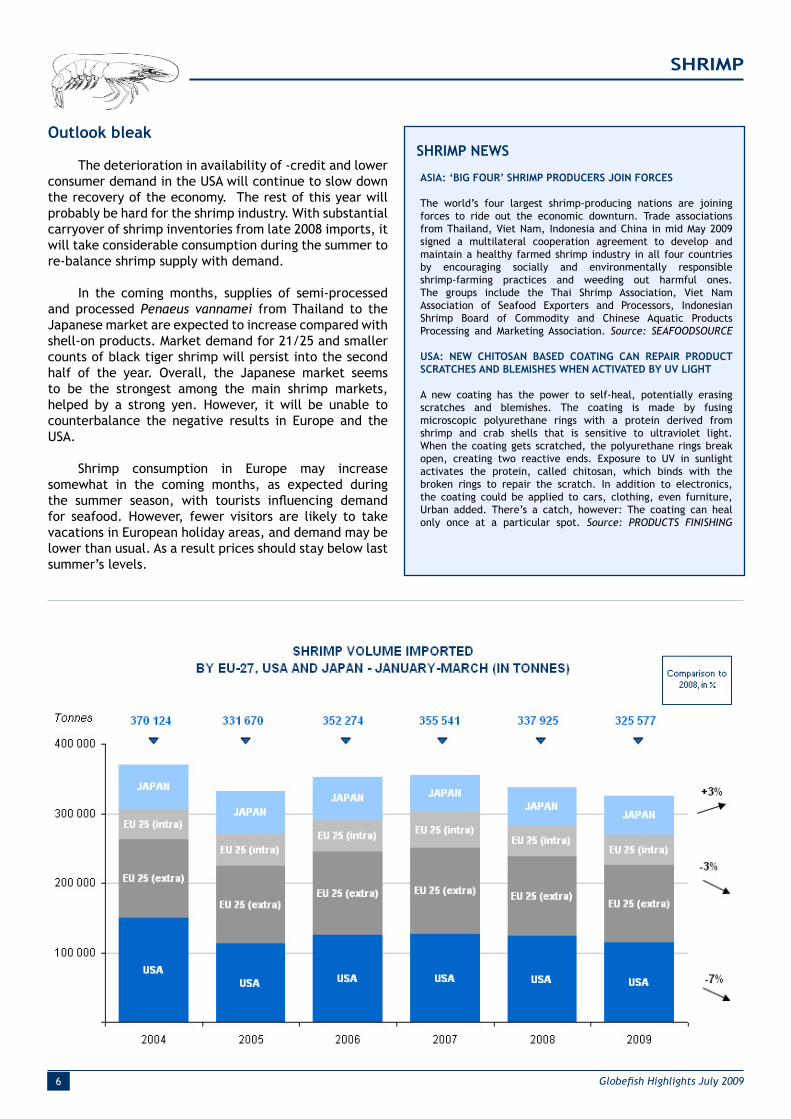
Outlook bleak
The deterioration in availability of -credit and lower
consumer demand in the USA will continue to slow down
the recovery of the economy. The rest of this year will
probably be hard for the shrimp industry. With substantial
carryover of shrimp inventories from late 2008 imports, it
will take considerable consumption during the summer to
re-balance shrimp supply with demand.
In the coming months, supplies of semi-processed
and processed Penaeus vannamei from Thailand to the
Japanese market are expected to increase compared with
shell-on products. Market demand for 21/25 and smaller
counts of black tiger shrimp will persist into the second
half of the year. Overall, the Japanese market seems
to be the strongest among the main shrimp markets,
helped by a strong yen. However, it will be unable to
counterbalance the negative results in Europe and the
USA.
Shrimp consumption in Europe may increase
somewhat in the coming months, as expected during
the summer season, with tourists infl uencing demand
for seafood. However, fewer visitors are likely to take
vacations in European holiday areas, and demand may be
lower than usual. As a result prices should stay below last
summer’s levels.

7Globefi sh Highlights July 2009
Prices moving up
Starting in mid May 2009 tuna prices in all major catching areas began to rise because
of fears that upcoming tuna fi shing bans in these areas will squeeze global supply for
the canning industry. Canned tuna prices have been low in recent months, but are
likely to follow raw material prices up-ward very soon. Sustainability is a major con-
cern for the global tuna industry, which is trying to make its voice heard. Closing of
canneries as a result of globalization and out-sourcing is impacting negatively econo-
mies based on tuna, especially in areas where there are very limited job opportuni-
ties. The future for the tuna industry is rather bleak, with higher costs while demand
is somewhat limited.
TUNA
Imports
Canned tuna: UK
............Jan-Dec............ ............Jan-Mar............
2006 2007 2008 2007 2008 2009
(1 000 tonnes)
Seychelles 32.0 23.9 16.7 6.6 3.2 5.0
Ghana 17.0 18.4 22.7 4.3 6.6 4.6
Thailand 16.9 14.9 14.6 4.1 3.3 3.8
Philippines 10.0 13.0 19.2 3.1 4.1 3.3
Mauritius 25.9 27.8 27.2 6.8 5.6 3.2
Ecuador 6.8 7.8 18.9 1.3 2.5 1.0
France 1.7 3.0 4.0 0.7 0.9 0.5
Maldives 1.9 2.2 1.0 1.3 0.4 0.3
Indonesia 0.9 1.7 1.4 0.6 0.4 0.2
Others 15.5 17.8 18.4 5.2 2.5 2.0
Total 128.6 130.5 144.0 34.0 29.5 23.9
Source: GLOBEFISH AN 11050
Sustainability of tuna resources of major
concern
The International Seafood Sustainability Foundation
(ISSF)- is a partnership between the tuna industry and
World Wildlife Fund (WWF). They are committed to using
sound management based on good science compiled by
regional fi sheries management organizations (RFMOs) to
rate the 19 stocks which support commercial tuna fi shing
used by the canning industry. ISSF has red listed Eastern
Pacifi c bigeye tuna and lobbied during the Inter American
Tropical Tuna Commission (IATTC) meeting in San Diego in
June 2009 to take action to conserve these stocks. IATTC
failed to adopt the conservation measures proposed by
its scientifi c staff, but it did adopt measures that would
provide some conservation benefi ts, in terms of reduction
of fi shing pressure by about 20%, rather than the 30%
recommended. This is, in fact, a positive outcome, as
in the previous two years no decision on catch reduction
measures had been taken.
The fi lm “End of the line” highlighted overfi shing
worldwide, including the overexploitation of bluefi n tuna
in the Mediterranean. Some companies have reacted to
this message already. One major sandwich producer in
the USA decided to stop using tuna in its sandwiches, even
though no bluefi n tuna had ever been used for this type
of product. Marks & Spencer (M&S), one of the biggest
fi sh retailers in the UK, is to stop selling certain types
of tuna following the message of ”End of the Line”. M&S
said it would become the fi rst UK food retailer to source
only pole & line or line-caught tuna for its fresh foods
from sandwiches to fresh steaks and also for canned tuna
by the end of the year. On the other hand, an important
sushi restaurant in London decided to keep bluefi n tuna
on the menu, but to include a footnote saying that it is an
overexploited species.
Imports
Canned tuna: Germany
............Jan-Dec............ ............Jan-Mar............
2006 2007 2008 2007 2008 2009
(1 000 tonnes)
Ecuador 15.8 21.2 28.6 4.9 4.6 4.0
Philippines 23.4 24.1 18.5 6.1 2.6 5.2
Thailand 18.1 11.9 8.2 2.5 1.4 1.2
Indonesia 6.0 8.1 6.8 1.2 1.6 1.8
Papua NG 4.4 5.7 6.1 1.4 0.4 1.2
Seychelles 6.7 2.1 4.4 0.7 1.0 0.0
France 2.2 1.1 0.9 0.3 0.2 0.0
Others 10.2 10.9 7.0 3.5 1.6 2.8
Total 86.8 85.1 80.6 20.6 13.4 16.2
Source: GLOBEFISH
8 Globefi sh Highlights July 2009
TUNA
0
500
1000
1500
2000
2500
Jun-03 Jun-04 Jun-05 Jun-06 Jun-07 Jun-08 Jun-09
USD/tonne
Thailand
Africa
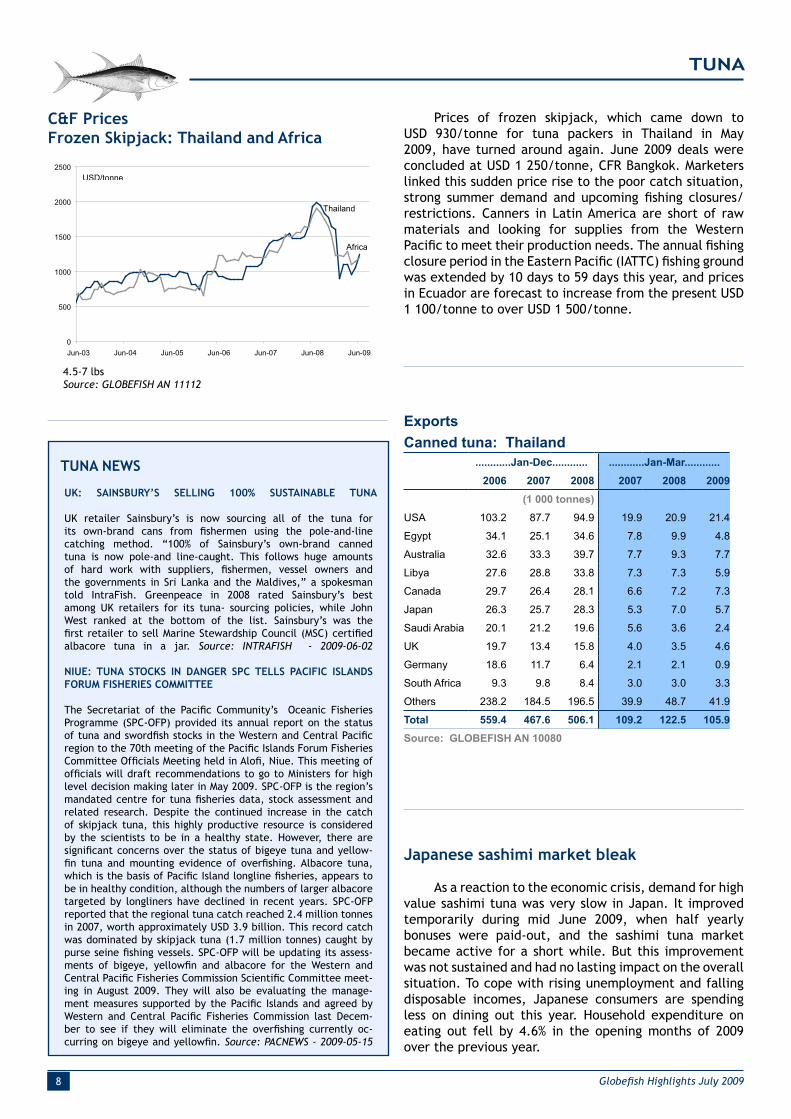
C&F Prices
Frozen Skipjack: Thailand and Africa
4.5-7 lbs
Source: GLOBEFISH AN 11112
Prices of frozen skipjack, which came down to
USD 930/tonne for tuna packers in Thailand in May
2009, have turned around again. June 2009 deals were
concluded at USD 1 250/tonne, CFR Bangkok. Marketers
linked this sudden price rise to the poor catch situation,
strong summer demand and upcoming fi shing closures/
restrictions. Canners in Latin America are short of raw
materials and looking for supplies from the Western
Pacifi c to meet their production needs. The annual fi shing
closure period in the Eastern Pacifi c (IATTC) fi shing ground
was extended by 10 days to 59 days this year, and prices
in Ecuador are forecast to increase from the present USD
1 100/tonne to over USD 1 500/tonne.
TUNA NEWS
UK: SAINSBURY’S SELLING 100% SUSTAINABLE TUNA
UK retailer Sainsbury’s is now sourcing all of the tuna for
its own-brand cans from fi shermen using the pole-and-line
catching method. “100% of Sainsbury’s own-brand canned
tuna is now pole-and line-caught. This follows huge amounts
of hard work with suppliers, fi shermen, vessel owners and
the governments in Sri Lanka and the Maldives,” a spokesman
told IntraFish. Greenpeace in 2008 rated Sainsbury’s best
among UK retailers for its tuna- sourcing policies, while John
West ranked at the bottom of the list. Sainsbury’s was the
fi rst retailer to sell Marine Stewardship Council (MSC) certifi ed
albacore tuna in a jar. Source: INTRAFISH - 2009-06-02
NIUE: TUNA STOCKS IN DANGER SPC TELLS PACIFIC ISLANDS
FORUM FISHERIES COMMITTEE
The Secretariat of the Pacifi c Community’s Oceanic Fisheries
Programme (SPC-OFP) provided its annual report on the status
of tuna and swordfi sh stocks in the Western and Central Pacifi c
region to the 70th meeting of the Pacifi c Islands Forum Fisheries
Committee Offi cials Meeting held in Alofi , Niue. This meeting of
offi cials will draft recommendations to go to Ministers for high
level decision making later in May 2009. SPC-OFP is the region’s
mandated centre for tuna fi sheries data, stock assessment and
related research. Despite the continued increase in the catch
of skipjack tuna, this highly productive resource is considered
by the scientists to be in a healthy state. However, there are
signifi cant concerns over the status of bigeye tuna and yellow-
fi n tuna and mounting evidence of overfi shing. Albacore tuna,
which is the basis of Pacifi c Island longline fi sheries, appears to
be in healthy condition, although the numbers of larger albacore
targeted by longliners have declined in recent years. SPC-OFP
reported that the regional tuna catch reached 2.4 million tonnes
in 2007, worth approximately USD 3.9 billion. This record catch
was dominated by skipjack tuna (1.7 million tonnes) caught by
purse seine fi shing vessels. SPC-OFP will be updating its assess-
ments of bigeye, yellowfi n and albacore for the Western and
Central Pacifi c Fisheries Commission Scientifi c Committee meet-
ing in August 2009. They will also be evaluating the manage-
ment measures supported by the Pacifi c Islands and agreed by
Western and Central Pacifi c Fisheries Commission last Decem-
ber to see if they will eliminate the overfi shing currently oc-
curring on bigeye and yellowfi n. Source: PACNEWS - 2009-05-15
Japanese sashimi market bleak
As a reaction to the economic crisis, demand for high
value sashimi tuna was very slow in Japan. It improved
temporarily during mid June 2009, when half yearly
bonuses were paid-out, and the sashimi tuna market
became active for a short while. But this improvement
was not sustained and had no lasting impact on the overall
situation. To cope with rising unemployment and falling
disposable incomes, Japanese consumers are spending
less on dining out this year. Household expenditure on
eating out fell by 4.6% in the opening months of 2009
over the previous year.
Exports
Canned tuna: Thailand
............Jan-Dec............ ............Jan-Mar............
2006 2007 2008 2007 2008 2009
(1 000 tonnes)
USA 103.2 87.7 94.9 19.9 20.9 21.4
Egypt 34.1 25.1 34.6 7.8 9.9 4.8
Australia 32.6 33.3 39.7 7.7 9.3 7.7
Libya 27.6 28.8 33.8 7.3 7.3 5.9
Canada 29.7 26.4 28.1 6.6 7.2 7.3
Japan 26.3 25.7 28.3 5.3 7.0 5.7
Saudi Arabia 20.1 21.2 19.6 5.6 3.6 2.4
UK 19.7 13.4 15.8 4.0 3.5 4.6
Germany 18.6 11.7 6.4 2.1 2.1 0.9
South Africa 9.3 9.8 8.4 3.0 3.0 3.3
Others 238.2 184.5 196.5 39.9 48.7 41.9
Total 559.4 467.6 506.1 109.2 122.5 105.9
Source: GLOBEFISH AN 10080
9Globefi sh Highlights July 2009
TUNA
Imports
Fresh/chilled tuna: Japan
............Jan-Dec............ ............Jan-Mar............
2006 2007 2008 2007 2008 2009
(1 000 tonnes)
Yellowfi n 19.0 16.9 15.5 4.7 4.2 4.0
Bigeye 15.8 14.5 15 3.8 3.9 4
Bluefi n 7.4 5.1 4.4 1.8 1.2 1.9
S. bluefi n 1.8 1.2 1.2 0.0 0.0 0
Albacore 0.3 0.3 0.3 0.0 0.0 0.0
Skipjack 0.0 0.1 0 0.0 0.0 0
Total 44.3 38.1 36.3 10.3 9.2 9.9
Source: National Statistics
Coldstorage holdings
Tuna: Japan
Source: INFOFISH Trade News, GLOBEFISH AN 015000
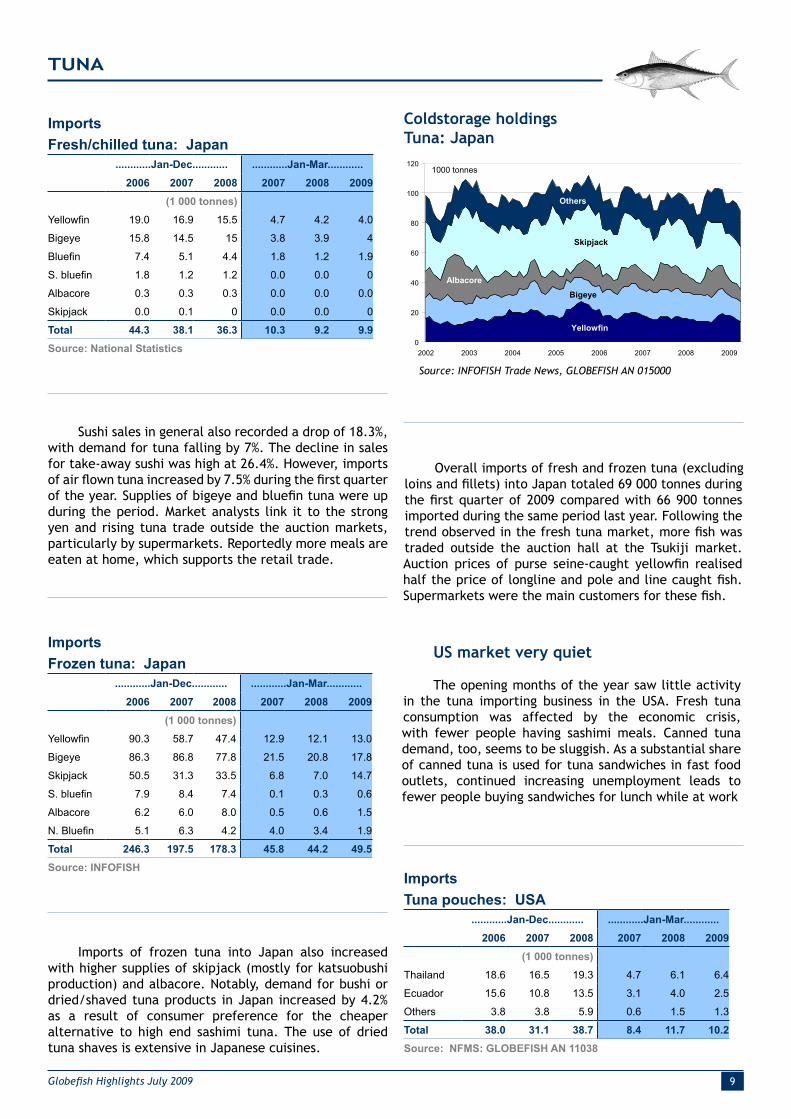
Sushi sales in general also recorded a drop of 18.3%,
with demand for tuna falling by 7%. The decline in sales
for take-away sushi was high at 26.4%. However, imports
of air fl own tuna increased by 7.5% during the fi rst quarter
of the year. Supplies of bigeye and bluefi n tuna were up
during the period. Market analysts link it to the strong
yen and rising tuna trade outside the auction markets,
particularly by supermarkets. Reportedly more meals are
eaten at home, which supports the retail trade.
Imports of frozen tuna into Japan also increased
with higher supplies of skipjack (mostly for katsuobushi
production) and albacore. Notably, demand for bushi or
dried/shaved tuna products in Japan increased by 4.2%
as a result of consumer preference for the cheaper
alternative to high end sashimi tuna. The use of dried
tuna shaves is extensive in Japanese cuisines.
Imports
Tuna pouches: USA
............Jan-Dec............ ............Jan-Mar............
2006 2007 2008 2007 2008 2009
(1 000 tonnes)
Thailand 18.6 16.5 19.3 4.7 6.1 6.4
Ecuador 15.6 10.8 13.5 3.1 4.0 2.5
Others 3.8 3.8 5.9 0.6 1.5 1.3
Total 38.0 31.1 38.7 8.4 11.7 10.2
Source: NFMS: GLOBEFISH AN 11038
Imports
Frozen tuna: Japan
............Jan-Dec............ ............Jan-Mar............
2006 2007 2008 2007 2008 2009
(1 000 tonnes)
Yellowfi n 90.3 58.7 47.4 12.9 12.1 13.0
Bigeye 86.3 86.8 77.8 21.5 20.8 17.8
Skipjack 50.5 31.3 33.5 6.8 7.0 14.7
S. bluefi n 7.9 8.4 7.4 0.1 0.3 0.6
Albacore 6.2 6.0 8.0 0.5 0.6 1.5
N. Bluefi n 5.1 6.3 4.2 4.0 3.4 1.9
Total 246.3 197.5 178.3 45.8 44.2 49.5
Source: INFOFISH
Overall imports of fresh and frozen tuna (excluding
loins and fi llets) into Japan totaled 69 000 tonnes during
the fi rst quarter of 2009 compared with 66 900 tonnes
imported during the same period last year. Following the
trend observed in the fresh tuna market, more fi sh was
traded outside the auction hall at the Tsukiji market.
Auction prices of purse seine-caught yellowfi n realised
half the price of longline and pole and line caught fi sh.
Supermarkets were the main customers for these fi sh.
US market very quiet
The opening months of the year saw little activity
in the tuna importing business in the USA. Fresh tuna
consumption was affected by the economic crisis,
with fewer people having sashimi meals. Canned tuna
demand, too, seems to be sluggish. As a substantial share
of canned tuna is used for tuna sandwiches in fast food
outlets, continued increasing unemployment leads to
fewer people buying sandwiches for lunch while at work
Yellowfin
Bigeye
Albacore
Skipjack
Others
0
20
40
60
80
100
120
2002 2003 2004 2005 2006 2007 2008 2009
1000 tonnes

10 Globefi sh Highlights July 2009
TUNA
As a result, all tuna imports declined in the fi rst
three months of the year: -13% for tuna pouches, -
15% for fresh tuna, -9% for frozen tuna loins and -10%
for canned tuna. The latter is the most important tuna
product imported into the USA, accounting for over 60%
of total US tuna imports. In the January – March 2009,
total canned tuna imports were 39 300 tonnes, far below
imports during previous years. Thailand continues to be
the main exporter of this product. This country managed
to increase its exports, despite the overall bleak
situation, and accounts for about half of the US canned
tuna import market. The Philippines and Indonesia, other
top exporters, reported lower shipments of canned tuna
to the US market.
Diffi cult situation for Samoa and Galicia
Tuna canning is an important activity in those parts
of the world where species of tuna used in canning are
landed. The closure of factories has a devastating impact
on the economic structure of the country or region. Two
examples are American Samoa and Spain. Globalization,
which leads to re-location of canneries, is impacting
heavily the socio-economic structure in these areas.
Chicken of the Sea decided to close their factory
in American Samoa and the implications of this decision
for the people and the economy of this island cannot be
understated. Over 2 000 people employed by Chicken
of the Sea will lose their jobs, effectively reducing by
a quarter the active workforce in American Samoa. The
apparent culprit for Chicken of the Sea’s cannery closure
was a 2007 mandate from the US Congress for American
Samoa to match the mainland US minimum wage; a
mandate that has boosted wages from an average of USD
4.00/hour, to a minimum of USD 7.25/hour over the course
of two years. In addition, there are many other factors
that impact negatively the competitiveness of canning in
the American Samoa, such as US tariff reductions at the
World Trade Organization (WTO) and through Free Trade
Agreements (FTAs), competition from low-cost producers
in Thailand and Ecuador, highly variable fuel costs, and
the global economic recession.
Imports
Canned tuna (excl. pouches): USA
............Jan-Dec............ ............Jan-Mar............
2006 2007 2008 2007 2008 2009
(1 000 tonnes)
Thailand 74.3 66.1 64.7 27.4 17.7 19.1
Philippines 35.2 26.6 25.9 8.5 9.9 8.6
Indonesia 16.4 14.1 13.5 5.5 5.5 4.3
Ecuador 4.4 1.9 0.7 3.7 0.4 0.6
Others 22.2 25.3 27.8 8.8 10.6 6.7
Total 152.5 134.0 132.6 53.9 44.1 39.3
Source: NFMS: GLOBEFISH AN 11032
Imports
Fresh Tuna : USA
............Jan-Dec............ ............Jan-Mar............
2006 2007 2008 2007 2008 2009
(1 000 tonnes)
Albacore 0.9 0.9 0.7 0.2 0.1 0.2
Yellowfi n 17.8 18.0 15.9 4.5 4.2 3.5
Bigeye 4.9 5.6 5.5 1.4 1.5 1.3
Bluefi n 1.1 1.1 0.4 0.3 0.1 0.1
Skipjack 0.1 0.0 0.0 0.0 0.0 0.0
Others 0.4 0.1 0.2 0.1 0.1 0.0
Total 25.2 25.7 22.7 6.5 6.0 5.1
Source: ITN
Imports
Tuna loins: USA
............Jan-Dec............ ............Jan-Mar............
2006 2007 2008 2007 2008 2009
(1 000 tonnes)
Thailand 12.5 7.8 14.9 1.1 3.3 2.1
Fiji 12.4 11.0 10.7 1.7 2.5 2.6
Trin & Tob 12.3 10.5 9.7 2.3 2.5 2.3
Ecuador 4.0 1.2 0.9 0.6 0.1 0.0
Others 9.9 13.3 9.0 3.2 2.6 2.8
Total 51.1 43.8 45.2 8.9 10.8 9.8
Source: NFMS: GLOBEFISH AN 11056
Imports
Canned tuna: France
............Jan-Dec............ ............Jan-Mar............
2006 2007 2008 2007 2008 2009
(1 000 tonnes)
C. d’Ivoire 23.1 27.0 22.0 7.8 7.7 6.8
Spain 22.0 19.9 14.2 4.8 3.7 3.7
Madagascar 15.4 10.9 5.6 3.1 2.6 3.1
Seychelles 14.7 13.6 11.7 2.8 2.4 1.7
Italy 8.9 3.5 2.3 0.7 0.9 0.1
Senegal 1.1 1.7 0.9 0.7 0.3 0.4
Others 35.2 29.7 27.1 6.9 6.2 8.9
Total 120.4 106.3 83.7 26.8 23.8 24.7
Source: GLOBEFISH AN 11030
11Globefi sh Highlights July 2009
TUNA
Chicken of the Sea plans to return some of its tuna
canning activities to the USA, and is spending USD 20
million to open canning operations in Lyons, Georgia. This
new plant will employ 200 people and will take advantage
of the relative decrease in utility costs, shipping costs
and input material costs. American Samoa’s second
cannery, owned and operated by StarKist says that it
currently has no plan to close its Pago Pago cannery.
Spain’s canned seafood industry, concentrated
mainly in Galicia region, needs to be restructured
to remain competitive, according to ANFACO (The
National Fish and Seafood Canners Association).
The restructuring may include a reduction in the industry’s
production capacity that will lead to early retirement,
low incentive bonus and personnel layoffs. According to
the association, the industry is under constant threat
from increasing imports of canned seafood particularly
from Southeast Asian canners and strong competition
from supermarket brands. There are 67 canneries
in the region employing around 10 000 workers.
Many of the canners have stopped producing their
own brands and instead produce canned seafood for
supermarket brands. Spanish tuna canners are also the
largest importers of pre-cooked tuna loins in Europe. From
the total 85 000 tonnes of pre-cooked loins imported into
the EU last year as raw material for canned tuna, more
than 45 000 tonnes went to Spain.
Although current demand from the Spanish market
is described as being soft, skipjack 1.8 kg up is now being
traded at EUR 900/tonne, up from EUR 800/tonne, while
whole round yellowfi n 10 kg up is offered at EUR 1 500/
tonne.
Imports
Tuna loins: Spain
............Jan-Dec............ ............Jan-Mar............
2006 2007 2008 2007 2008 2009
(1 000 tonnes)
Ecuador 16.0 13.2 22.4 4.6 5.1 6.4
El Salvador 10.9 14.8 12.4 3.8 4.0 5.9
Thailand 0.0 2.9 3.5 2.5 3.5 6.2
Guatemala 2.2 0.0 1.5 0.0 0.0 0.9
Portugal 1.4 1.5 1.0 0.4 0.3 0.4
Colombia 0.3 0.4 0.7 0.2 0.0 0.0
Costa Rica 0.0 0.0 0.0 0.0 0.0 0.0
Venezuela 0.0 0.4 0.0 0.0 0.0 0.0
Others 6.7 5.3 4.7 2.2 1.6 2.9
Total 37.5 38.5 46.2 13.7 14.5 22.7
Source: GLOBEFISH
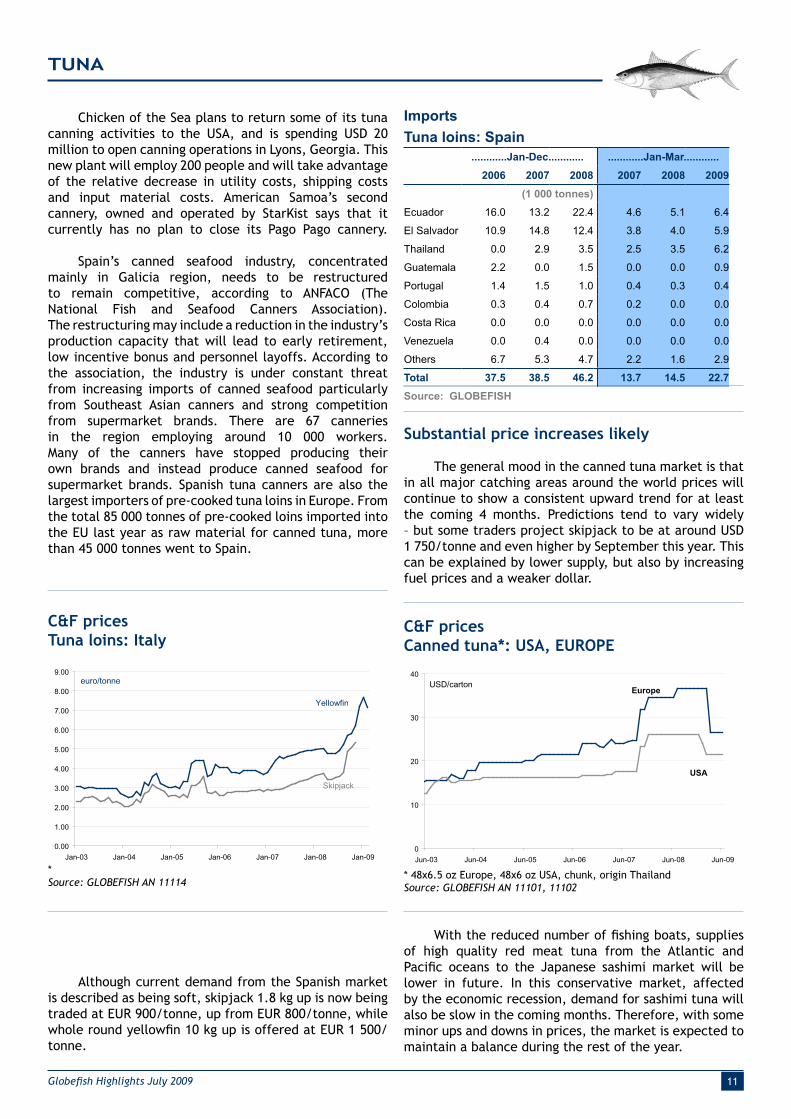
Substantial price increases likely
The general mood in the canned tuna market is that
in all major catching areas around the world prices will
continue to show a consistent upward trend for at least
the coming 4 months. Predictions tend to vary widely
– but some traders project skipjack to be at around USD
1 750/tonne and even higher by September this year. This
can be explained by lower supply, but also by increasing
fuel prices and a weaker dollar.
C&F prices
Canned tuna*: USA, EUROPE
* 48x6.5 oz Europe, 48x6 oz USA, chunk, origin Thailand
Source: GLOBEFISH AN 11101, 11102
0
10
20
30
40
Jun-03 Jun-04 Jun-05 Jun-06 Jun-07 Jun-08 Jun-09
USD/carton
USA
Europe
With the reduced number of fi shing boats, supplies
of high quality red meat tuna from the Atlantic and
Pacifi c oceans to the Japanese sashimi market will be
lower in future. In this conservative market, affected
by the economic recession, demand for sashimi tuna will
also be slow in the coming months. Therefore, with some
minor ups and downs in prices, the market is expected to
maintain a balance during the rest of the year.
C&F prices
Tuna loins: Italy
*
Source: GLOBEFISH AN 11114
0.00
1.00
2.00
3.00
4.00
5.00
6.00
7.00
8.00
9.00
Jan-03 Jan-04 Jan-05 Jan-06 Jan-07 Jan-08 Jan-09
euro/tonne
Yellowfin
Skipjack
12 Globefi sh Highlights July 2009
GROUNDFISH
Economic crisis overshadows groundfi sh market
Prices of all groundfi sh species declined sharply in the fi rst half of 2009. The main
reason was lower demand by institutional clients. In addition, cheap cultured fi sh
– pangasius and tilapia – create strong competition in the market. On the positive side,
the return of cod stocks in the Barents Sea and in Newfoundland can be mentioned. In
the latter area, it has taken almost 30 years for the cod stock to recover. Alaska pol-
lack continues to be the main groundfi sh species caught worldwide. For this species,
the situation is bleak in US waters, but higher quotas were given in the Russian fi shing
area. Supply to the market is expected to be abundant in coming months.
C&F prices
Groundfi sh blocks: USA
Source: GLOBEFISH AN 010805, 010806, 010834
Cod stocks recover in Barents Sea
In the Barents Sea, the overall cod biomass is now
the largest it has been since 1968, and the spawning stock
biomass is the highest it has been since the early 1950’s.
The 2008 TAC in the Barents Sea was 430 000 tonnes. For
2009, the TAC is 525 000 tonnes. For 2010 and 2011, it
will increase by another 50 000 tonnes each year.
This means an additional 200 000 tonnes of cod
available in the Barents Sea, between 2008 and 2011 to
which another 30 000 tonnes in Iceland can be added.
Furthermore, surges in cod have been reported
in the Northwestern Atlantic and in parts of Western
Greenland at a time when the market collapse for cod
has bottomed out.
This change in the abundance of cod is caused by
environmental conditions that are making the North
Atlantic a more hospitable habitat. It is interesting to note
that only recently, cod was being red-fl agged on various
environmental lists, and there were demonstrations in
the UK, against retailers who were selling thought to be
‘endangered’ cod.
0.5
1.0
1.5
2.0
2.5
3.0
Jun-02 Jun-03 Jun-04 Jun-05 Jun-06 Jun-07 Jun-08 Jun-09
USD/lb
Cod
Alaska pollack
Hake
Cod is back in Canada
After almost 30 years cod is back in the the Canadian
Atlantic Ocean. However, this increase in production
in this area has not yet had an impact on the present
groundfi sh market, but it will most likely be felt in the
coming years. The recovery of cod stocks in the Barents
Sea and in the Northwest Atlantic were the subject of a
presentation made at the Brussels Seafood Exhibition. It
reported that cod stocks are at their highest levels in three
decades. While the effect of possible increased catches is
not apparent yet, it could impact the groundfi sh market
signifi cantly in coming years.
Imports
Cod-like groundfi sh: USA
..........Jan-Dec.......... ..........Jan-Mar..........
2006 2007 2008 2007 2008 2009
( 1 000 tonnes)
Fillets
China 91.3 74.5 71.6 20.2 18.7 20.1
Iceland 16 11.1 7.9 4.1 2.5 2.9
Canada 9.7 5.5 4.2 1.1 0.6 1.0
Norway 2.1 0.2 0.8 0.4 0.3 0.4
Others 9.0 6.4 5.5 1.0 0.0 0.0
Total 128.1 97.7 90.0 26.8 22.1 24.4
Blocks/Slabs
China 25.4 41.7 35.2 14.2 10.3 9.8
Argentina 2.9 2.0 2.3 0.9 0.6 0.2
Iceland 0.6 0.8 0.9 0.2 0.1 0.4
Norway 0.5 0.1 0.2 0.0 0.0 0.0
Russian Fed. 0.5 0.8 1.3 0.1 0.2 1.1
Canada 0.5 2.1 0.7 0.7 0.2 0.2
Korea Rep. 0.0 0.0 0.0 0.0 0.0 0.0
Others 2.0 1.7 1.4 1.0 0.8 1.6
Total 32.4 49.2 42.0 17.1 12.2 13.3
Gr. Total 160.5 146.9 132.0 43.9 34.3 37.7
Source: NMFS
13Globefi sh Highlights July 2009
Cod farming in Norway is experiencing an uncertain
period as it battles to achieve profi tability in the face
of generally poor market conditions and diffi culties in
increasing cod growing rates suffi ciently for economic
production.
Higher imports into US market
Groundfi sh imports into the US maket showed an
increase (10% from 34 300 tonnes to 37 700 tonnes) in the
fi rst quarter of this year compared with the fi rst three
months of 2008 but have not yet recovered to January-
March 2007 levels (43 900 tonnes). This rise refl ects
increased imports by the USA of both frozen fi llets and
blocks. During the fi rst three months of 2009 the quantity
of frozen groundfi sh fi llets imported by the US was 24 400
tonnes, 10% more compared with the same period of the
previous year, whereas imports of blocks went up by 9%.
China is the main supplier of both groundfi sh fi llets and
blocks to the USA with 82% and 74% respectively of total
imports during January-March 2009. This country has
increased its shipments to the US by 7% (fi llets) and 5%
(blocks) in the period under review. China is the major re-
processor of groundfi sh in the world, with strong imports
of raw material from the USA, Russia and Norway.
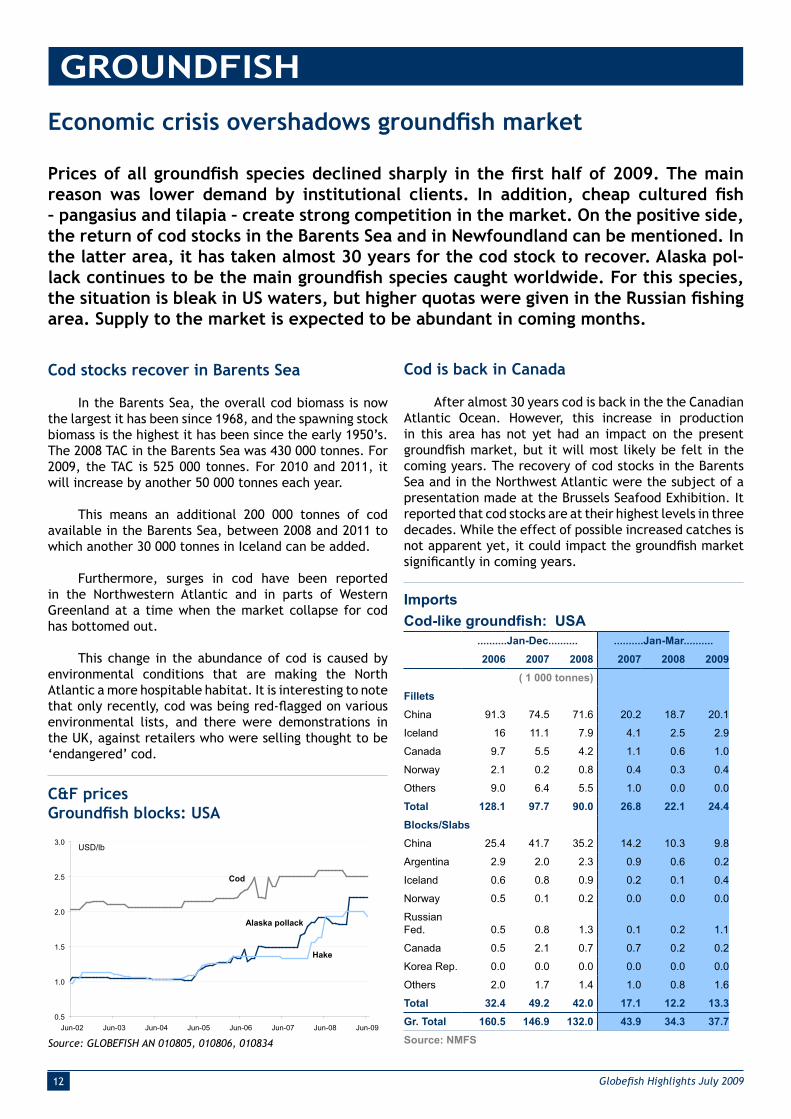
Prices of all groundfi sh on the US market have
remained stable in the fi rst half of 2009. The cod market,
where prices had been in free fall since November 2008,
seems to have stabilized at a low level. Fillets were
quoted at USD 2.50/lb. Hake fi llets, which followed
the same trend as cod, had a value of USD 2.20/lb for
the whole of this period. Only the Alaska pollack price
declined in June 2009 from USD 2.00/lb to USD 1.93/lb,
back to November 2008 levels.
China dominates European Alaska pollack
market
Moving on to the European groundfi sh market,
German imports of Alaska pollack fi llets which remained
unchanged between the fi rst quarters of 2007 and 2008
only slightly increased (by 5 % to 42 200 tonnes) its
income of this product during January-March 2009. As in
the USA, China is the main exporter to Germany, with
24 200 tonnes of Alaska pollack fi llets in the fi rst months
of 2009, 16% more compared to 2008 and up 23% from
2007. However, the USA, the second main suppplier to
Germany, decreased its exports of Alaska pollack fi llets
to Germany quite strongly (by 53% to 8 300 tonnes during
January-March 2009 compared with the same months of
2008).
Alaska pollack fi llets imports into France have
dropped to 10 100 tonnes (6%) compared with the same
months of 2008 despite the 14% increase in Chinese
supplies. The fi gures indicate that the decrease in imports
can be ascribed to the other suppliers, namely the USA
(-9%), Germany (-7%) and the Russian Federation (-20%).
Imports
Frozen Alaska pollock fi llets: Germany
..........Jan-Dec.......... ..........Jan-Mar..........
2006 2007 2008 2007 2008 2009
( 1 000 tonnes)
China 88.0 78.5 89.7 19.7 20.8 24.2
USA 39.4 55.2 53.4 15.4 17.8 8.3
Russian.F. 27.6 25.4 28.9 7.3 4.9 8.5
Others 6.1 5.3 4.9 2.0 0.9 1.2
Total 161.1 164.4 176.8 44.4 44.4 42.2
Source: Statistisches Bundesamt
Imports
Frozen cod fi llets: Germany
..........Jan-Dec.......... ..........Jan-Mar..........
2006 2007 2008 2007 2008 2009
( 1 000 tonnes)
China 8.1 12.2 12.1 3.0 3.8 3.0
Poland 1.4 3.8 2.2 1.5 0.6 0.5
Denmark 1.2 1.5 1.8 0.3 0.7 0.4
Russia 2.4 1.1 1.1 0.5 0.5 0.2
Iceland 0.5 0.3 0.2 0.0 0.1 0.1
Norway 0.6 0.6 0.2 0.1 0.1 0.0
Others 1.8 2.7 2.1 0.6 0.3 0.3
Total 16.0 22.2 19.7 6.0 6.1 4.5
Source: Statistisches Bundesamt
Imports
Frozen hake fi llets: Germany
..........Jan-Dec.......... ..........Jan-Mar..........
2006 2007 2008 2007 2008 2009
( 1 000 tonnes)
USA 4.4 6.1 6.3 2.2 2.0 1.5
Peru 4.1 4.1 3.7 1.1 1.5 0.9
Argentina 6.9 6.1 3.5 1.5 0.8 1.7
Chile 2.2 1.0 1.5 0.7 0.3 0.3
Russian Fed. 0.2 0.0 0.0 0.0 0.0 0.0
Others 6.6 4.5 5.6 1.8 1.0 2.2
Total 24.4 21.8 20.6 7.3 5.6 6.6
Source: Statistisches Bundesamt
GROUNDFISH
14 Globefi sh Highlights July 2009
Less cod on German market
German imports of frozen cod fi llets have dropped by
26% in 2009 reaching 4 500 tonnes, mainly caused by the
decline in Chinese exports (by 21% to 3 000 tonnes) but
also by reduced shipments from Denmark and Russia.
During the fi rst quarter of 2009, the UK
imported 15 400 tonnes of frozen cod, the culmination
of a downward trend, fi nishing almost 18% below the
corresponding 2008 fi gure and 43% below the 2007. Again,
the main reason for this decline is the drop in imports
from China (-52% to 3 000 tonnes), the main supplier of
cod to the UK market.
The German market reported a strong positive
trend (+18%) for frozen hake fi llet imports, compared
to 2008, although not achieving 2007 levels. USA (the
leading supplier) and Peru have decreased their exports
of this product to Germany (by 25% and 40% respectively).
Argentina thus accounted for the increase in total hake
fi llet imports.
Italian frozen hake import fi gures show that the
overall situation has not changed at all in the fi rst three
Imports
Frozen hake: Italy
..........Jan-Dec.......... ..........Jan-Mar..........
2006 2007 2008 2007 2008 2009
( 1 000 tonnes)
Argentina 14.8 10.8 10.2 2.7 2.6 2.2
S. Africa 4.8 4.4 5.6 1.1 1.6 1.5
Spain 6.3 5.3 4.3 1.7 1.3 1.2
Uruguay 5.8 4.6 4.0 0.8 0.9 0.9
Namibia 2.4 1.7 2.9 0.4 0.5 0.5
Peru 0.0 0.0 0.4 0.0 0.2 0.0
Chile 0.2 0.2 0.3 0.1 0.1 0.2
Others 2.3 2.8 2.4 0.5 0.0 0.8
Total 36.6 29.8 30.1 7.3 7.2 7.3
months of 2009 (7 300 tonnes) compared with the same
period of both 2008 and 2007. Decreased exports by
Argentina (-15%) and South Africa (-6%), the top suppliers
of frozen hake to Italy, have been counterbalanced by
increased exports by other suppliers.
Outlook diffi cult
Some traders are speculating on a shortage of
Alaska pollack in coming months, which should lead to
increasing prices despite the fact that demand is falling
and a price decrease for the B season is expected in the
USA. In Russia, the quota has been increased so price
levels are expected to decrease below USD 4 000/tonne.
However, the overall world economic situation, plus the
good supply of cod and Alaska pollack on the market
will not leave much room for price increases in the near
future.
Imports
Frozen Alaska pollock fi llets: France
..........Jan-Dec.......... ..........Jan-Mar..........
2006 2007 2008 2007 2008 2009
( 1 000 tonnes)
China 18.6 18.6 21.7 4.7 5.7 6.5
USA 10.8 10.3 7.9 2.5 2.3 1.4
Germany 6.3 4.4 4.2 1.2 1.1 0.8
Russian Fed. 4.3 4.0 7.1 1.6 1.5 1.2
Others 0.8 0.7 0.6 0.1 0.1 0.0
Total 40.8 38.0 41.5 10.1 10.7 10.1
Source: National Trade Statistics
Surimi sales system threatened
Japanese traders see little chance of recovery in
surimi production mainly because of the US Alaska pollack
quota cuts in recent years, which have caused substantial
diffi culties in securing raw material. Surimi production
in the preceding ‘A’ season (including surimi originating
from the Gulf of Alaska), dropped by 27% since last year
when production was over 50 000 tonnes. The decline in
surimi production in the USA was also related to the fact
that packers progressively shifted to Alaska pollack fi llet
and H&G (dressed) production. In Russia, pollock catch
quotas have been raised gradually. As part of the national
policy, preference is given to production for domestic
consumption For this reason, there is a slim chance of an
increase in surimi supply in the next few years.
GROUNDFISH
GROUNDFISH NEWS
NORWAY/UK: MSC LABEL NETS DOMSTEIN UK DEAL
A second UK retailer will stock MSC-labeled haddock supplied
by Norway’s Domstein following the company’s certifi cation
in March 2009. Sainsbury’s will start selling MSC-labeled
haddock in mid June, following ASDA’s decision to sell cod and
haddock from Domstein Longline Partners in March. Although
it will initially only be the haddock from Domstein sold be
Sainsbury’s, a spokesman told Intrafi sh it was “looking into”
also selling its cod. The company has seen a dramatic increase
in demand cod and haddock since getting the MSC approval,
Domstein CEO Roll Domstein told IntraFish. Source: INTRAFISH
JAPAN: NISSUI REPORTED SURIMI CLIMBED 50%
Japanese fi rm Nippon Suisan Kaisha (Nissui) reported healthy
sales in its surimi business as prices jumped in the fi scal year
to 31 March 2009. Though the company’s production of surimi
dropped almost 20% to 27 360 tonnes, the value surged 22.5%
to JPY 13 billion (EUR 99.2 million/USD 138 million) after
the unit price increased by half. Despite this rise, overall
sales of seafood at the company fell 7.9% by volume to 139
483 tonnes, while overall value of sales made a loss of JPY
3 billion (EUR 22.9 million/USD 32 million). As for salmon,
trout, shrimp, and cod roe, their declined transaction
quantities led to reduced sales. Source: THE SUISAN TIMES

15Globefi sh Highlights July 2009
Economic crisis impacts world cephalopod market
The world squid market is in a very diffi cult situation. Supply is sharply down in the
Southwest Atlantic, which normally would lead to a substantial price hike, especially
after the extremely low prices of the previous two years. However, the economic crisis
is putting a brake on these price expectations, and even though prices are moving up
somewhat, they are still well below potential levels. Demand for octopus is strong in
Japan, while the European market is rather reluctant to offer higher prices. Future
price developments will depend on the outcome of the fi shing season in the East central
Atlantic, which has just started.
CEPHALOPODS
Squid catches extremely low
The 2009 squid season in the Southwest Atlantic was
a disaster. In the whole area, only 65 000 tonnes of squid
were caught in the fi rst fi ve months of the year, which
compares with 334 000 tonnes of squid caught in the area
during the same period last year. Squid catches around the
Falklands/Malvinas were extremely low, only 45 tonnes
of Illex squid were caught in January to May 2009, which
compares with 94 000 tonnes during the same period of
2008. For Loligo squid the decline was slightly less
dramatic, down from 25 000 tonnes to 13 000
tonnes. Argentina Mainland reported squid catches during
the fi rst fi ve months of the year of 53 000 tonnes, down
from last year’s 220 000 tonnes. In June 2009 there is
practically no more squid fi shing, as the fuel costs are
higher than income.
Exports
Argentina: Squid
....................Jan-April....................
2007 2008 2008 2009
(1 000 tonnes)
Spain 58.4 61.2 26.1 9.7
China 37.6 66.8 15.1 6.4
Brazil 2.3 2.4 0.6 1.6
Japan 10.7 6.2 2.5 2.1
Italy 11.5 9.3 4.2 1.8
Korea, Rep 4.4 4.0 0.7 1.3
Others 24.3 25.5 5.3 5.8
Total 149.2 175.3 54.5 28.7
Source: GLOBEFISH
Imports
Cuttlefi sh: Japan
.............Jan-Dec............ .............Jan-Mar.............
2006 2007 2008 2007 2008 2009
(1 000 tonnes)
Thailand 12.5 11.5 8.3 2.7 1.8 1.6
Viet Nam 4.7 5.1 4.5 1.3 0.9 1.0
Morocco 3.5 3.9 2.2 0.6 0.3 0.2
Malaysia 2.2 1.6 1.7 0.4 0.3 0.4
Korea Rep. 0.4 0.3 0.6 0.2 0.1 0.1
China 1.5 0.4 0.1 0.1 0.0 0.0
Ghana 0.2 0.5 0.0 0.0 0.0 0.0
Mauritania 0.0 0.1 0.0 0.0 0.0 0.0
Others 3.1 2.6 2.3 0.7 0.6 0.5
Total 28.1 26.0 19.7 6.0 4.0 3.8
Source: GLOBEFISH AN 10439
Squid exports from Argentina were 28 700 tonnes
in the fi rst four months of 2009, almost half the amount
Imports
Squid: USA
.............Jan-Dec............ .............Jan-Mar.............
2006 2007 2008 2007 2008 2009
(1 000 tonnes)
China 32.9 28.8 27.7 7.2 5.3 5.5
Thailand 7.4 7.2 8.2 1.6 2.8 1.4
India 8.2 4.5 6.9 1.2 0.9 0.9
Taiwan PC 5.6 5.9 5.4 0.9 1.4 1.5
New Zealand 2.2 2.5 1.0 0.4 0.3 0.2
Rep. Korea 2.8 3.1 5.4 0.6 0.9 1.0
Peru 1.7 0.1 2.0 0.6 0.4 0.7
Others 8.4 10.3 8.5 1.7 1.2 1.2
Total 69.2 62.4 65.1 14.2 13.2 12.4
Source: GLOBEFISH AN 10459
16 Globefi sh Highlights July 2009
CEPHALOPODS
Imports
Squid: Japan
.............Jan-Dec............ .............Jan-Mar.............
2006 2007 2008 2007 2008 2009
(1 000 tonnes)
China 28.9 30.2 26.1 6.0 5.2 4.8
Peru 4.8 7.8 12.8 0.0 0.9 1.9
Thailand 7.6 8.1 7.1 1.6 1.4 1.3
Argentina 5.6 10.4 6.3 0.4 0.1 0.3
Viet Nam 7.0 6.8 5.5 1.3 1.0 1.0
USA 4.6 5.4 3.9 1.7 3.5 0.5
India 1.9 1.0 1.2 0.3 0.2 0.2
New Zealand 1.4 3.3 0.9 0.3 0.1 0.1
Korea Rep. 0.4 0.9 0.8 0.2 0.0 0.0
Morocco 0.8 0.2 0.2 0.0 0.0 0.2
Taiwan PC 0.3 0.4 0.2 0.0 0.0 0.0
Others 2.6 2.6 2.8 1.4 0.4 0.8
Total 65.9 77.1 67.8 13.2 12.8 11.1
Source: GLOBEFISH AN 10437
Imports
Squid: Spain
.............Jan-Dec............ .............Jan-Mar.............
2006 2007 2008 2007 2008 2009
(1 000 tonnes)
Argentina 83.6 61.3 54.4 8.0 4.2 4.9
Falkland/Malv. 42.4 40.3 45.6 7.0 3.5 3.8
India 18.2 12.8 15.5 3.1 2.3 2.5
China 8.1 6.4 6.7 1.8 1.9 2.3
Morocco 4.5 1.4 3.3 0.4 0.6 1.0
South Africa 4.0 3.5 4.5 1.0 1.2 0.7
USA 3.9 1.7 2.2 0.6 1.0 0.2
Korea Rep. 2.5 2.0 2.9 0.6 1.0 0.2
Peru 1.8 4.5 1.2 1.1 0.3 0.7
New Zealand 0.0 0.1 0.1 0.0 0.0 0.0
Others 12.2 11.8 14.0 1.7 4.1 2.0
Total 181.2 145.8 150.4 25.3 20.1 18.3
Source: GLOBEFISH AN 10450
Imports
Cuttlefi sh: Spain
.............Jan-Dec............ .............Jan-Mar.............
2006 2007 2008 2007 2008 2009
(1 000 tonnes)
India 19.8 18.1 16.8 3.3 2.7 2.8
Morocco 11.3 10.1 12.1 2.3 2.4 2.1
China 8.0 5.1 6.4 0.7 0.8 1.1
France 5.1 6.7 3.8 1.4 1.1 0.6
Mauritania 3.2 3.6 2.5 1.2 0.8 0.2
Ghana 2.3 2.0 1.5 0.6 0.4 0.4
Others 14.2 12.2 8.1 3.1 2.2 1.3
Total 63.9 57.8 51.2 12.6 10.4 8.5
Source: GLOBEFISH AN 10457
exported one year earlier. While exports to Japan and Re-
public of Korea were quite strong, shipments to Spain and
China, usually the main markets for Argentinian squid,
declined sharply.
Good demand in Japan
In the Japanese market, which had already started to
weaken when squid supplies from the Southwest Atlantic
fi rst arrived, prices fi rmed again, once the disastrous
catch situation there became apparent. Total squid
imports into the Japanese market in the fi rst quarter of
the year were slightly lower than the corresponding 2008
fi gures. Further price hikes are likely before September
Spanish import statistics for the fi rst three months of
the year showed a moderate decline in imports, a trend
that will become stronger in the second quarter of the year.
All main exporting countries reported lower exports.
On the other hand, Spanish importers are reluctant to
offer higher prices, in the view of the overall economic
situation in the country.
Similar to Spain, the Italian market is importing less
squid. In addition, Italian traders are turning to lower
priced species (Giant squid) rather than the traditional
Loligo squid. The use of this relatively new species in
industrial food preparations, such as seafood salads, is
increasing.
when the domestic fl ying squid supply will enter the
market. Overall, coldstorage holdings are about 7 000
tonnes short of the last year’s results, which also points
to price increases in the market.
Prices should be moving up, in reaction to
this sharp decline, but the impact of the eco-
nomic crisis on demand for squid in Spain puts
an effective brake on any major price increases.
The unit value of Spanish squid imports from Argentina
was USD 1 000/tonne in the January-April 2009 period,
down from USD 1 067/tonne in the same period of 2008.
Imports of squid from Argentina into Spain were 9 700
tonnes in the January-April 2009 period, down sharp-
ly (-63%) from the corresponding period of 2008.

17Globefi sh Highlights July 2009
Coldstorage holdings
Cuttlefi sh and Squid: Japan
*NEI
Source: INFOFISH Trade News, GLOBEFISH AN 10507
0
20
40
60
80
100
120
140
160
Apr-01 Apr-02 Apr-03 Apr-04 Apr-05 Apr-06 Apr-07 Apr-08 Apr-09
1 000 MT
Cuttlefish
NEI*
Squid
Imports
Octopus: Japan
.............Jan-Dec............ .............Jan-Mar.............
2006 2007 2008 2007 2008 2009
(1 000 tonnes)
Mauritania 16.6 14.0 12.6 3.8 4.0 4.2
Morocco 8.7 10.3 10.9 1.6 0.5 0.5
China 8.2 7.2 6.7 1.3 2.3 1.0
Viet Nam 5.5 4.8 5.5 1.1 0.8 1.1
Spain 4.0 1.8 2.7 0.5 1.2 0.4
Thailand 1.9 1.8 1.2 0.5 0.3 0.3
Others 3.5 6.9 5.1 0.5 2.3 0.4
Total 48.4 46.8 44.7 9.3 11.4 7.9
Source: GLOBEFISH AN 10438
Imports
Octopus: Spain
.............Jan-Dec............ .............Jan-Mar.............
2006 2007 2008 2007 2008 2009
(1 000 tonnes)
Morocco 20.2 19.6 23.2 7.9 6.3 5.1
Mauritania 4.9 4.9 4.5 1.3 1.0 2.3
China 2.8 1.6 1.8 0.4 0.4 0.3
Viet Nam 1.9 2.2 1.6 0.9 0.3 0.4
Portugal 1.4 1.7 2.2 0.2 0.9 0.3
Senegal 0.5 0.5 0.6 0.1 0.1 0.1
Others 8.6 8.8 8.7 2.6 2.3 1.0
Total 40.3 39.3 42.6 13.4 11.3 9.5
Source: GLOBEFISH AN 10452
Imports
Squid: Italy
.............Jan-Dec............ .............Jan-Mar.............
2006 2007 2008 2007 2008 2009
(1 000 tonnes)
Thailand 21.2 22.8 23.4 4.6 5.5 4.7
Spain 30.3 25.2 22.1 7.6 6.3 6.8
Argentina 8.9 10.7 10.0 0.7 0.6 0.4
S. Africa 5.0 3.7 3.7 1.4 0.7 0.7
India 3.8 2.9 3.5 0.7 0.6 1.0
Peru 3.4 3.4 0.9 0.6 0.1 1.1
New Zealand 2.3 0.1 0.1 0.0 0.0 0.0
Others 22.8 32.8 23.2 5.2 6.0 4.1
Total 97.7 101.6 86.9 20.8 19.8 18.8
Source: GLOBEFISH AN 10455
Imports
Cuttlefi sh: Italy
.............Jan-Dec............ .............Jan-Mar.............
2006 2007 2008 2007 2008 2009
(1 000 tonnes)
France 5.9 6.7 5.6 1.1 1.7 1.1
Spain 4.8 3.7 4.6 0.8 1.0 0.9
Tunisia 3.1 5.1 4.1 1.3 1.2 0.9
Senegal 2.2 2.4 1.9 0.5 0.5 0.4
Viet Nam 1.7 0.8 1.0 0.3 0.2 0.1
Morocco 1.1 0.8 1.0 0.1 0.1 0.2
India 2.9 0.9 0.7 0.3 0.2 0.3
China 0.5 0.1 0.6 0.0 0.1 0.1
Thailand 1.6 0.3 0.2 0.0 0.1 0.1
Others 9.1 5.9 5.5 1.4 1.1 0.5
Total 32.9 26.7 25.2 5.8 6.2 4.6
Source: GLOBEFISH AN 10439
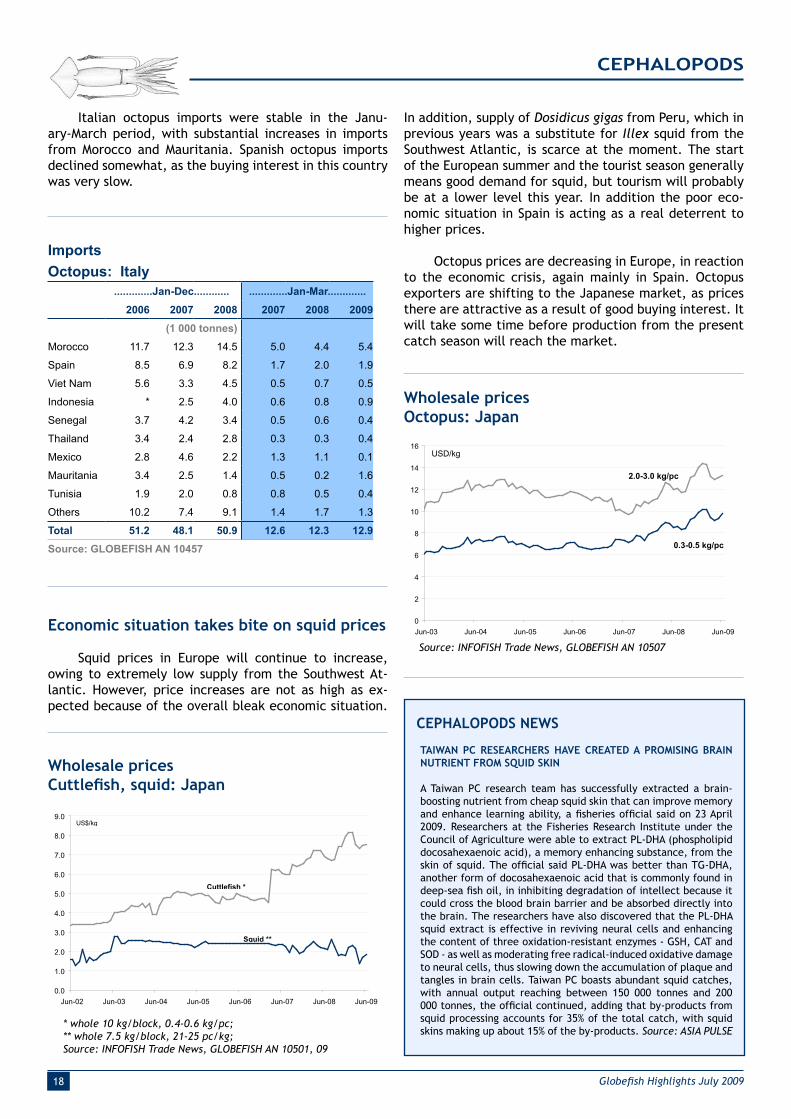
High prices offered for octopus
Octopus fi shing has recently started in Mauritania
and Morocco. As usually at the beginning of the catch-
ing season, after a long period of fi shing bans, catches
are good and specimens are large. However, the expec-
tations are for smaller octopus to be caught soon, and
lower catches to be reported.
Octopus traders in Japan are offering higher prices
than Europe at the moment, and there was a substantial
shift in exports towards this market during the second
quarter of the year. During the fi rst quarter of 2009, oc-
topus imports into Japan declined sharply. As a result,
coldstorage holdings went down in recent months, and
traders are fi lling the gap. Prices of octopus in the Japa-
nese market are moving up, helped by a relatively strong
yen.
CEPHALOPODS
18 Globefi sh Highlights July 2009
CEPHALOPODS NEWS
TAIWAN PC RESEARCHERS HAVE CREATED A PROMISING BRAIN
NUTRIENT FROM SQUID SKIN
A Taiwan PC research team has successfully extracted a brain-
boosting nutrient from cheap squid skin that can improve memory
and enhance learning ability, a fi sheries offi cial said on 23 April
2009. Researchers at the Fisheries Research Institute under the
Council of Agriculture were able to extract PL-DHA (phospholipid
docosahexaenoic acid), a memory enhancing substance, from the
skin of squid. The offi cial said PL-DHA was better than TG-DHA,
another form of docosahexaenoic acid that is commonly found in
deep-sea fi sh oil, in inhibiting degradation of intellect because it
could cross the blood brain barrier and be absorbed directly into
the brain. The researchers have also discovered that the PL-DHA
squid extract is effective in reviving neural cells and enhancing
the content of three oxidation-resistant enzymes - GSH, CAT and
SOD - as well as moderating free radical-induced oxidative damage
to neural cells, thus slowing down the accumulation of plaque and
tangles in brain cells. Taiwan PC boasts abundant squid catches,
with annual output reaching between 150 000 tonnes and 200
000 tonnes, the offi cial continued, adding that by-products from
squid processing accounts for 35% of the total catch, with squid
skins making up about 15% of the by-products. Source: ASIA PULSE
Imports
Octopus: Italy
.............Jan-Dec............ .............Jan-Mar.............
2006 2007 2008 2007 2008 2009
(1 000 tonnes)
Morocco 11.7 12.3 14.5 5.0 4.4 5.4
Spain 8.5 6.9 8.2 1.7 2.0 1.9
Viet Nam 5.6 3.3 4.5 0.5 0.7 0.5
Indonesia * 2.5 4.0 0.6 0.8 0.9
Senegal 3.7 4.2 3.4 0.5 0.6 0.4
Thailand 3.4 2.4 2.8 0.3 0.3 0.4
Mexico 2.8 4.6 2.2 1.3 1.1 0.1
Mauritania 3.4 2.5 1.4 0.5 0.2 1.6
Tunisia 1.9 2.0 0.8 0.8 0.5 0.4
Others 10.2 7.4 9.1 1.4 1.7 1.3
Total 51.2 48.1 50.9 12.6 12.3 12.9
Source: GLOBEFISH AN 10457
Italian octopus imports were stable in the Janu-
ary-March period, with substantial increases in imports
from Morocco and Mauritania. Spanish octopus imports
declined somewhat, as the buying interest in this country
was very slow.
Economic situation takes bite on squid prices
Squid prices in Europe will continue to increase,
owing to extremely low supply from the Southwest At-
lantic. However, price increases are not as high as ex-
pected because of the overall bleak economic situation.
Wholesale prices
Cuttlefi sh, squid: Japan
* whole 10 kg/block, 0.4-0.6 kg/pc;
** whole 7.5 kg/block, 21-25 pc/kg;
Source: INFOFISH Trade News, GLOBEFISH AN 10501, 09
0.0
1.0
2.0
3.0
4.0
5.0
6.0
7.0
8.0
9.0
Jun-02 Jun-03 Jun-04 Jun-05 Jun-06 Jun-07 Jun-08 Jun-09
US$/kg
Squid **
Cuttlefish *
Wholesale prices
Octopus: Japan
Source: INFOFISH Trade News, GLOBEFISH AN 10507
0
2
4
6
8
10
12
14
16
Jun-03 Jun-04 Jun-05 Jun-06 Jun-07 Jun-08 Jun-09
0.3-0.5 kg/pc
2.0-3.0 kg/pc
USD/kg
In addition, supply of Dosidicus gigas from Peru, which in
previous years was a substitute for Illex squid from the
Southwest Atlantic, is scarce at the moment. The start
of the European summer and the tourist season generally
means good demand for squid, but tourism will probably
be at a lower level this year. In addition the poor eco-
nomic situation in Spain is acting as a real deterrent to
higher prices.
Octopus prices are decreasing in Europe, in reaction
to the economic crisis, again mainly in Spain. Octopus
exporters are shifting to the Japanese market, as prices
there are attractive as a result of good buying interest. It
will take some time before production from the present
catch season will reach the market.
CEPHALOPODS
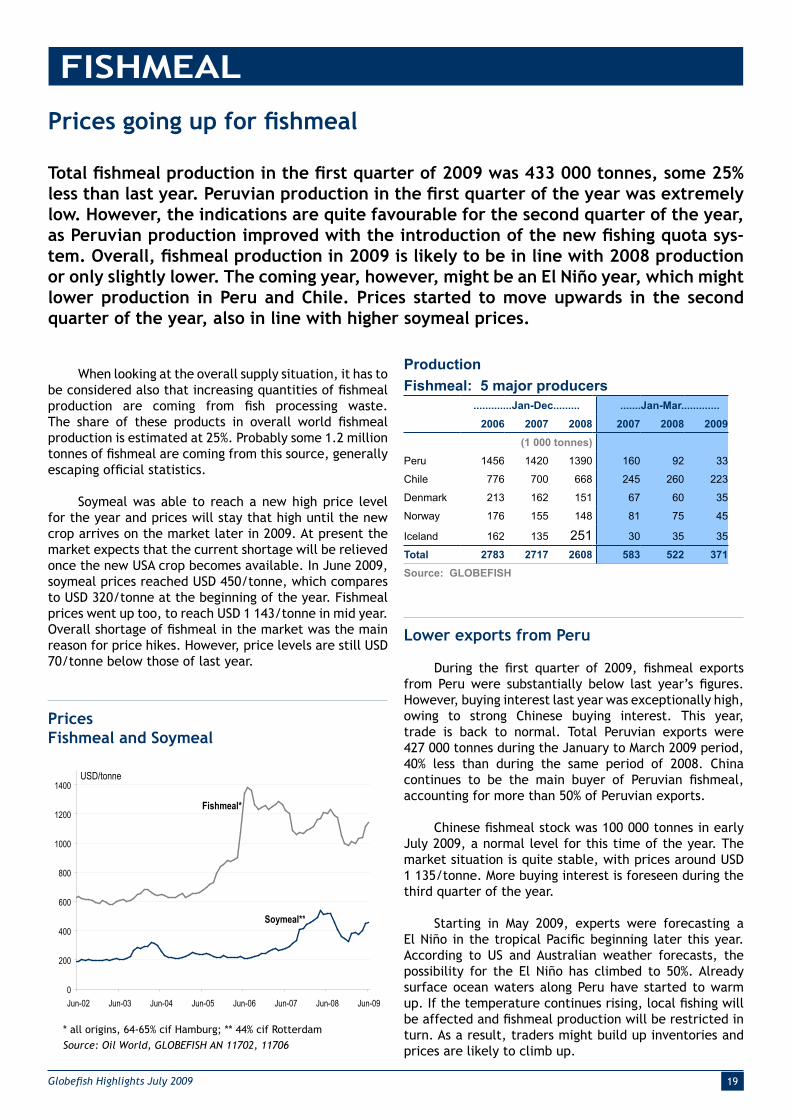
19Globefi sh Highlights July 2009
When looking at the overall supply situation, it has to
be considered also that increasing quantities of fi shmeal
production are coming from fi sh processing waste.
The share of these products in overall world fi shmeal
production is estimated at 25%. Probably some 1.2 million
tonnes of fi shmeal are coming from this source, generally
escaping offi cial statistics.
Soymeal was able to reach a new high price level
for the year and prices will stay that high until the new
crop arrives on the market later in 2009. At present the
market expects that the current shortage will be relieved
once the new USA crop becomes available. In June 2009,
soymeal prices reached USD 450/tonne, which compares
to USD 320/tonne at the beginning of the year. Fishmeal
prices went up too, to reach USD 1 143/tonne in mid year.
Overall shortage of fi shmeal in the market was the main
reason for price hikes. However, price levels are still USD
70/tonne below those of last year.
Prices
Fishmeal and Soymeal
* all origins, 64-65% cif Hamburg; ** 44% cif Rotterdam
Source: Oil World, GLOBEFISH AN 11702, 11706
Prices going up for fi shmeal
Total fi shmeal production in the fi rst quarter of 2009 was 433 000 tonnes, some 25%
less than last year. Peruvian production in the fi rst quarter of the year was extremely
low. However, the indications are quite favourable for the second quarter of the year,
as Peruvian production improved with the introduction of the new fi shing quota sys-
tem. Overall, fi shmeal production in 2009 is likely to be in line with 2008 production
or only slightly lower. The coming year, however, might be an El Niño year, which might
lower production in Peru and Chile. Prices started to move upwards in the second
quarter of the year, also in line with higher soymeal prices.
FISHMEAL
0
200
400
600
800
1000
1200
1400
Jun-02 Jun-03 Jun-04 Jun-05 Jun-06 Jun-07 Jun-08 Jun-09
USD/tonne
Fishmeal*
Soymeal**
Lower exports from Peru
During the fi rst quarter of 2009, fi shmeal exports
from Peru were substantially below last year’s fi gures.
However, buying interest last year was exceptionally high,
owing to strong Chinese buying interest. This year,
trade is back to normal. Total Peruvian exports were
427 000 tonnes during the January to March 2009 period,
40% less than during the same period of 2008. China
continues to be the main buyer of Peruvian fi shmeal,
accounting for more than 50% of Peruvian exports.
Chinese fi shmeal stock was 100 000 tonnes in early
July 2009, a normal level for this time of the year. The
market situation is quite stable, with prices around USD
1 135/tonne. More buying interest is foreseen during the
third quarter of the year.
Starting in May 2009, experts were forecasting a
El Niño in the tropical Pacifi c beginning later this year.
According to US and Australian weather forecasts, the
possibility for the El Niño has climbed to 50%. Already
surface ocean waters along Peru have started to warm
up. If the temperature continues rising, local fi shing will
be affected and fi shmeal production will be restricted in
turn. As a result, traders might build up inventories and
prices are likely to climb up.
Production
Fishmeal: 5 major producers
.............Jan-Dec......... .......Jan-Mar.............
2006 2007 2008 2007 2008 2009
(1 000 tonnes)
Peru 1456 1420 1390 160 92 33
Chile 776 700 668 245 260 223
Denmark 213 162 151 67 60 35
Norway 176 155 148 81 75 45
Iceland 162 135 251 30 35 35
Total 2783 2717 2608 583 522 371
Source: GLOBEFISH
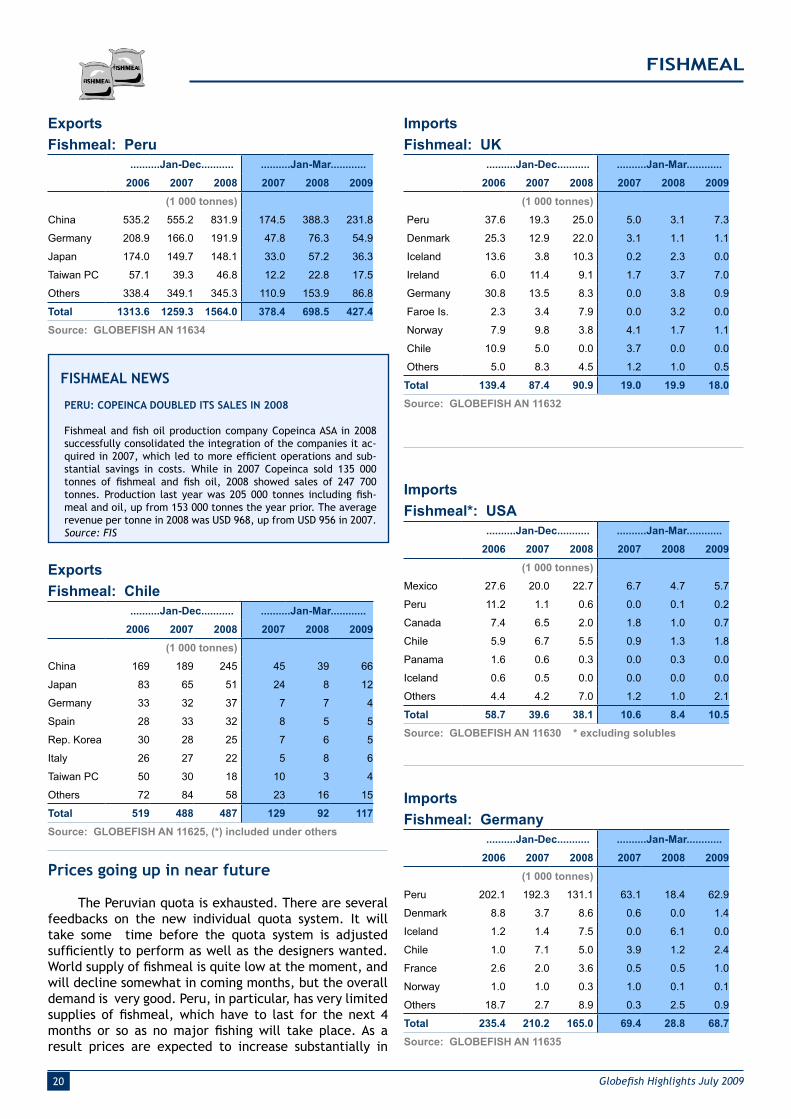
20 Globefi sh Highlights July 2009
FISHMEAL
FISHMEAL NEWS
PERU: COPEINCA DOUBLED ITS SALES IN 2008
Fishmeal and fi sh oil production company Copeinca ASA in 2008
successfully consolidated the integration of the companies it ac-
quired in 2007, which led to more effi cient operations and sub-
stantial savings in costs. While in 2007 Copeinca sold 135 000
tonnes of fi shmeal and fi sh oil, 2008 showed sales of 247 700
tonnes. Production last year was 205 000 tonnes including fi sh-
meal and oil, up from 153 000 tonnes the year prior. The average
revenue per tonne in 2008 was USD 968, up from USD 956 in 2007.
Source: FIS
Imports
Fishmeal: UK
..........Jan-Dec........... ..........Jan-Mar............
2006 2007 2008 2007 2008 2009
(1 000 tonnes)
Peru 37.6 19.3 25.0 5.0 3.1 7.3
Denmark 25.3 12.9 22.0 3.1 1.1 1.1
Iceland 13.6 3.8 10.3 0.2 2.3 0.0
Ireland 6.0 11.4 9.1 1.7 3.7 7.0
Germany 30.8 13.5 8.3 0.0 3.8 0.9
Faroe Is. 2.3 3.4 7.9 0.0 3.2 0.0
Norway 7.9 9.8 3.8 4.1 1.7 1.1
Chile 10.9 5.0 0.0 3.7 0.0 0.0
Others 5.0 8.3 4.5 1.2 1.0 0.5
Total 139.4 87.4 90.9 19.0 19.9 18.0
Source: GLOBEFISH AN 11632
Imports
Fishmeal*: USA
..........Jan-Dec........... ..........Jan-Mar............
2006 2007 2008 2007 2008 2009
(1 000 tonnes)
Mexico 27.6 20.0 22.7 6.7 4.7 5.7
Peru 11.2 1.1 0.6 0.0 0.1 0.2
Canada 7.4 6.5 2.0 1.8 1.0 0.7
Chile 5.9 6.7 5.5 0.9 1.3 1.8
Panama 1.6 0.6 0.3 0.0 0.3 0.0
Iceland 0.6 0.5 0.0 0.0 0.0 0.0
Others 4.4 4.2 7.0 1.2 1.0 2.1
Total 58.7 39.6 38.1 10.6 8.4 10.5
Source: GLOBEFISH AN 11630 * excluding solubles
Exports
Fishmeal: Peru
..........Jan-Dec........... ..........Jan-Mar............
2006 2007 2008 2007 2008 2009
(1 000 tonnes)
China 535.2 555.2 831.9 174.5 388.3 231.8
Germany 208.9 166.0 191.9 47.8 76.3 54.9
Japan 174.0 149.7 148.1 33.0 57.2 36.3
Taiwan PC 57.1 39.3 46.8 12.2 22.8 17.5
Others 338.4 349.1 345.3 110.9 153.9 86.8
Total 1313.6 1259.3 1564.0 378.4 698.5 427.4
Source: GLOBEFISH AN 11634
Prices going up in near future
The Peruvian quota is exhausted. There are several
feedbacks on the new individual quota system. It will
take some time before the quota system is adjusted
suffi ciently to perform as well as the designers wanted.
World supply of fi shmeal is quite low at the moment, and
will decline somewhat in coming months, but the overall
demand is very good. Peru, in particular, has very limited
supplies of fi shmeal, which have to last for the next 4
months or so as no major fi shing will take place. As a
result prices are expected to increase substantially in
Exports
Fishmeal: Chile
..........Jan-Dec........... ..........Jan-Mar............
2006 2007 2008 2007 2008 2009
(1 000 tonnes)
China 169 189 245 45 39 66
Japan 83 65 51 24 8 12
Germany 33 32 37 7 7 4
Spain 28 33 32 8 5 5
Rep. Korea 30 28 25 7 6 5
Italy 26 27 22 5 8 6
Taiwan PC 50 30 18 10 3 4
Others 72 84 58 23 16 15
Total 519 488 487 129 92 117
Source: GLOBEFISH AN 11625, (*) included under others
Imports
Fishmeal: Germany
..........Jan-Dec........... ..........Jan-Mar............
2006 2007 2008 2007 2008 2009
(1 000 tonnes)
Peru 202.1 192.3 131.1 63.1 18.4 62.9
Denmark 8.8 3.7 8.6 0.6 0.0 1.4
Iceland 1.2 1.4 7.5 0.0 6.1 0.0
Chile 1.0 7.1 5.0 3.9 1.2 2.4
France 2.6 2.0 3.6 0.5 0.5 1.0
Norway 1.0 1.0 0.3 1.0 0.1 0.1
Others 18.7 2.7 8.9 0.3 2.5 0.9
Total 235.4 210.2 165.0 69.4 28.8 68.7
Source: GLOBEFISH AN 11635
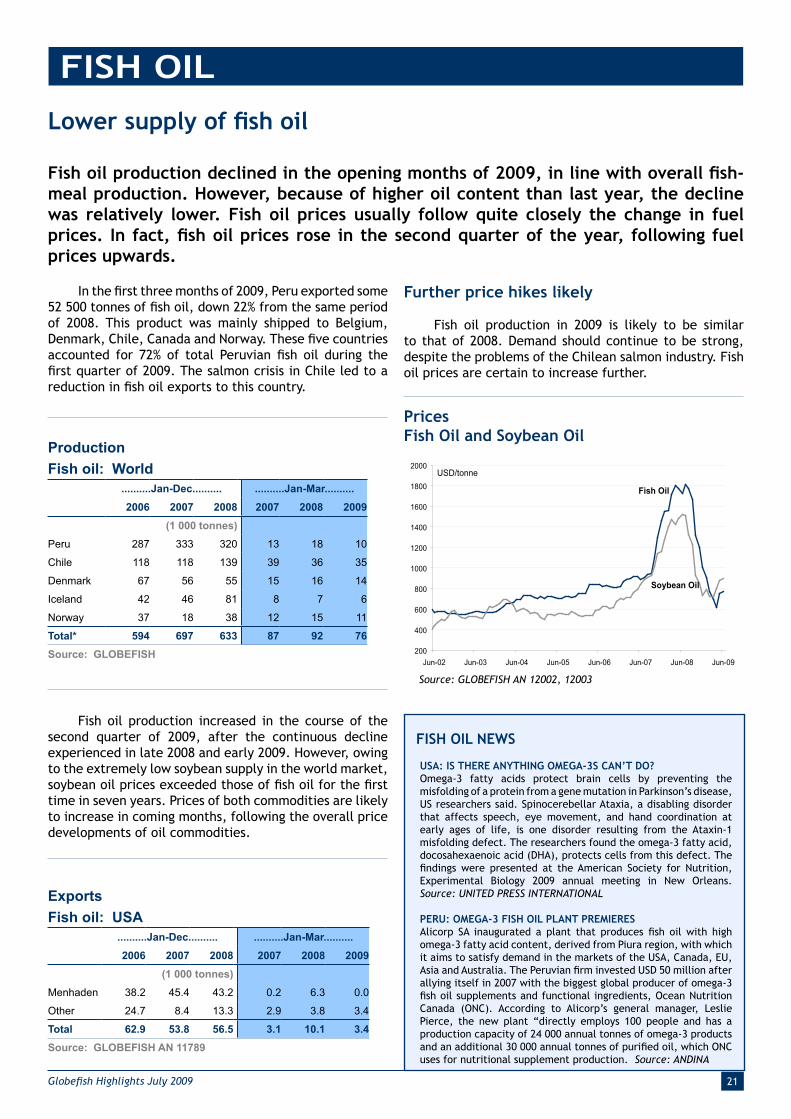
21Globefi sh Highlights July 2009
Lower supply of fi sh oil
Fish oil production declined in the opening months of 2009, in line with overall fi sh-
meal production. However, because of higher oil content than last year, the decline
was relatively lower. Fish oil prices usually follow quite closely the change in fuel
prices. In fact, fi sh oil prices rose in the second quarter of the year, following fuel
prices upwards.
FISH OIL
Prices
Fish Oil and Soybean Oil
Source: GLOBEFISH AN 12002, 12003
FISH OIL NEWS
USA: IS THERE ANYTHING OMEGA-3S CAN’T DO?
Omega-3 fatty acids protect brain cells by preventing the
misfolding of a protein from a gene mutation in Parkinson’s disease,
US researchers said. Spinocerebellar Ataxia, a disabling disorder
that affects speech, eye movement, and hand coordination at
early ages of life, is one disorder resulting from the Ataxin-1
misfolding defect. The researchers found the omega-3 fatty acid,
docosahexaenoic acid (DHA), protects cells from this defect. The
fi ndings were presented at the American Society for Nutrition,
Experimental Biology 2009 annual meeting in New Orleans.
Source: UNITED PRESS INTERNATIONAL
PERU: OMEGA-3 FISH OIL PLANT PREMIERES
Alicorp SA inaugurated a plant that produces fi sh oil with high
omega-3 fatty acid content, derived from Piura region, with which
it aims to satisfy demand in the markets of the USA, Canada, EU,
Asia and Australia. The Peruvian fi rm invested USD 50 million after
allying itself in 2007 with the biggest global producer of omega-3
fi sh oil supplements and functional ingredients, Ocean Nutrition
Canada (ONC). According to Alicorp’s general manager, Leslie
Pierce, the new plant “directly employs 100 people and has a
production capacity of 24 000 annual tonnes of omega-3 products
and an additional 30 000 annual tonnes of purifi ed oil, which ONC
uses for nutritional supplement production. Source: ANDINA
In the fi rst three months of 2009, Peru exported some
52 500 tonnes of fi sh oil, down 22% from the same period
of 2008. This product was mainly shipped to Belgium,
Denmark, Chile, Canada and Norway. These fi ve countries
accounted for 72% of total Peruvian fi sh oil during the
fi rst quarter of 2009. The salmon crisis in Chile led to a
reduction in fi sh oil exports to this country.
Production
Fish oil: World
..........Jan-Dec.......... ..........Jan-Mar..........
2006 2007 2008 2007 2008 2009
(1 000 tonnes)
Peru 287 333 320 13 18 10
Chile 118 118 139 39 36 35
Denmark 67 56 55 15 16 14
Iceland 42 46 81 8 7 6
Norway 37 18 38 12 15 11
Total* 594 697 633 87 92 76
Source: GLOBEFISH
Fish oil production increased in the course of the
second quarter of 2009, after the continuous decline
experienced in late 2008 and early 2009. However, owing
to the extremely low soybean supply in the world market,
soybean oil prices exceeded those of fi sh oil for the fi rst
time in seven years. Prices of both commodities are likely
to increase in coming months, following the overall price
developments of oil commodities.
Exports
Fish oil: USA
..........Jan-Dec.......... ..........Jan-Mar..........
2006 2007 2008 2007 2008 2009
(1 000 tonnes)
Menhaden 38.2 45.4 43.2 0.2 6.3 0.0
Other 24.7 8.4 13.3 2.9 3.8 3.4
Total 62.9 53.8 56.5 3.1 10.1 3.4
Source: GLOBEFISH AN 11789
Further price hikes likely
Fish oil production in 2009 is likely to be similar
to that of 2008. Demand should continue to be strong,
despite the problems of the Chilean salmon industry. Fish
oil prices are certain to increase further.
200
400
600
800
1000
1200
1400
1600
1800
2000
Jun-02 Jun-03 Jun-04 Jun-05 Jun-06 Jun-07 Jun-08 Jun-09
USD/tonne
Soybean Oil
Fish Oil

22 Globefi sh Highlights July 2009
Tilapia: a good product in the present crisis
Tilapia is a product with a strong growth rate. China is by far the main producer, but
many other Asian countries are also expanding their tilapia outputs. This product is
good in these times of economic crisis, as its price/value ratio is very good. The USA
is the main market in the Western world, while the EU is still lagging behind. Prices of
tilapia declined in recent months, as a result of lower prices of competing products.
Prices are expected to stay relatively low in coming months as well.
TILAPIA
Chinese production improving
Chinese tilapia production recovered in the fi rst half
of 2009, after the very diffi cult winter last year. Chinese
tilapia exports grew as a result, with 60 000 tonnes
exported in the fi rst four months of 2009, 9% more than
last year. The USA is by far the largest importer of Chinese
tilapia. In this period some 35 000 tonnes of tilapia were
imported from China, some 17% more than in the same
period of 2008.
Exports
Tilapia: China
..........Jan-Dec.......... .....Jan-Apr.....
2006 2007 2008 2008 2009
(1 000 tonnes)
USA 104.7 122.0 118.6 29.7 34.8
Mexico 32.9 39.3 36.5 11.1 13.4
Russia 5.5 19.3 17.1 4.7 2.7
Israel 3.7 4.1 4.2 0.7 na
Germany 1.7 1.2 1.7 0.6 0.7
Hong Kong 1.7 1.5 0.3 0.1 0.1
Belgium 1.4 1.4 2.3 0.5 0.6
Puerto Rico 1.3 1.3 1.7 0.4 0.2
Dominican Rep. 1.0 1.4 0.5 0.0 0.0
Canada 1.0 0.7 0.6 0.2 0.1
Others 26.9 23.0 40.9 7.4 7.8
Total 181.8 215.2 224.4 55.4 60.4
Source: GLOBEFISH
Mexico is a distant second, taking 13 000 tonnes
in the January-April 2009 period, a 20% increase over
2008. The Mexican government is trying to fi nd ways of
reducing the infl ux of Chinese tilapia into its market.
However, this is not an easy task. The sanitary conditions
of the product are excellent, and Mexican supermarkets
prefer the imported tilapia to the domestic tilapia, as the
consistency of the product is far better. The only solution
would be an indication of origin on the packaging, but
there is no law imposing this type of labeling regulation.
US demand for tilapia was sluggish in the fi rst
months of 2009. China sent less tilapia to the US market
in the second quarter of the year. Despite this decline
in supply, prices of frozen tilapia fi llets continued to
decline. At present, the price has reached USD 2.00/lb,
Imports
Fresh Tilapia Fillets: USA
..........Jan-Dec.......... ..........Jan-Mar..........
2006 2007 2008 2007 2008 2009
(1 000 tonnes)
Ecuador 10.9 11.9 8.5 3.4 2.6 2.6
Honduras 7.3 7.9 8.3 1.0 1.5 1.5
Costa Rica 2.7 4.8 5.6 2.2 2.2 1.6
China 0.0 0.0 3.1 0.0 0.3 0.0
Taiwan PC 0.0 0.0 0.6 0.0 0.1 0.0
Brazil 1.0 0.2 0.5 0.1 0.1 0.1
El Salvador 0.2 0.3 0.5 0.1 0.1 0.0
Panama 0.1 0.0 0.0 0.0 0.0 0.0
Others 0.9 1.1 2.1 0.3 0.7 0.6
Total 23.1 26.2 29.2 7.1 7.6 6.4
Source: GLOBEFISH
Unit value
Tilapia exports: China
Source: elaborated from National Trade Statistics
0.0
0.5
1.0
1.5
2.0
2.5
3.0
3.5
4.0
4.5
2004 2005 2006 2007 2008 2009
frozen whole
frozen fillets
other tilapia
Average
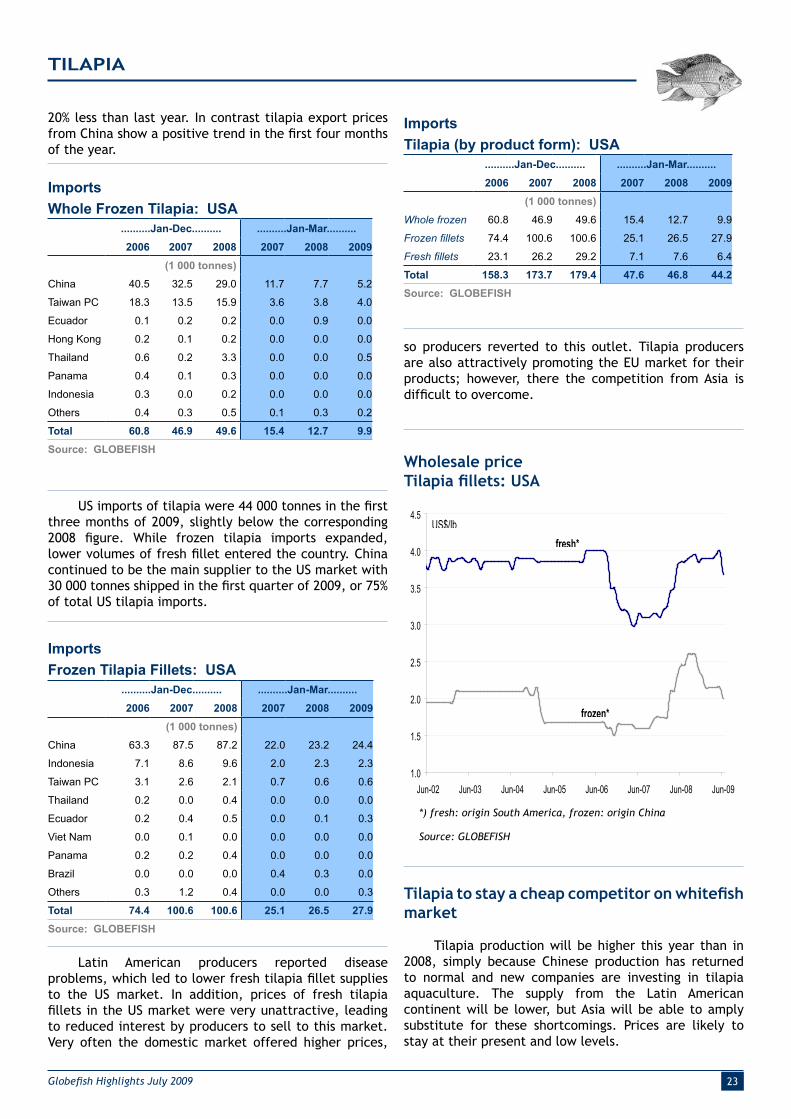
23Globefi sh Highlights July 2009
TILAPIA
Wholesale price
Tilapia fi llets: USA
Source: GLOBEFISH
*) fresh: origin South America, frozen: origin China
20% less than last year. In contrast tilapia export prices
from China show a positive trend in the fi rst four months
of the year.
Imports
Whole Frozen Tilapia: USA
..........Jan-Dec.......... ..........Jan-Mar..........
2006 2007 2008 2007 2008 2009
(1 000 tonnes)
China 40.5 32.5 29.0 11.7 7.7 5.2
Taiwan PC 18.3 13.5 15.9 3.6 3.8 4.0
Ecuador 0.1 0.2 0.2 0.0 0.9 0.0
Hong Kong 0.2 0.1 0.2 0.0 0.0 0.0
Thailand 0.6 0.2 3.3 0.0 0.0 0.5
Panama 0.4 0.1 0.3 0.0 0.0 0.0
Indonesia 0.3 0.0 0.2 0.0 0.0 0.0
Others 0.4 0.3 0.5 0.1 0.3 0.2
Total 60.8 46.9 49.6 15.4 12.7 9.9
Source: GLOBEFISH
US imports of tilapia were 44 000 tonnes in the fi rst
three months of 2009, slightly below the corresponding
2008 fi gure. While frozen tilapia imports expanded,
lower volumes of fresh fi llet entered the country. China
continued to be the main supplier to the US market with
30 000 tonnes shipped in the fi rst quarter of 2009, or 75%
of total US tilapia imports.
Imports
Frozen Tilapia Fillets: USA
..........Jan-Dec.......... ..........Jan-Mar..........
2006 2007 2008 2007 2008 2009
(1 000 tonnes)
China 63.3 87.5 87.2 22.0 23.2 24.4
Indonesia 7.1 8.6 9.6 2.0 2.3 2.3
Taiwan PC 3.1 2.6 2.1 0.7 0.6 0.6
Thailand 0.2 0.0 0.4 0.0 0.0 0.0
Ecuador 0.2 0.4 0.5 0.0 0.1 0.3
Viet Nam 0.0 0.1 0.0 0.0 0.0 0.0
Panama 0.2 0.2 0.4 0.0 0.0 0.0
Brazil 0.0 0.0 0.0 0.4 0.3 0.0
Others 0.3 1.2 0.4 0.0 0.0 0.3
Total 74.4 100.6 100.6 25.1 26.5 27.9
Source: GLOBEFISH
Imports
Tilapia (by product form): USA
..........Jan-Dec.......... ..........Jan-Mar..........
2006 2007 2008 2007 2008 2009
(1 000 tonnes)
Whole frozen 60.8 46.9 49.6 15.4 12.7 9.9
Frozen fi llets 74.4 100.6 100.6 25.1 26.5 27.9
Fresh fi llets 23.1 26.2 29.2 7.1 7.6 6.4
Total 158.3 173.7 179.4 47.6 46.8 44.2
Source: GLOBEFISH
Latin American producers reported disease
problems, which led to lower fresh tilapia fi llet supplies
to the US market. In addition, prices of fresh tilapia
fi llets in the US market were very unattractive, leading
to reduced interest by producers to sell to this market.
Very often the domestic market offered higher prices,
so producers reverted to this outlet. Tilapia producers
are also attractively promoting the EU market for their
products; however, there the competition from Asia is
diffi cult to overcome.
Tilapia to stay a cheap competitor on whitefi sh
market
Tilapia production will be higher this year than in
2008, simply because Chinese production has returned
to normal and new companies are investing in tilapia
aquaculture. The supply from the Latin American
continent will be lower, but Asia will be able to amply
substitute for these shortcomings. Prices are likely to
stay at their present and low levels.
1.0
1.5
2.0
2.5
3.0
3.5
4.0
4.5
Jun-02 Jun-03 Jun-04 Jun-05 Jun-06 Jun-07 Jun-08 Jun-09
US$/lb
frozen*
fresh*
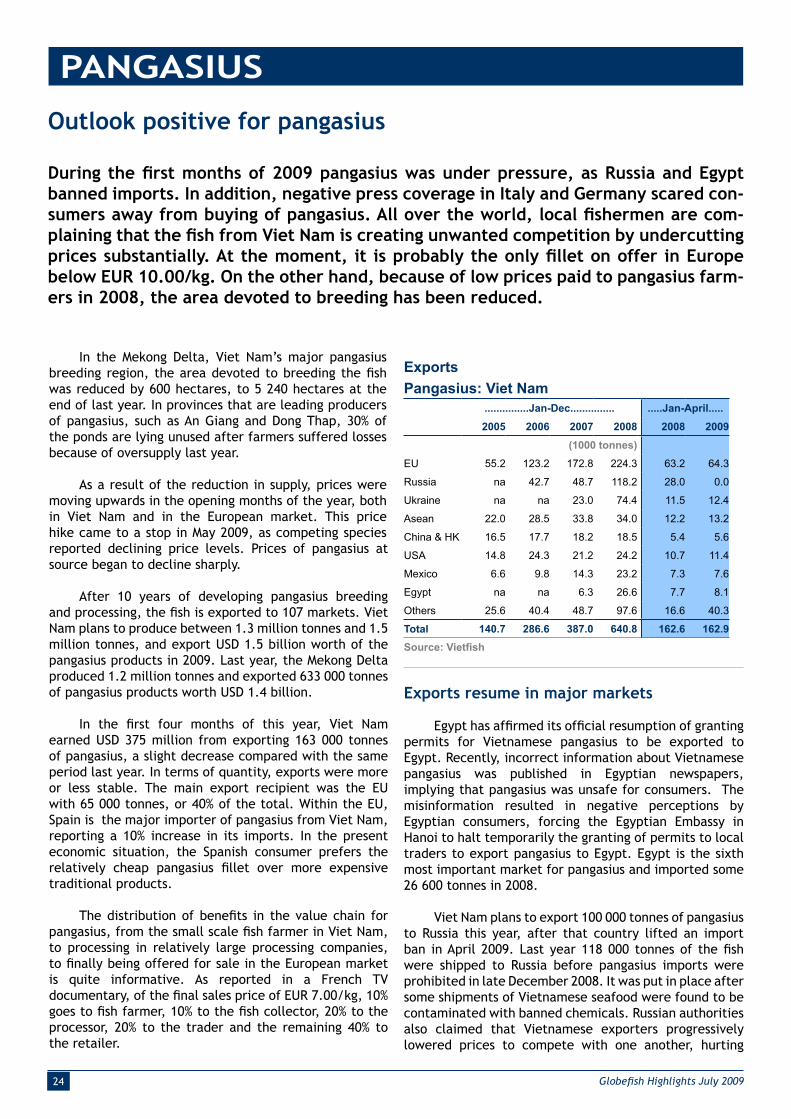
24 Globefi sh Highlights July 2009
Outlook positive for pangasius
During the fi rst months of 2009 pangasius was under pressure, as Russia and Egypt
banned imports. In addition, negative press coverage in Italy and Germany scared con-
sumers away from buying of pangasius. All over the world, local fi shermen are com-
plaining that the fi sh from Viet Nam is creating unwanted competition by undercutting
prices substantially. At the moment, it is probably the only fi llet on offer in Europe
below EUR 10.00/kg. On the other hand, because of low prices paid to pangasius farm-
ers in 2008, the area devoted to breeding has been reduced.
PANGASIUS
In the Mekong Delta, Viet Nam’s major pangasius
breeding region, the area devoted to breeding the fi sh
was reduced by 600 hectares, to 5 240 hectares at the
end of last year. In provinces that are leading producers
of pangasius, such as An Giang and Dong Thap, 30% of
the ponds are lying unused after farmers suffered losses
because of oversupply last year.
As a result of the reduction in supply, prices were
moving upwards in the opening months of the year, both
in Viet Nam and in the European market. This price
hike came to a stop in May 2009, as competing species
reported declining price levels. Prices of pangasius at
source began to decline sharply.
After 10 years of developing pangasius breeding
and processing, the fi sh is exported to 107 markets. Viet
Nam plans to produce between 1.3 million tonnes and 1.5
million tonnes, and export USD 1.5 billion worth of the
pangasius products in 2009. Last year, the Mekong Delta
produced 1.2 million tonnes and exported 633 000 tonnes
of pangasius products worth USD 1.4 billion.
In the fi rst four months of this year, Viet Nam
earned USD 375 million from exporting 163 000 tonnes
of pangasius, a slight decrease compared with the same
period last year. In terms of quantity, exports were more
or less stable. The main export recipient was the EU
with 65 000 tonnes, or 40% of the total. Within the EU,
Spain is the major importer of pangasius from Viet Nam,
reporting a 10% increase in its imports. In the present
economic situation, the Spanish consumer prefers the
relatively cheap pangasius fi llet over more expensive
traditional products.
The distribution of benefi ts in the value chain for
pangasius, from the small scale fi sh farmer in Viet Nam,
to processing in relatively large processing companies,
to fi nally being offered for sale in the European market
is quite informative. As reported in a French TV
documentary, of the fi nal sales price of EUR 7.00/kg, 10%
goes to fi sh farmer, 10% to the fi sh collector, 20% to the
processor, 20% to the trader and the remaining 40% to
the retailer.
Exports
Pangasius: Viet Nam
...............Jan-Dec............... .....Jan-April.....
2005 2006 2007 2008 2008 2009
(1000 tonnes)
EU 55.2 123.2 172.8 224.3 63.2 64.3
Russia na 42.7 48.7 118.2 28.0 0.0
Ukraine na na 23.0 74.4 11.5 12.4
Asean 22.0 28.5 33.8 34.0 12.2 13.2
China & HK 16.5 17.7 18.2 18.5 5.4 5.6
USA 14.8 24.3 21.2 24.2 10.7 11.4
Mexico 6.6 9.8 14.3 23.2 7.3 7.6
Egypt na na 6.3 26.6 7.7 8.1
Others 25.6 40.4 48.7 97.6 16.6 40.3
Total 140.7 286.6 387.0 640.8 162.6 162.9
Exports resume in major markets
Egypt has affi rmed its offi cial resumption of granting
permits for Vietnamese pangasius to be exported to
Egypt. Recently, incorrect information about Vietnamese
pangasius was published in Egyptian newspapers,
implying that pangasius was unsafe for consumers. The
misinformation resulted in negative perceptions by
Egyptian consumers, forcing the Egyptian Embassy in
Hanoi to halt temporarily the granting of permits to local
traders to export pangasius to Egypt. Egypt is the sixth
most important market for pangasius and imported some
26 600 tonnes in 2008.
Viet Nam plans to export 100 000 tonnes of pangasius
to Russia this year, after that country lifted an import
ban in April 2009. Last year 118 000 tonnes of the fi sh
were shipped to Russia before pangasius imports were
prohibited in late December 2008. It was put in place after
some shipments of Vietnamese seafood were found to be
contaminated with banned chemicals. Russian authorities
also claimed that Vietnamese exporters progressively
lowered prices to compete with one another, hurting
Source: Vietfi sh

25Globefi sh Highlights July 2009
PANGASIUS
Russian importers. Russian authorities have now fi xed a
minimum price of RUB 78/kg (USD 2.30/kg) a kilogram.
Violators will be fi ned USD 50 000 and banned from
importing Vietnamese seafood.
At the end of June 2009, Viet Nam had exported
over 10 000 tonnes of tra and basa fi sh at USD 3.10/kg to
Russia since 25 April 2009 when Russia offi cially reopened
its market to Vietnamese fi sh. In July alone, another
15 000 tonnes of fi sh are expected to be shipped to
Russia, as a number of Russian importers asked for more
of pangasius from Viet Nam in the form of both packaged
fi llet and whole fi sh. Apart from Russia, demand from
many other foreign importers such as East European,
African and American countries is strong.
In May 2009 the New Zealand Federation of
Commercial Fishermen attacked a government move
to allow the import of catfi sh from Viet Nam, saying
it could dominate the fi sh and chips trade and ruin
the local industry. The market for New Zealand’s hoki
dropped by 90% when Vietnamese catfi sh imports were
allowed into Australia.
US imports of catfi sh (including pangasius) declined
somewhat in the fi rst three months of the year: some
11 500 tonnes were imported during the fi rst quarter
of 2009, 7% less than in the same period of 2008. While
Viet Nam, the top exporter of catfi sh to the US market
reported a modest increase in exports, Chinese catfi sh
exports dropped sharply, probably in reaction to more
strict sanitary controls by US inspectors.
New standard for pangasius
On 29 April 2009 Global GAP, announced its new
pangasius and tilapia standards, which were published
after having been tested on fi sh farms. The development
of the pangasius standard started in Viet Nam, the main
producing country. Supported by German Technical
Cooperation (GTZ), the working group presented a fi rst
draft proposal to GlobalGAP. The draft standard was
subject to trial audits on six farms and stakeholder
consultation.
The US International Trade Commission announced
in June 2009 that it would keep the tariff on frozen fi llets
of Vietnamese catfi sh, known in the US as ‘basa’ and
‘tra,’ afraid that lifting the duty would harm the domestic
catfi sh industry within a ‘reasonably foreseeable time.’
This decision did not come as a surprise. At present,
Vietnamese exporters are more concerned with an
upcoming decision as to whether to reclassify basa and
tra as catfi sh under the US farm bill. Imported catfi sh
is subject to more severe testing for antibiotics than
pangasius.
Prices of pangasius likely to increase further
The decline in production
of pangasius in Viet Nam
will result in a substantial
shortages in raw material,
and, at least in the near
future, a substantial increase
in price. The economic crisis
in Spain, which is having
negative implications for
many other fi sh species, will
result in more demand for
pangasius, well known as a
relatively cheap fi sh. In the
US market, the situation
might become diffi cult if
basa and tra were classifi ed
as catfi sh.
Imports
Frozen catfi sh: USA
.....................................Jan-Mar...................................
2004 2005 2006 2007 2008 2009
(1 000 tonnes)
Viet Nam 0.1 1.2 1.3 3.8 5.1 6.8
China 0.2 0.4 0.9 5.7 4.7 2.6
Thailand 0.0 0.0 0.7 1.5 1.3 1.5
Malaysia 0.0 0.0 0.8 0.5 0.4 0.0
Indonesia 0.0 0.0 0.0 0.2 0.2 0.0
Others 0.0 0.1 0.1 0.1 0.6 0.6
Total 0.3 1.7 3.8 11.8 12.3 11.5
Source: GLOBEFISH
EU39%
Russia0%
Mexico5%
Egypt5%
Others25%
Other34%
China & HK3% USA
7%Asean8%
Ukraine8%
Pangasius exports - in quantity terms

26 Globefi sh Highlights July 2009
Disastrous situation for Nile perch
Nile perch resources are under stress and production is going down. The three producing
countries report lower exports of fi llets to the EU, the main market for this product. In
2008, shipments to the EU declined by 10 000 tonnes, and further reduction is likely
this year. Prices are going down, as the competition of cheap pangasius is felt. In this
bleak environment, the only hope is adding value to the product, through certifi cation
schemes.
NILE PERCH
Nile perch resources are dwindling. The Lake Victoria
Fisheries Organization (LVFO) estimates that the Nile
perch stock was down from 1.9 million tonnes in 1999
to 370 000 tonnes last year. Catches of Nile perch are
now controlled and several management measures are in
place. Unfortunately, some illegal fi sheries that escape
control do occur on the lake. Without doubt, an important
role could be played by the processing industry, if they
refused to buy from unknown suppliers.
Naturland, a German eco-certifi er announced in
April 2009 that Lake Victoria Nile perch from specifi c
sites has now been certifi ed sustainable, and products
will carry the organization’s ecolabel in future. The
certifi cation covers about eight landing sites in the
western region of Lake Victoria and involves about
1 000 fi shermen, in Bukoba, Tanzania. Products from the
area will be both frozen and chilled fi llets. They will be
marketed initially in German-speaking countries. It is an
interesting initiative, as it will give certifi cation to small
scale fi sheries, generally excluded from the main stream
of eco-certifi cation. The initiative was in part fi nanced by
the German development assistance GTZ.
The guidelines for sustainability set by Naturland
focus on environmentally friendly use of fi sh stocks
and the entire ecosystem, avoidance of critical and
environmentally-harmful fi shing methods, ecologically-
sound processing without artifi cial additives or genetic
engineering and a publicly-open, transparent approval
process for all parts of the value chain. In addition to
sustainability standards and criteria for local conditions,
Naturland’s certifi cation process requires social criteria
compliance so the livelihood of the fi shermen and their
families as well as processing workers are safeguarded.
Nile perch exports to the EU dwindling
Total Nile perch exports to the EU last year were
42 300 tonnes, 10 000 tonnes less than in 2007. Tanzania
continues to be the main exporter of this product to the
EU market, accounting for more than half of the supply
of this species to the market. Exports dropped in 2008 by
more than 4 000 tonnes. Uganda reported even stronger
declines in exports, -5 000 tonnes. Uganda is thus in a
very diffi cult situation, as the country has invested a
considerable amount in processing facilities in recent
years. Fresh fi llets are the main Nile perch product
imported by the EU, with about 32 000 tonnes in 2008.
The existing trade links for fresh fi llet exports are well
developed and the quality is very high. In anticipation
of lower availability of Nile perch, perhaps this trade
experience could be applied to other products, especially
tilapia fi llets from aquaculture.
Imports
Nile Perch fi llets: EU
................Jan-Dec................ ......Jan-Mar......
2005 2006 2007 2008 2008 2009
(1 000 tonnes)
Kenya 5.2 4.2 5.1 4.0 1.2 0.8
Tanzania 24.0 23.6 27.5 23.3 6.1 5.0
Uganda 23.8 21.2 20.2 15.0 4.4 3.0
Grand Total 53.0 48.9 52.8 42.3 11.7 8.8
Source: GLOBEFISH
The fi rst quarter of 2009 saw a further decline in
exports of Nile perch fi llets to the EU market. Some 8 800
tonnes were exported, almost 3 000 tonnes less than in
the same period of last year. The drop in the volume of
exports was almost equally distributed across the three
exporting countries.
The outlook is bleak, as it will take the resource quite
some time to recover. Despite the lack in supply, prices
of Nile perch are going down. This is mainly caused by
the strong competition of pangasius fi llets in the market.
Prices are relatively low at the moment at EUR 6.20/kg,
which compares with EUR 7.00/kg one year ago.
NILE PERCH NEWS
OVERFISHING ‘ANNIHILATING’ UGANDA’S NILE PERCH
Overfi shing on Lake Victoria has seen Nile perch stocks drop 81%
to 370 000 tonnes in 2008 from 2 million tonnes three years ago,
“annihilating” the species, Uganda said on 16 April 2009. Fishing
is one of Uganda’s leading export earners. The east African nation
boasts four major lakes -- Victoria, Lake Albert, Lake George and
Lake Kyoga. Uganda’s fi sheries ministry said the price of Nile
Perch was rising, but earnings still dropped to USD 115 million last
year from a record of USD 143 million in 2005. Source: REUTERS
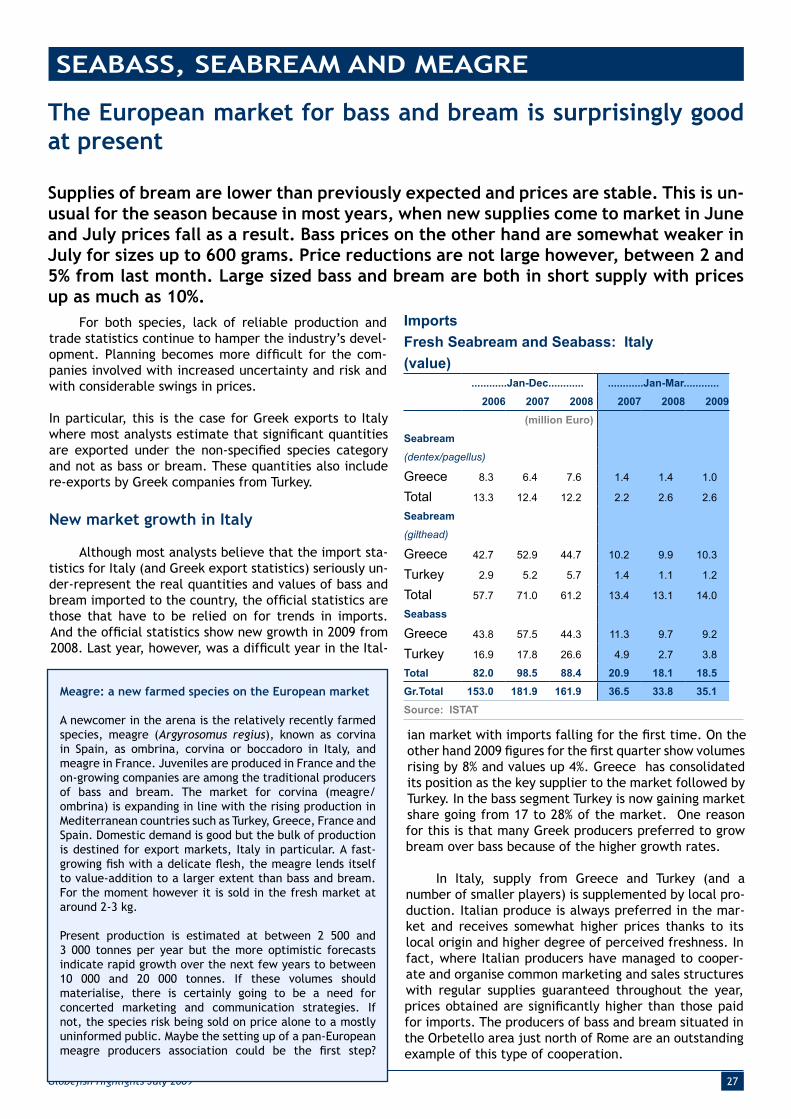
27Globefi sh Highlights July 2009
The European market for bass and bream is surprisingly good
at present
Supplies of bream are lower than previously expected and prices are stable. This is un-
usual for the season because in most years, when new supplies come to market in June
and July prices fall as a result. Bass prices on the other hand are somewhat weaker in
July for sizes up to 600 grams. Price reductions are not large however, between 2 and
5% from last month. Large sized bass and bream are both in short supply with prices
up as much as 10%.
SEABASS, SEABREAM AND MEAGRE
Meagre: a new farmed species on the European market
A newcomer in the arena is the relatively recently farmed
species, meagre (Argyrosomus regius), known as corvina
in Spain, as ombrina, corvina or boccadoro in Italy, and
meagre in France. Juveniles are produced in France and the
on-growing companies are among the traditional producers
of bass and bream. The market for corvina (meagre/
ombrina) is expanding in line with the rising production in
Mediterranean countries such as Turkey, Greece, France and
Spain. Domestic demand is good but the bulk of production
is destined for export markets, Italy in particular. A fast-
growing fi sh with a delicate fl esh, the meagre lends itself
to value-addition to a larger extent than bass and bream.
For the moment however it is sold in the fresh market at
around 2-3 kg.
Present production is estimated at between 2 500 and
3 000 tonnes per year but the more optimistic forecasts
indicate rapid growth over the next few years to between
10 000 and 20 000 tonnes. If these volumes should
materialise, there is certainly going to be a need for
concerted marketing and communication strategies. If
not, the species risk being sold on price alone to a mostly
uninformed public. Maybe the setting up of a pan-European
meagre producers association could be the fi rst step?
For both species, lack of reliable production and
trade statistics continue to hamper the industry’s devel-
opment. Planning becomes more diffi cult for the com-
panies involved with increased uncertainty and risk and
with considerable swings in prices.
In particular, this is the case for Greek exports to Italy
where most analysts estimate that signifi cant quantities
are exported under the non-specifi ed species category
and not as bass or bream. These quantities also include
re-exports by Greek companies from Turkey.
New market growth in Italy
Although most analysts believe that the import sta-
tistics for Italy (and Greek export statistics) seriously un-
der-represent the real quantities and values of bass and
bream imported to the country, the offi cial statistics are
those that have to be relied on for trends in imports.
And the offi cial statistics show new growth in 2009 from
2008. Last year, however, was a diffi cult year in the Ital-
Imports
Fresh Seabream and Seabass: Italy
(value)
............Jan-Dec............ ............Jan-Mar............
2006 2007 2008 2007 2008 2009
(million Euro)
Seabream
(dentex/pagellus)
Greece 8.3 6.4 7.6 1.4 1.4 1.0
Total 13.3 12.4 12.2 2.2 2.6 2.6
Seabream
(gilthead)
Greece 42.7 52.9 44.7 10.2 9.9 10.3
Turkey 2.9 5.2 5.7 1.4 1.1 1.2
Total 57.7 71.0 61.2 13.4 13.1 14.0
Seabass
Greece 43.8 57.5 44.3 11.3 9.7 9.2
Turkey 16.9 17.8 26.6 4.9 2.7 3.8
Total 82.0 98.5 88.4 20.9 18.1 18.5
Gr.Total 153.0 181.9 161.9 36.5 33.8 35.1
Source: ISTAT
ian market with imports falling for the fi rst time. On the
other hand 2009 fi gures for the fi rst quarter show volumes
rising by 8% and values up 4%. Greece has consolidated
its position as the key supplier to the market followed by
Turkey. In the bass segment Turkey is now gaining market
share going from 17 to 28% of the market. One reason
for this is that many Greek producers preferred to grow
bream over bass because of the higher growth rates.
In Italy, supply from Greece and Turkey (and a
number of smaller players) is supplemented by local pro-
duction. Italian produce is always preferred in the mar-
ket and receives somewhat higher prices thanks to its
local origin and higher degree of perceived freshness. In
fact, where Italian producers have managed to cooper-
ate and organise common marketing and sales structures
with regular supplies guaranteed throughout the year,
prices obtained are signifi cantly higher than those paid
for imports. The producers of bass and bream situated in
the Orbetello area just north of Rome are an outstanding
example of this type of cooperation.
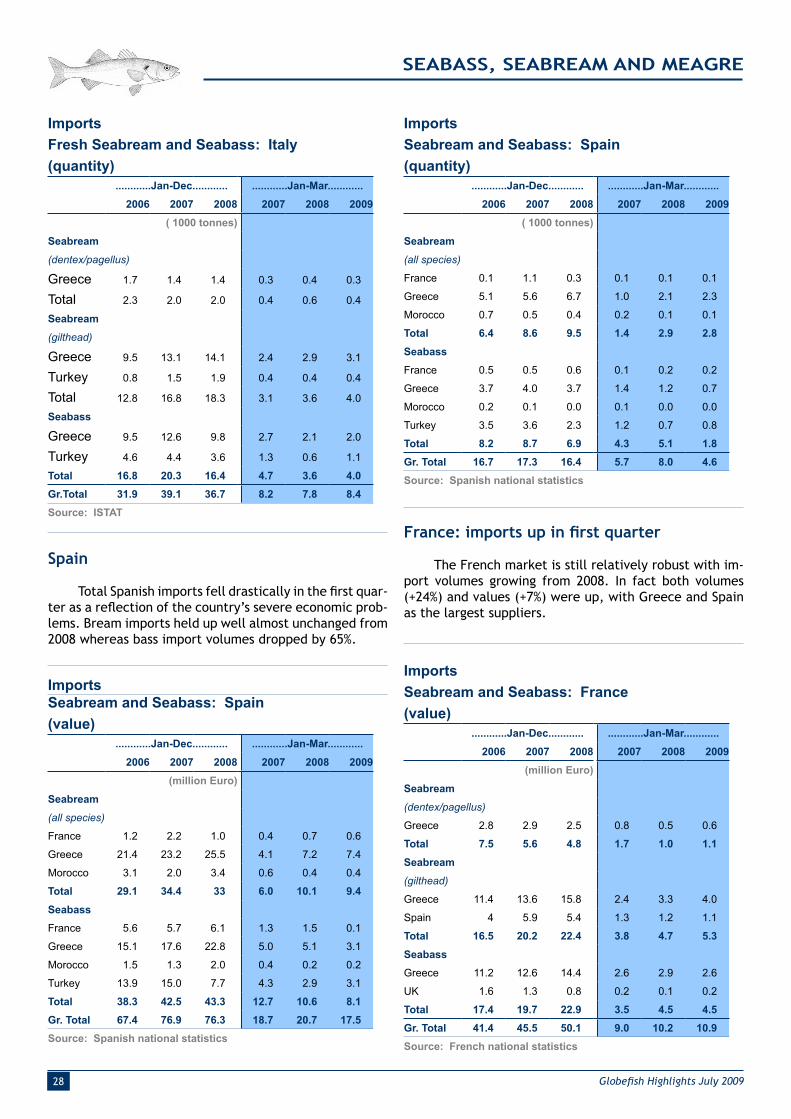
28 Globefi sh Highlights July 2009
SEABASS, SEABREAM AND MEAGRE
Imports
Fresh Seabream and Seabass: Italy
(quantity)
............Jan-Dec............ ............Jan-Mar............
2006 2007 2008 2007 2008 2009
( 1000 tonnes)
Seabream
(dentex/pagellus)
Greece 1.7 1.4 1.4 0.3 0.4 0.3
Total 2.3 2.0 2.0 0.4 0.6 0.4
Seabream
(gilthead)
Greece 9.5 13.1 14.1 2.4 2.9 3.1
Turkey 0.8 1.5 1.9 0.4 0.4 0.4
Total 12.8 16.8 18.3 3.1 3.6 4.0
Seabass
Greece 9.5 12.6 9.8 2.7 2.1 2.0
Turkey 4.6 4.4 3.6 1.3 0.6 1.1
Total 16.8 20.3 16.4 4.7 3.6 4.0
Gr.Total 31.9 39.1 36.7 8.2 7.8 8.4
Source: ISTAT
Spain
Total Spanish imports fell drastically in the fi rst quar-
ter as a refl ection of the country’s severe economic prob-
lems. Bream imports held up well almost unchanged from
2008 whereas bass import volumes dropped by 65%.
Imports
Seabream and Seabass: Spain
(value)
............Jan-Dec............ ............Jan-Mar............
2006 2007 2008 2007 2008 2009
(million Euro)
Seabream
(all species)
France 1.2 2.2 1.0 0.4 0.7 0.6
Greece 21.4 23.2 25.5 4.1 7.2 7.4
Morocco 3.1 2.0 3.4 0.6 0.4 0.4
Total 29.1 34.4 33 6.0 10.1 9.4
Seabass
France 5.6 5.7 6.1 1.3 1.5 0.1
Greece 15.1 17.6 22.8 5.0 5.1 3.1
Morocco 1.5 1.3 2.0 0.4 0.2 0.2
Turkey 13.9 15.0 7.7 4.3 2.9 3.1
Total 38.3 42.5 43.3 12.7 10.6 8.1
Gr. Total 67.4 76.9 76.3 18.7 20.7 17.5
Source: Spanish national statistics
Imports
Seabream and Seabass: Spain
(quantity)
............Jan-Dec............ ............Jan-Mar............
2006 2007 2008 2007 2008 2009
( 1000 tonnes)
Seabream
(all species)
France 0.1 1.1 0.3 0.1 0.1 0.1
Greece 5.1 5.6 6.7 1.0 2.1 2.3
Morocco 0.7 0.5 0.4 0.2 0.1 0.1
Total 6.4 8.6 9.5 1.4 2.9 2.8
Seabass
France 0.5 0.5 0.6 0.1 0.2 0.2
Greece 3.7 4.0 3.7 1.4 1.2 0.7
Morocco 0.2 0.1 0.0 0.1 0.0 0.0
Turkey 3.5 3.6 2.3 1.2 0.7 0.8
Total 8.2 8.7 6.9 4.3 5.1 1.8
Gr. Total 16.7 17.3 16.4 5.7 8.0 4.6
Source: Spanish national statistics
France: imports up in fi rst quarter
The French market is still relatively robust with im-
port volumes growing from 2008. In fact both volumes
(+24%) and values (+7%) were up, with Greece and Spain
as the largest suppliers.
Imports
Seabream and Seabass: France
(value)
............Jan-Dec............ ............Jan-Mar............
2006 2007 2008 2007 2008 2009
(million Euro)
Seabream
(dentex/pagellus)
Greece 2.8 2.9 2.5 0.8 0.5 0.6
Total 7.5 5.6 4.8 1.7 1.0 1.1
Seabream
(gilthead)
Greece 11.4 13.6 15.8 2.4 3.3 4.0
Spain 4 5.9 5.4 1.3 1.2 1.1
Total 16.5 20.2 22.4 3.8 4.7 5.3
Seabass
Greece 11.2 12.6 14.4 2.6 2.9 2.6
UK 1.6 1.3 0.8 0.2 0.1 0.2
Total 17.4 19.7 22.9 3.5 4.5 4.5
Gr. Total 41.4 45.5 50.1 9.0 10.2 10.9
Source: French national statistics

29Globefi sh Highlights July 2009
SEABASS, SEABREAM AND MEAGRE
Prices
Seabass and Seabream: CIF Italy
Source: EPR; GLOBEFISH AN 10512, 10514
fresh whole 300-450 gr/pc, origin Greece
UK market continues to grow
The positive development in the UK market for bass
and bream over the least few years, has been one of the
best examples of market expansion for the two species.
And despite the tough times in the UK economy this year
has seen a further increase in imports.
Production
Seabass (Dicentrarchus labrax): World
2005 2006 2007 2008 2009*
(1000 tonnes)
Greece 36.0 40.0 43.0 48.0 42.0
Turkey 21.1 30.0 33.0 35.0 32.0
Italy 8.6 9.1 10.0 9.0 9.0
France 4.3 5.6 5.0 4.0 4.0
Spain 5.5 8.9 11.0 11.0 10.0
Egypt 5.3 2.1 3.0 2.0 2.0
Croatia 1.9 1.6 2.0 2.0 2.0
Portugal 1.5 1.4 2.0 2.0 2.0
Tunisia 0.6 0.5 1.0 1.0 1.0
Others 0.7 0.6 1.0 1.0 1.0
Total 85.5 99.8 111.0 115.0 105.0
Source: GLOBEFISH (*) Estimates
Production
Seabream (Sparus aurata): World
2005 2006 2007 2008 2009*
(1000 tonnes)
Greece 44.0 60.0 72.0 90.0 88.0
Turkey 17.5 22.5 28.0 32.0 31.0
Spain 15.6 20.2 23.0 25.0 25.0
Italy 8.5 8.9 9.0 9.0 9.0
Egypt 5.7 3.0 3.0 3.0 3.0
Israel 3.4 2.8 3.0 3.0 3.0
Portugal 2.5 1.6 2.0 2.0 2.0
Croatia 1.1 1.0 1.0 1.0 1.0
France 1.9 2.2 2.0 2.0 2.0
Others 2.6 2.8 3.0 3.0 3.0
Total 102.8 125.0 146.0 170.0 167.0
Source: GLOBEFISH (*) Estimates
Production expected to decline
Production volumes of bream in 2009 are now ex-
pected to be much less than previously forecast for the
year. There are two major reasons for this. First of all,
earlier projections were based on industry estimates of
biomass. These fi gures turned out to be overestimated.
Secondly, cash fl ow problems in many companies
will force producers to harvest early at lower average
weights. This will bring down total volumes but also sig-
nifi cantly damage company profi ts.
2.00
2.50
3.00
3.50
4.00
4.50
5.00
5.50
6.00
Jun-02 Jun-03 Jun-04 Jun-05 Jun-06 Jun-07 Jun-08 Jun-09
€/kg
Seabass
Seabream
Imports
Seabream: UK
............Jan-Mar............
2008 2009
(tonnes)
Greece 237 191
Netherlands 25 151
France 57 117
Italy 49 68
Morocco 56 0
Ireland 3 3
Denmark 6 0
Others 16 29
Total 447 559
Imports
Seabass: UK
............Jan-Mar............
2008 2009
(tonnes)
Greece 705 451
Netherlands 146 377
Italy 147 240
France 269 201
Ireland 5 4
Others 1 152
Total 1271 1425
30 Globefi sh Highlights July 2009
SEABASS, SEABREAM AND MEAGRE
As a result, supplies of bream in particular seem
to be more in balance with demand for the rest of the
year. Bass production fi gures are also considered stable
although some companies may have increased their bass
volumes given the low price of bream late last year.
Overall, tight liquidity will probably have the largest
effect on production as fewer juveniles are reportedly
now in the sea than in 2008. Somewhat fi rming prices
therefore could be the result for the rest of 2009.
Trade: Value-addition next step in increasing
trade
Greece and Turkey continue to be the largest
exporters with Italy, Spain and France as the largest
importers. Italy is by far the largest market and is
supplied by domestic producers as well as by imports.
New markets have developed especially in Russia and the
UK, but also in the US.
Although seabass and seabream continue to fi nd
new favour with consumers also in northern Europe, the
relatively high price and low yields have made it diffi cult
for the species to penetrate non-Mediterranean consumer
segments or restaurant segments. In this respect, bass
has been more successful than bream as the bass is better
known in northern Europe as a fi sh from capture fi sheries,
especially in the UK, and therefore already known by
many consumers.
Most European trade in bass and bream so far is in
whole fi sh and not in value-added products. Over time
this will change as more and more companies are looking
into production of fi llets and other types of value-added
products. The obstacle to more value-added products has
been one of economics as the low yield has made the
processed product too expensive. However, relative price
compared with other farmed species is an important
factor, and with the current high prices of farmed salmon,
bass and bream become more competitive in the market.
They cost far more of course than imported species from
Asia such as tilapia or catfi sh, but these operate in the
frozen market whereas bass and bream are sold fresh to
both retail and restaurants.
Outlook: Supply and demand in balance
Demand for bass and bream is holding up in all
markets except for Spain. Of course, prices and margins
are under pressure with producers also suffering from
tight credit and lack of liquidity. Supply looks as if it will
be lower than only a few months ago as many producers
have stocked less than expected and are harvesting
earlier: a market in balance is therefore predicted for
the rest of the year.
SEABASS AND SEABREAM NEWS
GREECE: SEABASS AND SEABREAM OUTLOOK - CONSOLIDATION
GOOD FOR SECTOR
Industry consolidation and reduced production will see the top
seabass and seabream producers have a good 2009, industry
executives say. According to executives at Greece-based companies
Nireus and Dias, the world’s largest and third-largest producers,
the industry has come out of the worst over 2008 and early 2009,
and should continue to rebound over the rest of this year. “Reports
show that in 2008 market size grew by 11% compared to 2007.
While in the fi rst quarter of 2009 we saw a decrease of about
6%,” Stefanos Manellis,vice president of Dias, told IntraFish.
While the overall market size declined, Dias increased sales in
the fi rst quarter of this year by 20.2% compared to 2008. The
rock bottom price for bream seen last year, caused by massive
overproduction and supply, is rebounding in 2009. Although prices
were relatively low during the fi rst quarter of 2009, they have
since risen dramatically.The price for seabass is “holding” at a
“satisfactorily level while increased demand is observed as bream
bass prices reach equal levels,” said Manellis. Source: INTRAFISH
GREECE: DIAS PROFITS HIT BY SEABREAM DROP OFF
Industry consolidation and reduced production saw the top Greek
farmer Dias Group post a large jump in fi rst quarter 2009 sales
but profi t shrink due to falling seabream prices. The bass and
bream farmer reported revenue of EUR 24.3 million (USD 34.4
million), up 20% on 2008. EDITDA felt slightly to EUR 3.9 million
(USD 5.5 million), down from EUR 4.7 million (USD 6.6 million)
in the same period last year, due mainly to the low price of
bream in this period. Pre-tax proft registered at EUR 1.8 million
(USD 2.5 million), a reduction of 42% from the earnings in fi rst
quarter 2008. The company said it had managed to maintain cash
fl ow and increase revenue despite falling prices and the global
economy, and pay off some of its bank debt. The group went on
to say it was confi dent for the year ahead. Source: INTRAFISH
GREECE: NIREUS GROUP’S 1Q 2009 SALES UP, EARNINGS DOWN
Nireus Group on 29 May 2009 reported an operating EBIT (earning
before interest and taxes) of EUR 886 000 (USD 1.26 million) in the
fi rst quarter of 2009, down from EUR 3.1 million (USD 4.4 million)
during the same period in 2008. However, the Greek fi sh-feed and
farmed-fi sh producer posted sales of EUR 40.3 million (USD 57.2
million) in the fi rst quarter of this year, up from EUR 39.4 million
(USD 56 million) last year. The 13% increase in sales volume was
not refl ected in sales value due to low sea bream prices in the
fi rst quarter of this year. Founded on the Greek island of Chios
in 1988, Nireus is the Mediterranean Sea’s largest fi sh farmer and
the world’s largest seabream and seabass producer, exporting its
products to more than 35 countries worldwide. The vertically
integrated company operates 64 fi sh farms, six hatcheries, two
processing facilities, 16 packaging and distribution facilities and
two fi sh-feed manufacturing plants. Source: SEAFOODSOURCE
CHILE: CORVINA - THE NEWEST AQUACULTURE STAR
Experts from the Chile Foundation have been working on a corvina
(Cilus gilberti) juveniles fattening-in-raft-pens project since
2007 in Region IV, Coquimbo. The initiative falls under a wider
Innova-Corfo project that aims to stimulate the diversifi cation
of domestic aquaculture activity and the commercial farming of
highly valued marine species in Coquimbo region and the greater
northern zone. For two years now, scientists participating in the
project have been aiming to obtain corvina juveniles weighing 40
g and to defi ne the production parameters for the pre-fattening
stage. According to the experts at Chile Foundation, corvina is
a species that “comes across as a great alternative” for Chilean
aquaculture. It has a wide distribution off Chilean coasts, its
meat is highly valued and it adapts easily to farm conditions. The
Chilean corvina is similar to the European meagre (Argyrosomus
regius), an in-demand species in Spain. Source: AQUA
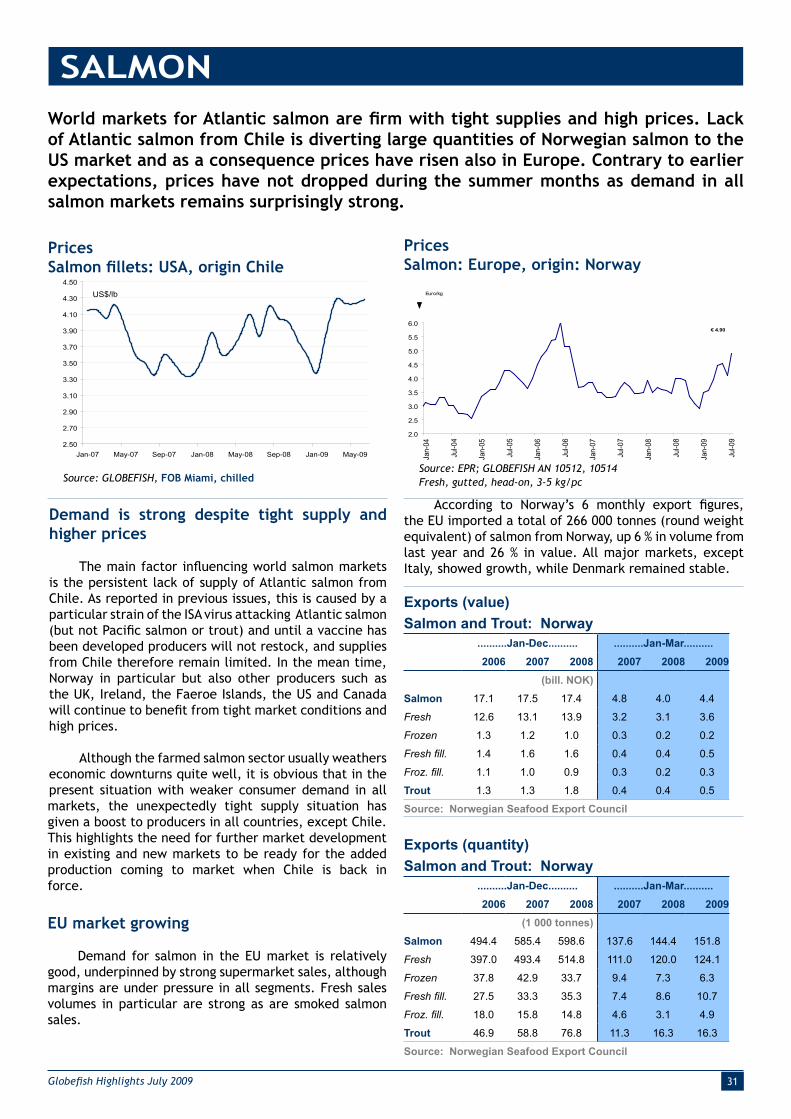
31Globefi sh Highlights July 2009
World markets for Atlantic salmon are fi rm with tight supplies and high prices. Lack
of Atlantic salmon from Chile is diverting large quantities of Norwegian salmon to the
US market and as a consequence prices have risen also in Europe. Contrary to earlier
expectations, prices have not dropped during the summer months as demand in all
salmon markets remains surprisingly strong.
SALMON
Source: GLOBEFISH, FOB Miami, chilled
Prices
Salmon fi llets: USA, origin Chile
Demand is strong despite tight supply and
higher prices
The main factor infl uencing world salmon markets
is the persistent lack of supply of Atlantic salmon from
Chile. As reported in previous issues, this is caused by a
particular strain of the ISA virus attacking Atlantic salmon
(but not Pacifi c salmon or trout) and until a vaccine has
been developed producers will not restock, and supplies
from Chile therefore remain limited. In the mean time,
Norway in particular but also other producers such as
the UK, Ireland, the Faeroe Islands, the US and Canada
will continue to benefi t from tight market conditions and
high prices.
Although the farmed salmon sector usually weathers
economic downturns quite well, it is obvious that in the
present situation with weaker consumer demand in all
markets, the unexpectedly tight supply situation has
given a boost to producers in all countries, except Chile.
This highlights the need for further market development
in existing and new markets to be ready for the added
production coming to market when Chile is back in
force.
EU market growing
Demand for salmon in the EU market is relatively
good, underpinned by strong supermarket sales, although
margins are under pressure in all segments. Fresh sales
volumes in particular are strong as are smoked salmon
sales.
According to Norway’s 6 monthly export fi gures,
the EU imported a total of 266 000 tonnes (round weight
equivalent) of salmon from Norway, up 6 % in volume from
last year and 26 % in value. All major markets, except
Italy, showed growth, while Denmark remained stable.
Exports (value)
Salmon and Trout: Norway
..........Jan-Dec.......... ..........Jan-Mar..........
2006 2007 2008 2007 2008 2009
(bill. NOK)
Salmon 17.1 17.5 17.4 4.8 4.0 4.4
Fresh 12.6 13.1 13.9 3.2 3.1 3.6
Frozen 1.3 1.2 1.0 0.3 0.2 0.2
Fresh fi ll. 1.4 1.6 1.6 0.4 0.4 0.5
Froz. fi ll. 1.1 1.0 0.9 0.3 0.2 0.3
Trout 1.3 1.3 1.8 0.4 0.4 0.5
Source: Norwegian Seafood Export Council
Exports (quantity)
Salmon and Trout: Norway
..........Jan-Dec.......... ..........Jan-Mar..........
2006 2007 2008 2007 2008 2009
(1 000 tonnes)
Salmon 494.4 585.4 598.6 137.6 144.4 151.8
Fresh 397.0 493.4 514.8 111.0 120.0 124.1
Frozen 37.8 42.9 33.7 9.4 7.3 6.3
Fresh fi ll. 27.5 33.3 35.3 7.4 8.6 10.7
Froz. fi ll. 18.0 15.8 14.8 4.6 3.1 4.9
Trout 46.9 58.8 76.8 11.3 16.3 16.3
Source: Norwegian Seafood Export Council
Prices
Salmon: Europe, origin: Norway
Source: EPR; GLOBEFISH AN 10512, 10514
Fresh, gutted, head-on, 3-5 kg/pc
2.0
2.5
3.0
3.5
4.0
4.5
5.0
5.5
6.0
Jan
-04
Jul-0
4
Jan
-05
Jul-0
5
Jan
-06
Jul-0
6
Jan
-07
Jul-0
7
Jan
-08
Jul-0
8
Jan
-09
Jul-0
9
Euro/kg
€ 4.90
2.50
2.70
2.90
3.10
3.30
3.50
3.70
3.90
4.10
4.30
4.50
Jan-07 May-07 Sep-07 Jan-08 May-08 Sep-08 Jan-09 May-09
US$/lb
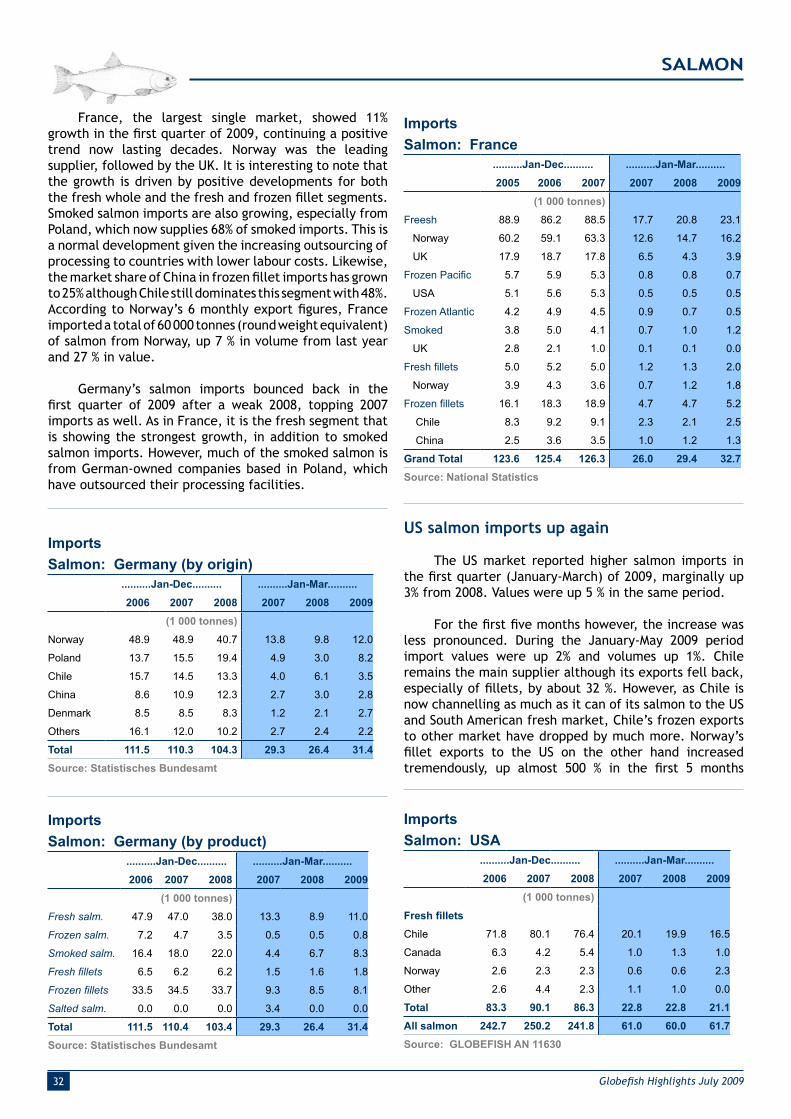
32 Globefi sh Highlights July 2009
France, the largest single market, showed 11%
growth in the fi rst quarter of 2009, continuing a positive
trend now lasting decades. Norway was the leading
supplier, followed by the UK. It is interesting to note that
the growth is driven by positive developments for both
the fresh whole and the fresh and frozen fi llet segments.
Smoked salmon imports are also growing, especially from
Poland, which now supplies 68% of smoked imports. This is
a normal development given the increasing outsourcing of
processing to countries with lower labour costs. Likewise,
the market share of China in frozen fi llet imports has grown
to 25% although Chile still dominates this segment with 48%.
According to Norway’s 6 monthly export fi gures, France
imported a total of 60 000 tonnes (round weight equivalent)
of salmon from Norway, up 7 % in volume from last year
and 27 % in value.
Germany’s salmon imports bounced back in the
fi rst quarter of 2009 after a weak 2008, topping 2007
imports as well. As in France, it is the fresh segment that
is showing the strongest growth, in addition to smoked
salmon imports. However, much of the smoked salmon is
from German-owned companies based in Poland, which
have outsourced their processing facilities.
Imports
Salmon: France
..........Jan-Dec.......... ..........Jan-Mar..........
2005 2006 2007 2007 2008 2009
(1 000 tonnes)
Freesh 88.9 86.2 88.5 17.7 20.8 23.1
Norway 60.2 59.1 63.3 12.6 14.7 16.2
UK 17.9 18.7 17.8 6.5 4.3 3.9
Frozen Pacifi c 5.7 5.9 5.3 0.8 0.8 0.7
USA 5.1 5.6 5.3 0.5 0.5 0.5
Frozen Atlantic 4.2 4.9 4.5 0.9 0.7 0.5
Smoked 3.8 5.0 4.1 0.7 1.0 1.2
UK 2.8 2.1 1.0 0.1 0.1 0.0
Fresh fi llets 5.0 5.2 5.0 1.2 1.3 2.0
Norway 3.9 4.3 3.6 0.7 1.2 1.8
Frozen fi llets 16.1 18.3 18.9 4.7 4.7 5.2
Chile 8.3 9.2 9.1 2.3 2.1 2.5
China 2.5 3.6 3.5 1.0 1.2 1.3
Grand Total 123.6 125.4 126.3 26.0 29.4 32.7
Source: National Statistics
Imports
Salmon: Germany (by origin)
..........Jan-Dec.......... ..........Jan-Mar..........
2006 2007 2008 2007 2008 2009
(1 000 tonnes)
Norway 48.9 48.9 40.7 13.8 9.8 12.0
Poland 13.7 15.5 19.4 4.9 3.0 8.2
Chile 15.7 14.5 13.3 4.0 6.1 3.5
China 8.6 10.9 12.3 2.7 3.0 2.8
Denmark 8.5 8.5 8.3 1.2 2.1 2.7
Others 16.1 12.0 10.2 2.7 2.4 2.2
Total 111.5 110.3 104.3 29.3 26.4 31.4
Source: Statistisches Bundesamt
Imports
Salmon: Germany (by product)
..........Jan-Dec.......... ..........Jan-Mar..........
2006 2007 2008 2007 2008 2009
(1 000 tonnes)
Fresh salm. 47.9 47.0 38.0 13.3 8.9 11.0
Frozen salm. 7.2 4.7 3.5 0.5 0.5 0.8
Smoked salm. 16.4 18.0 22.0 4.4 6.7 8.3
Fresh fi llets 6.5 6.2 6.2 1.5 1.6 1.8
Frozen fi llets 33.5 34.5 33.7 9.3 8.5 8.1
Salted salm. 0.0 0.0 0.0 3.4 0.0 0.0
Total 111.5 110.4 103.4 29.3 26.4 31.4
Source: Statistisches Bundesamt
US salmon imports up again
The US market reported higher salmon imports in
the fi rst quarter (January-March) of 2009, marginally up
3% from 2008. Values were up 5 % in the same period.
For the fi rst fi ve months however, the increase was
less pronounced. During the January-May 2009 period
import values were up 2% and volumes up 1%. Chile
remains the main supplier although its exports fell back,
especially of fi llets, by about 32 %. However, as Chile is
now channelling as much as it can of its salmon to the US
and South American fresh market, Chile’s frozen exports
to other market have dropped by much more. Norway’s
fi llet exports to the US on the other hand increased
tremendously, up almost 500 % in the fi rst 5 months
Imports
Salmon: USA
..........Jan-Dec.......... ..........Jan-Mar..........
2006 2007 2008 2007 2008 2009
(1 000 tonnes)
Fresh fi llets
Chile 71.8 80.1 76.4 20.1 19.9 16.5
Canada 6.3 4.2 5.4 1.0 1.3 1.0
Norway 2.6 2.3 2.3 0.6 0.6 2.3
Other 2.6 4.4 2.3 1.1 1.0 0.0
Total 83.3 90.1 86.3 22.8 22.8 21.1
All salmon 242.7 250.2 241.8 61.0 60.0 61.7
Source: GLOBEFISH AN 11630
SALMON
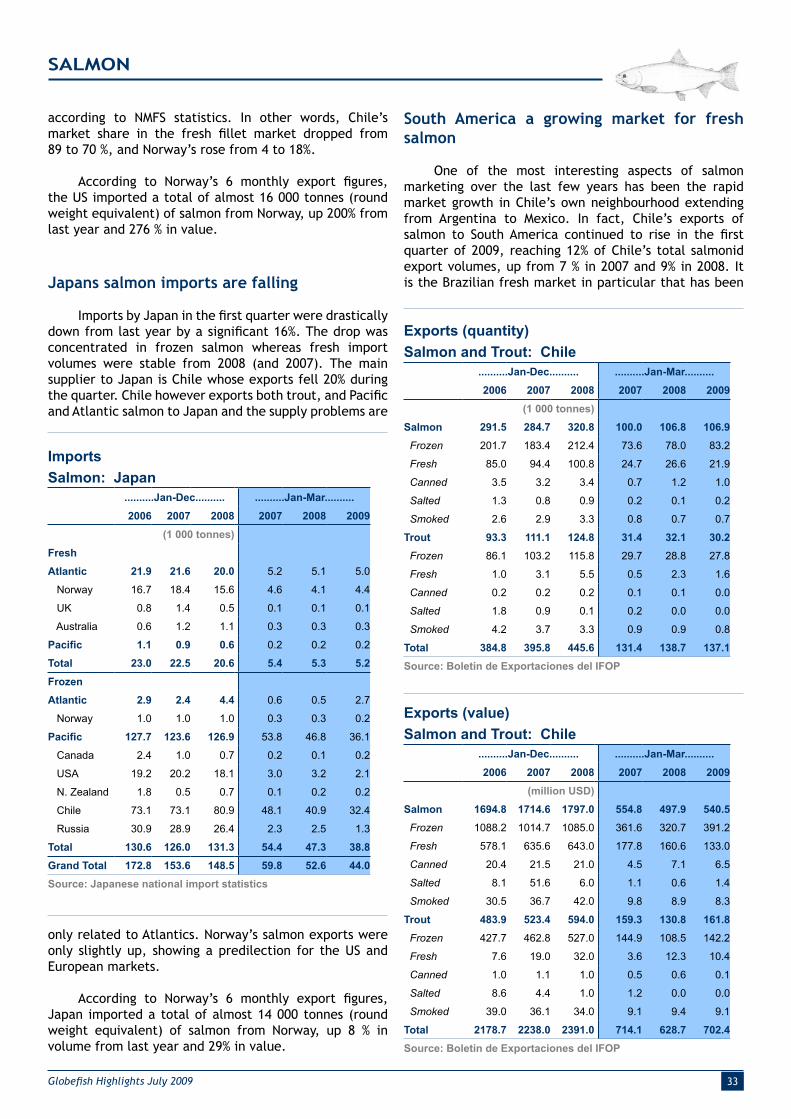
33Globefi sh Highlights July 2009
SALMON
Exports (quantity)
Salmon and Trout: Chile
..........Jan-Dec.......... ..........Jan-Mar..........
2006 2007 2008 2007 2008 2009
(1 000 tonnes)
Salmon 291.5 284.7 320.8 100.0 106.8 106.9
Frozen 201.7 183.4 212.4 73.6 78.0 83.2
Fresh 85.0 94.4 100.8 24.7 26.6 21.9
Canned 3.5 3.2 3.4 0.7 1.2 1.0
Salted 1.3 0.8 0.9 0.2 0.1 0.2
Smoked 2.6 2.9 3.3 0.8 0.7 0.7
Trout 93.3 111.1 124.8 31.4 32.1 30.2
Frozen 86.1 103.2 115.8 29.7 28.8 27.8
Fresh 1.0 3.1 5.5 0.5 2.3 1.6
Canned 0.2 0.2 0.2 0.1 0.1 0.0
Salted 1.8 0.9 0.1 0.2 0.0 0.0
Smoked 4.2 3.7 3.3 0.9 0.9 0.8
Total 384.8 395.8 445.6 131.4 138.7 137.1
Source: Boletín de Exportaciones del IFOP
according to NMFS statistics. In other words, Chile’s
market share in the fresh fi llet market dropped from
89 to 70 %, and Norway’s rose from 4 to 18%.
According to Norway’s 6 monthly export fi gures,
the US imported a total of almost 16 000 tonnes (round
weight equivalent) of salmon from Norway, up 200% from
last year and 276 % in value.
Japans salmon imports are falling
Imports by Japan in the fi rst quarter were drastically
down from last year by a signifi cant 16%. The drop was
concentrated in frozen salmon whereas fresh import
volumes were stable from 2008 (and 2007). The main
supplier to Japan is Chile whose exports fell 20% during
the quarter. Chile however exports both trout, and Pacifi c
and Atlantic salmon to Japan and the supply problems are
Imports
Salmon: Japan
..........Jan-Dec.......... ..........Jan-Mar..........
2006 2007 2008 2007 2008 2009
(1 000 tonnes)
Fresh
Atlantic 21.9 21.6 20.0 5.2 5.1 5.0
Norway 16.7 18.4 15.6 4.6 4.1 4.4
UK 0.8 1.4 0.5 0.1 0.1 0.1
Australia 0.6 1.2 1.1 0.3 0.3 0.3
Pacifi c 1.1 0.9 0.6 0.2 0.2 0.2
Total 23.0 22.5 20.6 5.4 5.3 5.2
Frozen
Atlantic 2.9 2.4 4.4 0.6 0.5 2.7
Norway 1.0 1.0 1.0 0.3 0.3 0.2
Pacifi c 127.7 123.6 126.9 53.8 46.8 36.1
Canada 2.4 1.0 0.7 0.2 0.1 0.2
USA 19.2 20.2 18.1 3.0 3.2 2.1
N. Zealand 1.8 0.5 0.7 0.1 0.2 0.2
Chile 73.1 73.1 80.9 48.1 40.9 32.4
Russia 30.9 28.9 26.4 2.3 2.5 1.3
Total 130.6 126.0 131.3 54.4 47.3 38.8
Grand Total 172.8 153.6 148.5 59.8 52.6 44.0
Source: Japanese national import statistics
only related to Atlantics. Norway’s salmon exports were
only slightly up, showing a predilection for the US and
European markets.
According to Norway’s 6 monthly export fi gures,
Japan imported a total of almost 14 000 tonnes (round
weight equivalent) of salmon from Norway, up 8 % in
volume from last year and 29% in value.
South America a growing market for fresh
salmon
One of the most interesting aspects of salmon
marketing over the last few years has been the rapid
market growth in Chile’s own neighbourhood extending
from Argentina to Mexico. In fact, Chile’s exports of
salmon to South America continued to rise in the fi rst
quarter of 2009, reaching 12% of Chile’s total salmonid
export volumes, up from 7 % in 2007 and 9% in 2008. It
is the Brazilian fresh market in particular that has been
Exports (value)
Salmon and Trout: Chile
..........Jan-Dec.......... ..........Jan-Mar..........
2006 2007 2008 2007 2008 2009
(million USD)
Salmon 1694.8 1714.6 1797.0 554.8 497.9 540.5
Frozen 1088.2 1014.7 1085.0 361.6 320.7 391.2
Fresh 578.1 635.6 643.0 177.8 160.6 133.0
Canned 20.4 21.5 21.0 4.5 7.1 6.5
Salted 8.1 51.6 6.0 1.1 0.6 1.4
Smoked 30.5 36.7 42.0 9.8 8.9 8.3
Trout 483.9 523.4 594.0 159.3 130.8 161.8
Frozen 427.7 462.8 527.0 144.9 108.5 142.2
Fresh 7.6 19.0 32.0 3.6 12.3 10.4
Canned 1.0 1.1 1.0 0.5 0.6 0.1
Salted 8.6 4.4 1.0 1.2 0.0 0.0
Smoked 39.0 36.1 34.0 9.1 9.4 9.1
Total 2178.7 2238.0 2391.0 714.1 628.7 702.4
Source: Boletín de Exportaciones del IFOP
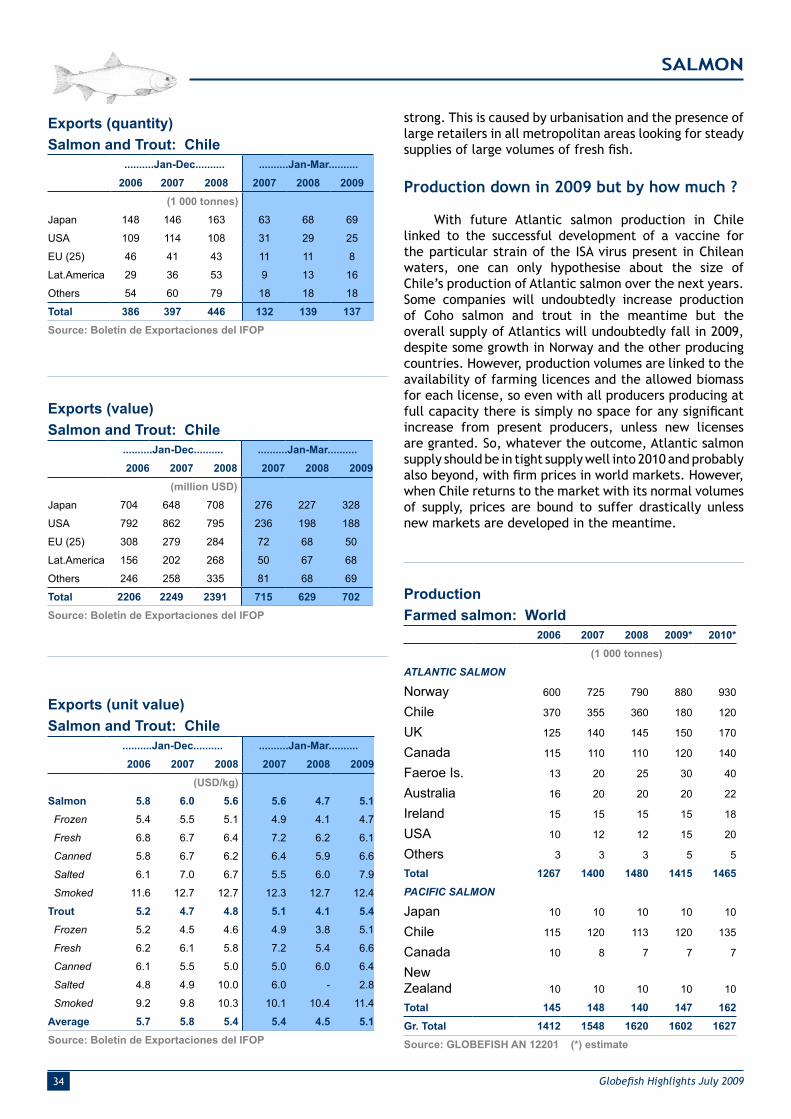
34 Globefi sh Highlights July 2009
Exports (quantity)
Salmon and Trout: Chile
..........Jan-Dec.......... ..........Jan-Mar..........
2006 2007 2008 2007 2008 2009
(1 000 tonnes)
Japan 148 146 163 63 68 69
USA 109 114 108 31 29 25
EU (25) 46 41 43 11 11 8
Lat.America 29 36 53 9 13 16
Others 54 60 79 18 18 18
Total 386 397 446 132 139 137
Source: Boletín de Exportaciones del IFOP
Exports (value)
Salmon and Trout: Chile
..........Jan-Dec.......... ..........Jan-Mar..........
2006 2007 2008 2007 2008 2009
(million USD)
Japan 704 648 708 276 227 328
USA 792 862 795 236 198 188
EU (25) 308 279 284 72 68 50
Lat.America 156 202 268 50 67 68
Others 246 258 335 81 68 69
Total 2206 2249 2391 715 629 702
Source: Boletín de Exportaciones del IFOP
Exports (unit value)
Salmon and Trout: Chile
..........Jan-Dec.......... ..........Jan-Mar..........
2006 2007 2008 2007 2008 2009
(USD/kg)
Salmon 5.8 6.0 5.6 5.6 4.7 5.1
Frozen 5.4 5.5 5.1 4.9 4.1 4.7
Fresh 6.8 6.7 6.4 7.2 6.2 6.1
Canned 5.8 6.7 6.2 6.4 5.9 6.6
Salted 6.1 7.0 6.7 5.5 6.0 7.9
Smoked 11.6 12.7 12.7 12.3 12.7 12.4
Trout 5.2 4.7 4.8 5.1 4.1 5.4
Frozen 5.2 4.5 4.6 4.9 3.8 5.1
Fresh 6.2 6.1 5.8 7.2 5.4 6.6
Canned 6.1 5.5 5.0 5.0 6.0 6.4
Salted 4.8 4.9 10.0 6.0 - 2.8
Smoked 9.2 9.8 10.3 10.1 10.4 11.4
Average 5.7 5.8 5.4 5.4 4.5 5.1
Source: Boletín de Exportaciones del IFOP
strong. This is caused by urbanisation and the presence of
large retailers in all metropolitan areas looking for steady
supplies of large volumes of fresh fi sh.
Production down in 2009 but by how much ?
With future Atlantic salmon production in Chile
linked to the successful development of a vaccine for
the particular strain of the ISA virus present in Chilean
waters, one can only hypothesise about the size of
Chile’s production of Atlantic salmon over the next years.
Some companies will undoubtedly increase production
of Coho salmon and trout in the meantime but the
overall supply of Atlantics will undoubtedly fall in 2009,
despite some growth in Norway and the other producing
countries. However, production volumes are linked to the
availability of farming licences and the allowed biomass
for each license, so even with all producers producing at
full capacity there is simply no space for any signifi cant
increase from present producers, unless new licenses
are granted. So, whatever the outcome, Atlantic salmon
supply should be in tight supply well into 2010 and probably
also beyond, with fi rm prices in world markets. However,
when Chile returns to the market with its normal volumes
of supply, prices are bound to suffer drastically unless
new markets are developed in the meantime.
Production
Farmed salmon: World
2006 2007 2008 2009* 2010*
(1 000 tonnes)
ATLANTIC SALMON
Norway 600 725 790 880 930
Chile 370 355 360 180 120
UK 125 140 145 150 170
Canada 115 110 110 120 140
Faeroe Is. 13 20 25 30 40
Australia 16 20 20 20 22
Ireland 15 15 15 15 18
USA 10 12 12 15 20
Others 3 3 3 5 5
Total 1267 1400 1480 1415 1465
PACIFIC SALMON
Japan 10 10 10 10 10
Chile 115 120 113 120 135
Canada 10 8 7 7 7
New Zealand 10 10 10 10 10
Total 145 148 140 147 162
Gr. Total 1412 1548 1620 1602 1627
Source: GLOBEFISH AN 12201 (*) estimate
SALMON

35Globefi sh Highlights July 2009
There is growing resistance, however, in the food
service sector to the rising prices. Indeed, it has been the
fairly stable prices and reliable supplies over the years
that have been behind the inroads of salmon in catering
channels in all major markets and made salmon a regular
feature in most mass market restaurants. With growing
salmon prices however, salmon is facing competition from
other species, in particular fi llets, mainly from tilapia
and catfi sh, as processors and restaurateurs are looking
for fair value fi sh products with popular appeal.
Trade – Chile’s problem, Norway’s advantage
Norwegian salmon exports for the fi rst six
months of 2009 rose 7% in volume to 367 000
tonnes (round weight equivalents) and value by a
massive 28.7 % to NOK 10.7 billion (EUR 1.2 billion).
Salmon export volumes rose in all markets (except Italy),
including surprisingly enough Spain and Japan where
consumer demand is sharply declining. In particular,
strong export growth was registered by the US with a 215
% rise in volumes and 276 % in values as the shortfall from
Chile was quickly fi lled by Norwegian exporters.
The rest of the year looks positive for Norwegian
producers. Stock market evaluations have increased
signifi cantly after the lows reached late last year, although
the largest companies continue to suffer losses on their
Chilean activities.
Chile’s salmon exports rose signifi cantly in 2008 as
harvesting was brought forward due to disease problems.
This continued in the fi rst quarter of 2009 with export
volumes equal to 2008. Values were also higher, thanks
to better prices. However, bringing harvesting forward
reduces yields as each harvested fi sh is much smaller
than planned for and there are fewer kilos available to
cover the fi xed costs. As a result, most Chilean companies
are suffering large losses with forced rescheduling of
their banking debts. And with lower volumes ready for
harvesting in 2009 and 2010, heavy job losses have taken
place in both farm management, processing and sales.
Chilean export problems therefore will remain an
issue in 2009 and 2010. Coho and trout exports will most
likely increase as producers are shifting out of Atlantics
but the overall supply from Chile will drop over the next
few years.
Outlook - Little change expected
For the rest of the year, the supply situation is
not expected to improve, rather the contrary. Chile’s
production for the last quarter will be much reduced and
Atlantic salmon prices are expected to remain high in
world markets at least until next year.
SALMON NEWS
WORLD: WWF SAYS SALMON ECO-LABEL DRAFT BY 2010
The World Wildlife Fund (WWF) says it expects to present the
fi rst draft of eco-labeling standards for farmed salmon in the
next year. The Norwegian Seafood Federation (FHL) is keeping
a close eye on the process initiated by the WWF, said spokes-
woman Ama Valland. FHL’s Kjell Maroni is representing the group
at the salmon aquaculture dialogues, whose aim is to produce
a separate WWF certifi cation of salmon WWF hopes can eventu-
ally become the industry’s offi cial quality label. “The process is
extensive and requires a lot of time and effort. But we under-
stand parts of the certifi cation statutes will be able to be pre-
sented in the course of 2010,” Valland said. Source: INTRAFISH
CANADA: TRUE NORTH SALMON EARNS ECO-LABEL
True North Salmon, a subsidiary of Cooke Aquaculture Inc, is now
offering eco-certifi ed Atlantic salmon in North America - the fi rst
company in Canada to do so. Acquiring the Seafood Trust Eco La-
bel meant the fi rm’s salmon product had to undergo third-party
audits by the International Food Quality Certifi cation in order to
ascertain that its quality is in line with the label’s strict stand-
ards. The Blacks Harbour-based company has branded the fi sh
Heritage Salmon, and expects that more of its products will earn
the eco-label soon. Eco-certifi cation was acquired after an 18-
month long audit by an independent body and the fulfi lment of
fi ve international requirements. The label informs customers that
the product was raised and processed sustainably. Source: NEW
BRUNSWICK BUSINESS JOURNAL
MARINE HARVEST SEES DROP IN GLOBAL 2009 SALMON PRODUC-
TION OF 7%, BECAUSE OF CHILE, MAJOR IMPACT ON USA
At a European investor conference in early June 2009, Henrik
Heiberg, VP Finance & Treasury for Marine Harvest, gave a presen-
tation on the company’s production outlook for the remainder of
the year, and for 2009 as a whole. In general, Norwegian salmon
production is surging 9% to 13% for 2009, from a base level of 667
000 tonnes of head on gutted product. However, this will not be
enough to make up the drastic shortfall from Chile, where from
2008 production of 359 000 tonnes, production is predicted to fall
as much as 67%, to a low of 120 000 tonnes. The primary market
impacted by this is the USA, since the US took about 60% of Chile’s
salmon exports in 2008. Source: SEAFOOD.COM
NORWAY: SALMON BIOMASS UP 11%
Norwegian fi sh farms held 11% more salmon at the end of April
2009 than at the same time last year. According to fi gures from
the Norwegian Seafood Federation (FHL), at the end of April the
average weight of fi sh was 1.5 kilos and total biomass was 419
841 tonnes. At the same time last year, the average weight in
farm cages was 1.6 kilos, while total biomass was 376 873 tonnes.
Source: INTRAFISH
NORWAY: SALMON ‘FACES GROWING COMPETITION FROM
CHICKEN’
The Norwegian salmon industry could see growing competition
from the chicken industry warns a former executive with the
world’s leading salmon company, Marine Harvest. Arne Hjeltnes,
until last year communications director of Marine Harvest and
also formerly Norway’s fi sh industry representative in South East
Asia, argues that salmon production is too low and unless it is
expanded, the price of salmon will continue to rise - leading con-
sumers to opt for cheaper chicken instead. In recent years, fi sh-
eating has gained ground as authorities have presented it as a
healthy alternative to other sources of protein. Norway’s salmon
farming potential is unlimited but the fi sh licensing system is too
restrictive, Hjeltnes told the Scandinavian online publication E24.
Source: WORLDFISH REPORT
SALMON
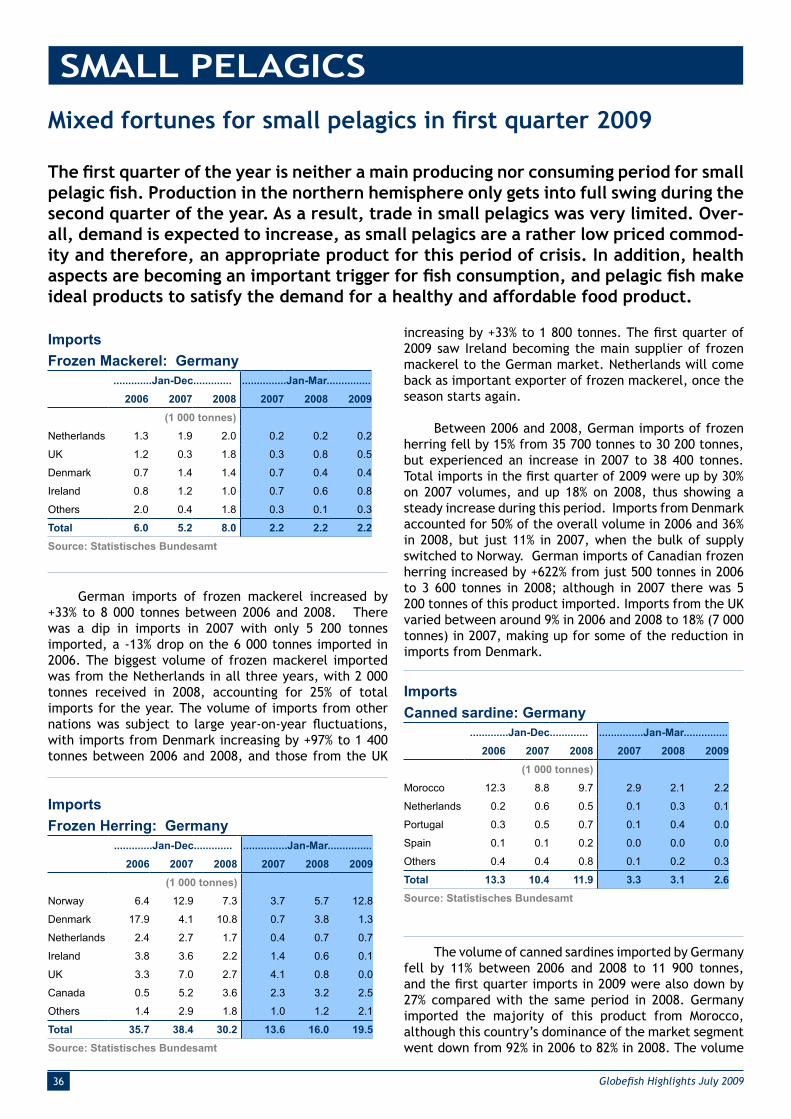
36 Globefi sh Highlights July 2009
Mixed fortunes for small pelagics in fi rst quarter 2009
The fi rst quarter of the year is neither a main producing nor consuming period for small
pelagic fi sh. Production in the northern hemisphere only gets into full swing during the
second quarter of the year. As a result, trade in small pelagics was very limited. Over-
all, demand is expected to increase, as small pelagics are a rather low priced commod-
ity and therefore, an appropriate product for this period of crisis. In addition, health
aspects are becoming an important trigger for fi sh consumption, and pelagic fi sh make
ideal products to satisfy the demand for a healthy and affordable food product.
SMALL PELAGICS
Imports
Frozen Mackerel: Germany
.............Jan-Dec............. ...............Jan-Mar...............
2006 2007 2008 2007 2008 2009
(1 000 tonnes)
Netherlands 1.3 1.9 2.0 0.2 0.2 0.2
UK 1.2 0.3 1.8 0.3 0.8 0.5
Denmark 0.7 1.4 1.4 0.7 0.4 0.4
Ireland 0.8 1.2 1.0 0.7 0.6 0.8
Others 2.0 0.4 1.8 0.3 0.1 0.3
Total 6.0 5.2 8.0 2.2 2.2 2.2
Source: Statistisches Bundesamt
German imports of frozen mackerel increased by
+33% to 8 000 tonnes between 2006 and 2008. There
was a dip in imports in 2007 with only 5 200 tonnes
imported, a -13% drop on the 6 000 tonnes imported in
2006. The biggest volume of frozen mackerel imported
was from the Netherlands in all three years, with 2 000
tonnes received in 2008, accounting for 25% of total
imports for the year. The volume of imports from other
nations was subject to large year-on-year fl uctuations,
with imports from Denmark increasing by +97% to 1 400
tonnes between 2006 and 2008, and those from the UK
Imports
Frozen Herring: Germany
.............Jan-Dec............. ...............Jan-Mar...............
2006 2007 2008 2007 2008 2009
(1 000 tonnes)
Norway 6.4 12.9 7.3 3.7 5.7 12.8
Denmark 17.9 4.1 10.8 0.7 3.8 1.3
Netherlands 2.4 2.7 1.7 0.4 0.7 0.7
Ireland 3.8 3.6 2.2 1.4 0.6 0.1
UK 3.3 7.0 2.7 4.1 0.8 0.0
Canada 0.5 5.2 3.6 2.3 3.2 2.5
Others 1.4 2.9 1.8 1.0 1.2 2.1
Total 35.7 38.4 30.2 13.6 16.0 19.5
Source: Statistisches Bundesamt
increasing by +33% to 1 800 tonnes. The fi rst quarter of
2009 saw Ireland becoming the main supplier of frozen
mackerel to the German market. Netherlands will come
back as important exporter of frozen mackerel, once the
season starts again.
Between 2006 and 2008, German imports of frozen
herring fell by 15% from 35 700 tonnes to 30 200 tonnes,
but experienced an increase in 2007 to 38 400 tonnes.
Total imports in the fi rst quarter of 2009 were up by 30%
on 2007 volumes, and up 18% on 2008, thus showing a
steady increase during this period. Imports from Denmark
accounted for 50% of the overall volume in 2006 and 36%
in 2008, but just 11% in 2007, when the bulk of supply
switched to Norway. German imports of Canadian frozen
herring increased by +622% from just 500 tonnes in 2006
to 3 600 tonnes in 2008; although in 2007 there was 5
200 tonnes of this product imported. Imports from the UK
varied between around 9% in 2006 and 2008 to 18% (7 000
tonnes) in 2007, making up for some of the reduction in
imports from Denmark.
Imports
Canned sardine: Germany
.............Jan-Dec............. ...............Jan-Mar...............
2006 2007 2008 2007 2008 2009
(1 000 tonnes)
Morocco 12.3 8.8 9.7 2.9 2.1 2.2
Netherlands 0.2 0.6 0.5 0.1 0.3 0.1
Portugal 0.3 0.5 0.7 0.1 0.4 0.0
Spain 0.1 0.1 0.2 0.0 0.0 0.0
Others 0.4 0.4 0.8 0.1 0.2 0.3
Total 13.3 10.4 11.9 3.3 3.1 2.6
Source: Statistisches Bundesamt
The volume of canned sardines imported by Germany
fell by 11% between 2006 and 2008 to 11 900 tonnes,
and the fi rst quarter imports in 2009 were also down by
27% compared with the same period in 2008. Germany
imported the majority of this product from Morocco,
although this country’s dominance of the market segment
went down from 92% in 2006 to 82% in 2008. The volume

37Globefi sh Highlights July 2009
SMALL PELAGICS
imported from other nations was fairly small, although
imports from Portugal grew by 120% to 700 tonnes over
the period, accounting for 6% of the volume in 2008.
Exports
Frozen Mackerel: Norway
...............Jan-Dec............... ...............Jan-Mar...............
2006 2007 2008 2007 2008 2009
(1 000 tonnes)
Japan 45.0 119.7 118.1 3.5 5.0 4.8
China 25.4 60.2 66.3 7.2 6.6 4.1
Russ. Fed. 20.1 35.0 33.0 2.2 1.0 6.5
Turkey 8.0 26.0 20.8 2.6 4.0 4.9
Ukraine 10.6 39.2 20.6 5.2 1.9 3.5
Poland 4.8 4.3 12.2 0.2 1.0 2.5
Korea Rep. 4.7 14.8 6.2 1.4 0.1 3.4
Others 22.0 40.0 57.3 3.9 5.7 8.7
Total 140.6 339.2 334.5 26.2 25.3 38.4
Source: Norwegian Seafood Export Council
Norwegian exports of frozen mackerel increased
by 138% from 140 600 tonnes in 2006 to 334 500 tonnes
in 2008. The highest overall volume exported during
the period was 339 200 tonnes in 2007. Total exports in
the fi rst quarter of 2009 were up 32% compared with the
same period in 2008 and 2007. The largest market for
Norwegian frozen mackerel was Japan, which accounted
for 38% of the growth in this market over the period.
The volume exported to Japan increased by 162%
from 45 000 tonnes in 2006 to 118 100 tonnes in 2008.
Norwegian exports of this product to China grew by 161%
to 66 300 tonnes in 2008, which increased its share of the
market from 18% in 2006 and 2007 to 20% in 2008.
Exports
Frozen Whole Herring: Norway
.............Jan-Dec............. ...............Jan-Mar...............
2006 2007 2008 2007 2008 2009
(1 000 tonnes)
Russ. Fed. 150.6 207.5 163.4 69.7 57.0 60.1
Nigeria 3.1 20.1 138.5 14.2 70.1 55.5
Ukraine 88.2 89.2 79.4 29.9 39.1 41.7
Lithuania 9.5 11.3 15.3 4.3 6.4 9.8
Netherlands 12.9 15.7 13.0 2.5 2.7 3.2
Belarus 7.7 10.2 7.9 4.7 3.3 3.3
Poland 4.8 3.2 3.8 1.0 0.9 2.1
USA 1.4 0.6 0.3 0.0 0.0 0.3
Others 44.6 42.5 69.9 15.6 24.5 22.7
Total 322.8 400.3 491.5 141.9 204.0 198.7
Source: Norwegian Seafood Export Council
Exports of Norwegian frozen whole herring increased
in volume by 52% from 322 800 tonnes in 2006 to 491 500
in 2008, averaging a 23% year-on-year growth. The fi rst
quarter of 2009 also showed excellent growth compared
with 2007, but a slight drop on 2008, down from 204 000
tonnes to 198 700 tonnes. The Russian Federation was
the biggest export market for Norwegian exports of this
product. This market grew by 8% over the period to 163
400 tonnes in 2008;,however in 2007 it received 207 500
tonnes, which accounted for 52% of the 2007 exports.
Exports to Nigeria grew signifi cantly from just 3 100
tonnes in 2006 to 138 500 tonnes in 2008. The Ukraine
was a relatively stable market during the period, ranging
from 89 200 in 2007 to 79 400 in 2008. This meant that
the share of total exports going to the Ukraine fell from
27% in 2006 to 16% in 2008.
Imports
Fresh and Frozen Herring: Japan
..............Jan-Dec............... ...............Jan-Mar...............
2006 2007 2008 2007 2008 2009
(1 000 tonnes)
USA 27.6 16.1 21.4 0.0 0.2 0.1
Russia 9.0 5.9 8.1 2.3 4.1 2.7
Norway 4.5 3.9 4.3 2.8 2.6 2.0
Netherlands 1.3 0.8 0.7 0.1 0.2 0.6
Korea Rep 0.0 0.0 0.4 0.0 0.0 0.4
Canada 0.2 0.4 0.0 0.0 0.0 0.0
Ireland 0.0 0.0 0.0 0.0 0.0 0.0
Iceland 0.0 0.1 0.0 0.0 0.0 0.0
Others 0.2 0.4 0.1 0.2 0.0 0.0
Total 42.8 27.6 35.0 5.4 7.1 5.8
Source: National Statistics
Imports of fresh and frozen herring into Japan fell
by 18% from 42 800 tonnes in 2006 to 35 000 tonnes in
2008, although the volume dropped to just 27 600 tonnes
in 2007. Japan imported most of these products from the
USA, which averaged 61% of the supply across the period,
with the next largest supplier being Russia, with 22% of
the volume, followed by Norway averaging 12% of supply.
The 22% reduction in imports from the USA to 21 400
tonnes in 2008 accounted for 79% of the overall reduction
in Japanese imports of these herring products.
The UK imported 14 100 tonnes of canned sardines
in 2008, 4% less than in 2006 and 24% less than in 2007.
Imports from Morocco accounted for 55% of the 2006 UK
imports of this product, but the volume from this supply
fell -32% to 5 400 tonnes in 2008, accounting for just 38%
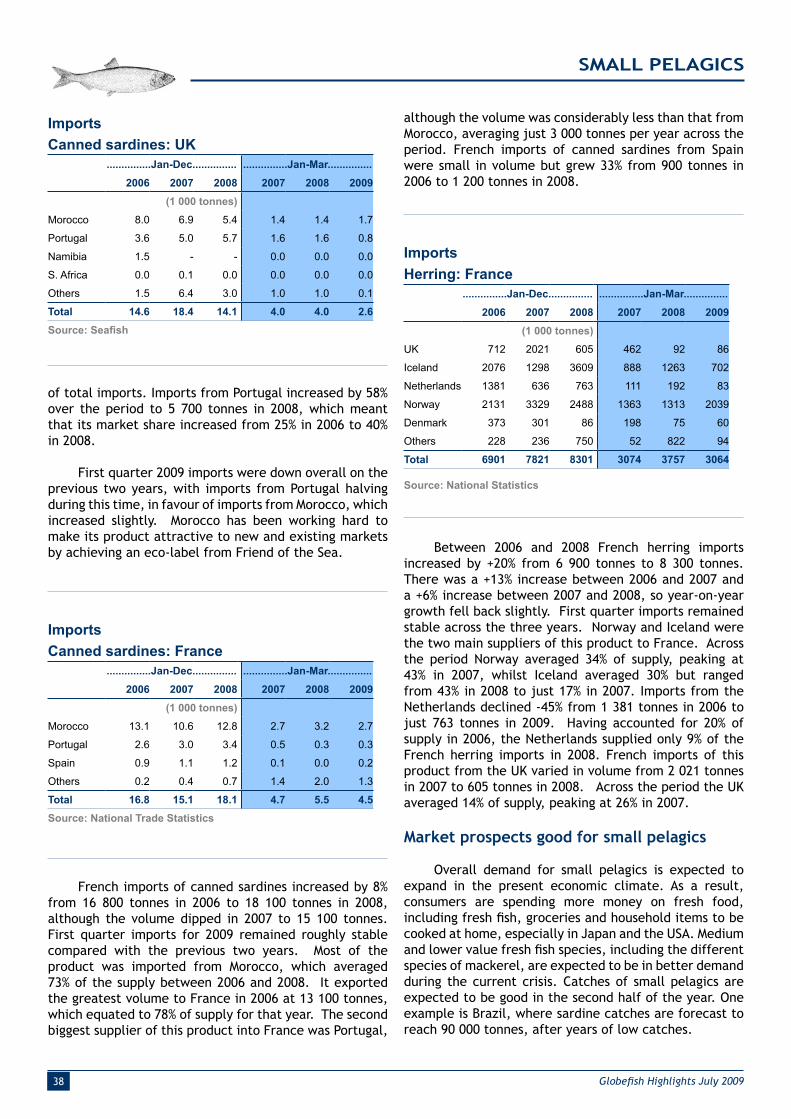
38 Globefi sh Highlights July 2009
SMALL PELAGICS
Imports
Canned sardines: UK
...............Jan-Dec............... ...............Jan-Mar...............
2006 2007 2008 2007 2008 2009
(1 000 tonnes)
Morocco 8.0 6.9 5.4 1.4 1.4 1.7
Portugal 3.6 5.0 5.7 1.6 1.6 0.8
Namibia 1.5 - - 0.0 0.0 0.0
S. Africa 0.0 0.1 0.0 0.0 0.0 0.0
Others 1.5 6.4 3.0 1.0 1.0 0.1
Total 14.6 18.4 14.1 4.0 4.0 2.6
Source: Seafi sh
of total imports. Imports from Portugal increased by 58%
over the period to 5 700 tonnes in 2008, which meant
that its market share increased from 25% in 2006 to 40%
in 2008.
First quarter 2009 imports were down overall on the
previous two years, with imports from Portugal halving
during this time, in favour of imports from Morocco, which
increased slightly. Morocco has been working hard to
make its product attractive to new and existing markets
by achieving an eco-label from Friend of the Sea.
Imports
Canned sardines: France
...............Jan-Dec............... ...............Jan-Mar...............
2006 2007 2008 2007 2008 2009
(1 000 tonnes)
Morocco 13.1 10.6 12.8 2.7 3.2 2.7
Portugal 2.6 3.0 3.4 0.5 0.3 0.3
Spain 0.9 1.1 1.2 0.1 0.0 0.2
Others 0.2 0.4 0.7 1.4 2.0 1.3
Total 16.8 15.1 18.1 4.7 5.5 4.5
Source: National Trade Statistics
although the volume was considerably less than that from
Morocco, averaging just 3 000 tonnes per year across the
period. French imports of canned sardines from Spain
were small in volume but grew 33% from 900 tonnes in
2006 to 1 200 tonnes in 2008.
Imports
Herring: France
...............Jan-Dec............... ...............Jan-Mar...............
2006 2007 2008 2007 2008 2009
(1 000 tonnes)
UK 712 2021 605 462 92 86
Iceland 2076 1298 3609 888 1263 702
Netherlands 1381 636 763 111 192 83
Norway 2131 3329 2488 1363 1313 2039
Denmark 373 301 86 198 75 60
Others 228 236 750 52 822 94
Total 6901 7821 8301 3074 3757 3064
Source: National Statistics
Between 2006 and 2008 French herring imports
increased by +20% from 6 900 tonnes to 8 300 tonnes.
There was a +13% increase between 2006 and 2007 and
a +6% increase between 2007 and 2008, so year-on-year
growth fell back slightly. First quarter imports remained
stable across the three years. Norway and Iceland were
the two main suppliers of this product to France. Across
the period Norway averaged 34% of supply, peaking at
43% in 2007, whilst Iceland averaged 30% but ranged
from 43% in 2008 to just 17% in 2007. Imports from the
Netherlands declined -45% from 1 381 tonnes in 2006 to
just 763 tonnes in 2009. Having accounted for 20% of
supply in 2006, the Netherlands supplied only 9% of the
French herring imports in 2008. French imports of this
product from the UK varied in volume from 2 021 tonnes
in 2007 to 605 tonnes in 2008. Across the period the UK
averaged 14% of supply, peaking at 26% in 2007.
Market prospects good for small pelagics
Overall demand for small pelagics is expected to
expand in the present economic climate. As a result,
consumers are spending more money on fresh food,
including fresh fi sh, groceries and household items to be
cooked at home, especially in Japan and the USA. Medium
and lower value fresh fi sh species, including the different
species of mackerel, are expected to be in better demand
during the current crisis. Catches of small pelagics are
expected to be good in the second half of the year. One
example is Brazil, where sardine catches are forecast to
reach 90 000 tonnes, after years of low catches.
French imports of canned sardines increased by 8%
from 16 800 tonnes in 2006 to 18 100 tonnes in 2008,
although the volume dipped in 2007 to 15 100 tonnes.
First quarter imports for 2009 remained roughly stable
compared with the previous two years. Most of the
product was imported from Morocco, which averaged
73% of the supply between 2006 and 2008. It exported
the greatest volume to France in 2006 at 13 100 tonnes,
which equated to 78% of supply for that year. The second
biggest supplier of this product into France was Portugal,
